Embed Size (px)
Citation preview
JOHN HESSCHAIRMAN OF THE BOARD CHIEF EXECUTIVE OFFICER
JOHN HESSCHAIRMAN OF THE BOARD CHIEF EXECUTIVE OFFICER

3
StrategyStrategy
CORPORATE
• Grow the company long term through Exploration and Production• Operate Marketing and Refining for near term returns and cash flow
EXPLORATION AND PRODUCTION
• Build a global franchise• Create value through exploration, developments and technology
MARKETING AND REFINING
• Expand Hess brand in Retail and Energy Marketing on East Coast• Maximize free cash flow from refining assets
FINANCE
• Ensure capital availability to fund growth• Deliver first quartile financial and shareholder returns

4
SpeakersSpeakers
NameName TitleTitleJoinedHess
JoinedHess
John O’ConnorJohn O’Connor President, Worldwide E&PPresident, Worldwide E&P 20012001
George SandisonGeorge Sandison SVP, ProductionSVP, Production 20012001
Keith HunterKeith Hunter SVP, Major ProjectsSVP, Major Projects 20042004
Bob StrodeBob Strode SVP, Exploration & New VenturesSVP, Exploration & New Ventures 20002000
Borden WalkerBorden Walker President, Marketing & RefiningPresident, Marketing & Refining 19961996
John RiellyJohn Rielly SVP, Chief Financial OfficerSVP, Chief Financial Officer 20012001
Jay WilsonJay Wilson VP, Investor RelationsVP, Investor Relations 20032003

JOHN O’CONNORPRESIDENT
WORLDWIDE E&P
JOHN O’CONNORPRESIDENT
WORLDWIDE E&P

6
E&P Vision in 2002E&P Vision in 2002
Build a global franchise that delivers sustainable growthBuild a global franchise that delivers sustainable growth

7
Goals
Grow Production by 3-5% p.a.
Grow Reserves by 5-8% p.a.
Goals
Grow Production by 3-5% p.a.
Grow Reserves by 5-8% p.a.
Strategy
Exit short-life assets
Acquire interests in long-life properties
Extract more value from core fields
Build an impactful exploration program
Apply innovative technologies
Strategy
Exit short-life assets
Acquire interests in long-life properties
Extract more value from core fields
Build an impactful exploration program
Apply innovative technologies
E&P GoalsE&P Goals and Strategyand Strategy

8
2002 – 2005: Actions Taken2002 – 2005: Actions Taken
Recruited top talent
Instituted a disciplined investment process
Actively high-graded portfolio
Sanctioned 10 profitable new projects
Built attractive exploration program
Recruited top talent
Instituted a disciplined investment process
Actively high-graded portfolio
Sanctioned 10 profitable new projects
Built attractive exploration program

9
Recruited Top TalentRecruited Top Talent
Implemented a global functional organization
Leveraged best practices and technology
Hired top tier industry talent
80% of top 100 E&P leaders new to Hess since 2002
Implemented a global functional organization
Leveraged best practices and technology
Hired top tier industry talent
80% of top 100 E&P leaders new to Hess since 2002
10
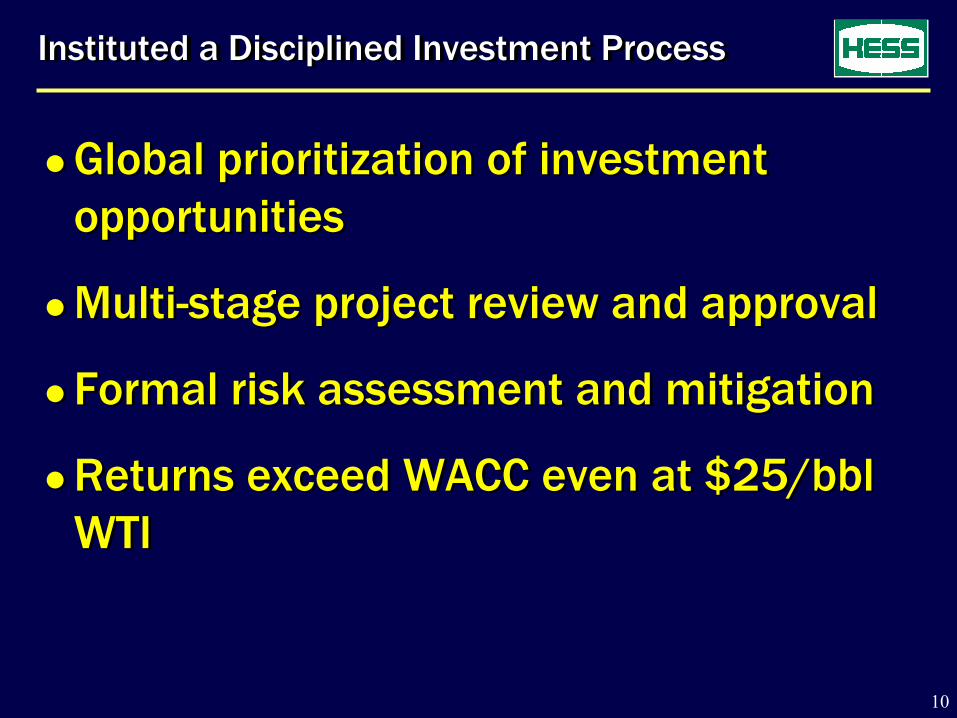
Instituted a Disciplined Investment ProcessInstituted a Disciplined Investment Process
Global prioritization of investment opportunities
Multi-stage project review and approval
Formal risk assessment and mitigation
Returns exceed WACC even at $25/bbl WTI
Global prioritization of investment opportunities
Multi-stage project review and approval
Formal risk assessment and mitigation
Returns exceed WACC even at $25/bbl WTI

11
Actively High-Graded PortfolioActively High-Graded Portfolio
6
8
10
02 03 04 05
Reserve Life (Years)
Reserve Life (Years)
ACQUIRED
JDAPangkah
LlanoWest Med
LibyaRussia
ACQUIRED
JDAPangkah
LlanoWest Med
LibyaRussia
DISPOSED
ColombiaHudsonScott
PermianGOM ShelfMont / Arb
Jabung
DISPOSED
ColombiaHudsonScott
PermianGOM ShelfMont / Arb
Jabung
12
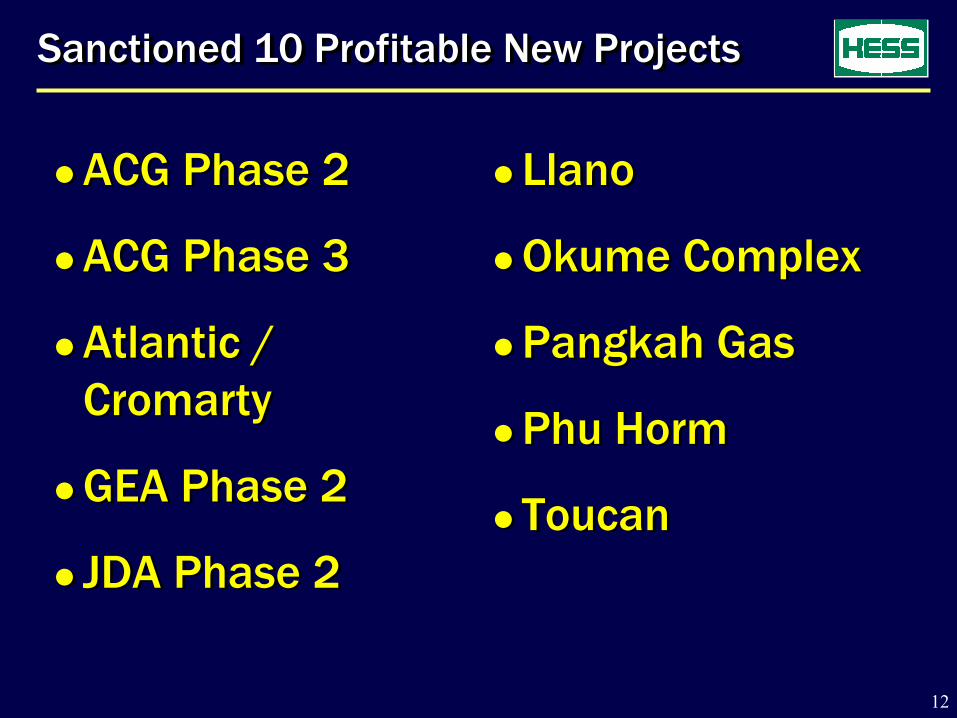
Sanctioned 10 Profitable New ProjectsSanctioned 10 Profitable New Projects
ACG Phase 2
ACG Phase 3
Atlantic / Cromarty
GEA Phase 2
JDA Phase 2
ACG Phase 2
ACG Phase 3
Atlantic / Cromarty
GEA Phase 2
JDA Phase 2
Llano
Okume Complex
Pangkah Gas
Phu Horm
Toucan
Llano
Okume Complex
Pangkah Gas
Phu Horm
Toucan
13
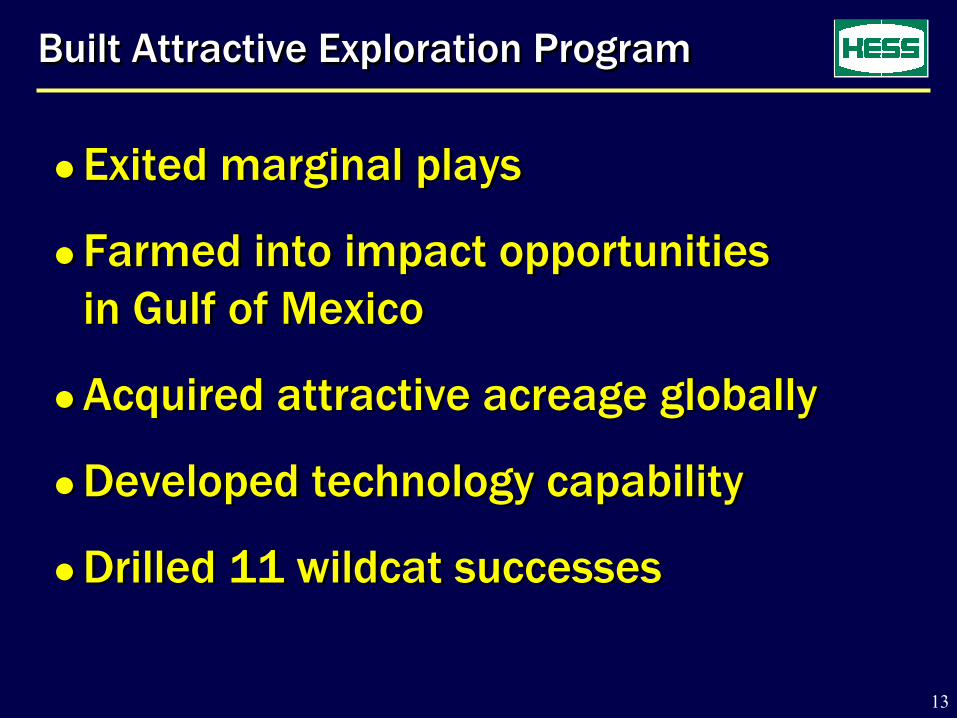
Built Attractive Exploration ProgramBuilt Attractive Exploration Program
Exited marginal plays
Farmed into impact opportunities in Gulf of Mexico
Acquired attractive acreage globally
Developed technology capability
Drilled 11 wildcat successes
Exited marginal plays
Farmed into impact opportunities in Gulf of Mexico
Acquired attractive acreage globally
Developed technology capability
Drilled 11 wildcat successes
14
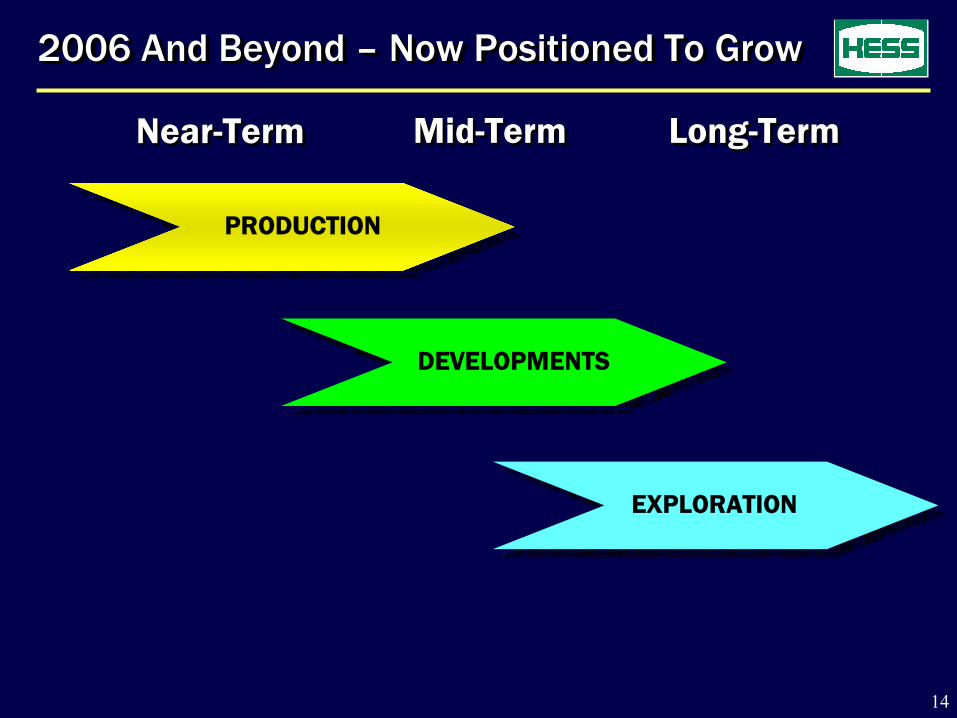
2006 And Beyond – Now Positioned To Grow2006 And Beyond – Now Positioned To Grow
EXPLORATION
Long-TermLong-TermNear-TermNear-Term
PRODUCTION
Mid-TermMid-Term
DEVELOPMENTS

GEORGE SANDISONSENIOR VICE PRESIDENT
PRODUCTION
GEORGE SANDISONSENIOR VICE PRESIDENT
PRODUCTION

16
Global Production Portfolio
UNITED STATES ALGERIA
UNITED KINGDOM
LIBYA
RUSSIA
EQUATORIAL GUINEA
GABON
THAILAND
INDONESIA
MALAYSIA
NORWAYDENMARK
AZERBAIJAN

17
Production BaseProduction Base
0
100
200
300
400
05 06 07 08 09 10
MBOED (Net)MBOED (Net)
2004 Producing Assets2004 Producing Assets
2005 Start-Ups2005 Start-UpsLibyaLibya
Excludes divestitures 05-06
3%
– Modest Decline– Modest Decline

18
Competitive Costs and Margins - 2005Competitive Costs and Margins - 2005
0 10 20
NXY
PCZ
OXY
APA
TLM
MRO
APC
WPL
MUR
NHY
BG
Production Costs $ / BOEProduction Costs $ / BOE
HES
0 10 20
NHY
NXY
BG
TLM
WPL
PCZ
MRO
APA
MUR
APC
OXY
HES
A-Tax Net Margin $ / BOEA-Tax Net Margin $ / BOE
Source: Company FilingsSource: Company Filings Adjusted for A-Tax effects of hedgingAdjusted for A-Tax effects of hedging

19
Producing Asset BaseProducing Asset Base
0
100
200
300
400
05 06 07 08 09 10
Europe
USA
Asia
Africa
Excludes divestitures 05-06
MBOED (Net)MBOED (Net)

20
AsiaAsia
Long-life assets
Substantial growth
$6 / BOE production costs 1Q06
Highly attractive economics
Long-life assets
Substantial growth
$6 / BOE production costs 1Q06
Highly attractive economics
JDAJDA
Phu Horm
PailinPailin
Natuna ANatuna A
PangkahPangkah
JambiMerang

21
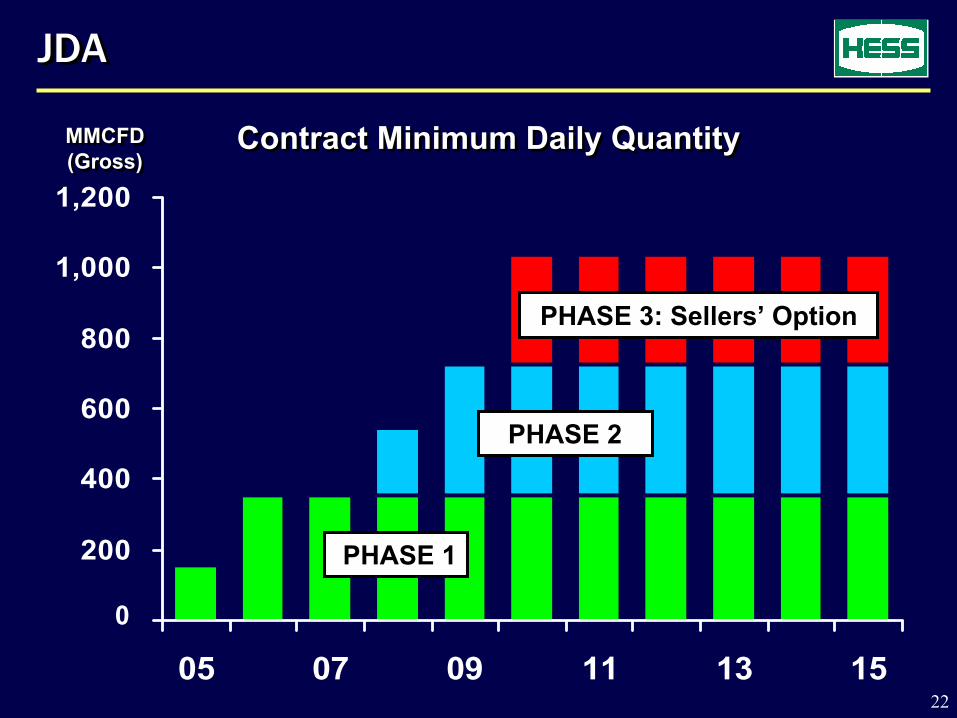
JDAJDA
120 MMSCFD net production in 2006
10 discovered fields
Largest reserve holding in portfolio
PSC through 2029
Attractive economics
120 MMSCFD net production in 2006
10 discovered fields
Largest reserve holding in portfolio
PSC through 2029
Attractive economicsBUMIEAST
BULAN
Current production fromCakerawala only
SURIYA
BUMI
10 km
CAKERAWALA
Block A-18
22
JDAJDA
-
200
400
600
800
1,000
1,200
05 07 09 11 13 15
MMCFD(Gross)MMCFD(Gross)
PHASE 1
PHASE 2
PHASE 3: Sellers’ Option
Contract Minimum Daily QuantityContract Minimum Daily Quantity
0
23
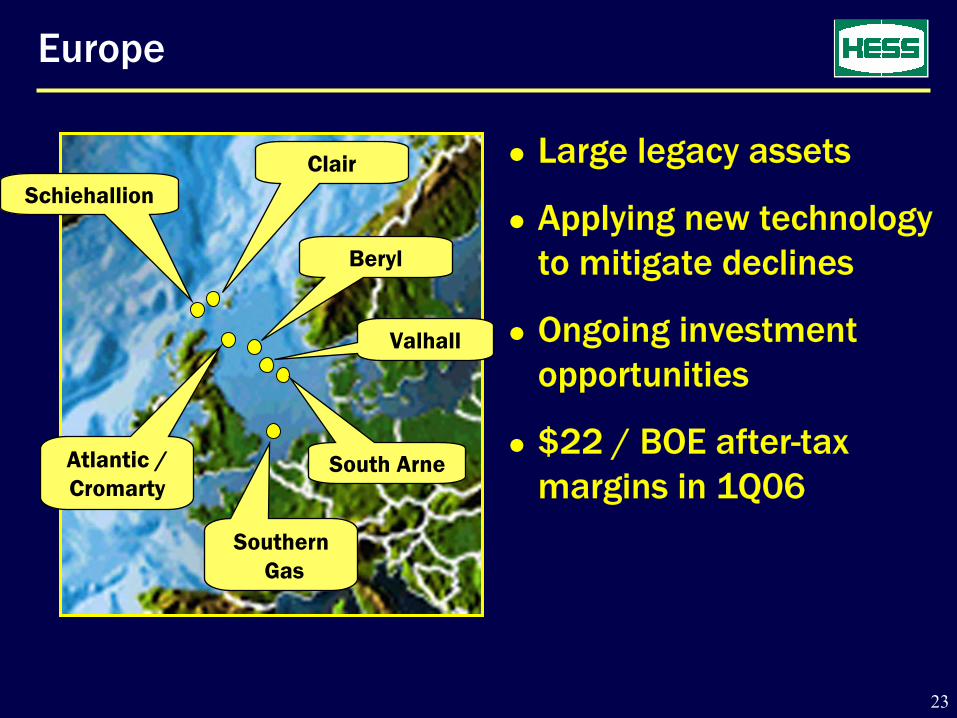
Europe
Large legacy assets
Applying new technology to mitigate declines
Ongoing investment opportunities
$22 / BOE after-tax margins in 1Q06
SouthernGas
Atlantic /Cromarty
Beryl
Valhall
South Arne
ClairSchiehallion

24
ValhallValhall
0
20
40
06 07 08 09 10
28 MBOED net production
40+ years remaining field life
Technology enables growth
Multi-year drilling program
28 MBOED net production
40+ years remaining field life
Technology enables growth
Multi-year drilling program
Base
WaterfloodPotential
MBOED (Net)MBOED (Net)
25
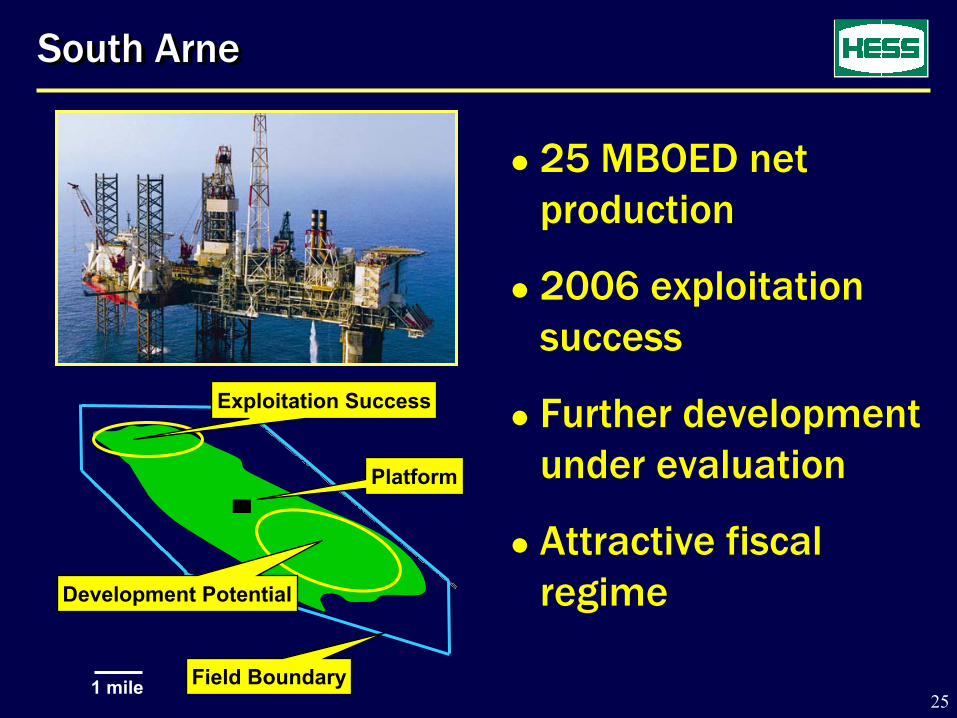
South ArneSouth Arne
25 MBOED net production
2006 exploitation success
Further development under evaluation
Attractive fiscal regime
25 MBOED net production
2006 exploitation success
Further development under evaluation
Attractive fiscal regime
1 mile
Development Potential
Platform
Exploitation Success
Field Boundary

26
Beryl
Nevis
TayTayNess
Linnhe
Katrine
Beryl AreaBeryl Area
20 MBOED net production
Multiple fields
Long-life asset
Successful ongoing exploitation
Attractive returns
20 MBOED net production
Multiple fields
Long-life asset
Successful ongoing exploitation
Attractive returns

27
Atlantic / Cromarty
120 MMSCFD net plateau
First gas May 2006
Short-life, but highly profitableATLANTIC
CROMARTY
St FERGUSTERMINAL
GOLDENEYE

28
Russia
16 MBOED net production
Investment to date of $400 MM
Active drilling program
Phased development
RUSSIARUSSIA
25 miles
Licenses
SamaraVOLGARIVER

29
Positioned in large assets
$7.50 / BOE 1Q06 production costs
Substantial near-term growth
Positioned in large assets
$7.50 / BOE 1Q06 production costs
Substantial near-term growth
AfricaAfrica
Toucan
GEA
Ceiba
EgyptLibyaAlgeria
GabonGabonE.G.E.G.
Waha
30
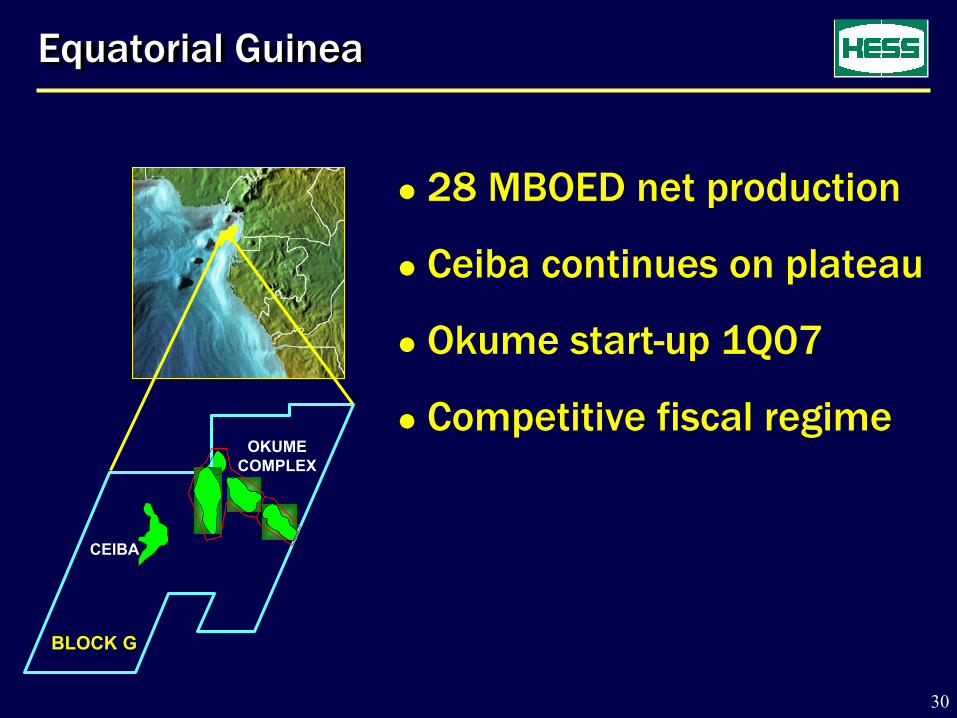
Equatorial Guinea Equatorial Guinea
28 MBOED net production
Ceiba continues on plateau
Okume start-up 1Q07
Competitive fiscal regime
28 MBOED net production
Ceiba continues on plateau
Okume start-up 1Q07
Competitive fiscal regime
BLOCK G
OKUME COMPLEX
CEIBA
31
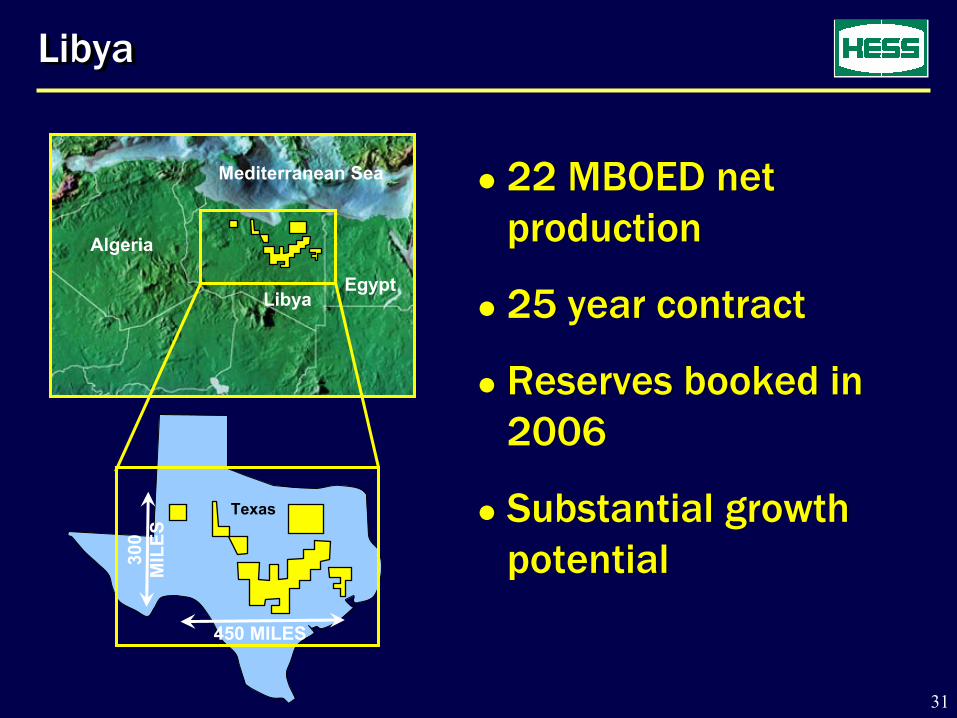
LibyaLibya
22 MBOED net production
25 year contract
Reserves booked in 2006
Substantial growth potential
22 MBOED net production
25 year contract
Reserves booked in 2006
Substantial growth potential
LibyaEgypt
Algeria
Mediterranean Sea
450 MILES
Texas
300
MIL
ES

32
United StatesUnited States
Technology driving sustainability
20% of total Hess production
Moderate declines onshore
$24 / BOE after tax margins in 1Q06
Technology driving sustainability
20% of total Hess production
Moderate declines onshore
$24 / BOE after tax margins in 1Q06
Williston Basin
PermianBasin
Deepwater

33
US DeepwaterUS Deepwater
35 MBOED net production
Active drilling program
$2 / BOE operating costs
Outstanding economics
35 MBOED net production
Active drilling program
$2 / BOE operating costs
Outstanding economics
Louisiana
Garden Banks
PENNSTATE
BALDPATE
LLANO
NORTHWESTERN
CONGER
TULANE

34
Williston BasinWilliston Basin
20 MBOED net; stable production for last 25 years
180,000 acres in Bakken play where technology is key
Evaluating deep gas potential
20 MBOED net; stable production for last 25 years
180,000 acres in Bakken play where technology is key
Evaluating deep gas potential
NEW HESS LEASES
NESSONANTICLINE
EXISTING HESS
LEASES

35
Production Portfolio - SummaryProduction Portfolio - Summary
Material positions in high quality legacy assets
Competitive costs and margins
Moderate decline in production base
Substantial resource base
Development projects drive growth
Material positions in high quality legacy assets
Competitive costs and margins
Moderate decline in production base
Substantial resource base
Development projects drive growth

KEITH HUNTERSENIOR VICE PRESIDENT
MAJOR PROJECTS

37
BMS
PANGKAH
ACG
ATLANTIC/CROMARTY
PHU HORM
OKUME COMPLEX
SHENZI
JDA PHASE 2
WEST MED
Global Developments
SNØHVIT
JAMBI MERANG
PERMIAN EOR
VALHALL REDEV

38
2006 – 2007Atlantic/Cromarty Okume Complex
Phu HormPangkah Gas
SnøhvitACG Phase 2
Strong Slate Of DevelopmentsStrong Slate Of Developments
AppraisalConstruction
2008 - 2009JDA Phase 2ACG Phase 3
ShenziPangkah Oil
Permian EORJambi Merang
West Med Phase 1BMS
2010+Valhall RedevClair Ridge
T BellsSitucheBelud
Bakken
Engineering
39
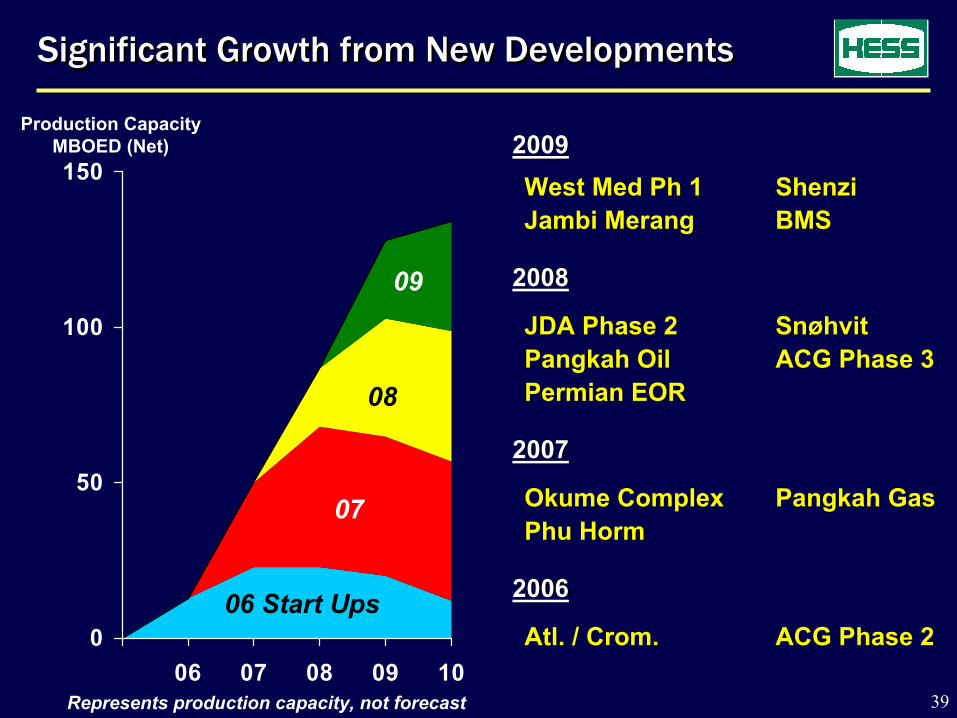
Significant Growth from New DevelopmentsSignificant Growth from New Developments
0
50
100
150
06 07 08 09 10
2009West Med Ph 1 ShenziJambi Merang BMS
2008
JDA Phase 2 SnøhvitPangkah Oil ACG Phase 3Permian EOR
2007
Okume Complex Pangkah Gas Phu Horm
2006
Atl. / Crom. ACG Phase 2
2009West Med Ph 1 ShenziJambi Merang BMS
2008
JDA Phase 2 SnøhvitPangkah Oil ACG Phase 3Permian EOR
2007
Okume Complex Pangkah Gas Phu Horm
2006
Atl. / Crom. ACG Phase 2
Production CapacityMBOED (Net)
06 Start Ups
07
08
09
Represents production capacity, not forecast

40
0 10 20 30 40
NXY
MUR
TLM
PCZ
WPL
APC
NHY
APA
OXY
BG
MRO
FD&A Costs Now Competitive
2000 - 2002 2003 - 2005
0 10
WPL*
MRO
NXY
APC
MUR
TLM
APA
PCZ
OXY
BG
NHY
*WPL is 2001-2003 average
HES
Source: Company Filings
$/BOE
HES

41
Okume Complex
85% WI, Hess operator
$1Bn net investment
125 - 150 MMBOE net resources
First oil in 1Q07
40 MBOED net peak production
85% WI, Hess operator
$1Bn net investment
125 - 150 MMBOE net resources
First oil in 1Q07
40 MBOED net peak production
Okume TLP

42
Okume Complex
Central Processing
Facility
Central Processing
Facility
Satellite 1Satellite 1
Satellite 2Satellite 2
Satellite 3Satellite 3Sendje Ceiba
FPSOSendje Ceiba
FPSO
OkumeMini-TLPOkume
Mini-TLPOveng
Mini-TLPOveng
Mini-TLP
ElonElon
• 43 WELLS (26 Prod, 17 Injection)• 60 MBOED Capacity• 135 MBOED Water Injection• 15 MMSCFD Gas Injection• Full Field Gas Lift

43
Okume: On Time, On Budget
Drilling
Commissioning
Start-Up
Installation
Construction
4Q2Q 3Q 1Q1Q
2006 2007

44
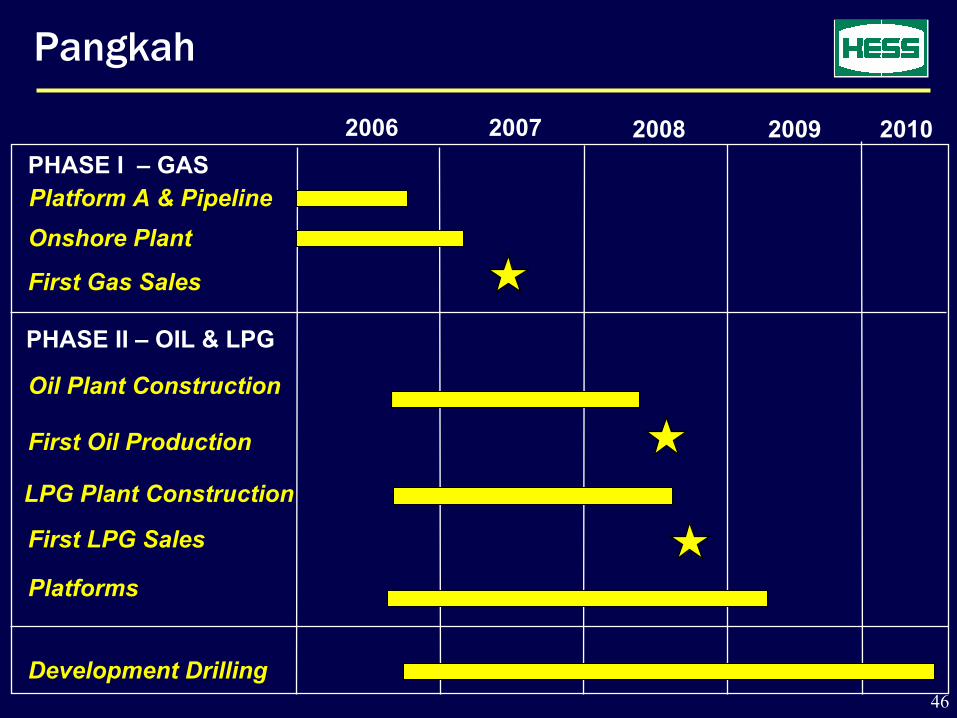
Pangkah
75% WI, Hess operator
$650 MM net investment
80 - 120 MMBOE net resources
First gas in 1H07
First oil in 2H08
20 MBOED net peak production
75% WI, Hess operator
$650 MM net investment
80 - 120 MMBOE net resources
First gas in 1H07
First oil in 2H08
20 MBOED net peak production
PangkahPangkah

45
Liquid StorageLiquid Storage
Central Platform
OPFGas SalesGas Sales
Pangkah
Phase 1 Gas8 Wells150 MMSCFD GasPhase 2 Liquids26 Wells6 MBLPD LPG 25 MBOPD Oil
Phase 1 Gas8 Wells150 MMSCFD GasPhase 2 Liquids26 Wells6 MBLPD LPG 25 MBOPD Oil
East Java
46
2006 2007 2008 2009 2010PHASE I – GASPlatform A & PipelineOnshore Plant
First Gas Sales
PHASE II – OIL & LPG
Oil Plant Construction
First Oil Production
LPG Plant Construction
First LPG Sales
Platforms
Development Drilling
Pangkah

47
Shenzi
28% WI
$1 Bn net investment
100-150 MMBOE net resources
First oil in 2H09
25 MBOED net peak production
28% WI
$1 Bn net investment
100-150 MMBOE net resources
First oil in 2H09
25 MBOED net peak productionTahiti
Mad DogAtlantis
K2 Area
Puma
Tonga
Neptune
Knotty Head
Miocene Foldbelt
Miocene Fields
Green Canyon Area Shenzi

48
Shenzi
TLP Design
15 subseaproduction wells
100 MBOPD
50-80 MMCFD gas lift
130 MBWD water injection capacity
TLP Design
15 subseaproduction wells
100 MBOPD
50-80 MMCFD gas lift
130 MBWD water injection capacity
49
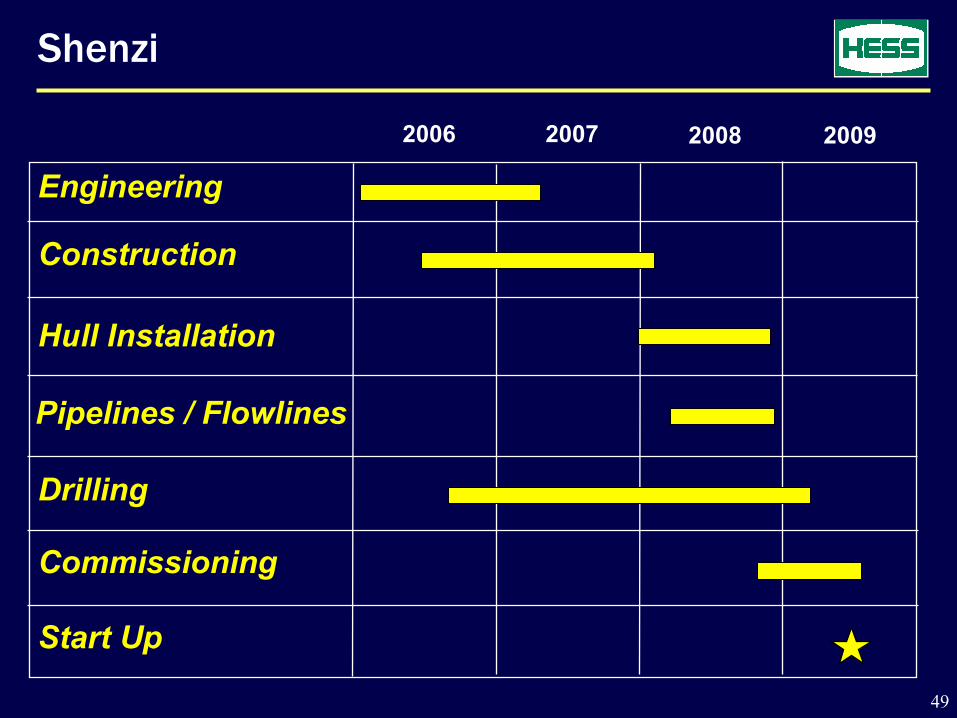
Shenzi
2006 2007 2008 2009
Engineering
Construction
Hull Installation
Pipelines / Flowlines
Drilling
Commissioning
Start Up
50
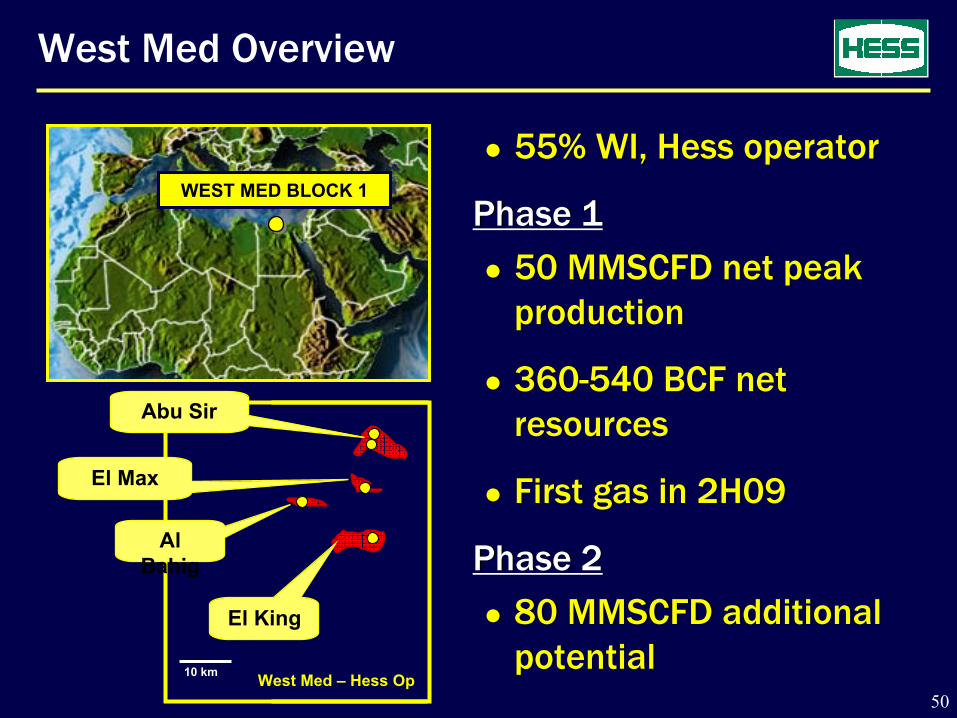
West Med Overview
55% WI, Hess operator
Phase 1
50 MMSCFD net peak production
360-540 BCF net resources
First gas in 2H09
Phase 2
80 MMSCFD additional potential
55% WI, Hess operator
Phase 1
50 MMSCFD net peak production
360-540 BCF net resources
First gas in 2H09
Phase 2
80 MMSCFD additional potential
WEST MED BLOCK 1
10 km West Med – Hess Op
Abu Sir
El Max
Al Bahig
El King

51
West Med
Development of 4 existing fields
3,000’- 4,000’ water depth
6-10 subsea wells
Domestic sales secured
Development plan being finalized
Development of 4 existing fields
3,000’- 4,000’ water depth
6-10 subsea wells
Domestic sales secured
Development plan being finalized
Abu QirGas Plant
Egypt LNG Plant
Abu Sir
El KingAl Bahig
El Max
52
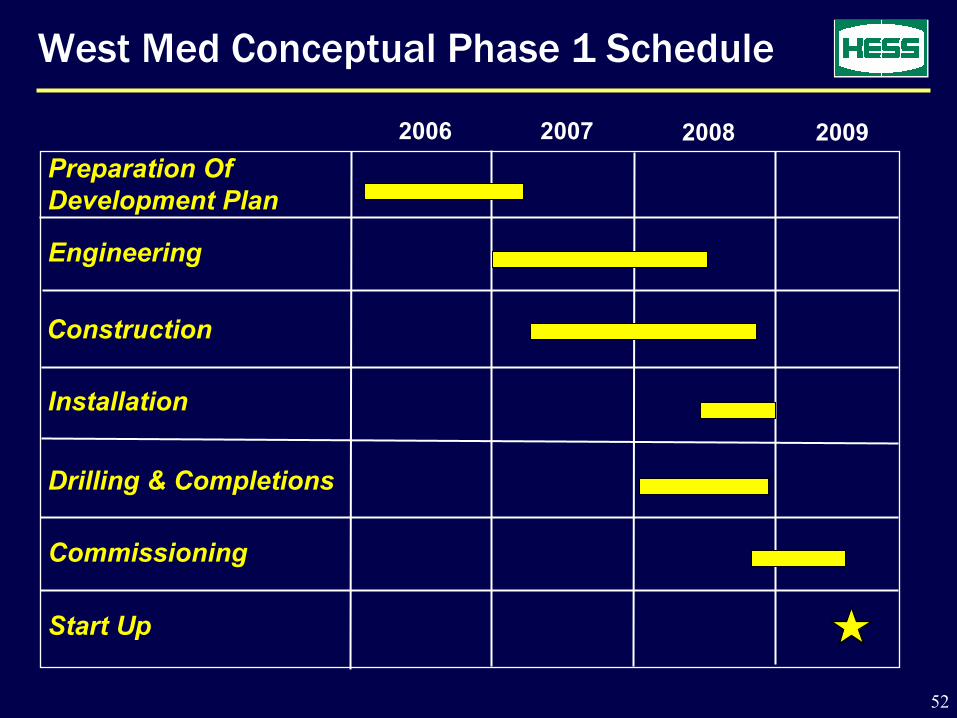
West Med Conceptual Phase 1 Schedule
2006 2007 2008 2009Preparation Of Development Plan
Engineering
Installation
Drilling & Completions
Commissioning
Start Up
Construction

53
Balanced Portfolio of Developments
Hess OperatedBMS
Okume Complex
Pangkah Gas
Pangkah Oil
Permian EOR
Phu Horm
West Med
Hess OperatedBMS
Okume Complex
Pangkah Gas
Pangkah Oil
Permian EOR
Phu Horm
West Med
Outside Operated ACG Phase 2
ACG Phase 3
Atlantic / Cromarty
JDA Phase 2
Jambi Merang
Shenzi
Snøhvit
Valhall Redev
Outside Operated ACG Phase 2
ACG Phase 3
Atlantic / Cromarty
JDA Phase 2
Jambi Merang
Shenzi
Snøhvit
Valhall Redev
54
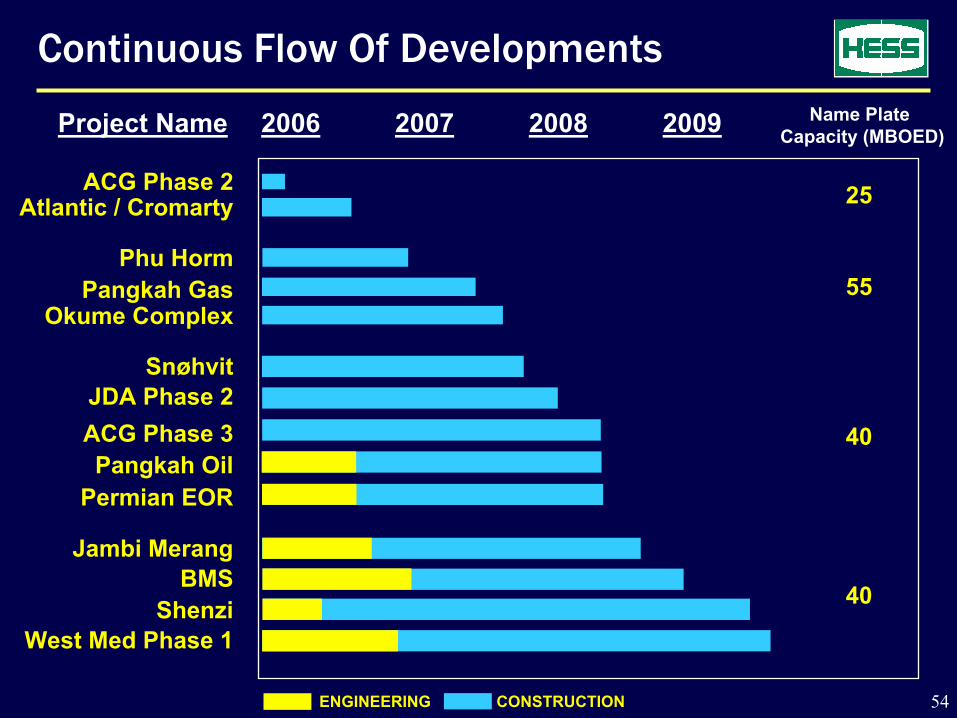
Continuous Flow Of Developments
CONSTRUCTIONENGINEERING
Name Plate Capacity (MBOED)Project Name 2006 2007 2008 2009
ACG Phase 2Atlantic / Cromarty
Phu HormPangkah Gas
Okume Complex
JDA Phase 2ACG Phase 3Pangkah Oil
Snøhvit
Permian EOR
Jambi MerangBMS
ShenziWest Med Phase 1
25
55
40
40
55
Major Projects: Summary
Strong slate of developments
World class project teams assembled
Hess operated projects on time and on budget
Building global execution capability
Exploration success feeds future developments
Strong slate of developments
World class project teams assembled
Hess operated projects on time and on budget
Building global execution capability
Exploration success feeds future developments

BOB STRODESENIOR VICE PRESIDENT
EXPLORATION AND NEW VENTURES

57
RECON ACREAGE PORTFOLIO DRILLING RESULTS
Exploration Strategy
Add resources and create value
Drill 8 – 10 impact wells per year
Apply leading-edge technology
Add resources and create value
Drill 8 – 10 impact wells per year
Apply leading-edge technology

58
Exploration Results: 2002 - 2005
11 wildcat successes
Discovered >400 MMBOE net resources
Created >$2 Bn value at $50/bbl WTI
Added 7.5 million net acres to portfolio
11 wildcat successes
Discovered >400 MMBOE net resources
Created >$2 Bn value at $50/bbl WTI
Added 7.5 million net acres to portfolio

59
-2 0 2 4
BG
TLM
OXY
NHY
MRO
KMG
WPL
NXY
APC
MUR
APA
Industry Value Creation
1999 - 2001 2002 - 2004
-2 0 2 4 6
MRO
APC
NHY
MUR
OXY
APA
TLM
NXY
WPL
BG
KMG
Source: Wood Mackenzie – Exploration Strategy & Performance ~ $ 40/bbl in real 2005 terms
$ Bn $ Bn
HES
HES

60
0
5
10
15
20
25
02 03 04 05
World Class Geoscience Capability
Global expertise in petroleum system basin modeling
Proprietary seismic imaging
Significant increase in 3D seismic processing output
Global expertise in petroleum system basin modeling
Proprietary seismic imaging
Significant increase in 3D seismic processing output
Processing Output (Thousands of 3D Sq. Km)

61
Wave Equation 3D Migration – Recent Technology
Technology Example – Seismic Imaging
Base Salt?
Salt Edge?
Salt Edge?
Data shown courtesyof CGG
Data shown courtesyof CGG
62
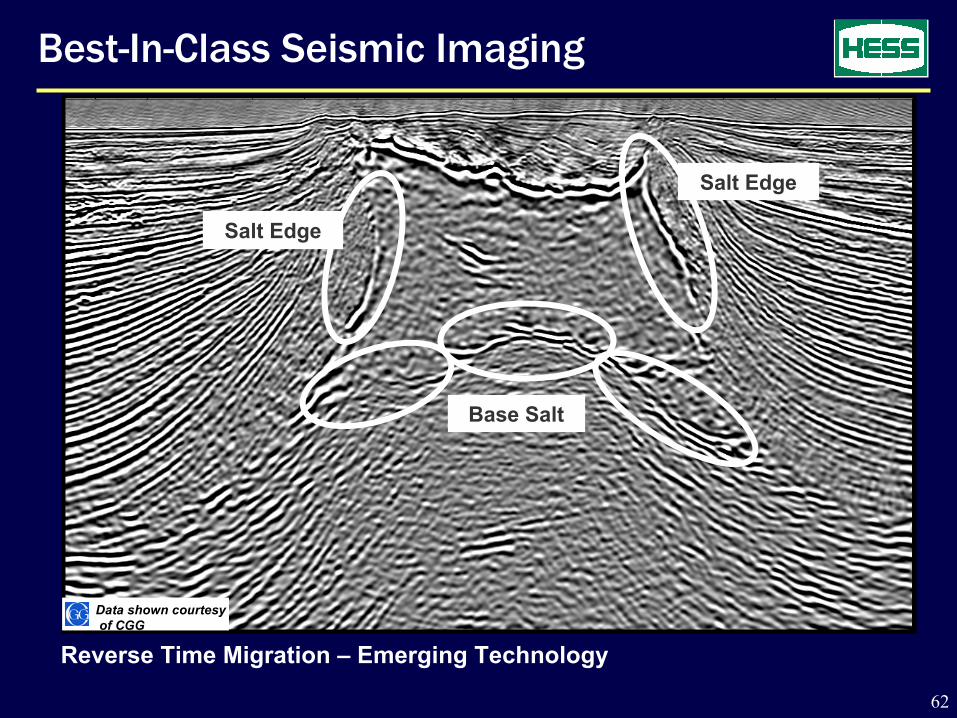
Reverse Time Migration – Emerging Technology
Best-In-Class Seismic Imaging
Salt Edge
Salt Edge
Base Salt
Data shown courtesyof CGG
Data shown courtesyof CGG

63
GOM Exploration Strategy
Major petroleum system
Material acreage position
50 named prospects
Deepwater rigs under contract
• Ocean Baroness thru Nov 09
• Noble Max Smith thru May 08
Major petroleum system
Material acreage position
50 named prospects
Deepwater rigs under contract
• Ocean Baroness thru Nov 09
• Noble Max Smith thru May 08
0.0
0.5
1.0
1.5
02 03 04 05 06
Total Net Acres(Million)
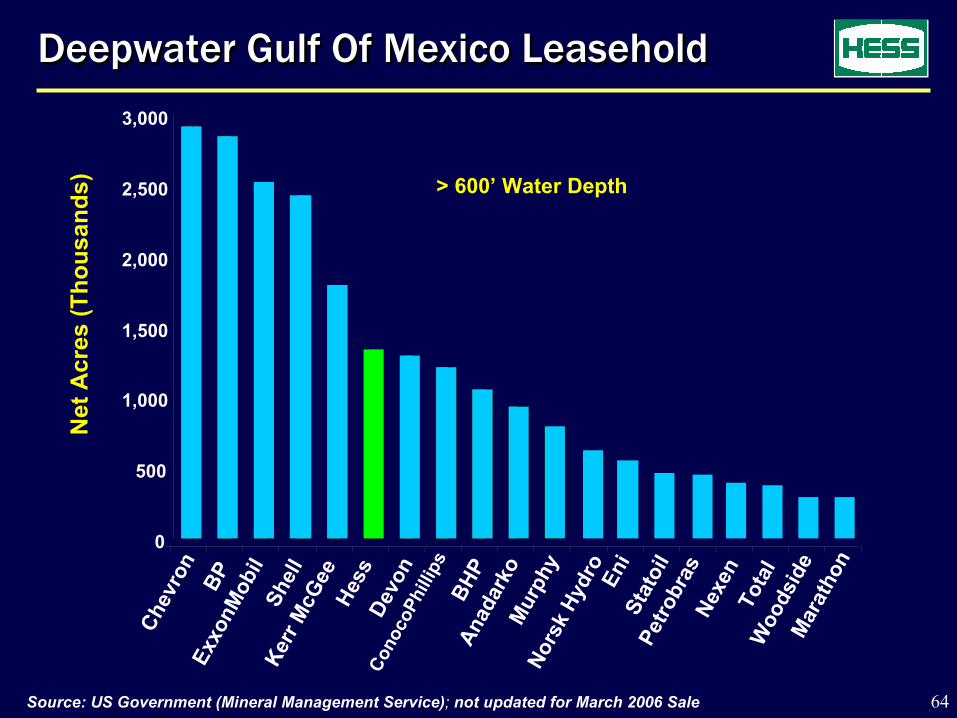
64Source: US Government (Mineral Management Service); not updated for March 2006 Sale
Deepwater Gulf Of Mexico LeaseholdDeepwater Gulf Of Mexico Leasehold
> 600’ Water Depth
0
500
1,000
1,500
2,000
2,500
3,000Ch
evro
nBP
Ex
xonM
obil
Shel
lKe
rr M
cGee
Hess
Devo
nCo
noco
Phill
ips
BHP
Anad
arko
Mur
phy
Nors
kHy
dro
Eni
Stat
oil
Petro
bras
Nexe
nTo
tal
Woo
dsid
eM
arat
hon
Net
Acr
es (T
hous
ands
)
65
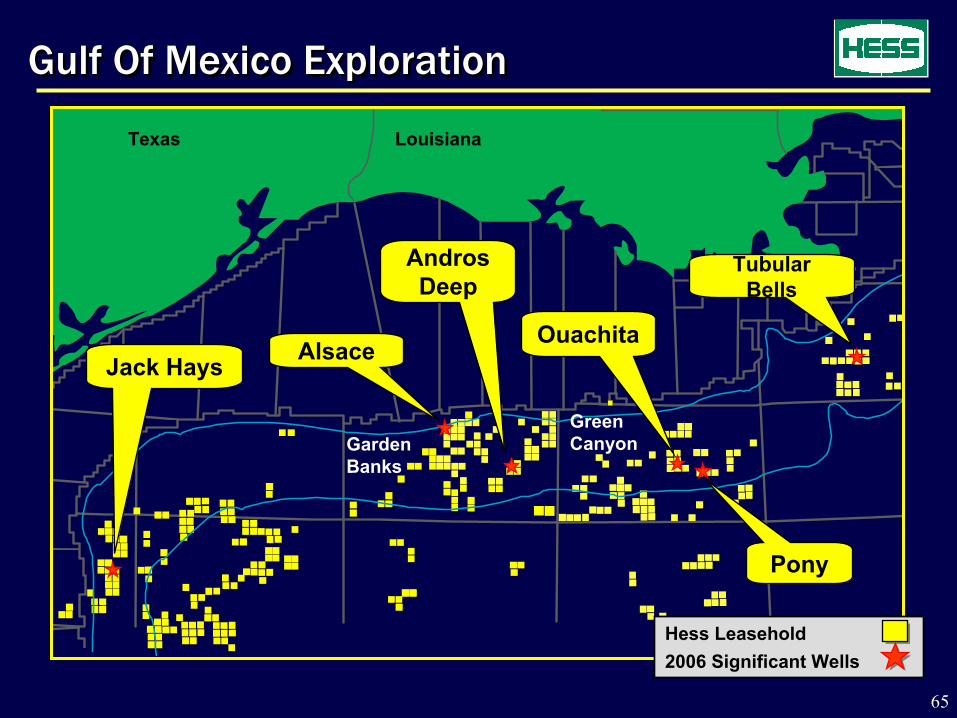
Gulf Of Mexico ExplorationGulf Of Mexico Exploration
Hess Leasehold2006 Significant Wells
Texas Louisiana
Garden Banks
Green Canyon
Jack Hays Alsace
AndrosDeep
Ouachita
Pony
Tubular Bells

66
Regional View – Miocene FoldbeltRegional View – Miocene Foldbelt
Tahiti
Mad DogPuma
Knotty Head
Miocene FoldbeltSeismic Line
15 Miles
A
B
Hess Leasehold2006 Key WellsMiocene Fields
Shenzi
Atlantis
Pony
Vancouver
Ouachita
Data shown courtesyof CGG
Data shown courtesyof CGG

67
Hess Prospects on TrendHess Prospects on Trend
Pony Knotty Head TahitiOuachitaVancouver
SaltSaltSaltSalt
SaltSalt
CretaceousCretaceous
Lower MioceneLower MioceneMiddle MioceneMiddle Miocene
Two significant discoveries (Tahiti and Knotty Head) on trend with three Hess prospects
AA BB
Data shown courtesyof CGG
Data shown courtesyof CGG
68
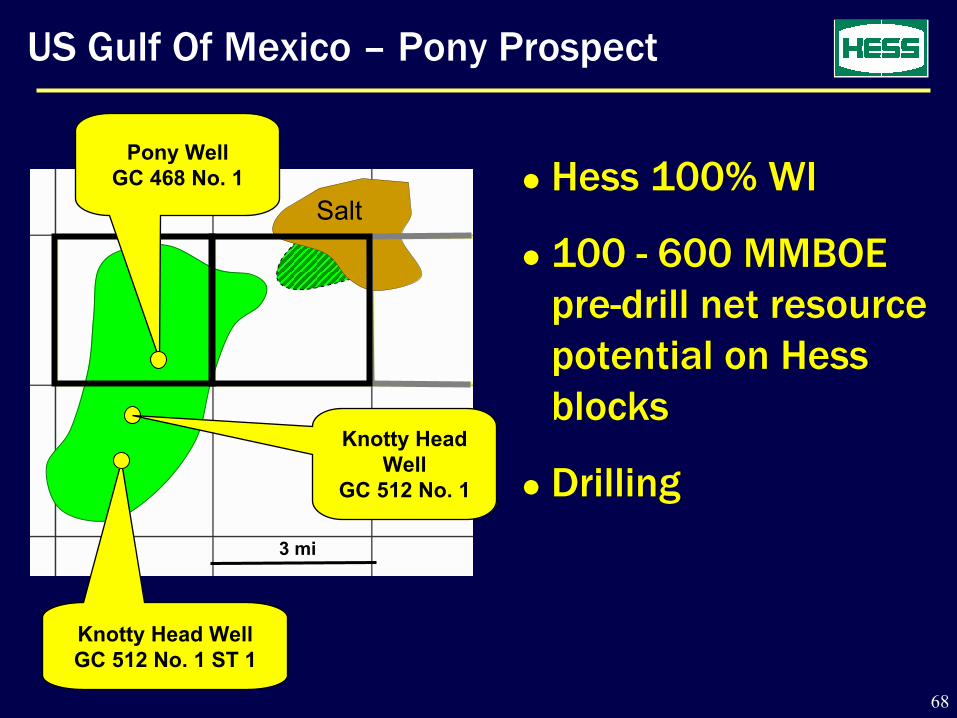
US Gulf Of Mexico – Pony Prospect
Hess 100% WI
100 - 600 MMBOE pre-drill net resource potential on Hess blocks
Drilling
Hess 100% WI
100 - 600 MMBOE pre-drill net resource potential on Hess blocks
Drilling
Salt
3 mi
Knotty Head WellGC 512 No. 1 ST 1
Pony WellGC 468 No. 1
Knotty Head Well
GC 512 No. 1

69
US Gulf Of Mexico – Ouachita Prospect
• Hess 66.6% WI
• 100 – 400 MMBOEpre-drill gross resource potential
•Middle & Lower Miocene objectives
• Drilling
OuachitaGC 376 No. 1
3 miles
Salt
70
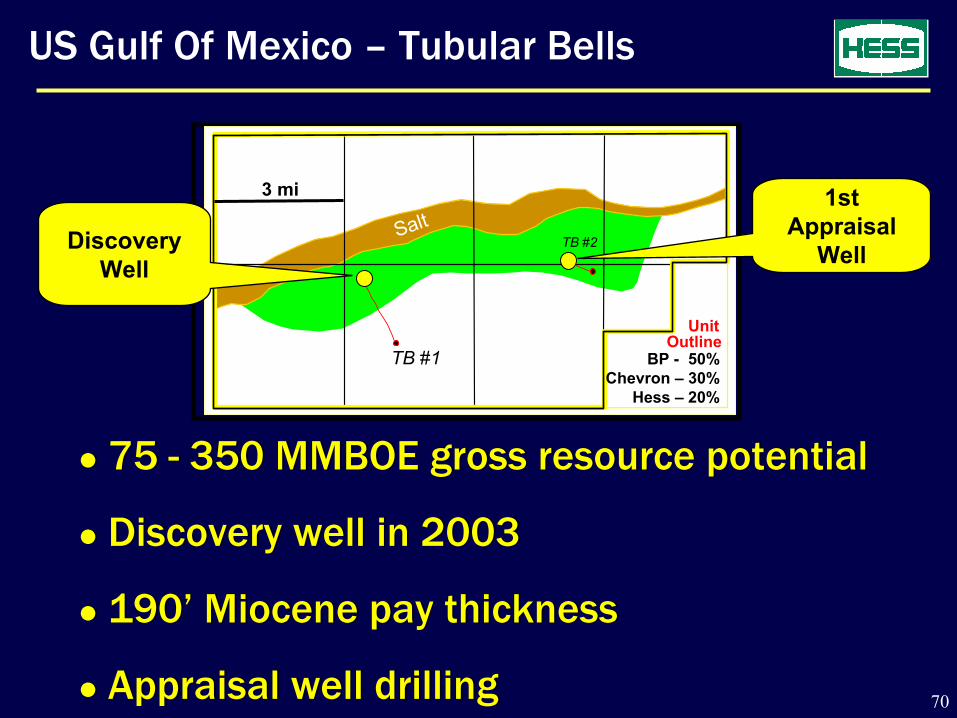
US Gulf Of Mexico – Tubular Bells
75 - 350 MMBOE gross resource potential
Discovery well in 2003
190’ Miocene pay thickness
Appraisal well drilling
75 - 350 MMBOE gross resource potential
Discovery well in 2003
190’ Miocene pay thickness
Appraisal well drilling
3 Miles3 MilesBP - 50%
Chevron – 30%Hess – 20%
TB #1 MC 727 #1
Salt
Discovery Well
Discovery Well
1st Appraisal WellSpudded April 2006
1st Appraisal WellSpudded April 2006
UnitOutline
MC 725MC 724 MC 726 MC 727
MC 682 MC 683MC 681MC 680
TB #2
TB #1
Salt
UnitOutline
TB #2Discovery Well
1st Appraisal
Well
BP - 50%Chevron – 30%
Hess – 20%
3 mi

71
North Africa Exploration Strategy
Major petroleum systems
Significant position established in key plays
Multiple material prospects
Major petroleum systems
Significant position established in key plays
Multiple material prospects
Total Net Acres (Million)
0
5
10
02 03 04 05 06
AlgeriaAlgeria LibyaLibya EgyptEgypt
Hess AcreageHess Acreage
Blks 428, 429Block 54
West Med
N. Red Sea
72
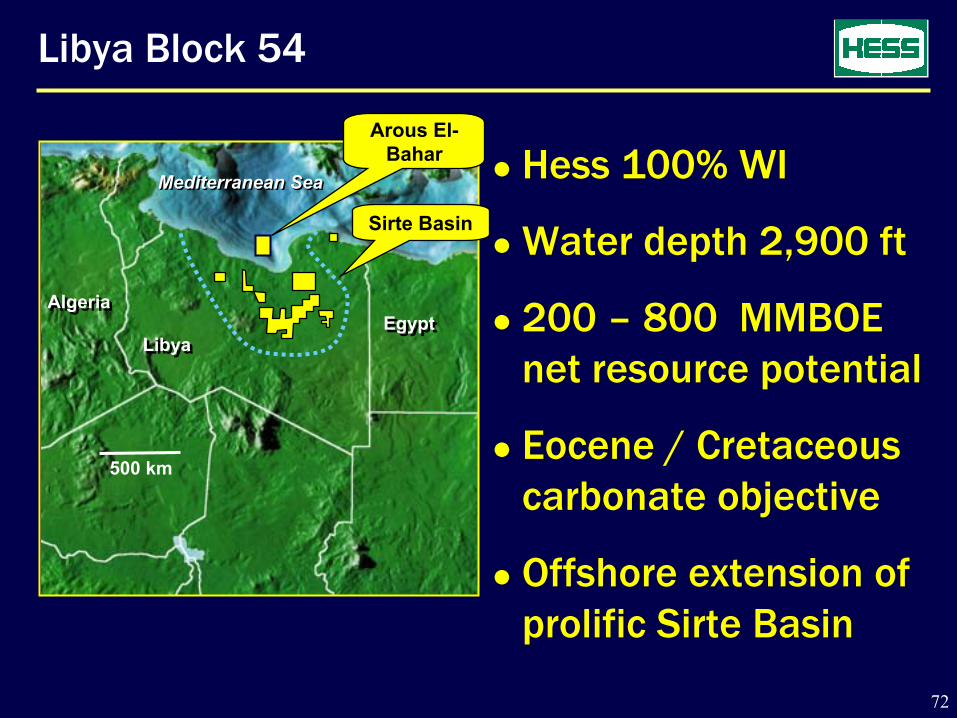
Libya Block 54
Hess 100% WI
Water depth 2,900 ft
200 – 800 MMBOEnet resource potential
Eocene / Cretaceous carbonate objective
Offshore extension of prolific Sirte Basin
Hess 100% WI
Water depth 2,900 ft
200 – 800 MMBOEnet resource potential
Eocene / Cretaceous carbonate objective
Offshore extension of prolific Sirte Basin
500 km
LibyaLibyaEgyptEgypt
AlgeriaAlgeria
Mediterranean SeaMediterranean Sea
Arous El-Bahar
Sirte Basin
73
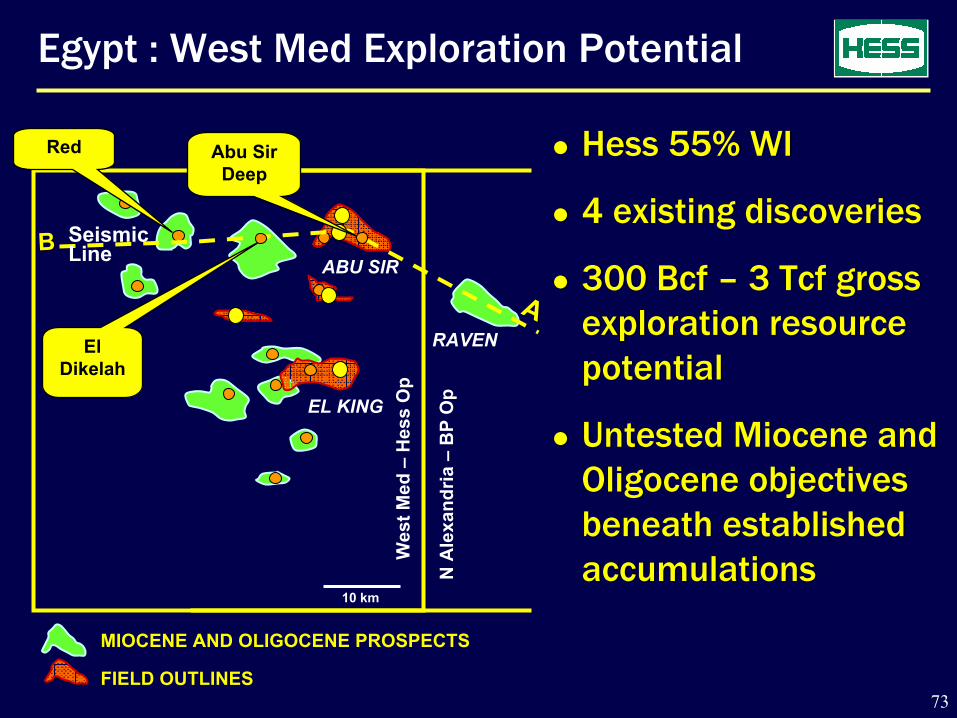
Egypt : West Med Exploration Potential
Hess 55% WI
4 existing discoveries
300 Bcf – 3 Tcf gross exploration resource potential
Untested Miocene and Oligocene objectives beneath established accumulations
Hess 55% WI
4 existing discoveries
300 Bcf – 3 Tcf gross exploration resource potential
Untested Miocene and Oligocene objectives beneath established accumulations
MIOCENE AND OLIGOCENE PROSPECTS
FIELD OUTLINES
10 km
EL KING
ABU SIR
RAVENEl Dikelah
AA
BB Seismic Line
Abu Sir Deep
Red
Wes
t Med
–H
ess
Op
N A
lexa
ndria
–B
P O
p
74
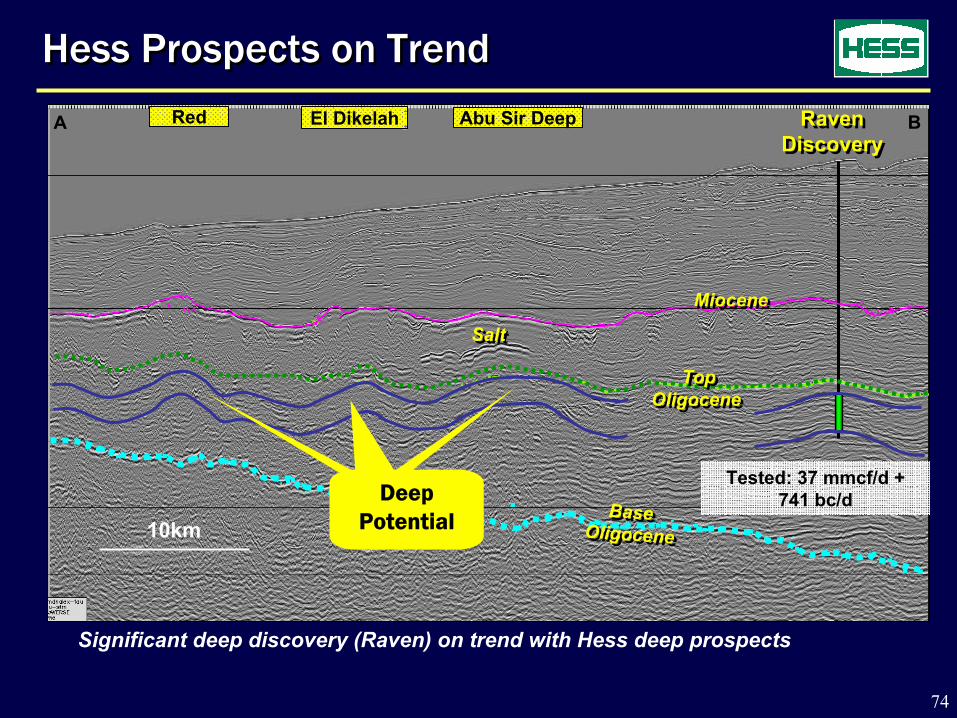
Hess Prospects on TrendHess Prospects on Trend
Significant deep discovery (Raven) on trend with Hess deep prospects
Red El Dikelah Abu Sir DeepA B
10km
Raven Discovery
Raven Discovery
SaltSaltMioceneMiocene
Top Oligocene
Top Oligocene
Base Oligocene
Base Oligocene
Tested: 37 mmcf/d + 741 bc/dDeep Deep
PotentialPotentialDeep Deep
PotentialPotentialDeep
Potential
75
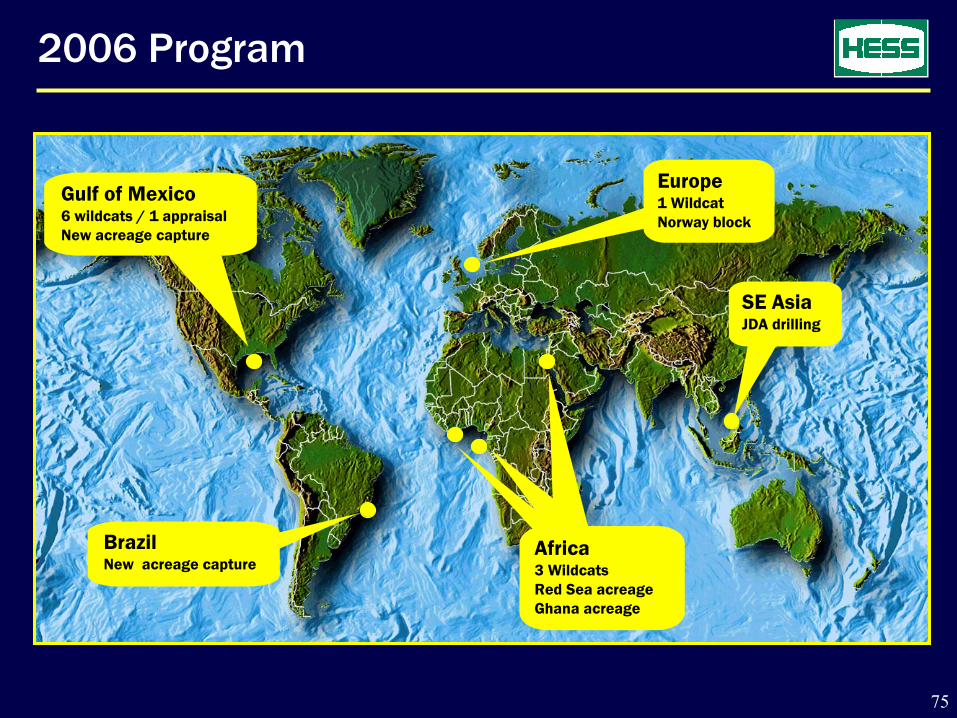
2006 Program
Gulf of Mexico6 wildcats / 1 appraisalNew acreage capture
Europe1 WildcatNorway block
Africa 3 WildcatsRed Sea acreageGhana acreage
SE AsiaJDA drilling
BrazilNew acreage capture

76
2007 – 2008 Outlook
Gulf of Mexico8 - 10 Wildcats / Appraisals
NW EuropeCambo AppraisalNorway Wildcat
Africa West Med Arous El-Bahar2 - 3 Wildcats
SE AsiaBelud AppraisalMalaysian Wildcat
South AmericaPeru AppraisalBrazil Wildcat
77
Exploration - Summary
Adding resources and creating value
Global inventory of 19 million net acres
80 named prospects globally
Drilling 8 – 10 impact wells per year
Leading-edge technology
Adding resources and creating value
Global inventory of 19 million net acres
80 named prospects globally
Drilling 8 – 10 impact wells per year
Leading-edge technology
E&P – CONCLUSION
79
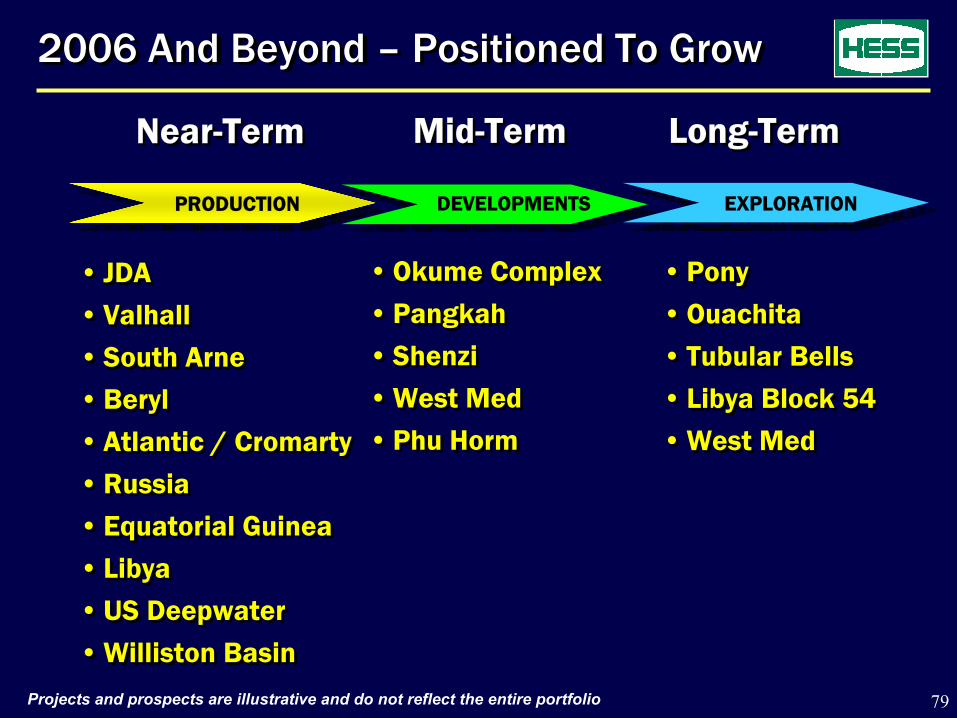
2006 And Beyond – Positioned To Grow2006 And Beyond – Positioned To Grow
• Pony• Ouachita• Tubular Bells• Libya Block 54• West Med
• Pony• Ouachita• Tubular Bells• Libya Block 54• West Med
• JDA• Valhall• South Arne• Beryl• Atlantic / Cromarty• Russia• Equatorial Guinea• Libya• US Deepwater• Williston Basin
• JDA• Valhall• South Arne• Beryl• Atlantic / Cromarty• Russia• Equatorial Guinea• Libya• US Deepwater• Williston Basin
• Okume Complex• Pangkah• Shenzi• West Med• Phu Horm
• Okume Complex• Pangkah• Shenzi• West Med• Phu Horm
EXPLORATION
Long-TermLong-TermNear-TermNear-Term
PRODUCTION
Mid-TermMid-Term
DEVELOPMENTS
Projects and prospects are illustrative and do not reflect the entire portfolio
80
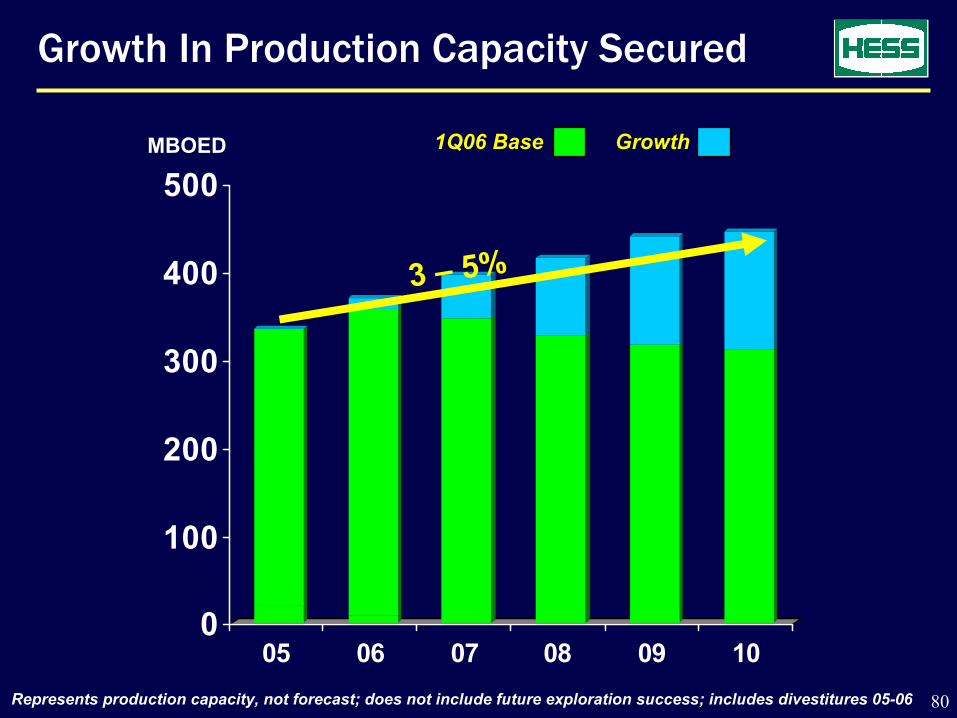
Growth In Production Capacity Secured
0
100
200
300
400
500
05 06 07 08 09 10
MBOED 1Q06 Base Growth
Represents production capacity, not forecast; does not include future exploration success; includes divestitures 05-06
3 – 5%

81
Longer-Life Assets, Geographically Balanced
0
100
200
300
400
500
05 06 07 08 09 10
ProductionCapacityMBOED
Long
Medium
Short
05 06 07 08 09 10
By Reserve Life By Region
Europe
USA
Asia
Africa
Represents production capacity, not forecast; does not include future exploration success; includes divestitures 05-06
82
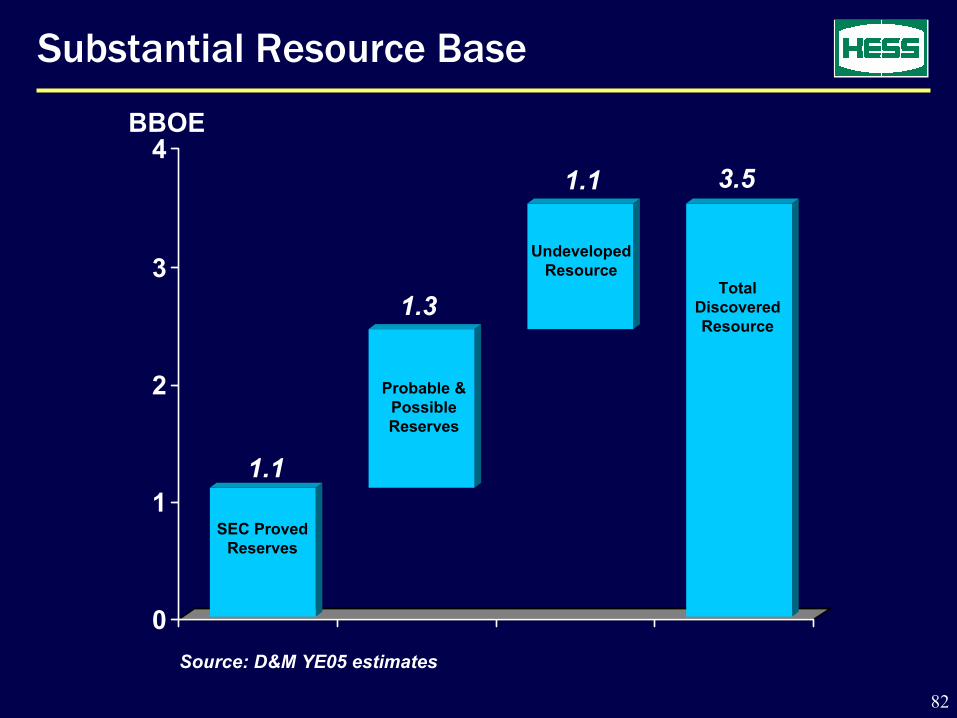
Substantial Resource Base
0
1
2
3
4BBOE
SEC Proved Reserves
Probable & Possible Reserves
UndevelopedResource
Total Discovered Resource
1.1
1.3
1.1 3.5
Source: D&M YE05 estimates

83
0
1
2
2005 2010
ValhallWest Med Pailin
Waha JDA NatunaShenzi Okume Clair RidgePangkah S. Arne BakkenPhu Horm Russia BerylPermian EOR Schiehallion Snøhvit
Reserve Growth Potential Identified
BBOE
5% - 8% Growth Rate
84
E&P – Summary
…that is delivering sustainable growth.
Building a global franchise…
Building a global franchise…

BREAK

BORDEN WALKERPRESIDENT
MARKETING AND REFINING
BORDEN WALKERPRESIDENT
MARKETING AND REFINING
87
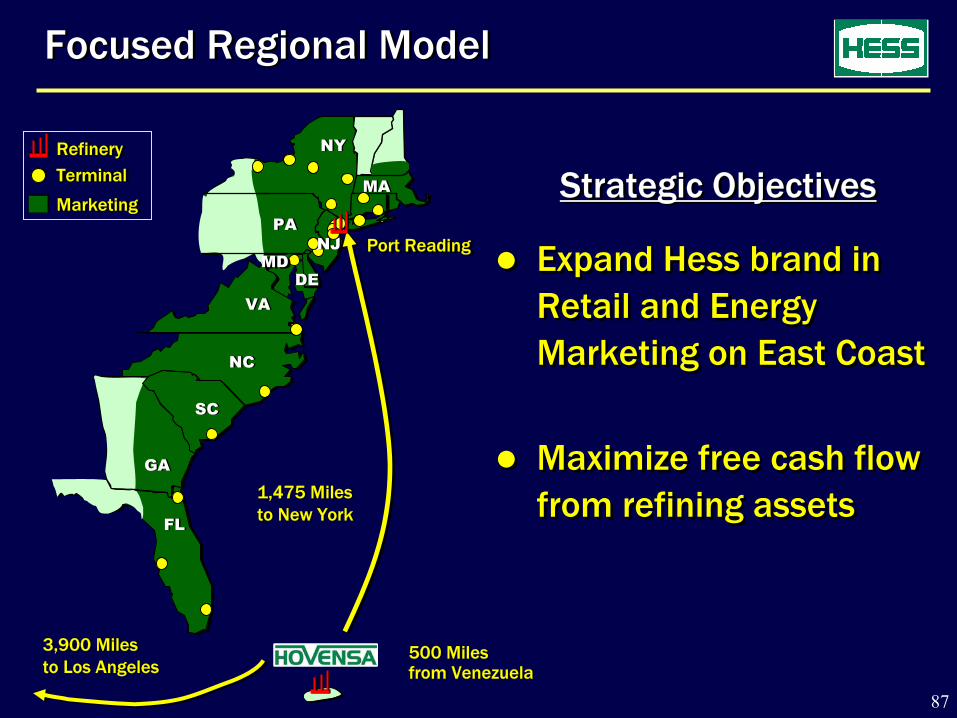
DEDE
3,900 Milesto Los Angeles3,900 Milesto Los Angeles
500 Milesfrom Venezuela500 Milesfrom Venezuela
RefineryRefineryTerminalTerminal
MarketingMarketing
1,475 Miles to New York1,475 Miles to New York
Focused Regional ModelFocused Regional Model
Expand Hess brand in Retail and Energy Marketing on East Coast
Maximize free cash flow from refining assets
Expand Hess brand in Retail and Energy Marketing on East Coast
Maximize free cash flow from refining assets
Strategic ObjectivesStrategic Objectives
Port ReadingPort Reading
FL
PAPA
MAMA
VA
NC
SC
NYNY
VAVA
NCNC
GAGA
FLFL
SCSC
MDMDNJNJ

88
EstMarket
# Sites Share (%)
Florida 344 10.5 New York 267 9.9 North Carolina 238 8.9 Pennsylvania 109 5.6 Massachusetts 101 8.2 New Jersey 85 5.4 South Carolina 73 9.0 Virginia 56 4.7 Other 81 N/A
TOTAL 1,354
EstMarket
# Sites Share (%)
Florida 344 10.5 New York 267 9.9 North Carolina 238 8.9 Pennsylvania 109 5.6 Massachusetts 101 8.2 New Jersey 85 5.4 South Carolina 73 9.0 Virginia 56 4.7 Other 81 N/A
TOTAL 1,354
Retail Station NetworkRetail Station NetworkNY
MD
NC
Year-End 2005Year-End 2005
Source: EIA total gallons by stateSource: EIA total gallons by state

89
794
151
242
807
155
233
836
202
216
855
309
190
0
500
1,000
1,500
02 03 04 05
794
151
242
807
155
233
836
202
216
855
309
190
0
500
1,000
1,500
02 03 04 05
Convenience Stores:
Merchandise Sales ($MM)
Gross Margin ($MM)
Convenience Stores:
Merchandise Sales ($MM)
Gross Margin ($MM)
772
187
772
187
862
206
862
206
932
215
932
215
973
232
973
232
Branded / Dealer
WilcoHess
Hess Operated
Branded / Dealer
WilcoHess
Hess Operated
Site Count (Year End)Site Count (Year End)
1,1871,187 1,1951,1951,2541,254
1,3541,354
Growth in Company Operated ModelGrowth in Company Operated Model
86% Co-op86% Co-op

90
Industry Leading PerformanceIndustry Leading Performance
96
104
113114
50
75
100
125
02 03 04 05
96
104
113114
50
75
100
125
02 03 04 05
170178
191
204
100
125
150
175
200
225
02 03 04 05
170178
191
204
100
125
150
175
200
225
02 03 04 05
Typical Major Source: New Image Marketing SurveysTypical Major Source: New Image Marketing Surveys
Per Site AveragesPer Site Averages
Volume (Mg/Mo)Volume (Mg/Mo)
C-Store Sales ($M/Mo)C-Store Sales ($M/Mo)

91
Recent AcquisitionsRecent Acquisitions
Successful Acquisition StrategySuccessful Acquisition Strategy
Hess Rebranded Disney SitesHess Rebranded Disney Sites
Numberof Sites Before After Before After
Disney World 3 110 510 70 187
DB Marts 19 74 175 68 121
Servco 50 101 164 49 77
Fuel Volume C-Store Sales(Mgals/Site/Mo) ($M/Site/Mo)Number
of Sites Before After Before After
Disney World 3 110 510 70 187
DB Marts 19 74 175 68 121
Servco 50 101 164 49 77
Fuel Volume C-Store Sales(Mgals/Site/Mo) ($M/Site/Mo)

92
Strong brand and reputation
Scale advantage
More than 10,000 customers
• Fuel Oil Sales: 130 MB/D
• Natural Gas Sales: 1.5 BCF/D
Selective Growth
Strong brand and reputation
Scale advantage
More than 10,000 customers
• Fuel Oil Sales: 130 MB/D
• Natural Gas Sales: 1.5 BCF/D
Selective Growth
Energy MarketingEnergy Marketing

93
C&I Volume (MDth/d) 185
Ohio Valley
Leading C&I Natural Gas SupplierLeading C&I Natural Gas Supplier
Market ShareMarket Share
15%15%
17%17%
28%28%40%40%
C&I Volume (MDth/d) 110
Upstate New York
C&I Volume (MDth/d) 90
New England
C&I = Commercial and Industrial
28%28%
Mid Atlantic / SE115C&I Volume (MDth/d)
C&I Volume (MDth/d) 260
Metro NY/New Jersey

94
Sales Volume GrowthSales Volume Growth
397 409
488
657
0
200
400
600
800
02 03 04 05
397 409
488
657
0
200
400
600
800
02 03 04 05
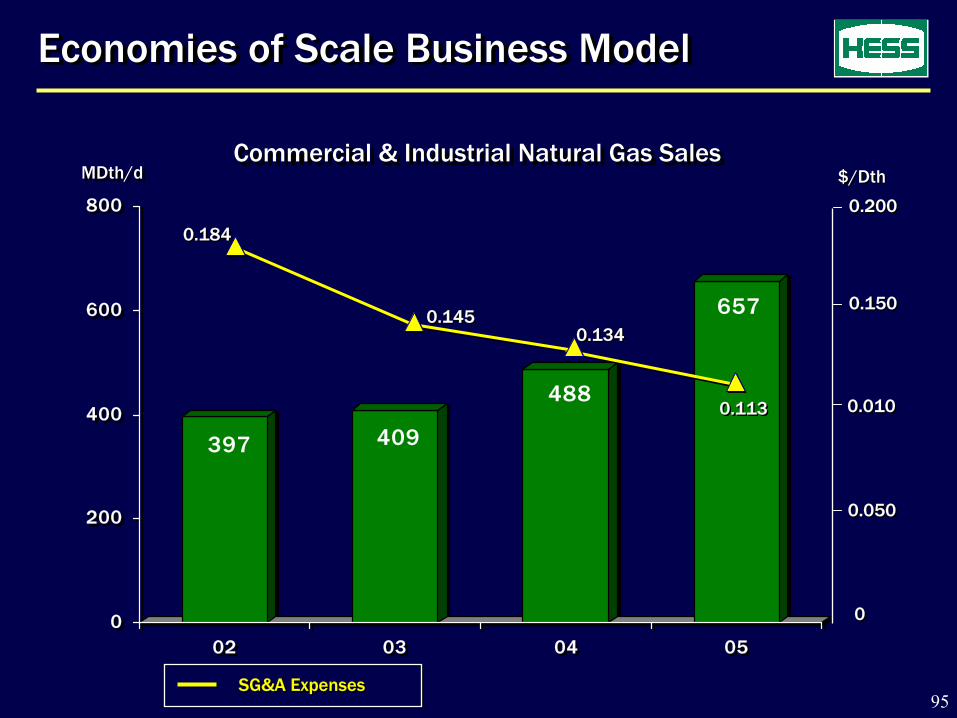
MDth/dMDth/dCommercial & Industrial Natural Gas SalesCommercial & Industrial Natural Gas Sales
95
Commercial & Industrial Natural Gas SalesCommercial & Industrial Natural Gas Sales
397 409
488
657
0
200
400
600
800
02 03 04 05
397 409
488
657
0
200
400
600
800
02 03 04 05
Economies of Scale Business ModelEconomies of Scale Business Model
MDth/dMDth/d
0.1450.145
0.1840.184
0.1340.134
00
0.0500.050
0.0100.010
0.1500.150
0.2000.200
0.1130.113
$/Dth$/Dth
SG&A ExpensesSG&A Expenses

96
Hovensa RefineryHovensa Refinery
50/50 JV formed in 1998 by Hess and PDVSA
Capacity
• Crude 500 MB/D
• FCC 150 MB/D
• Coker 58 MB/D
World Class Merchant Refinery
•Competitive Geographic Position
•Economies of Scale
•Long Term PDVSA Crude Supply
50/50 JV formed in 1998 by Hess and PDVSA
Capacity
• Crude 500 MB/D
• FCC 150 MB/D
• Coker 58 MB/D
World Class Merchant Refinery
•Competitive Geographic Position
•Economies of Scale
•Long Term PDVSA Crude Supply
97
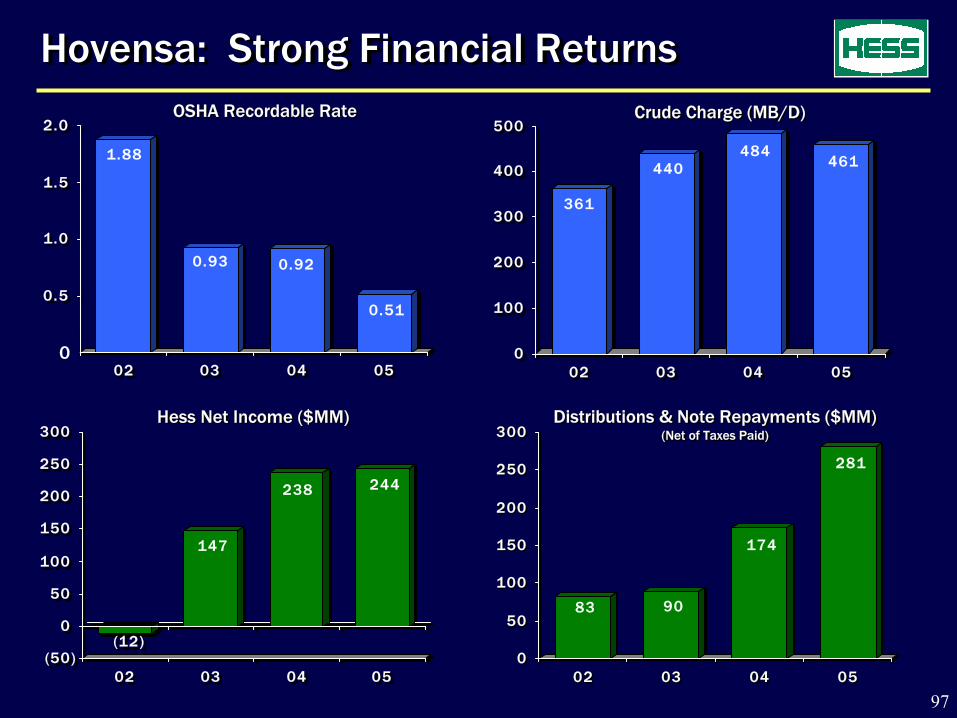
Hovensa: Strong Financial ReturnsHovensa: Strong Financial Returns
1.88
0.93 0.92
0.51
0.0
0.5
1.0
1.5
2.0
02 03 04 05
1.88
0.93 0.92
0.51
0.0
0.5
1.0
1.5
2.0
02 03 04 05
OSHA Recordable RateOSHA Recordable Rate
361
440484
461
0
100
200
300
400
500
02 03 04 05
361
440484
461
0
100
200
300
400
500
02 03 04 05
(12)
147
238 244
(50)
0
50
100
150
200
250
300
02 03 04 05
(12)
147
238 244
(50)
0
50
100
150
200
250
300
02 03 04 05
83 90
174
281
0
50
100
150
200
250
300
02 03 04 05
83 90
174
281
0
50
100
150
200
250
300
02 03 04 05
Crude Charge (MB/D)Crude Charge (MB/D)
Hess Net Income ($MM)Hess Net Income ($MM) Distributions & Note Repayments ($MM)(Net of Taxes Paid)
Distributions & Note Repayments ($MM)(Net of Taxes Paid)
0

98
Port Reading RefineryPort Reading Refinery
65 MB/D FCC
Major gasoline manufacturer in NY Harbor
Capable of running 100% low sulfur resid
Strong income generator
65 MB/D FCC
Major gasoline manufacturer in NY Harbor
Capable of running 100% low sulfur resid
Strong income generator
17
27
60
100
0
20
40
60
80
100
02 03 04 05
17
27
60
100
0
20
40
60
80
100
02 03 04 05
Net Income ($MM)Net Income ($MM)
53 54 52
61
0
10
20
30
40
50
60
70
02 03 04 05
53 54 52
61
0
10
20
30
40
50
60
70
02 03 04 05
Charge Rate (MB/D)Charge Rate (MB/D)
(last 9 months)
99
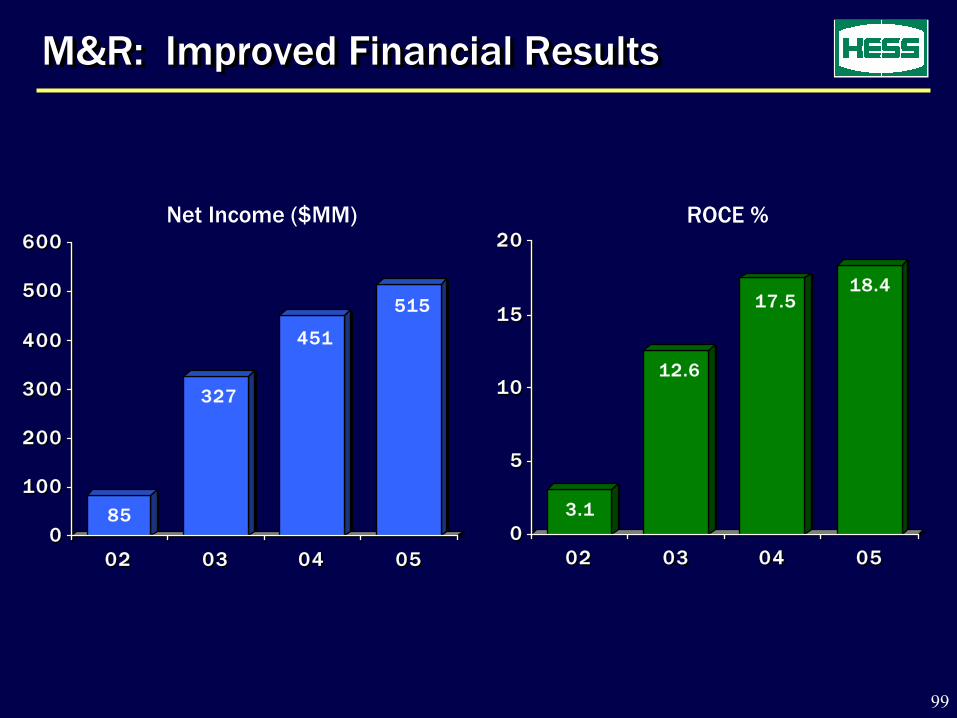
M&R: Improved Financial ResultsM&R: Improved Financial Results
85
327
451
515
0
100
200
300
400
500
600
02 03 04 05
85
327
451
515
0
100
200
300
400
500
600
02 03 04 05
3.1
12.6
17.518.4
0
5
10
15
20
02 03 04 05
3.1
12.6
17.518.4
0
5
10
15
20
02 03 04 05
Net Income ($MM) ROCE %

100
0.00
0.50
1.00
1.50
2.00
2.50
HES VLO BP XOM MRO COP TSO RDS SUN CVX MUR0.00
0.50
1.00
1.50
2.00
2.50
HES VLO BP XOM MRO COP TSO RDS SUN CVX MUR
Competitive ResultsCompetitive Results
0%
10%
20%
30%
XOM SUN MRO COP HES VLO TSO RDS CVX BP MUR0%
10%
20%
30%
XOM SUN MRO COP HES VLO TSO RDS CVX BP MUR
Source: Company filings
U.S. M&R Net Income / Oil BBL Sold2002 – 2005 Average
U.S. M&R Net Income / Oil BBL Sold2002 – 2005 Average
U.S. M&R Return on Capital Employed2002 – 2005 Average
U.S. M&R Return on Capital Employed2002 – 2005 Average
$
0
101
M&R: A Leading IndependentM&R: A Leading Independent
Customer led strategy
Distinctive business models
Geographically focused
Selective growth in Retail and Energy Marketing
Maximize near term returns and cash flow
Customer led strategy
Distinctive business models
Geographically focused
Selective growth in Retail and Energy Marketing
Maximize near term returns and cash flow

JOHN RIELLYCHIEF FINANCIAL OFFICER

103
Financial StrategyFinancial Strategy
Ensure capital availability to fund growth
• Cash flow from operations
• Balance sheet
• Liquidity
Deliver first quartile financial performance
• Return on capital employed
• Total shareholder returns
104
0
500
1,000
1,500
2,000
2,500
3,000
3,500
4,000
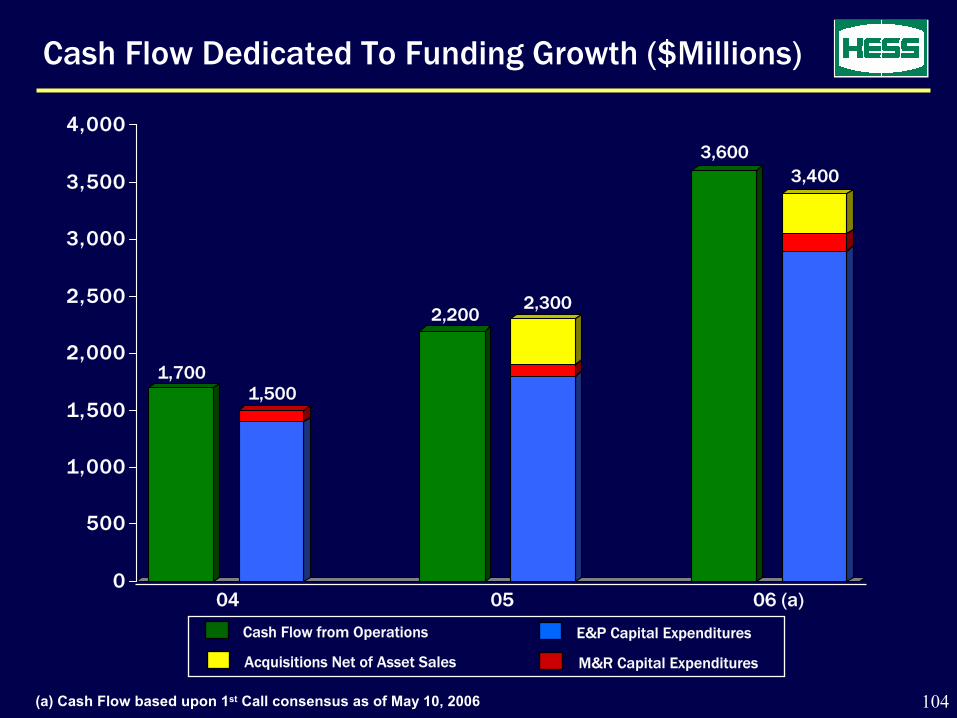
Cash Flow Dedicated To Funding Growth ($Millions)
(a) Cash Flow based upon 1st Call consensus as of May 10, 2006
1,7001,500
2,2002,300
3,6003,400
04 05 06 (a)
Cash Flow from Operations E&P Capital Expenditures
M&R Capital ExpendituresAcquisitions Net of Asset Sales

105
0
500
1,000
1,500
2,000
2,500
3,000
3,500
4,000
(a) Based upon 1st Call CPS as of May 10, 2006. Consensus WTI 2007 / 2008; $57.40 / $54.10 respectively
Cash Flow Available To Fund Growth ($Millions)
3,6003,400
3,600 3,700
Cash Flow from Operations E&P Capital Expenditures
M&R Capital ExpendituresAcquisitions Net of Asset Sales
06 (a) 07 (a) 08 (a)
$50.00 WTI
$50.00 WTI
$57.40 WTI
$54.10 WTI

106
3.8
5.6
3.8
6.3
3.8
8.5
3.7
10.5
3.7
12.3
0
2
4
6
8
10
12
14
16
00
Improving Balance Sheet ($ Billions)
04 05 06(a) 07(a) 08(a)
DebtDebtEquity Debt to CapitalDebt to Capital
45%45%
2020
1010
55
1515
3030
2525
4040
3535
(a) Based upon 1st Call earnings consensus as of May 10, 2006.
$$

107
Strong Financial Liquidity
New $3 billion revolving credit facility
• Five year term, with three one year options
Debt maturities of $251MM over 5 years
• Represents 7% of total debt
26 26 28
142
29
0
50
100
150
06 07 08 09 10
26 26 28
142
29
0
50
100
150
06 07 08 09 10
$M
M$
MM
$$

108
9 %
12 % 12 %
14 % 14 %
2 1%
19 %
0%
5%
10%
15%
20%
25%
Improving ROCE
(b) Based upon 1st Call estimate as of May 10, 2006 (b) Based upon 1st Call estimate as of May 10, 2006 (a) Peer Group per Proxy(a) Peer Group per Proxy
Source: Bloomberg using a consistent basis with HessSource: Bloomberg using a consistent basis with Hess
0303 0404 0505 06 (b)06 (b)
HESS PEERS (a)
109
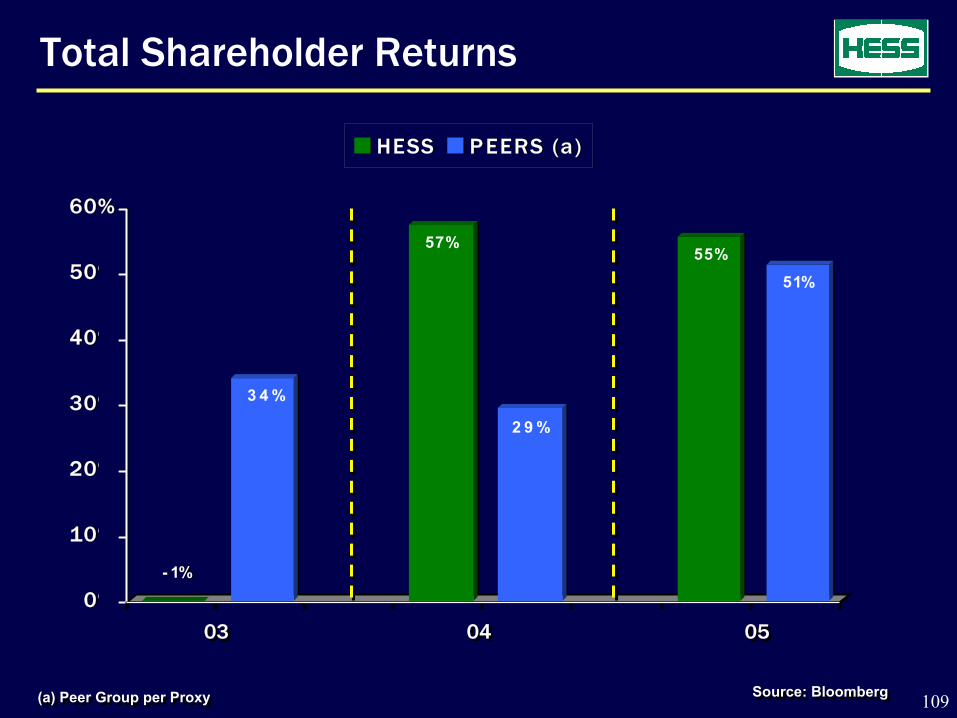
Total Shareholder Returns
- 1%
3 4 %
57%
2 9 %
55%
51%
0%
10%
20%
30%
40%
50%
60%
HESS P EERS (a)
- 1%
3 4 %
57%
2 9 %
55%
51%
0%
10%
20%
30%
40%
50%
60%
HESS P EERS (a)
0303
Source: BloombergSource: Bloomberg(a) Peer Group per Proxy(a) Peer Group per Proxy
0404 0505

110
Financial Summary
Strong cash flow from operations
Declining debt-to-capital ratio
Substantial liquidity
Improving financial and shareholder returns

JOHN HESSCHAIRMAN OF THE BOARD CHIEF EXECUTIVE OFFICER
JOHN HESSCHAIRMAN OF THE BOARD CHIEF EXECUTIVE OFFICER
112
SummarySummary
● Strategy in place
● Portfolio reshaped
● Delivering performance
● Exciting investment opportunities
● Sustainable growth
● Skilled management team
● Strategy in place
● Portfolio reshaped
● Delivering performance
● Exciting investment opportunities
● Sustainable growth
● Skilled management team

113
Forward-Looking Statements and Other InformationForward-Looking Statements and Other Information
This presentation contains projections and other forward-looking statements within the meaning of Section 27A of the Securities Act of 1933 and Section 21E of the Securities Exchange Act of 1934. These projections and statements reflect the company’s current views with respect to future events and financial performance. No assurances can be given, however, that these events will occur or that these projections will be achieved, and actual results could differ materially from those projected as a result of certain risk factors. A discussion of these risk factors is included in the company’s periodic reports filed with the Securities and Exchange Commission.
The SEC permits oil and gas companies, in their filings with the SEC, to disclose only proved reserves that a company has demonstrated by actual production or conclusive formation tests to be economically and legally producible under existing economic and operating conditions. We use certain terms in this presentation relating to reserves other than proved, such as unproved resources, that the SEC’s guidelines prohibit registrants from including in filings with the SEC. Investors are urged to consider closely the disclosure in Hess’ Form 10-K, File No. 1-1204, available from Hess Corporation, 1185 Avenue of the Americas, New York, New York 10036 c/o Corporate Secretary and on our website at www.hess.com. You can also obtain this form from the SEC on the EDGAR system.
This presentation contains certain non-GAAP financial measures. A reconciliation of the differences between these non-GAAP financial measures and the most directly comparable GAAP financial measures can be found in this presentation on our website at www.hess.com.


![2008 UBS Global Oil and Gas Conference[1]library.corporate-ir.net/library/10/101/101801/items/295700/Hess...Bakken Jambi Merang Seminole ROZ 2009 Pangkah Oil Shenzi 2008 ... position](https://img.pdfslide.us/doc/110x75/5acbb3057f8b9a875a8bb3b7/2008-ubs-global-oil-and-gas-conference1-jambi-merang-seminole-roz-2009-pangkah.jpg)