Embed Size (px)
Citation preview
8/10/2019 jo tlc.ppt
http://slidepdf.com/reader/full/jo-tlcppt 1/47
8/10/2019 jo tlc.ppt
http://slidepdf.com/reader/full/jo-tlcppt 2/47
IN 1958, S TAHL DEVELOPED STANDARD EQUIPMENT FOR ANALYZING BY THIN LAYER
CHROMATOGRAPHY .
8/10/2019 jo tlc.ppt
http://slidepdf.com/reader/full/jo-tlcppt 3/47
DEFINITION
Thin layer chromatography (TLC) is a technique usedtseparate the components of a mixture using a thin stationary
phase supported by an inert backing.
Separation depends on competition between adsorption ofsolute onto the solid surface and its desorption by the solventneeded to elute (wash off) it .
Stationary phase: SolidMobile phase: Liquid
8/10/2019 jo tlc.ppt
http://slidepdf.com/reader/full/jo-tlcppt 4/47
PRINCIPLE
ADSORPTION Chromatography
The component with more affinity travel slowertowards the S.P
The component with lesser affinity travel faster towardsthe S.P.
In TLC separation – hydrogen bonding is mainintermolecular forces involved
8/10/2019 jo tlc.ppt
http://slidepdf.com/reader/full/jo-tlcppt 5/47
Polar molecules stick to plate
Non- polar molecules do not stick to plate
Non-polar molecules will spend a great amount of timedissolved in eluent
Separation of compounds occur due to differences in partitioning b/w liquid and S.P
More sensitive & less sample required
Spraying with corrosive agents for identification possible
8/10/2019 jo tlc.ppt
http://slidepdf.com/reader/full/jo-tlcppt 6/47
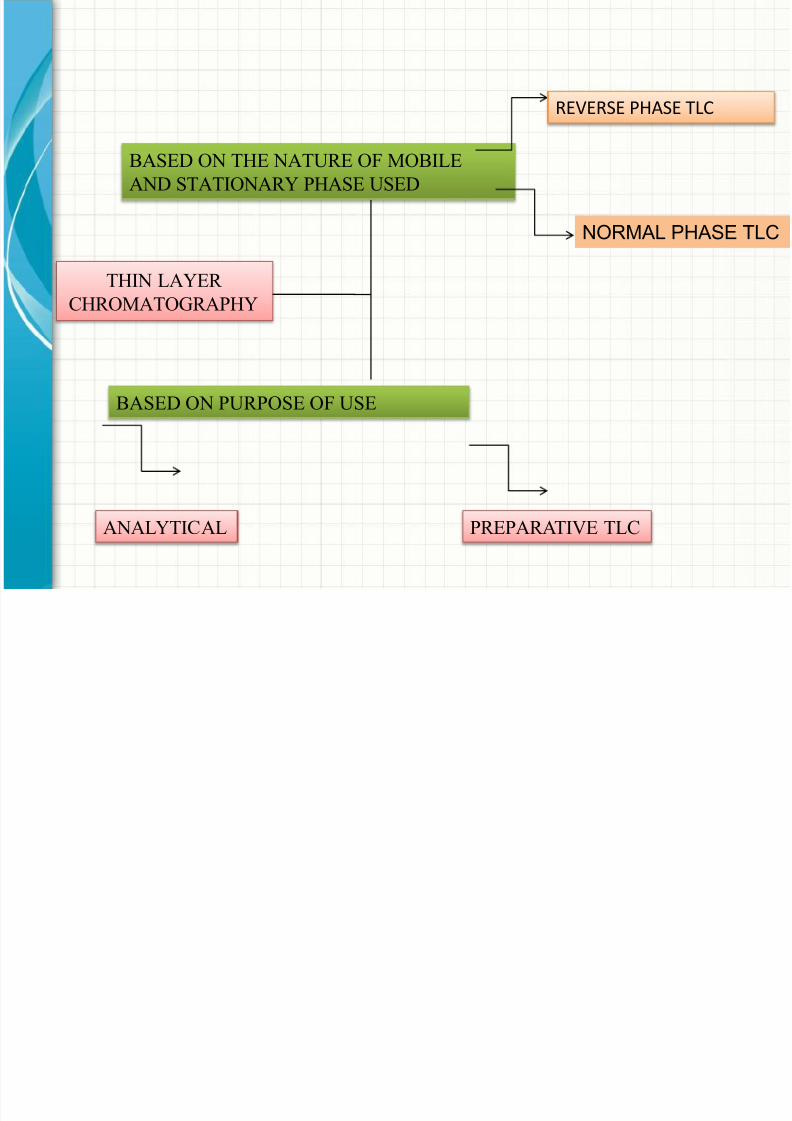
THIN LAYERCHROMATOGRAPHY
BASED ON PURPOSE OF USE
BASED ON THE NATURE OF MOBILEAND STATIONARY PHASE USED
NORMAL PHASE TLC
REVERSE PHASE TLC
ANALYTICAL PREPARATIVE TLC
8/10/2019 jo tlc.ppt
http://slidepdf.com/reader/full/jo-tlcppt 7/47
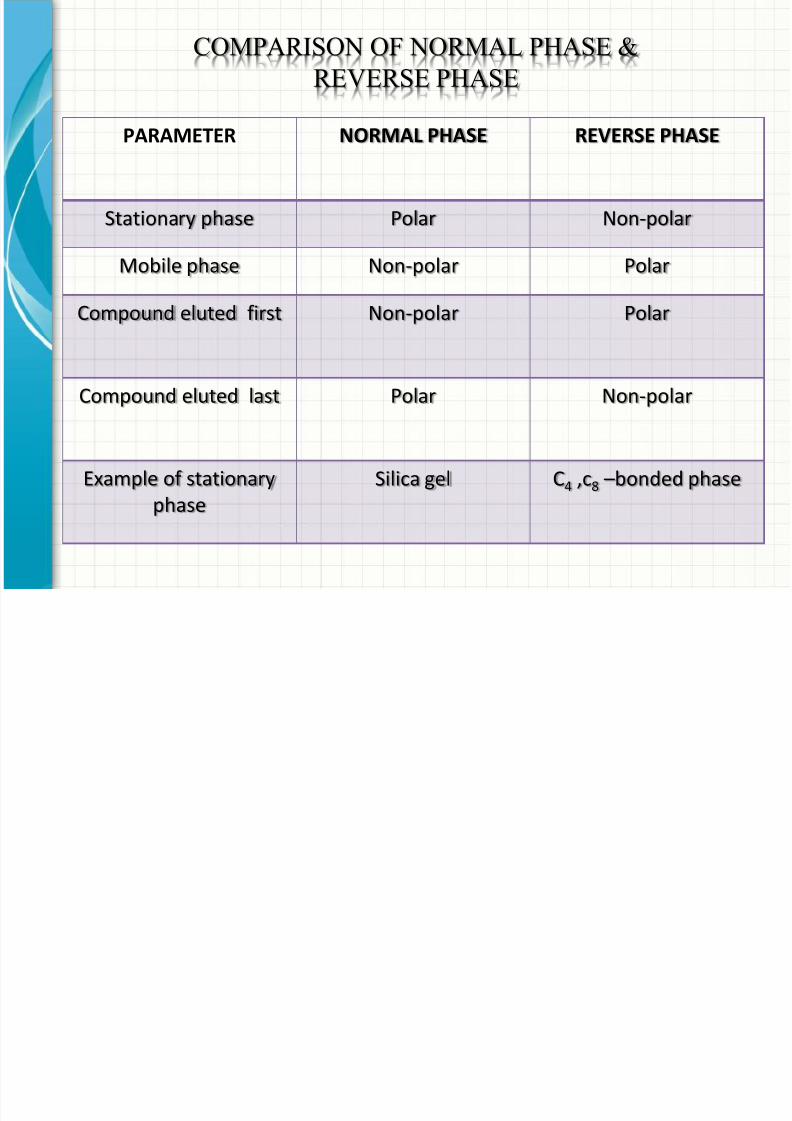
PARAMETER NORMAL PHASE REVERSE PHASE
Stationary phase Polar Non-polar
Mobile phase
Non-polar
Polar
Compound eluted first Non-polar Polar
Compound eluted last Polar Non-polar
Example of stationaryphase
Silica gel C4 ,c8 – bonded phase
COMPARISON OF NORMAL PHASE &REVERSE PHASE
8/10/2019 jo tlc.ppt
http://slidepdf.com/reader/full/jo-tlcppt 8/47
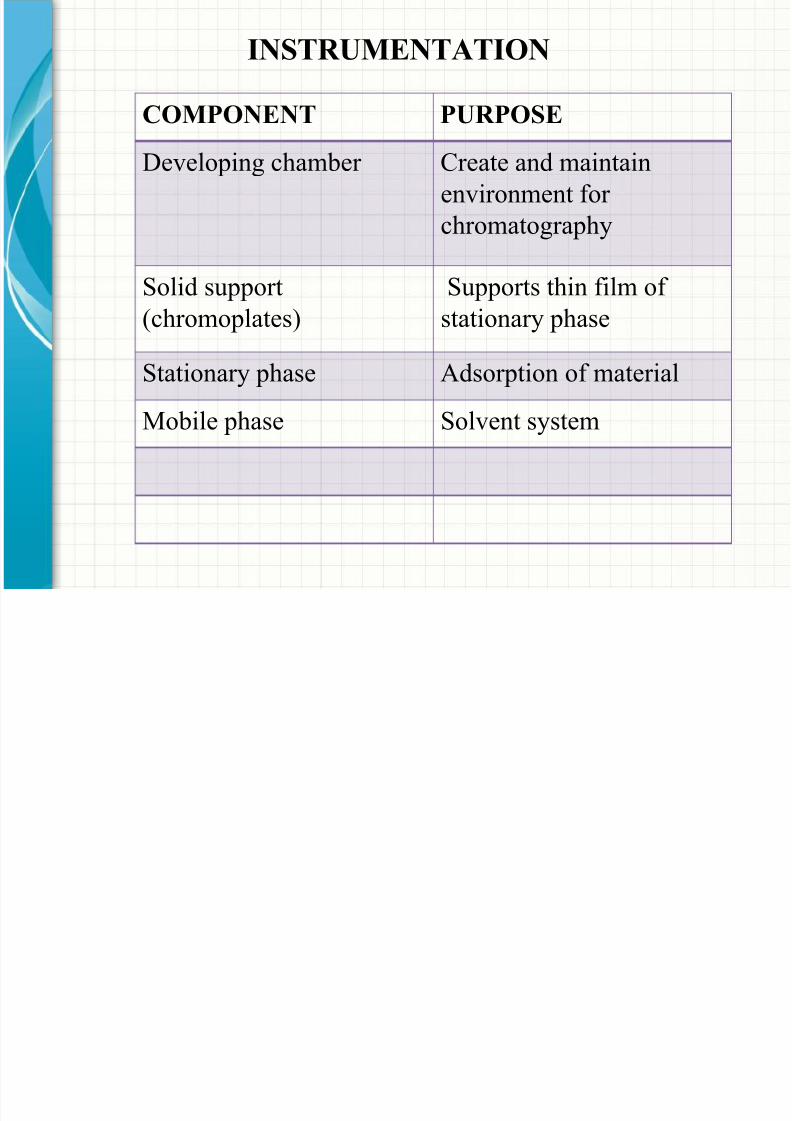
INSTRUMENTATION
COMPONENT PURPOSE
Developing chamber Create and maintainenvironment forchromatography
Solid support(chromoplates)
Supports thin film ofstationary phase
Stationary phase Adsorption of material
Mobile phase Solvent system
8/10/2019 jo tlc.ppt
http://slidepdf.com/reader/full/jo-tlcppt 9/47
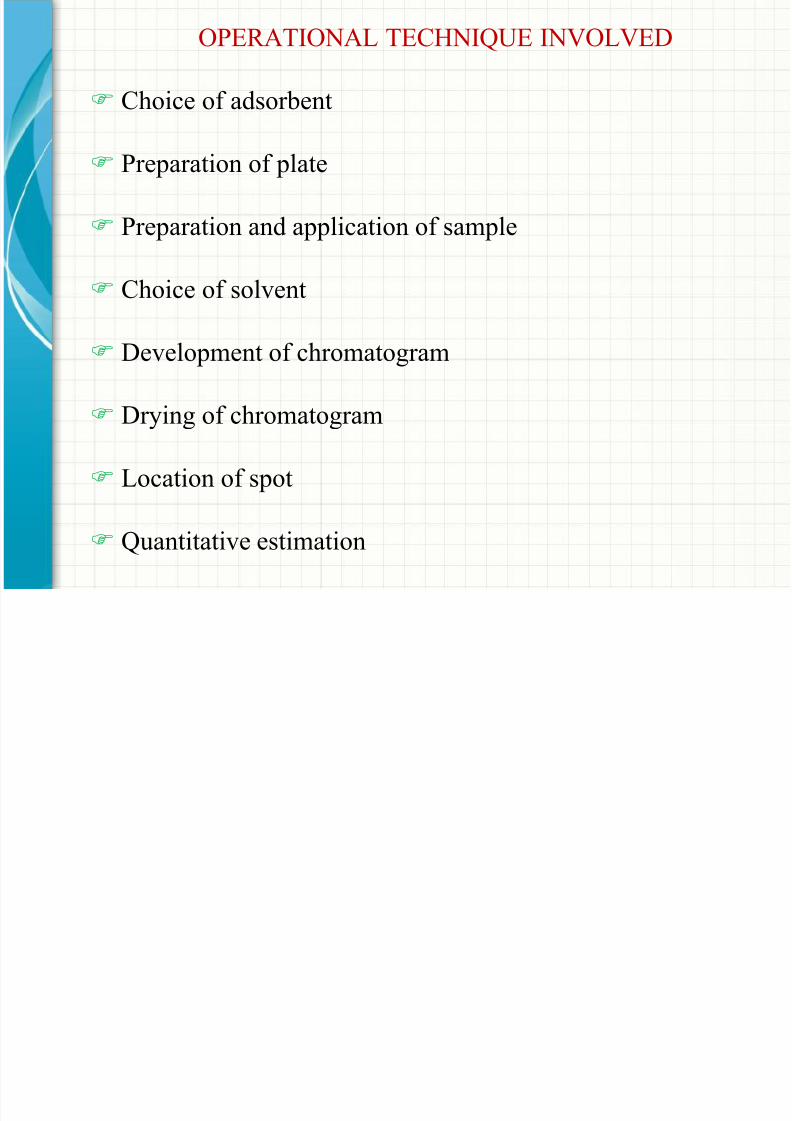
OPERATIONAL TECHNIQUE INVOLVED
Choice of adsorbent
Preparation of plate
Preparation and application of sample
Choice of solvent
Development of chromatogram
Drying of chromatogram
Location of spot
Quantitative estimation
8/10/2019 jo tlc.ppt
http://slidepdf.com/reader/full/jo-tlcppt 10/47
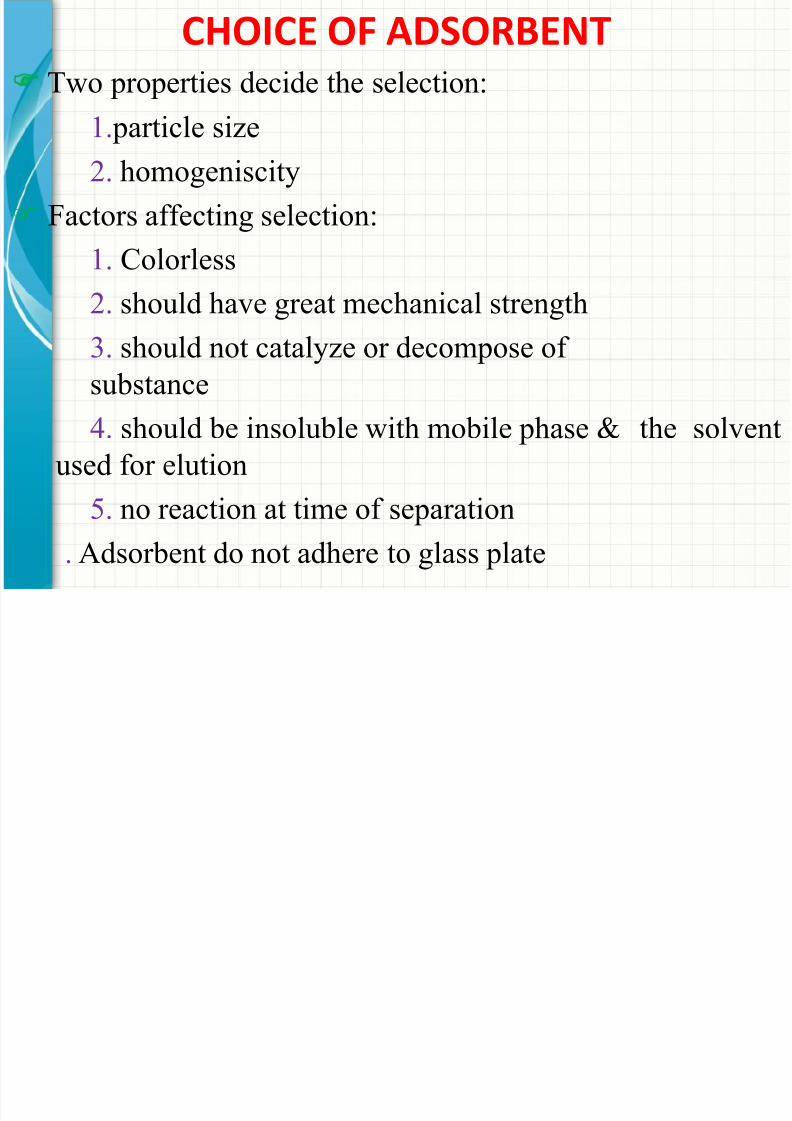
CHOICE OF ADSORBENTTwo properties decide the selection:
1. particle size2. homogeniscity
Factors affecting selection:1. Colorless2. should have great mechanical strength3. should not catalyze or decompose ofsubstance4. should be insoluble with mobile phase & the solvent
used for elution5. no reaction at time of separation
. Adsorbent do not adhere to glass plate
8/10/2019 jo tlc.ppt
http://slidepdf.com/reader/full/jo-tlcppt 11/47
CLASSIFICATION OF ADSORBENTS USED1. Classification according to binding strength:A. Weak adsorbent: sucrose, starch, talc, cellulose
B. Intermediate adsorbent: silica gel, calcium carbonate, calciumphosphate, magnesia
C. Strong adsorbent: alumina, charcoal
2. Classification according to nature:A. Inorganic adsorbent: Silica, Silica gel, Alumina, Calciumphosphate, Glass powder, Kieselguhr ,Magnesium silicate, Calciumsilicate, Phosphate , Ferric & Chromic oxides, Zinc carbonate &zinc ferro cyanides, Bentonites
B. Organic adsorbent: Normal cellulose powder, Charcoal &activated carbon, Starch, Sucrose, Manitol, Dextran gel
8/10/2019 jo tlc.ppt
http://slidepdf.com/reader/full/jo-tlcppt 12/47
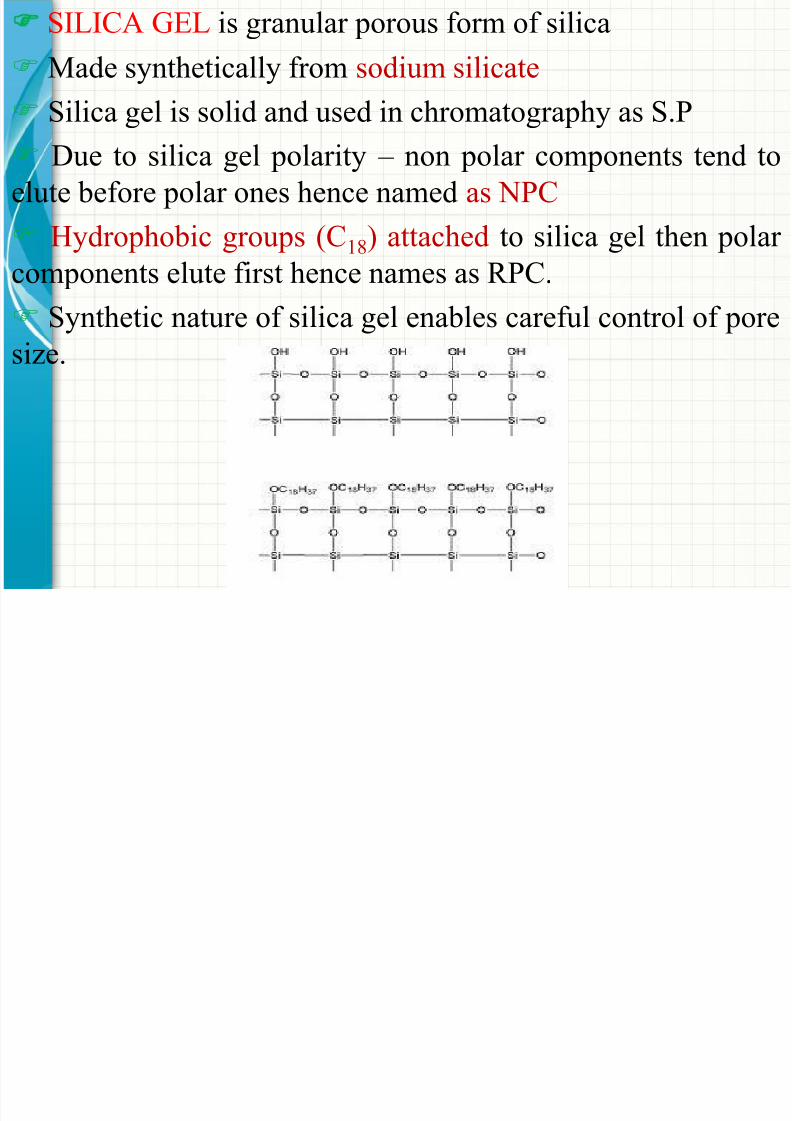
SILICA GEL is granular porous form of silica
Made synthetically from sodium silicate Silica gel is solid and used in chromatography as S.P Due to silica gel polarity – non polar components tend to
elute before polar ones hence named as NPC Hydrophobic groups (C 18) attached to silica gel then polar
components elute first hence names as RPC. Synthetic nature of silica gel enables careful control of pore
size.
8/10/2019 jo tlc.ppt
http://slidepdf.com/reader/full/jo-tlcppt 13/47
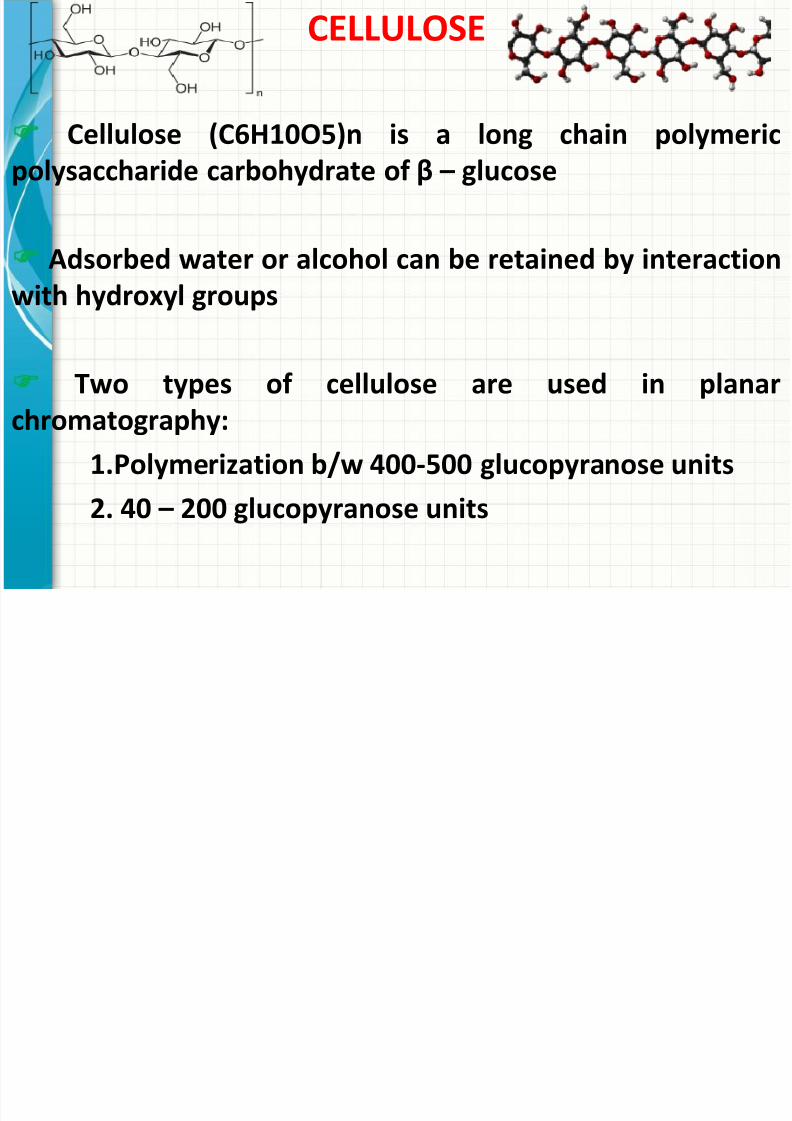
CELLULOSE
Cellulose (C6H10O5)n is a long chain polymericpolysaccharide carbohydrate of β – glucose
Adsorbed water or alcohol can be retained by interactionwith hydroxyl groups
Two types of cellulose are used in planar
chromatography:1.Polymerization b/w 400-500 glucopyranose units2. 40 – 200 glucopyranose units
8/10/2019 jo tlc.ppt
http://slidepdf.com/reader/full/jo-tlcppt 14/47
ALUMINIUM OXIDE
It is a chemical compound of aluminum and oxygen withchemical formula – Al 2O3
Commonly referred to as alumina
Manufactured in 3 pH ranges –
acidic, basic and neutral
Acidic compounds – phenols, sulphonic, carboxylic &Amino acids are separated on acidic alumina
Basic compounds – amines , dyes separated
Neutral compounds – aldehydes, ketones & lactones
8/10/2019 jo tlc.ppt
http://slidepdf.com/reader/full/jo-tlcppt 15/47
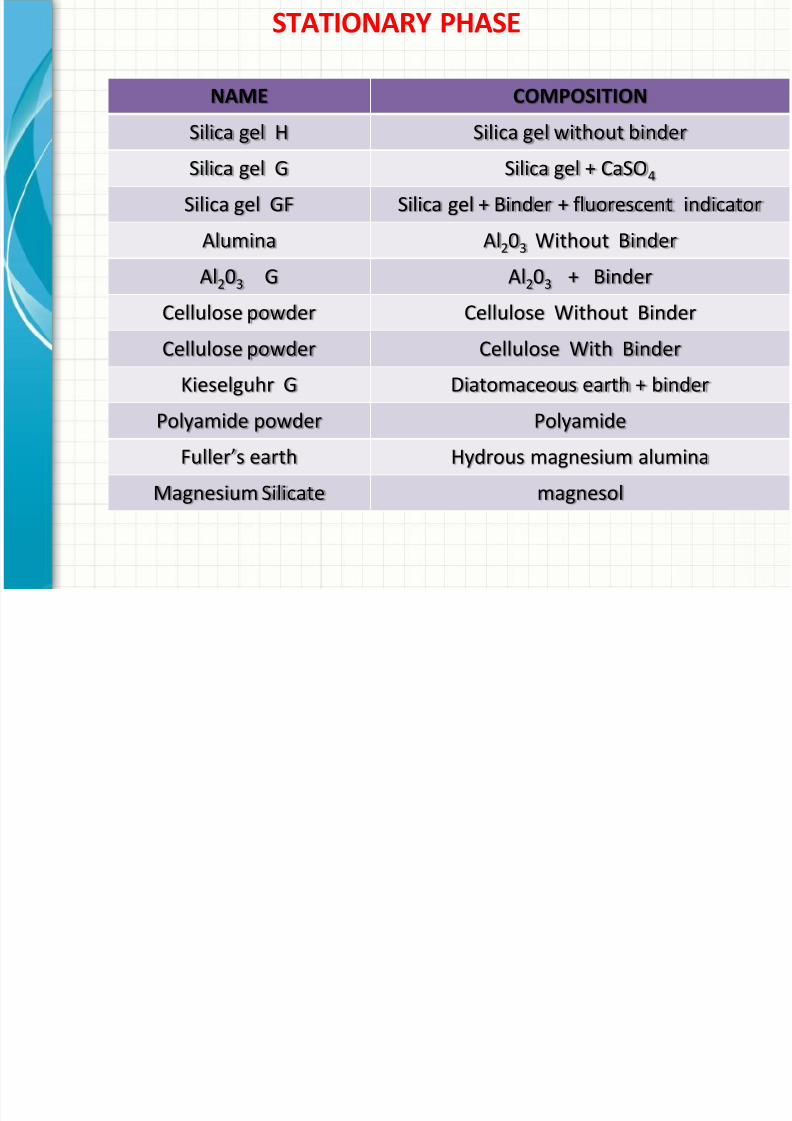
STATIONARY PHASE
NAME COMPOSITION
Silica gel H Silica gel without binder Silica gel G Silica gel + CaSO 4
Silica gel GF Silica gel + Binder + fluorescent indicator
Alumina Al203 Without Binder
Al203 G Al203 + Binder Cellulose powder Cellulose Without Binder
Cellulose powder Cellulose With Binder
Kieselguhr G Diatomaceous earth + binder
Polyamide powder Polyamide Fuller’s earth Hydrous magnesium alumina
Magnesium Silicate magnesol
8/10/2019 jo tlc.ppt
http://slidepdf.com/reader/full/jo-tlcppt 16/47
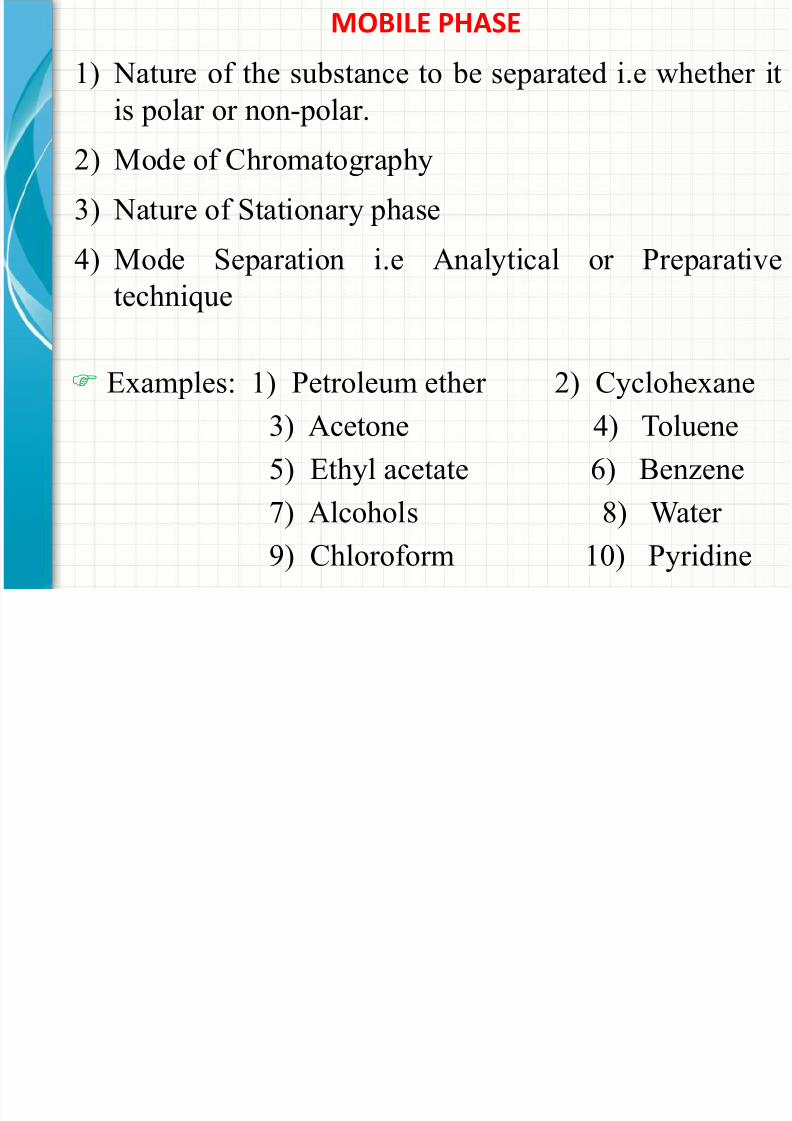
MOBILE PHASE
1) Nature of the substance to be separated i.e whether itis polar or non-polar.
2) Mode of Chromatography
3) Nature of Stationary phase
4) Mode Separation i.e Analytical or Preparativetechnique
Examples: 1) Petroleum ether 2) Cyclohexane
3) Acetone 4) Toluene5) Ethyl acetate 6) Benzene7) Alcohols 8) Water
9) Chloroform 10) Pyridine
8/10/2019 jo tlc.ppt
http://slidepdf.com/reader/full/jo-tlcppt 17/47
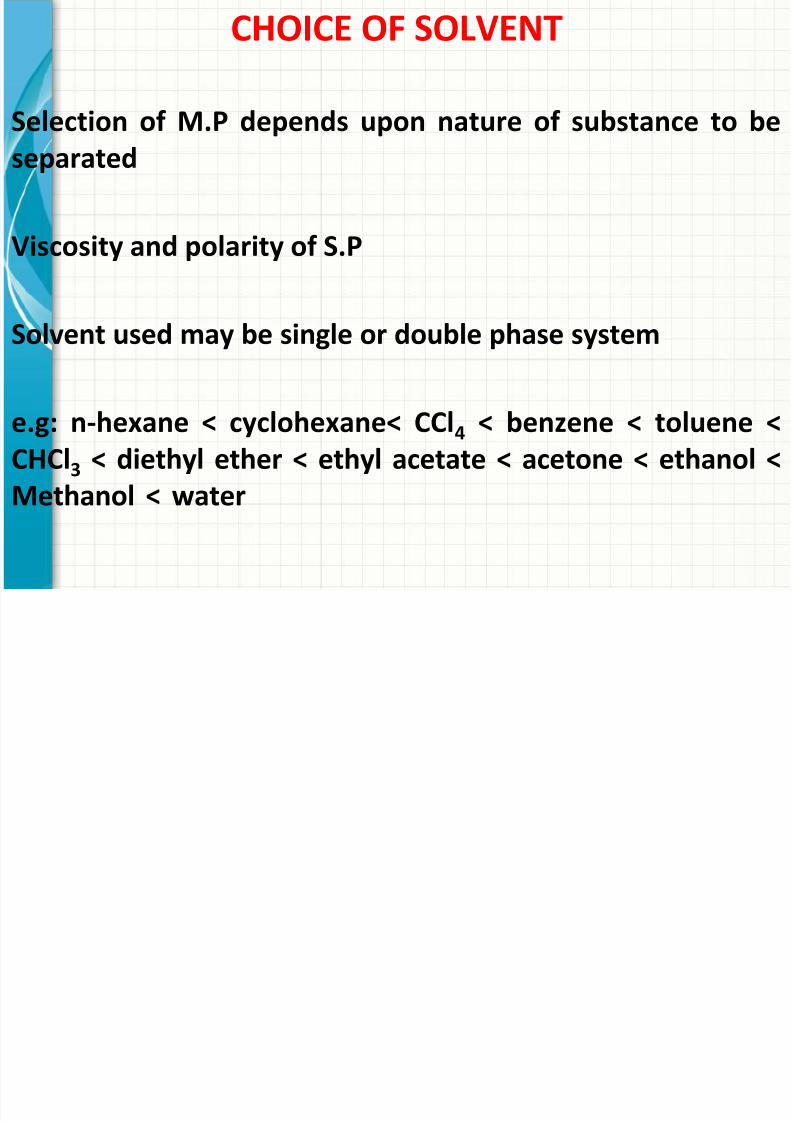
CHOICE OF SOLVENT
Selection of M.P depends upon nature of substance to beseparated
Viscosity and polarity of S.P
Solvent used may be single or double phase system
e.g: n-hexane < cyclohexane< CCl 4 < benzene < toluene <CHCl3 < diethyl ether < ethyl acetate < acetone < ethanol <Methanol < water
8/10/2019 jo tlc.ppt
http://slidepdf.com/reader/full/jo-tlcppt 18/47
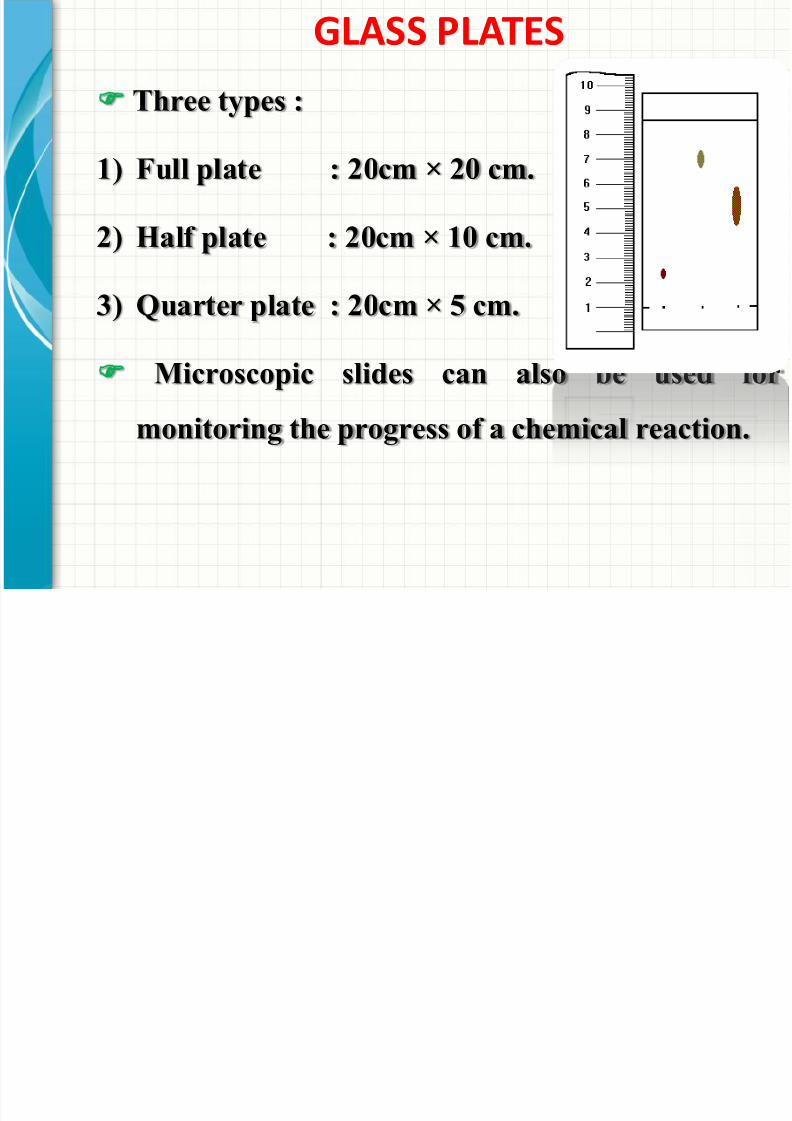
GLASS PLATES
Three types :
1) Full plate : 20cm × 20 cm.
2) Half plate : 20cm × 10 cm.
3) Quarter plate : 20cm × 5 cm.
Microscopic slides can also be used for
monitoring the progress of a chemical reaction.
8/10/2019 jo tlc.ppt
http://slidepdf.com/reader/full/jo-tlcppt 19/47
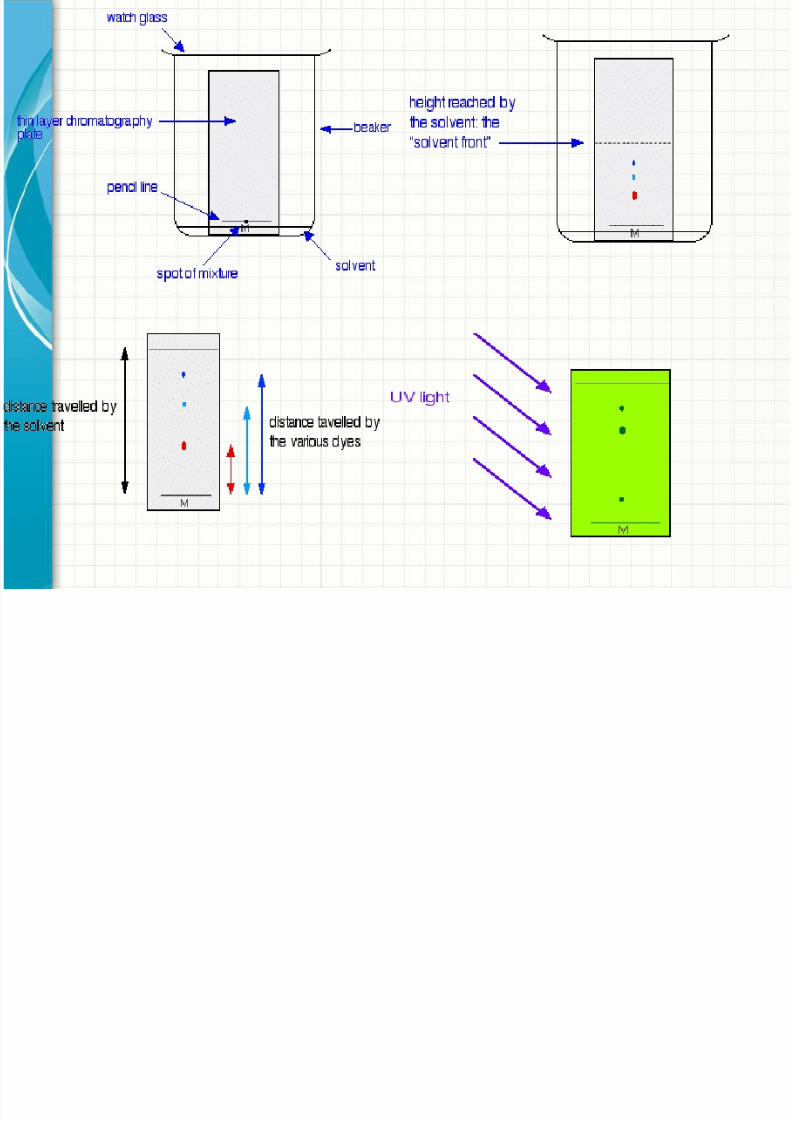
DEVELOPING A PLATETLC plate prepared , P in beaker or closed jar
Place a small amount of solvent in container.
Solvent level below the starting line of TLC, else spots dissolve
Low edge of plate dipped in solvent
Solvent travels up the matrix by capillarity
Moving components of samples at various rates because of theirdifferent degrees of interaction with matrix & solubility in thedeveloping solvent
8/10/2019 jo tlc.ppt
http://slidepdf.com/reader/full/jo-tlcppt 20/47
Non polar solvents force non polar compounds to topof plate because the compounds dissolve well & do notinteract with polar S.P
Allow the solvent to travel up the plate until 1 cmfrom top
Take the plate out and mark the solvent frontimmediately.
Do not run the solvent over edge of plate
Let solvent evaporate completely.
8/10/2019 jo tlc.ppt
http://slidepdf.com/reader/full/jo-tlcppt 21/47
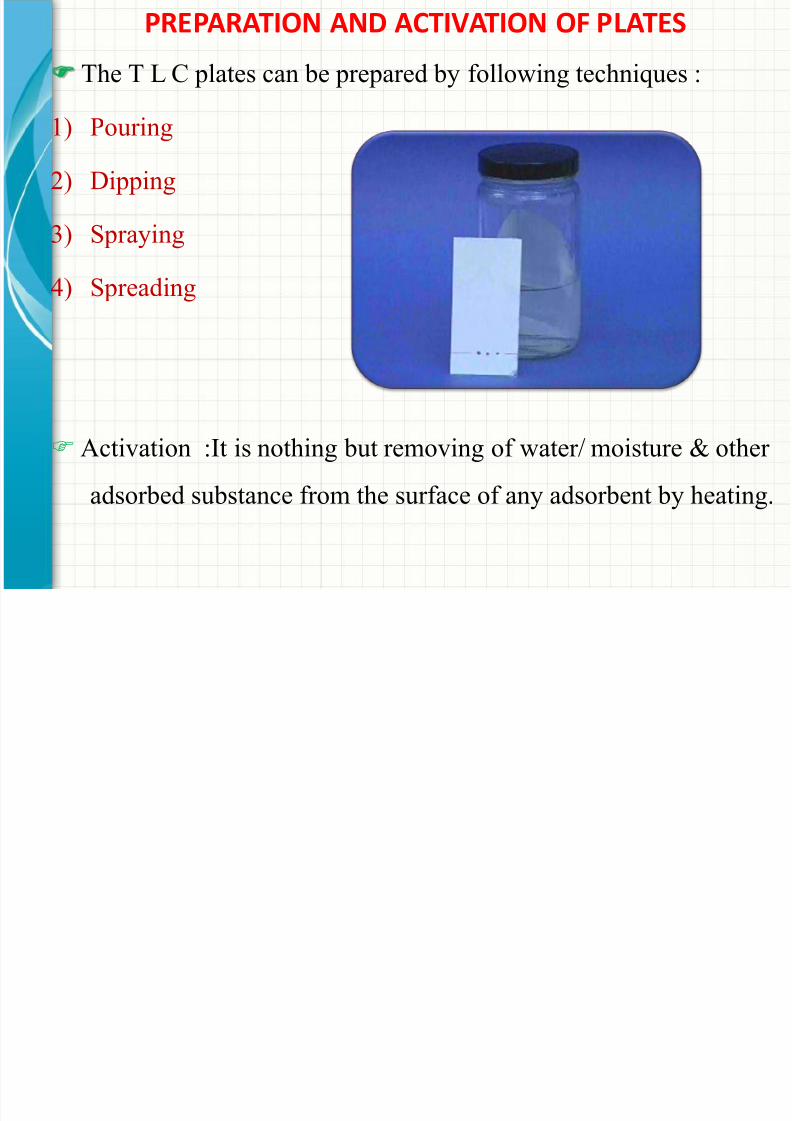
PREPARATION AND ACTIVATION OF PLATES
The T L C plates can be prepared by following techniques :
1) Pouring2) Dipping
3) Spraying
4) Spreading
Activation :It is nothing but removing of water/ moisture & other
adsorbed substance from the surface of any adsorbent by heating.
8/10/2019 jo tlc.ppt
http://slidepdf.com/reader/full/jo-tlcppt 22/47
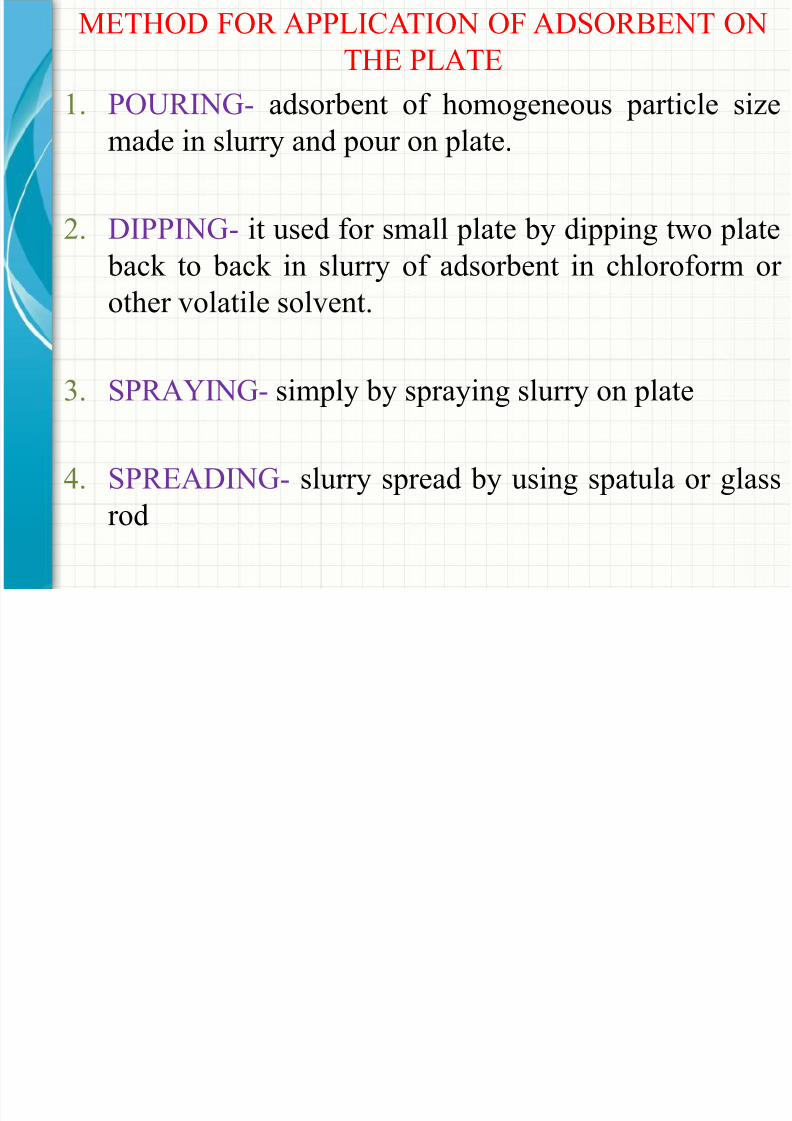
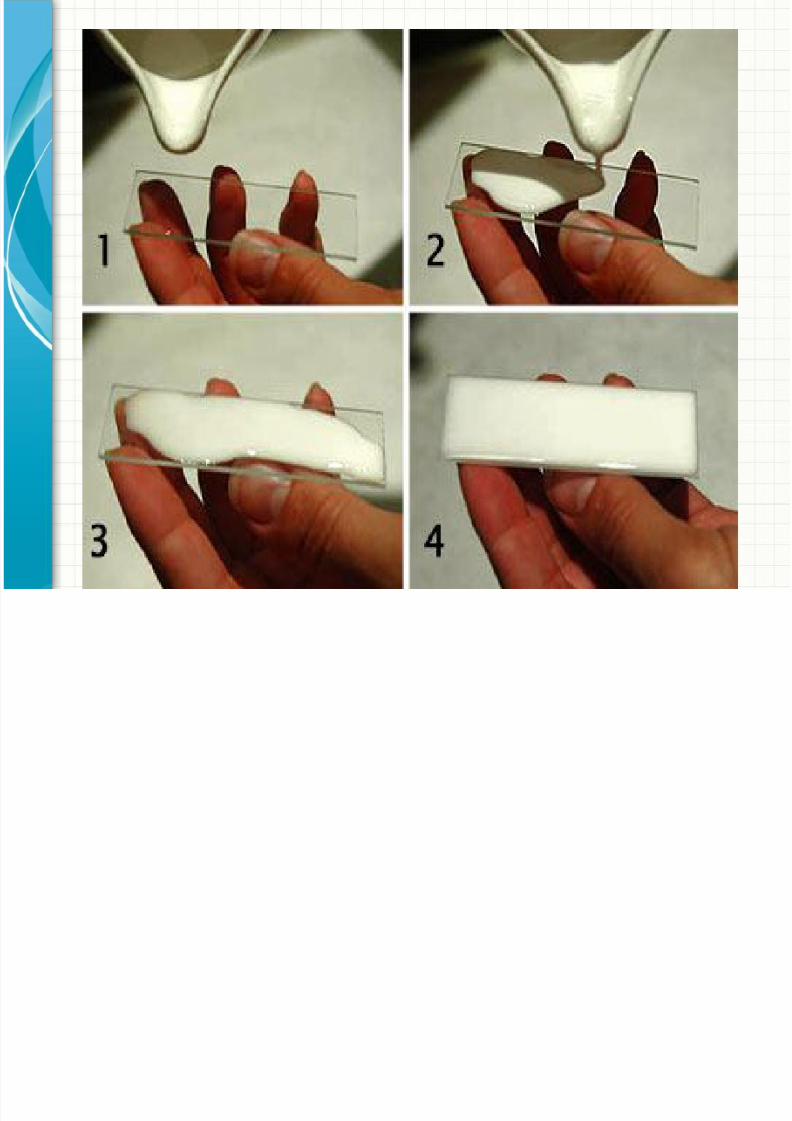
METHOD FOR APPLICATION OF ADSORBENT ONTHE PLATE
1. POURING- adsorbent of homogeneous particle size
made in slurry and pour on plate.
2. DIPPING- it used for small plate by dipping two plate
back to back in slurry of adsorbent in chloroform orother volatile solvent.
3. SPRAYING- simply by spraying slurry on plate
4. SPREADING- slurry spread by using spatula or glassrod
8/10/2019 jo tlc.ppt
http://slidepdf.com/reader/full/jo-tlcppt 23/47
ACTIVATION OF PLATE
8/10/2019 jo tlc.ppt
http://slidepdf.com/reader/full/jo-tlcppt 24/47
ACTIVATION OF PLATE
plate dried and activated by heating in oven for 30 minutesat 110 ° C
Thickness of adsorbent layer:
A. 0.1 – 0.25 mm for analytical purpose
B. 1- 2 mm for preparative TLC
APPLICATION OF SAMPLE
8/10/2019 jo tlc.ppt
http://slidepdf.com/reader/full/jo-tlcppt 25/47
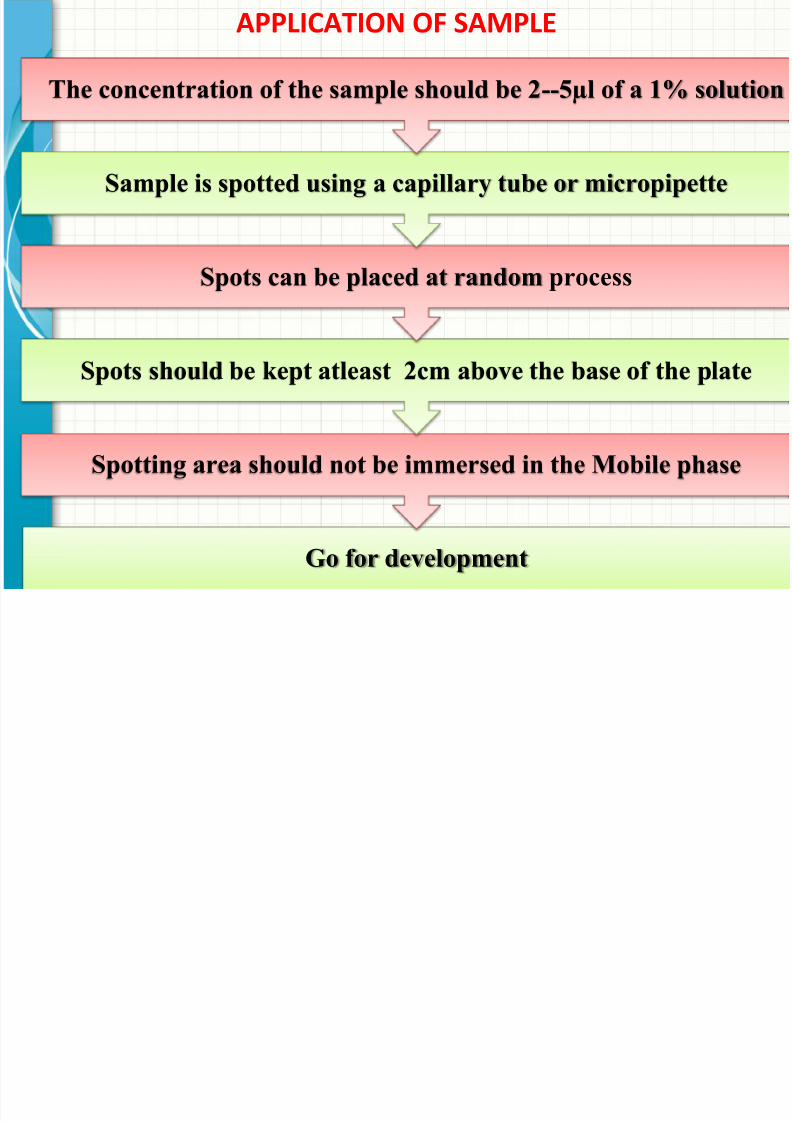
APPLICATION OF SAMPLE
Go for development
Spotting area should not be immersed in the Mobile phase
Spots should be kept atleast 2cm above the base of the plate
Spots can be placed at random process
Sample is spotted using a capillary tube or micropipette
The concentration of the sample should be 2 --5µl of a 1% solution
8/10/2019 jo tlc.ppt
http://slidepdf.com/reader/full/jo-tlcppt 26/47
8/10/2019 jo tlc.ppt
http://slidepdf.com/reader/full/jo-tlcppt 27/47
ADVANTAGESLow cost
Short analysis timeAll spots can be visualizedAdaptable to most pharmaceuticals
Uses small quantities of solventsRequires minimal trainingReliable and quickMinimal amount of equipment is neededDensitometers can be used to increase
accuracy of spot concentration
8/10/2019 jo tlc.ppt
http://slidepdf.com/reader/full/jo-tlcppt 28/47
TLC SUPERIOR OVER OTHER METHODSIt requires little equipment
Require little time for separationIt is more sensitiveVery small quantity of sample require for analysis
The method use for adsorption, partition, ionexchange chromatographyComponent which are separated can be recovered
easily .
Quantative separation of spot and zone are possibleFor identification is permittedSpraying of corrosive agent
8/10/2019 jo tlc.ppt
http://slidepdf.com/reader/full/jo-tlcppt 29/47
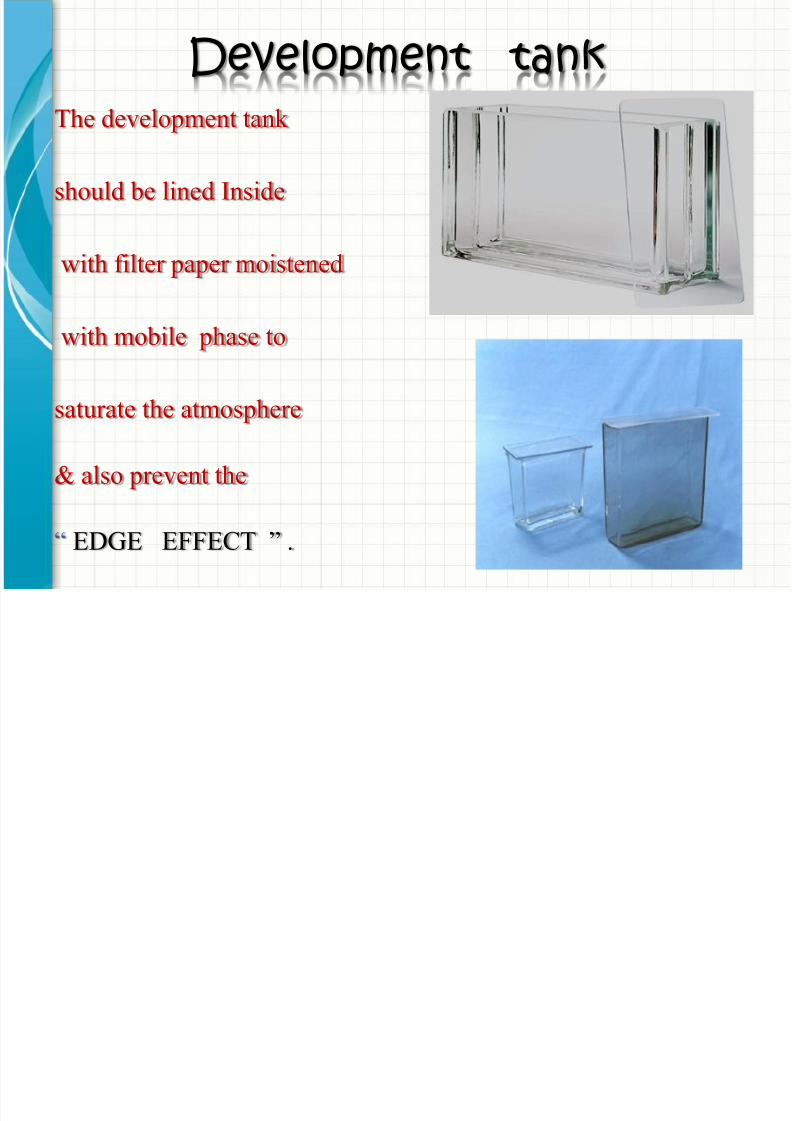
Development tankThe development tank
should be lined Inside
with filter paper moistened
with mobile phase to
saturate the atmosphere
& also prevent the
“ EDGE EFFECT ” .
8/10/2019 jo tlc.ppt
http://slidepdf.com/reader/full/jo-tlcppt 30/47
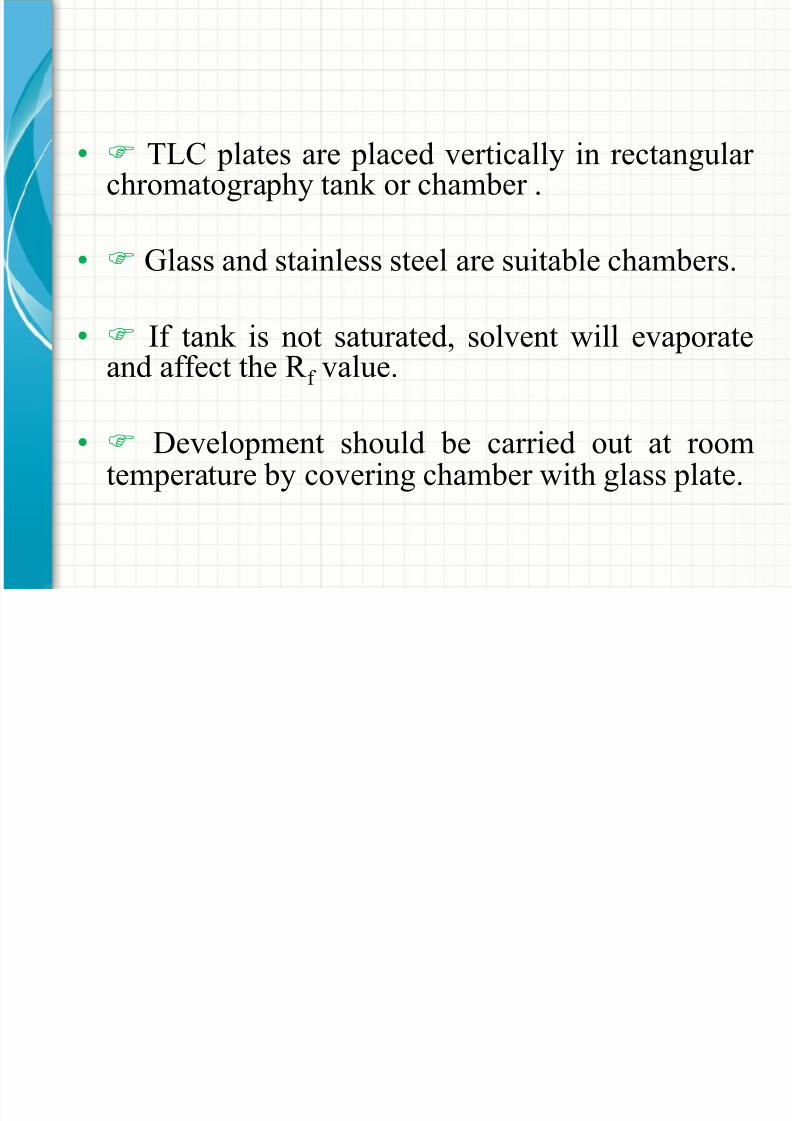
• TLC plates are placed vertically in rectangularchromatography tank or chamber .
• Glass and stainless steel are suitable chambers.
• If tank is not saturated, solvent will evaporateand affect the R f value.
• Development should be carried out at roomtemperature by covering chamber with glass plate.
DEVELOPMENT TECHNIQUE
8/10/2019 jo tlc.ppt
http://slidepdf.com/reader/full/jo-tlcppt 31/47
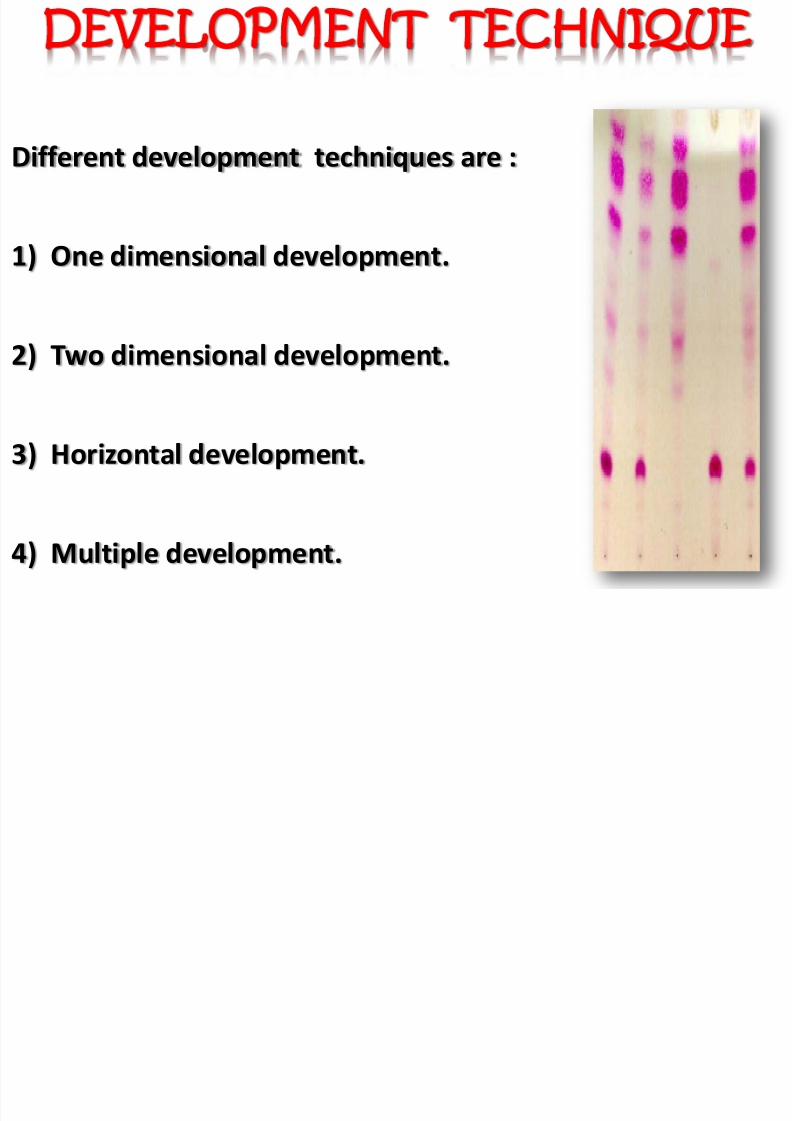
Different development techniques are :
1) One dimensional development.
2) Two dimensional development.
3) Horizontal development.
4) Multiple development.
DEVELOPMENT TECHNIQUE
DETECTING AGENTS
8/10/2019 jo tlc.ppt
http://slidepdf.com/reader/full/jo-tlcppt 32/47
Detecting agents are two types:(A)Non-Specific method
1) Iodine chamber method.2) Sulphuric acid spray method.3) UV chamber for fluorescent compounds.4) Using fluorescent stationary phase.
(B) Specific method
1) Ferric chloride.2) Ninhydrine in acetone.3) Dregendroff reagent.4) 3,5 – Dinitro benzoic acid.5) 2,4 - Dinitro phenyl hydrazine.
DETECTING AGENTS
DETECTION
8/10/2019 jo tlc.ppt
http://slidepdf.com/reader/full/jo-tlcppt 33/47
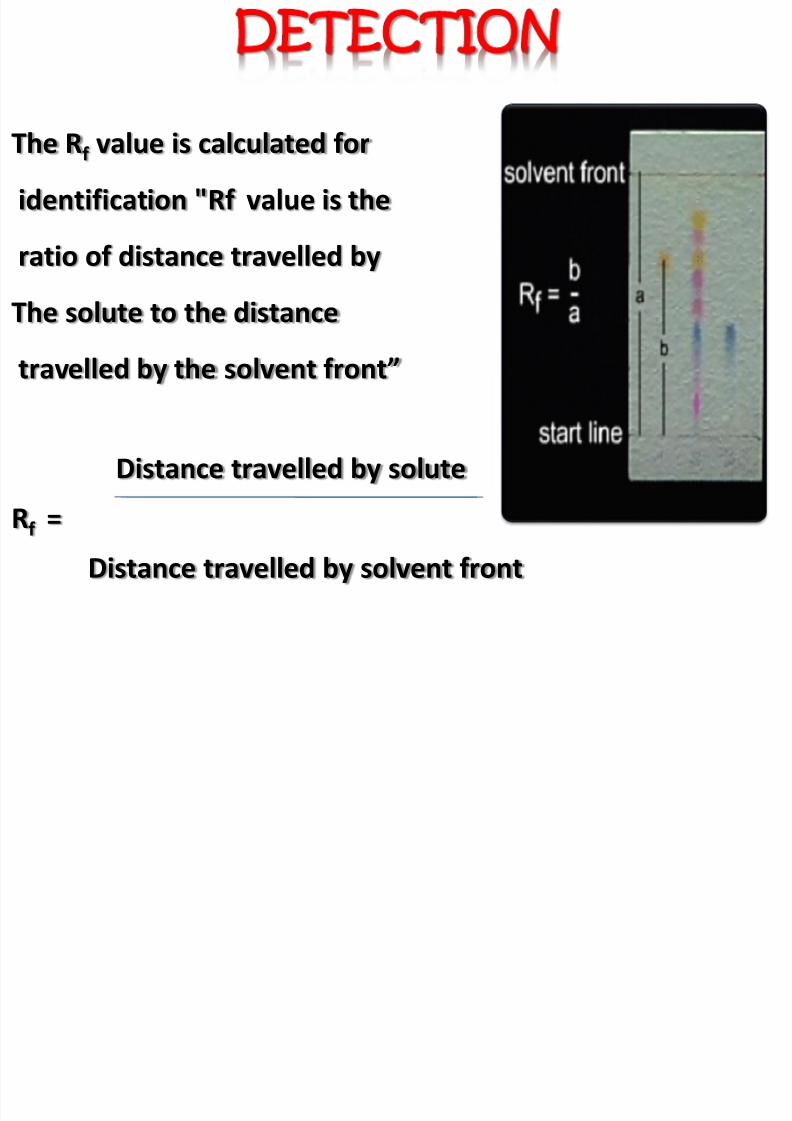
The R f value is calculated foridentification "Rf value is the
ratio of distance travelled by
The solute to the distance
travelled by the solvent front”
Distance travelled by solute
Rf =
Distance travelled by solvent front
DETECTION
R value is constant for each component only under
8/10/2019 jo tlc.ppt
http://slidepdf.com/reader/full/jo-tlcppt 34/47
Rf value is constant for each component only underidentical experimental condition.Polar compounds have low R f value
It depend on following factors-Nature of adsorbentMobile phase
ActivityThickness of layerThe temperature
EquilibrationLoadingDipping zone
Chromatographic technique
8/10/2019 jo tlc.ppt
http://slidepdf.com/reader/full/jo-tlcppt 35/47
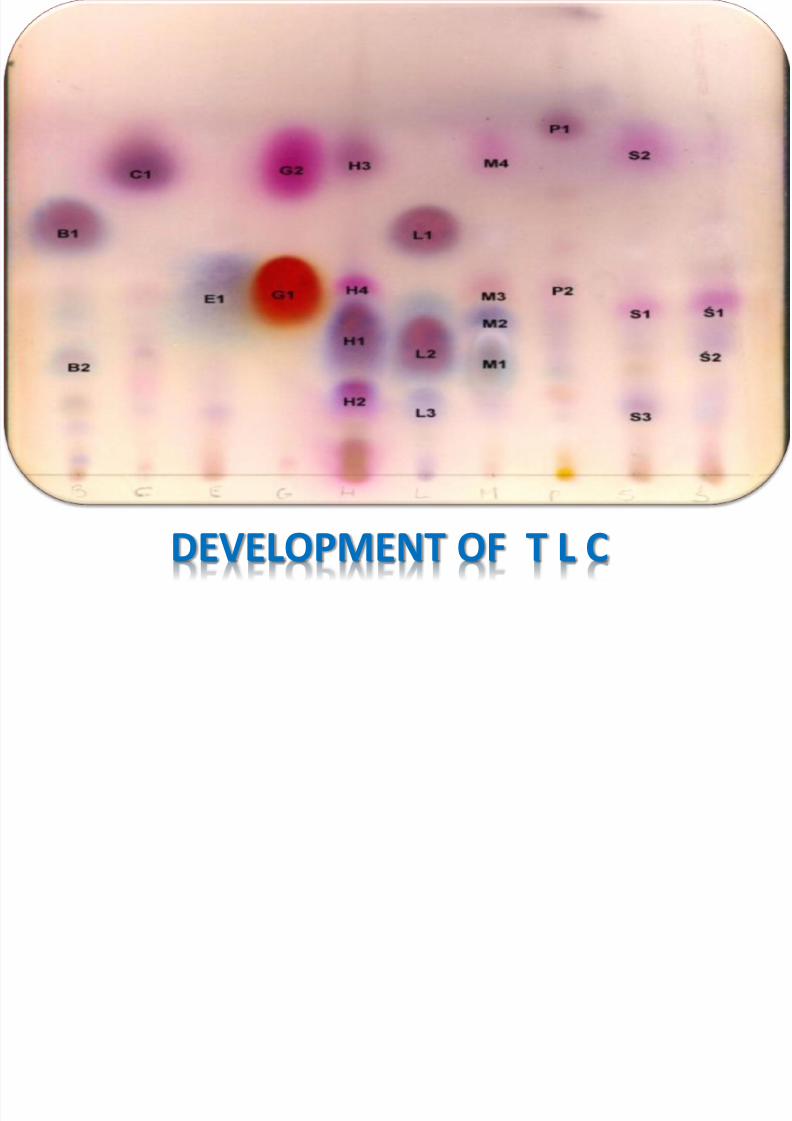
DEVELOPMENT OF T L C
VISUALIZATION METHOD
8/10/2019 jo tlc.ppt
http://slidepdf.com/reader/full/jo-tlcppt 36/47
VISUALIZATION METHODPrevious slide shows colored spots. Most of the time
spots wont show unless visualized.
Visualization is a method used to render TLC spots visible
A visualization method can be:
UV light
iodine vapors to stain spotscolored reagents to stain spotsreagents that selectively stain spots leaving othersunaffected
VARIOUS TECHNIQUES TO VISUALIZE THE COMPOUNDS:
8/10/2019 jo tlc.ppt
http://slidepdf.com/reader/full/jo-tlcppt 37/47
VARIOUS TECHNIQUES TO VISUALIZE THE COMPOUNDS:
1. Sulfuric acid/ heat: destructive, leaves charred blotsbehind
2. ceric stain: destructive, leaves a dark blue blotbehind polar compounds
3. Iodine: semi- destructive , iodine absorbs onto thespots , not permanent
4. UV light: non – destructive, long wavelength,(background plate green, spots dark) short
wavelength (background plate dark, spots glow)
Retention
8/10/2019 jo tlc.ppt
http://slidepdf.com/reader/full/jo-tlcppt 38/47
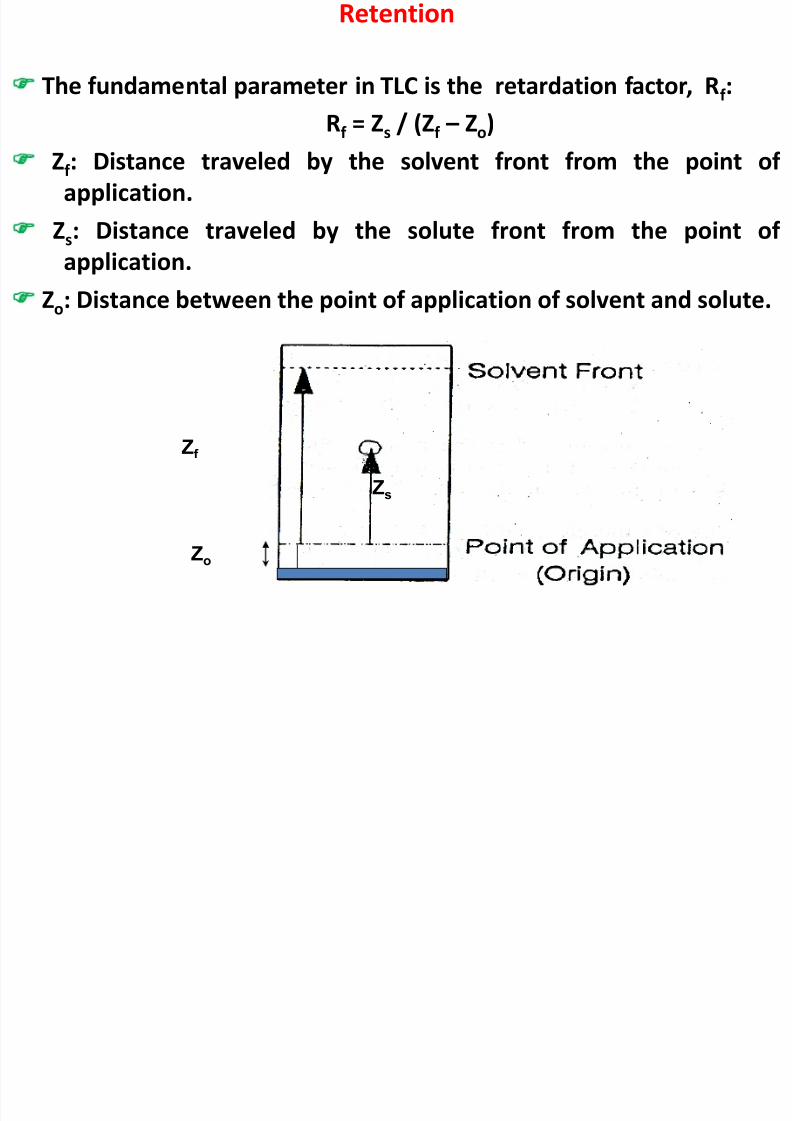
Retention
The fundamental parameter in TLC is the retardation factor, R f :Rf = Zs / (Z f – Zo)
Zf : Distance traveled by the solvent front from the point ofapplication.
Zs: Distance traveled by the solute front from the point ofapplication.
Zo: Distance between the point of application of solvent and solute.
Z f
Z s
Z o
The value of R f is related to the capacity factor (k) of the solute by
8/10/2019 jo tlc.ppt
http://slidepdf.com/reader/full/jo-tlcppt 39/47
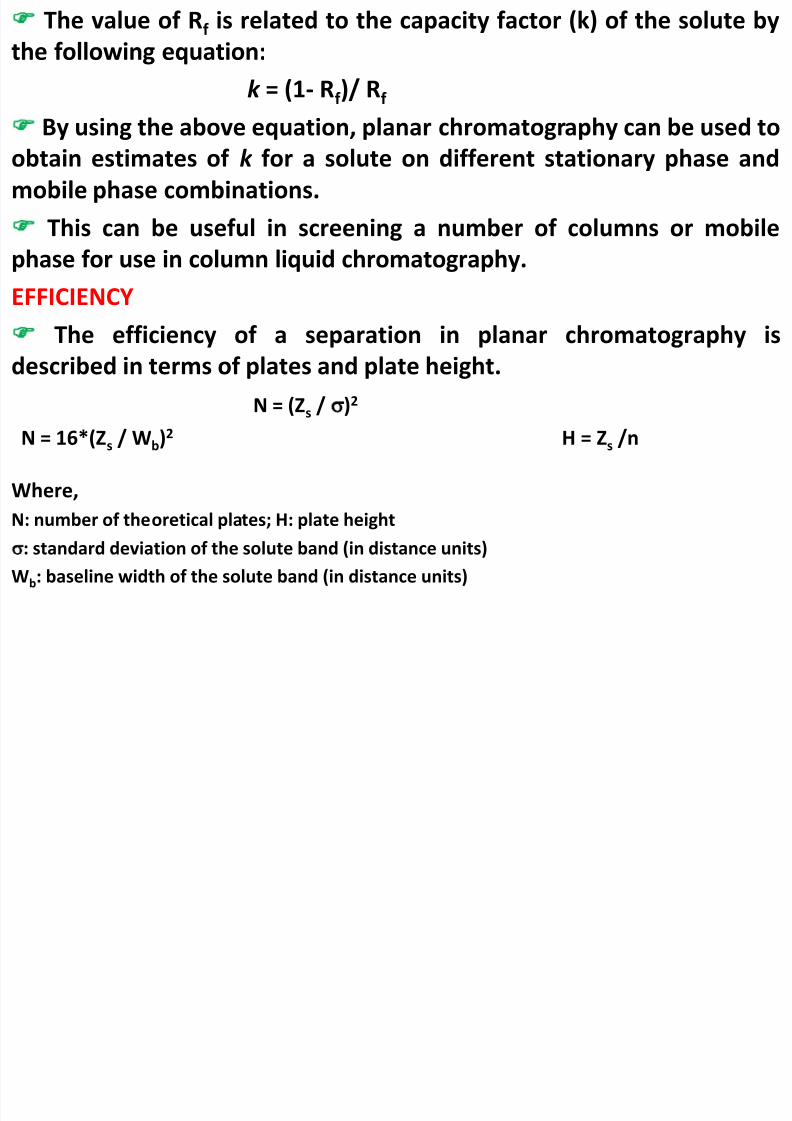
The value of R f is related to the capacity factor (k) of the solute bythe following equation:
k = (1- Rf )/ R f
By using the above equation, planar chromatography can be used toobtain estimates of k for a solute on different stationary phase andmobile phase combinations.
This can be useful in screening a number of columns or mobilephase for use in column liquid chromatography.EFFICIENCY
The efficiency of a separation in planar chromatography isdescribed in terms of plates and plate height.
N = (Zs / ) 2
N = 16*(Z s / W b)2 H = Zs /n
Where,N: number of theoretical plates; H: plate height
: standard deviation of the solute band (in distance units)
Wb: baseline width of the solute band (in distance units)
Note that the efficiency of a planar system is not constant, but
8/10/2019 jo tlc.ppt
http://slidepdf.com/reader/full/jo-tlcppt 40/47
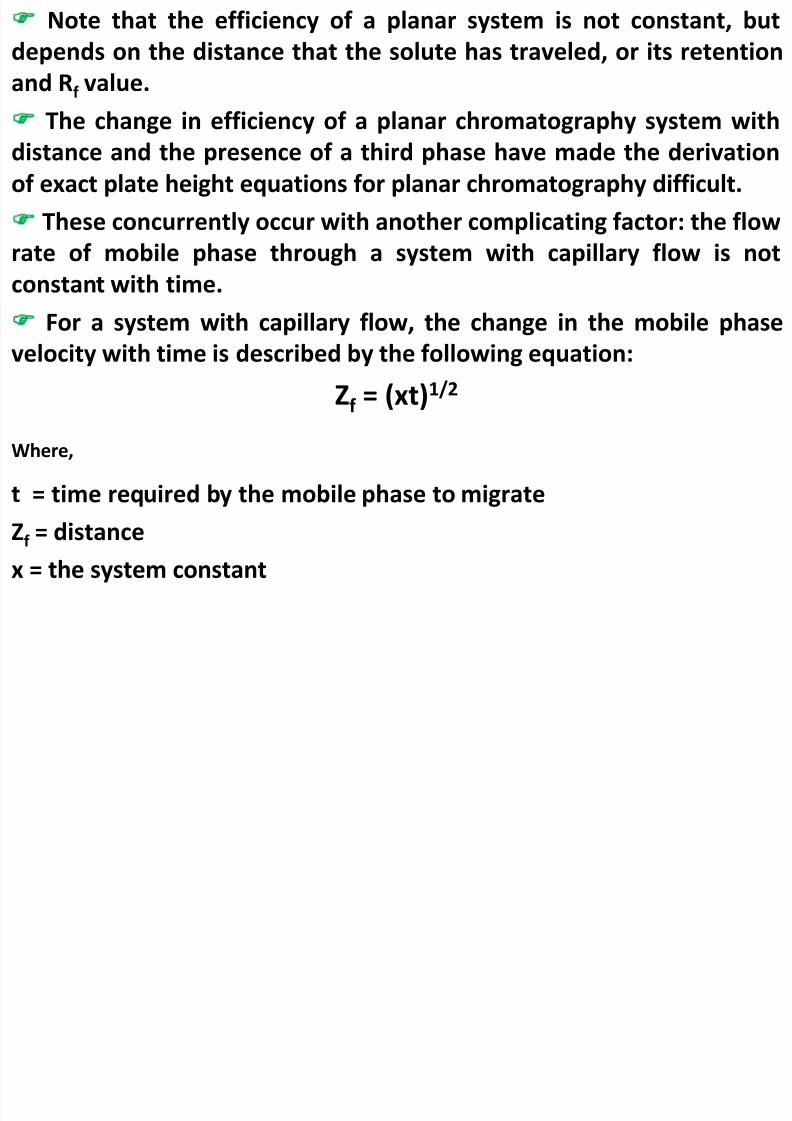
Note that the efficiency of a planar system is not constant, butdepends on the distance that the solute has traveled, or its retentionand R f value.
The change in efficiency of a planar chromatography system withdistance and the presence of a third phase have made the derivationof exact plate height equations for planar chromatography difficult.
These concurrently occur with another complicating factor: the flowrate of mobile phase through a system with capillary flow is not
constant with time.For a system with capillary flow, the change in the mobile phase
velocity with time is described by the following equation:
Zf = (xt) 1/2
Where,
t = time required by the mobile phase to migrateZf = distancex = the system constant
PERFORMING THE TLC ANALYSIS: CALCULATE THE RF VAL
8/10/2019 jo tlc.ppt
http://slidepdf.com/reader/full/jo-tlcppt 41/47
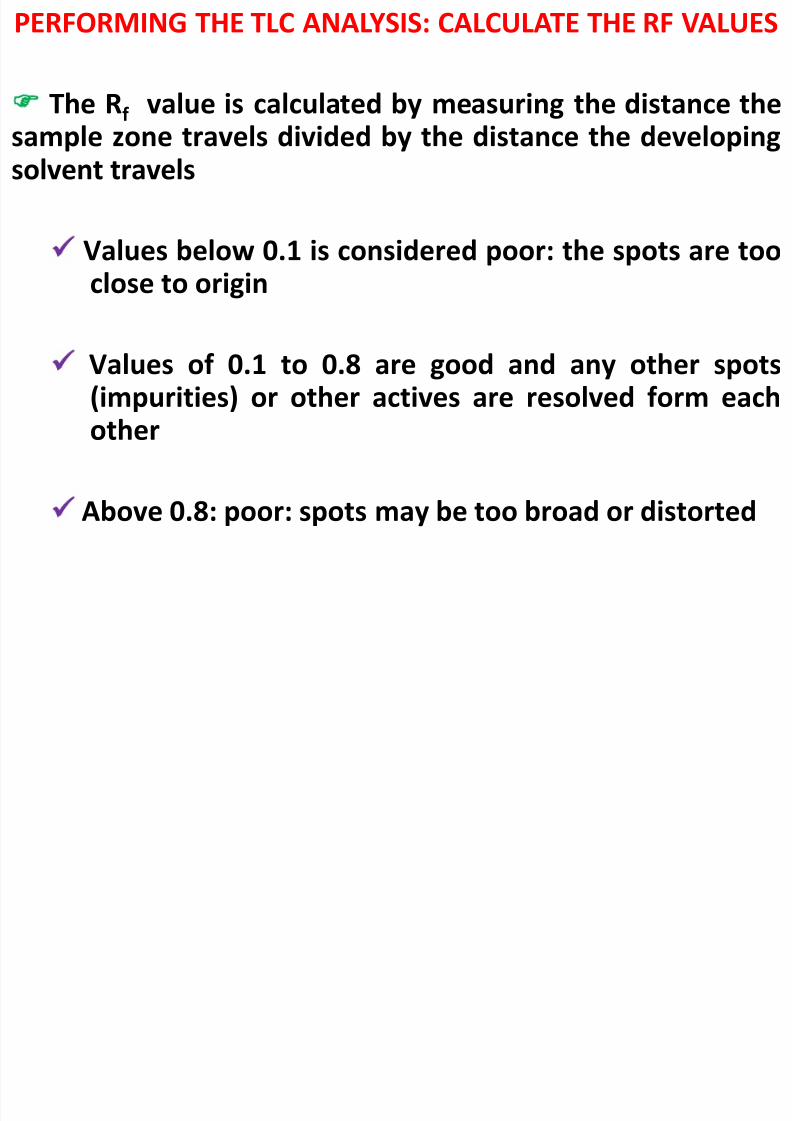
PERFORMING THE TLC ANALYSIS: CALCULATE THE RF VAL
The R f value is calculated by measuring the distance the
sample zone travels divided by the distance the developingsolvent travels
Values below 0.1 is considered poor: the spots are too
close to origin
Values of 0.1 to 0.8 are good and any other spots(impurities) or other actives are resolved form eachother
Above 0.8: poor: spots may be too broad or distorted
APPLICATIONS USES
8/10/2019 jo tlc.ppt
http://slidepdf.com/reader/full/jo-tlcppt 42/47
1) Separation of mixture of drug ofchemical,biological,plant origin.
2) Separation of Carbohydrates, vitamin, antibiotics, proteins, etc.
3) Identification of drug. Ex :Amoxicillin, Levodopa
4) Detection of foreign substances.5) To detect the decomposition products of drug.
APPLICATIONS USES
8/10/2019 jo tlc.ppt
http://slidepdf.com/reader/full/jo-tlcppt 43/47
6). To determine how many compounds are there ina mixture – is it real pure?7). To determine the best solvent conditions forseparation on column8). To identify the substances being studied9). To monitor the compositions & appropriateconditions of the fractions collected from ColumnChromatography10). To monitor the progress of the reaction11). To determine identity of two substances
12). To determine effectiveness of purification
TLC TROUBLESHOOTING
8/10/2019 jo tlc.ppt
http://slidepdf.com/reader/full/jo-tlcppt 44/47
TLC TROUBLESHOOTING1. CAUSE:the compound runs as streak rather than a spot
REASON: the sample was overloaded
Run the TLC again after diluting your sampleSample might contain many componentsIt creates many spots which run together & appear asstreak
2. CAUSE:the sample runs as a smear or a upward crescent (moon)REASON: compounds which possess strongly acidic or basic
groups (amines or carboxylic acids) show this behavior
Add few drops of ammonium hydroxide(amines) or aceticacid (carboxylic acids) to the eluting solvent to obtainclear plates.
3. CAUSE:the sample runs as a downward crescent (moon)
8/10/2019 jo tlc.ppt
http://slidepdf.com/reader/full/jo-tlcppt 45/47
3. CAUSE:the sample runs as a downward crescent (moon)REASON: adsorbent was disturbed during spotting caused4. CAUSE: plate solvent front runs crookedly (curved)
REASON: adsorbent flaked of the sides of plateAdsorbent moved towards the side of the plateor touching the sides of the container or the
paper used to saturate the container as platedevelops.Crookedly run plates makes it harder to measurethe R f value accurately.
5. CAUSE:many random spots are seen on the plateREASON: accidently check not any organic compound on
the plate or any new foreign substance touched
incidentally.
6. CAUSE: no spots seen on plate
8/10/2019 jo tlc.ppt
http://slidepdf.com/reader/full/jo-tlcppt 46/47
p pREASON: you might have not spotted enough compound,
perhaps because the solution of the compound is toodilute.Try concentrating the solution or else spot it severaltimes in one place allowing solvents to dry b/w capillariesSome compounds do not show under UV lightTry another method of visualization of platePerhaps you don’t have any compounds because theexperiment did not go as well planned
If solvent level in developing jar is deeper than the originof the TLC plateSolvent will dissolve the compounds into the solventreservoir
It allows them to move up the plate by capillary actions.
Thus you will not see the spots after the plate is developed.

8/10/2019 jo tlc.ppt
http://slidepdf.com/reader/full/jo-tlcppt 47/47
THANK YOU