Embed Size (px)
Citation preview
Jl.MH. Thamrin No.2 Jakarta 10110 - Indonesiahttp://www.bi.go.id

BANK INDONESIAFor further information, please contact:Economic Outlook & Policy DisseminationBureau of Monetary Policy Directorate of Economic Research and Monetary Policy
Telephone : +62 61 3818163 +62 21 3818206Fax. : +62 21 3452489E-mail : [email protected] : http://www.bi.go.id
i
MONETARY POLICY REPORTBANk INdONEsIA
The Monetary Policy Report is published quarterly by Bank Indonesia after the Board
of Governors’ Meetings in January, April, July, and October. In addition to fulfilling the
mandate of article 58 of Act Number 23 of 1999 concerning Bank Indonesia, amended
by Act No. 3 of 2004, the report has two main purposes: (i) to function as a tangible
product of a forward-looking working framework in which formulation of monetary
policy is based on economic and inflation forecasts; and (ii) as a medium for the Board
of Governors of Bank Indonesia to present to the public the various policy considerations
underlying its monetary policy decisions.
The Board of Governors
Darmin Nasution Senior Deputy Governor
Hartadi A. Sarwono Deputy Governor
Siti Ch. Fadjrijah Deputy Governor
S. Budi Rochadi Deputy Governor
Muliaman D. Hadad Deputy Governor
Ardhayadi Mitroatmodjo Deputy Governor
Budi Mulya Deputy Governor
MONETARY POLICY REPORTQUARTER III-2009

ii
MONETARY POLICY REPORTBANk INdONEsIA
iii
MONETARY POLICY REPORTBANk INdONEsIA
Monetary Policy Strategy
Underlying Principles
Under the ITF, the inflation target is established as the overriding objective and nominal anchor for monetary policy. In this regard, Bank Indonesia has adopted a forward looking strategy by guiding the present monetary policy response for achievement of a medium-term inflation target.
The application of the ITF does not mean that monetary policy disregards economic growth. The basic monetary policy paradigm of striking the optimum balance between inflation and economic growth is retained in both setting the inflation target and in the monetary policy response by focusing on achievement of low, stable inflation in the medium to long-term.
The Inflation Target
After consultations with Bank Indonesia, the Government has determined and announced the CPI inflation target at 5%+1%, 4.5%+1% and 4%+1% for 2008, 2009 and 2010. The inflation target is consistent with the process of disinflation aimed at medium to long-term inflation competitive with other nations at about 3%.
Monetary Instruments and Operations
The BI Rate is the published policy rate reflecting the monetary policy stance adopted by Bank Indonesia. The BI Rate is a signal for achieving the medium to long-term inflation target and is announced periodically by Bank Indonesia for a specific period. To strengthen the operational framework for monetary policy, Bank Indonesia changed from use of the 1-month SBI rate as the operational target to the overnight interbank rate with effect from 9 June 2008. In monetary operations, the BI Rate is implemented through liquidity management on the money market to achieve the monetary policy operational target, reflected in movement in the overnight interbank money market rate. To enhance the effectiveness of liquidity management on the market, a set of standing facilities in combination with an interest rate corridor is employed in day-to-day monetary operations.
Policymaking Process
The BI Rate is determined by the Board of Governors in the Monthly Board of Governors’ Meeting. In unforeseen circumstances, the monetary policy stance may be adjusted in advance of the Monthly Board of Governors’ Meeting in a weekly Board of Governors’ Meeting. Changes in the BI Rate essentially depict the Bank Indonesia monetary policy response for guiding the forecasted level of inflation within the limits of the established inflation target.
Transparency
Monetary policy is regularly communicated to the public through customary media for communication, such as statements to the press and market actors, website postings and publication of the Monetary Policy Report (MPR). This transparency is aimed at building improved understanding and shaping public expectations of the economic and inflation outlook and the monetary response taken by Bank Indonesia.
Coordination with the Government
For the purpose of coordination in inflation targeting, monitoring and control, the Government and Bank Indonesia have established a team of officials representing the various relevant agencies. The task of the Team is to deliberate and recommend the necessary policy actions for the Government and Bank Indonesia in managing inflationary pressures for achievement of the established inflation target.
Steps for Reinforcing Monetary Policy with the Overriding Objective of Price Stability (Inflation Targeting Framework)
In July 2005, Bank Indonesia launched a reinforced monetary policy framework consistent with the Inflation Targeting Framework (ITF), encompassing four key elements: (1) use of the BI Rate as the policy reference rate, (2) anticipatory monetary policymaking process, (3) more transparent communications strategy and (4) closer policy coordination with the Government. These measures are intended to strengthen monetary policy effectiveness and governance in order to achieve the overriding objective of price stability in support of sustainable economic growth and greater public prosperity.
Enhanced Monetary Policy Measures Under Inflation Targeting Framework
In July 2005, Bank Indonesia implemented and enhanced monetary policy measures within the Inflation Targeting Framework (ITF) which encompasses four main areas: the use of the BI rate as an operational target, enhanced decision making process, more transparent communications strategy, and strengthened policy coordination with the Government. The measures is intended to strengthen the effectiveness and to provide good governance to its monetary policy making to achieve the price stability needed to support suistainable economic growth and attain social welfare.

iv
MONETARY POLICY REPORTBANk INdONEsIA
v
MONETARY POLICY REPORTBANk INdONEsIA
Foreword
The ongoing recovery in the global economy showed indications of renewed strength during Q3/2009,
while taking hold in more countries. The most dramatic gains were visible in Asia’s emerging markets, led by
China. In developed economies, the rate of economic contraction has begun to ease. Various global macroeconomic
indicators point to strengthening optimism for global economic recovery. Despite this, risks continue to daunt the
process of world economic recovery, due to high levels of unemployment.
Recovery in the world economy is also reflected in the upswing on global financial markets. During Q3/2009,
risks began to ease in developed and developing economies alike, as reflected in the steady decline the Currency
Default Swap (CDS) risk indicator. Global stock markets maintained an upward trend in Q3/2009, despite sustaining
price correction.
At home, the Indonesian economy is moving forward in tandem with the progressive improvement in the
global economy. Estimated GDP growth in Q3/2009 came to 4.2%, ahead of the previous 3.9% forecast. On the
demand side, rising consumption was driven by growing export revenues, more robust consumer confidence and
seasonal factors with the onset of the Eid-ul-Fitr festive season. Modest improvement is also reported in investment,
although growth remains slim. Externally, initial estimates point to invigorated export growth in line with the improving
economic conditions in trading partner nations and upward movement in global commodity prices. Growth in imports,
however, remains minimal. On the supply side, manufacturing and the trade, hotels and restaurants sector reported
higher growth in Q3/2009 in line with the Eid-ul-Fitr religious festivities. Regional economic assessments by Bank
Indonesia also offer confirmation of strengthening trend in the domestic economy. Various regions in Indonesia, each
marked by specific characteristics in the local economy, provided key support for domestic economic growth.
Regarding prices, the downward inflation trend continued in Q3/2009, with inflation easing to 2.83%
(yoy). The modest inflationary pressure during the quarter is explained by improvement in inflation expectations and
appreciation in the rupiah. At the same time, demand-side pressure remains minimal, despite indications of renewed
expansion. In regard to non-fundamentals, the plentiful availability of food stuffs during Q3/2009 helped contain
upward pressure on prices.
The Governor of Bank Indonesia
vi
MONETARY POLICY REPORTBANk INdONEsIA
The improvement in the global economy, most importantly in trading partner nations, augurs for positive
impact on Indonesia’s balance of payments in Q3/2009. The recovery in the global economy and particularly
in trading partners, coupled with the upward trend in commodity prices, offers potential for even stronger export
performance. At the same time, imports are forecasted to maintain modest growth due to the slow pace of growth
in investment. Initial figures suggest potential for a current account surplus in Q3/2009. Similarly, in the capital and
financial account, foreign capital inflows and portfolio investments charted another surplus despite the effect of
temporary portfolio rebalancing during August 2009.
In other developments, the decision by Moody’s to upgrade Indonesia’s sovereign credit rating from
Ba3 to Ba2 has had a positive effect on capital inflows and cost of financing. Added to this, Indonesia, like
other IMF members, received an allocation of SDR1.74 billion, equivalent to USD2.7 billion. In response to these
developments, international reserves reached USD62.3 billion at end-September 2009, equivalent to 6.2 months of
imports and servicing of official debt.
The improvement in Indonesia’s balance of payments and positive sentiment on global financial markets
has given added stability to the rupiah. Despite a temporary downturn at end-August 2009, the exchange rate
has gained value while charting reduced volatility. The appreciation in the rupiah is bolstered by the continued strength
of domestic economic fundamentals reflected in the balance of payments surplus, attractive investment yields and
improving perceptions of risk, all representing key attractions for foreign investors. Added to this, positive global
economic sentiment has contributed to the high volume of capital inflows in Indonesia.
Conditions in the domestic financial sector have improved in response to the recent developments outlined
above. Overall financial sector performance is on the rise, accompanied by steady improvement in monetary policy
transmission. On the stock market, developments in Q3/2009 were marked by share price gains. The strengthening
fundamentals in the domestic economy alongside escalating global commodity prices have fuelled buying in mining
stocks, with significant positions taken by foreign and domestic investors. On the bond market, yield on Indonesian
government securities has narrowed in response to downward movement in the BI Rate and growing investor interest
in these instruments. However, yield on longer-term government securities (above 15 years) remains high due to
lingering perceptions of high risk.
In the banking sector, conditions are relatively stable with Indonesia’s banks beginning to show improved
response to monetary policy signals. At the micro level, banks remain in stable condition as indicated by the
comfortably high level of the Capital Adequacy Ratio (CAR) in August 2009 alongside subdued, low levels of Non-
Performing Loans gross and net. On the other hand, banks continue to show better response in their interest rates,
as indicated by the decline in deposit rates that will ultimately lead to further reductions in loan interest rates. The
response in lower rates for credit is expected to pave the way for more optimum volume of lending by the banking
system. Alongside this, the banking system reports adequate levels of liquidity.
Looking forward, the Indonesian economy shows potential to outperform earlier growth forecasts for
2009 and 2010. Key to this is continued robust expansion in household consumption, better than predicted export
performance and the Government stimulus. Export performance is improving in response to the strengthening
recovery in the global economy and mounting prices for oil, natural gas and non-oil and gas commodities. Investment
is predicted to maintain limited growth due to the present low levels of capacity utilisation. The Government fiscal
stimulus also has capacity to boost domestic economic performance, as reflected in the high levels of Government
consumption and investment. On the supply side, estimations suggest that growth in various sectors has embarked
on an accelerating trend, consistent with rising domestic and external demand in tradable sectors. In response to
vii
MONETARY POLICY REPORTBANk INdONEsIA
these developments, the Indonesian economy is forecasted to chart 4.5%-4.5% growth in 2009, ahead of the earlier
3.5%-4.0% prediction. Regarding 2010, Bank Indonesia projects economic growth to reach 5.0%-5.5%. Risks
that call for vigilance include the uncertainty looming over recovery in world trade, given the unmistakeable signs
of protectionist motives and domestic economic orientation in developed nations and a renewed surge in world oil
prices fuelled by speculation.
Indonesia’s balance of payments is forecasted to chart an improved surplus in 2009 and 2010. Exports are
set to maintain growth on the back of world economic recovery and mounting commodity prices. On the domestic
front, imports are expected to maintain slim growth as a result of flagging investment activity. In 2010, the current
account is forecasted to post another surplus. In other areas, the capital and financial account will be bolstered by
more conducive domestic and external conditions compared to earlier periods. The secure condition of domestic
fundamentals, improving perceptions of risk and continued keen investor interest in domestic assets are expected to
boost capital inflows into Indonesia through portfolio channels and foreign direct investment.
Concerning the inflation outlook, the downward trend in 2009 is forecasted to continue, but with potential
for normal conditions to return in 2010. In 2009, CPI inflation is predicted to come within the inflation targeting
range set at 4.5%+ 1%. Looking ahead to 2010, the outlook is for CPI inflation to return to normal at 5%+ 1% in
response to resurgent domestic economic activity, rising imported inflation driven by escalating commodity prices
and renewed inflation expectations.
After factoring in these developments, the Bank Indonesia Board of Governors Meeting convened on 5
October 2009 decided to hold the BI Rate at 6.5%. The decision to leave the BI Rate unchanged was taken after
the Board of Governors’ Meeting concluded that the rate at this level would be consistent with achievement of the
5%±1% inflation target for 2010. The present policy stance is also regarded as still conducive to the economic recovery
and banking intermediation processes.
Jakarta, October 2009
On behalf of
THE GOVERNOR OF BANK INDONESIA
Darmin Nasution

viii
MONETARY POLICY REPORTBANk INdONEsIA
ix
Monetary Policy Report - Quarter III-2009Contents
MONETARY POLICY REPORTBANk INdONEsIA
Contents
1. General Review ............................................................................ 1
2. Latest Macroeconomic Indicators ................................................ 5
Deveopments In The World Economy ............................................. 5
Economic Growth ........................................................................... 6
Balance of Payments ...................................................................... 15
3. Monetary Indicators and Policy, Quarter III-2009 ...................... 17
Rupiah Exchange Rate ........................................................................................ 17
Inflation ................................................................................................................. 19
MonetaryPolicy ................................................................................................... 21
Box:SecondaryStatutoryReservesRequirementEffectivefrom24October2009 . 26
4. The Indonesian Economic Outlook ............................................. 27
AssumptionsandScenarios ................................................................................ 27
EconomicGrowthOutlook ................................................................................... 27
Inflation Forecast ............................................................................. 36
5. Monetary Policy Response, Q3/2009 .......................................... 38
Statistics ............................................................................................ 39

x
Monetary Policy Report - Quarter III-2009 Contents
MONETARY POLICY REPORTBANk INdONEsIA
General Review
1
1. General Review
The ongoing recovery in the global economy has helped bring improvement to the
domestic economy, which now has potential to outperform earlier forecasts for
both 2009 and 2010. In 2009, the economy is expected to chart 4.0%-4.5% growth,
ahead of the earlier 3.5%-4.0% prediction. Following this, the economic growth
forecast for 2010 is 5.0%-5.5%.
The recovery process in the global economy is showing indications of increased
momentum across a broader range of countries. The most dramatic gains are visible
in Asia’s emerging markets, led by China. In the developed world, economic contraction
has eased. A wide range of global macroeconomic indicators points to growing optimism
for global economic recovery. Retail sales, capacity utilisation and production indices have
begun to climb in advanced nations and emerging market countries alike. Despite the
improvement, the recovery continues to be daunted by risks. The risk of sustained high
unemployment in developed economies poses hurdles to further improvement in global
economic performance.
Recovery in the world economy is also reflected in the improving condition of global
financial markets. The risks daunting advanced economies and the developing world
receded further during Q3/2009, as evident in the progressive easing in the risk indicator of
Currency Default Swaps (CDS). The global stock market forged ahead during the quarter,
despite some temporary correction. In the real sector, optimism for economic recovery
and the depreciating trend in the US dollar have boosted international commodity prices.
Nevertheless, these price movements have not produced significant upward pressure on
overall price levels. Inflation in advanced nations and emerging markets remains low, with
some nations still undergoing deflation as a result of weakened consumption.
At home, the Indonesian economy is moving into more positive territory in response
to the steady improvement in the global economy. Q3/2009 GDP growth is estimated
at 4.2%, up from the earlier 3.9% prediction. On the demand side, rising consumption has
been bolstered by increased export revenues, stronger consumer confidence and seasonal
factors in the period preceding the Eid-ul-Fitr festivities. Modest improvement is reported
in investment, despite continued sluggish growth. Externally, preliminary figures for export
growth are stronger due to improving economic conditions in trading partner nations and
rising global commodity prices. On the other hand, import growth is estimated at minimal
levels. On the supply-side, the manufacturing and the trade, hotels and restaurants sectors
charted improved growth in Q3/2009 in keeping with the Eid-ul-Fitr religious festivities.
Further confirmation of renewed growth momentum comes from the regional
economic assessments conducted by Bank Indonesia. For the most part, local economies
report brisk consumption and exports driven by rising demand from China, India and South
Korea for primary products and an upswing in investment activity across all regions. Export
growth in the Sumatra and the Kali-Sulampua (Kalimantan-Sulawesi-Maluku-Papua) regions
is fuelled mainly by rubber, nickel, coal and CPO, while in the Jakarta region, growth is
Monetary Policy Report - Quarter III-2009
2
driven by manufactured products. On the supply side, the mainstay of regional growth in
Jakarta is strengthening performance in manufacturing, trade, hotels and restaurants and
the financial sector. In the Jabalnustra (Java-Bali-Nusa Tenggara) region, the key growth
sectors are food crop agriculture and trade, in contrast to the Sumatra and Kali-Sulampua
regions where growth relies primarily on mining and estate crops. Added support for regional
economic growth came from the increased volume of regional budget expenditures during
Q3/2009. However, the recent earthquake in West Sumatra portends to impact economic
growth in that region. Leading sectors forming the traditional economic backbone of West
Sumatra, such as agriculture, the trade, hotels and restaurants sector and transport and
communications, have inevitably been impacted by the quake. However, from a nationwide
perspective, the West Sumatra economy accounts for a comparatively small share of national
economic growth at 1.7%.
Concerning prices, inflation in Q3/2009 maintained a steady downward trend,
falling to 2.83% (yoy). Inflationary pressure remained low during the quarter due to
improving inflation expectations, the appreciating exchange rate and still modest global
commodity prices. Alongside this, demand-side pressure remained minimal, despite
indications of resurgent pressures. On the non-fundamentals side, the Government kept
hikes in administered prices to a minimum during Q3/2009. Combined with plentiful supply
of foodstuffs, this has eased upward pressure on prices. The hike in toll road charges on 28
September 2009 is expected to have negligible impact on inflation, accounting for 0.05%
of inflation formation during 2009.
The improvement in the global economy and particularly in trading partner nations
is set to have positive impact on the Q23/2009 balance of payments. The recovery
in the global economy and especially in trading partners alongside the escalating trend
in global commodity prices has potential to boost export performance to new levels. At
the same time, imports are expected to remain low due to continued weak demand from
investment. The current account in Q3/2009 has potential to chart a surplus. Alongside
this, in the capital and financial account, inflows of foreign funds and portfolio investments
again recorded an estimated surplus, despite short-lived correction in foreign portfolio capital
during August 2009.
In other developments, the decision by Moody’s to upgrade Indonesia’s sovereign
credit rating from Ba3 to Ba2 is expected to have a beneficial effect on capital
inflows and cost of financing. Besides this, Indonesia, like other IMF members benefiting
from coordinated global policy actions, received an SDR allocation worth SDR1.74 billion
equivalent to USD2.7 billion. This helped boost international reserves to USD62.3 billion at
the end of September 2009, sufficient for 6.2 months of imports and servicing of official
external debt.
The improvement in the balance of payments and positive sentiment on global
financial markets has contributed to the stability of the rupiah. Despite coming
under temporary pressure at end-August 2009, the exchange rate gained value while
charting reduced volatility. This appreciation in the rupiah is supported by robust domestic
economic fundamentals reflected in the balance of payments surplus, attractive returns and

General Review
3
improving perceptions of risk that offer attraction for foreign investors. Reinforcing this is
positive sentiment for the global economy that contributed to brisk inflows of capital into
Indonesia. The rupiah remains competitive against other currencies in the region. During
Q3/2009, the average value of the rupiah appreciated 5.5% to Rp 9,973 to the US dollar
while charting reduced volatility.
In the financial sector, these developments have provided an uplift for domestic
financial market conditions. Overall financial market performance is up alongside steady
improvement in monetary policy transmission. During Q3/2009, the stock market charted
index gains. Improving domestic fundamentals and rising global commodity prices were the
key factors providing significant boost to share buying by foreign and domestic investors. On
the bond market, yield on government securities is down in keeping with the lower level of
the BI Rate and growing foreign investor interest in these instruments. Even so, yield on longer
tenors (above 15 years) remains comparatively high due to lingering perceptions of risk.
The banking sector is marked by stable conditions in the national banking system
and initial improvement in bank response to monetary policy signals. On the micro
level, this stability is indicated by the comfortable level of the capital adequacy ratio (CAR) at
17.0% in August 2009. Similarly, the gross non-performing loans (NPLs) ratio remains below
5% with the net ratio at less than 2%. The ample condition of bank liquidity is reflected
in the rise in bank holdings of monetary instruments (SBIs and FASBI), increased volume
of interbank money market transactions and decline in the overnight interbank rate, now
hovering below the BI Rate level. In other developments, the bank interest rate response
to monetary policy measures showed further improvement, particularly in deposit rates. By
mid-Q3/2009, the average lending rate had dropped 18 bps or more than for the equivalent
period one quarter earlier. Related to this, bank loan disbursements from January to August
2009 were up by Rp 46.7 trillion or 3.5% (ytd).
Looking forward, the Indonesian economy has potential to surpass earlier growth
projections in 2009 and 2010. Key to this is the continued strength of private consumption
growth, better than expected exports and the government stimulus. The brisk pace of private
consumption is bolstered by high levels of consumer confidence in line with low inflation
and interest rates and the effect of mounting export revenues. Alongside this, export
performance is improving on the back of the strengthening global economic recovery and
higher prices for oil, natural gas and non-oil and gas commodities. Only limited investment
growth, however, is expected due to persistently low levels of capacity utilisation. The fiscal
stimulus has also bolstered the performance of the domestic economy, as reflected in brisk
growth in government consumption and investment. On the supply side, renewed growth
is forecasted across a range of sectors, consistent with strengthening domestic and external
demand in tradable sectors. In response to these developments, the Indonesian economy in
2009 is forecasted to chart 4.0%-4.5% growth in 2009, ahead of the originally predicted
3.5%-4.0%. For 2010, Bank Indonesia forecasts economic growth in the range of 5.0%-
5.5%. Vigilance is still needed in regard to various risks from uncertainty in the recovery
process for world trade given that the stimulus-backed actions to boost recovery in advanced
Monetary Policy Report - Quarter III-2009
4
nations are more oriented to domestic demand, the high unemployment besetting developed
nations and protectionist tendencies in operation in some countries after the global crisis.
At the same time, a close watch is needed on the risk of escalation in world oil prices driven
by speculative activity.
The balance of payments outlook for 2009 and 2010 points to a growing surplus.
Exports are predicted to gather pace on the strength of world economic recovery and rising
commodity prices. On the domestic front, imports are set to maintain limited growth due to
the sluggish pace of investment expansion. In 2010, the current account is again forecasted
to chart a surplus. Similarly, improved performance in the capital and financial account is
expected as a result of more favourable domestic and external conditions compared to
the past. The secure condition of domestic fundamentals, improving risk perceptions and
keen investor interest in domestic assets is expected to boost inflows of foreign capital into
Indonesia, channelled into both portfolio investments and foreign direct investment.
In the inflation outlook, the downward trend in 2009 is forecasted to continue,
despite potential for return to normal levels in 2010. CPI inflation in 2009 is on track
to come within the inflation targeting range at 4.5%±1%. In 2010, CPI inflation is predicted
to return to normal in the 5±1% range as a result of domestic economic expansion, rising
imported inflation driven by higher commodity prices and inflation expectations. On the
non-fundamentals side, heightened inflationary pressure is expected from hikes in some
non-strategic administered prices. Nevertheless, volatile foods inflation is forecasted to stay
low in view of measures taken to safeguard the supply and distribution of food and energy
commodities.
After factoring in these developments, the Bank Indonesia Board of Governors
Meeting convened on 5 October 2009 decided to keep the BI Rate unchanged at
6.5%. The decision was taken after the Board of Governors concluded that the 6.50% BI
Rate remains consistent with achievement of the 5%±1% inflation target for 2010. This
policy stance is also regarded conducive to the economic recovery and banking intermediation
processes.
Latest Macroeconomic Indicators
5
2. Latest Macroeconomic Indicators
The more conducive trend in global economic developments has provided an uplift
for domestic economic performance. During Q3/2009, the increasingly broad-based
global economic recovery was supported by improvement in Asian economies, with
positive impact on the domestic economy. The renewed economic expansion is
bolstered by more robust export performance as trading partner economies recover
momentum. Private consumption is also estimated ahead of earlier predictions as
a result of higher incomes and stronger consumer confidence. In a similar vein,
investment growth is forecasted to improve with support from increased demand
and business optimism. Renewed growth in exports and investments is believed to
have kept imports from further decline during the quarter under review. On the
supply side, growth estimates for Q3/2009 are up in some sectors in response to
improvement in domestic and external demand. The Eid-ul-Fitr celebrations at end-
Q3/2009 are also seen as providing a significant boost to growth in relevant sectors,
mainly industry, trade and transport and communications.
DEVELOPMENTS IN THE WORLD ECONOMY
The global economy in Q3/2009 witnessed more robust recovery spread more
evenly across all regions. Recovery was driven mainly by strong performance in Asian
emerging markets, while advanced nations reported some easing in the rate of economic
contraction. World growth (qtq) at the beginning of second half 2009 is estimated in positive
territory. However, stubbornly high rates of unemployment continued to hamper recovery
in consumption in advanced economies. The outlook for faster than expected recovery
in the global economy is seen as conducive to accelerating improvement in the domestic
economy. Despite this, attention is needed to the lack of commensurate response from
financial markets to the improving condition of economic fundamentals, as this could trigger
renewed correction with disruptive consequences in macro instability.
Economic contraction in the US eased during Q2/2009 with positive growth (qtq)
indicated for Q3/2009. The US economic downturn has been triggered primarily by falling
private consumption driven by high unemployment. As a result, households are maintaining
tightened levels of consumption. However, the latest data indicates a slowing in the rate of
contraction with US economic growth in Q3/2009 estimated at a positive 3.1% (qtq) or -2.5%
(yoy). The high rate of household savings, previously feared to hamper economic recovery,
instead helped to keep household consumption from even steeper decline. The levelling off in
the decline in household consumption is also reflected in retail sales during Q3/2009, which
reached a trough. However, numbers of laid off workers continue to mount, as indicated
by steep unemployment in the US at 9.7% despite signs of easing. Indications of respite in
worker lay-offs are reflected in falling numbers of jobless claims (initial and continuing) and
a drop in the average non-farm payroll during Q3/2009 at 246 thousand compared to 428
thousand persons in the preceding quarter.
Monetary Policy Report - Quarter III-2009
6
Conditions in the global financial sector are steadily improving. The liquidity crunch
has eased in response to added liquidity and quantitative easing launched by some central
banks. Liquidity injections by the Fed, BoE, BoJ and ECB have freed up credit markets, as
reflected in the decline in the LIBOR spread against Overnight Index Swaps (OIS) to levels
preceding the Lehman Brothers bankruptcy. In a similar vein, financial market developments
have been positive overall, despite some correction marked by falling share prices mainly
in China at end-Q3/2009. Signs of world economic recovery are reflected in the improved
economic growth in various regions and the conducive conditions in the US housing sector.
All this has fuelled optimism on global financial markets. However, financial asset prices
in some nations soared at excessive rates seen as disproportionate to improvement in
macroeconomic fundamentals, leading to a process of correction marked by plunging stock
prices in a number of economies led by China at end-August 2009.
Economic growth has also picked up in Asia. In most Asian economies, growth has
rebounded following the steep decline in early 2009. Externally oriented countries in Asia
saw significant improvement in line with growing demand for exports to China and India
alongside a renewed climb in world commodity prices. Similarly, positive growth trends were
maintained in other Asian economies relying more on domestic demand, such as China
with growth rising from 6.1% (yoy) to 7.9% (yoy), India from 5.8% (yoy) to 6.1% (yoy) and
Vietnam from 3.1% (yoy) to 3.9% (yoy).
World inflation remains on a downward trend due to the slow pace of economic
activity. According to composite data on inflation outcomes, world inflationary pressure
underwent further decline. In July 2008, world inflationary pressure was still high at 6.0%
(yoy), with world oil prices running at USD147 per barrel. However, with sluggish pace of
the world economy and weak world commodity prices, world inflationary pressure eased
to 0.9% (yoy) in August 2009.
ECONOMIC GROWTH
Aggregate Demand
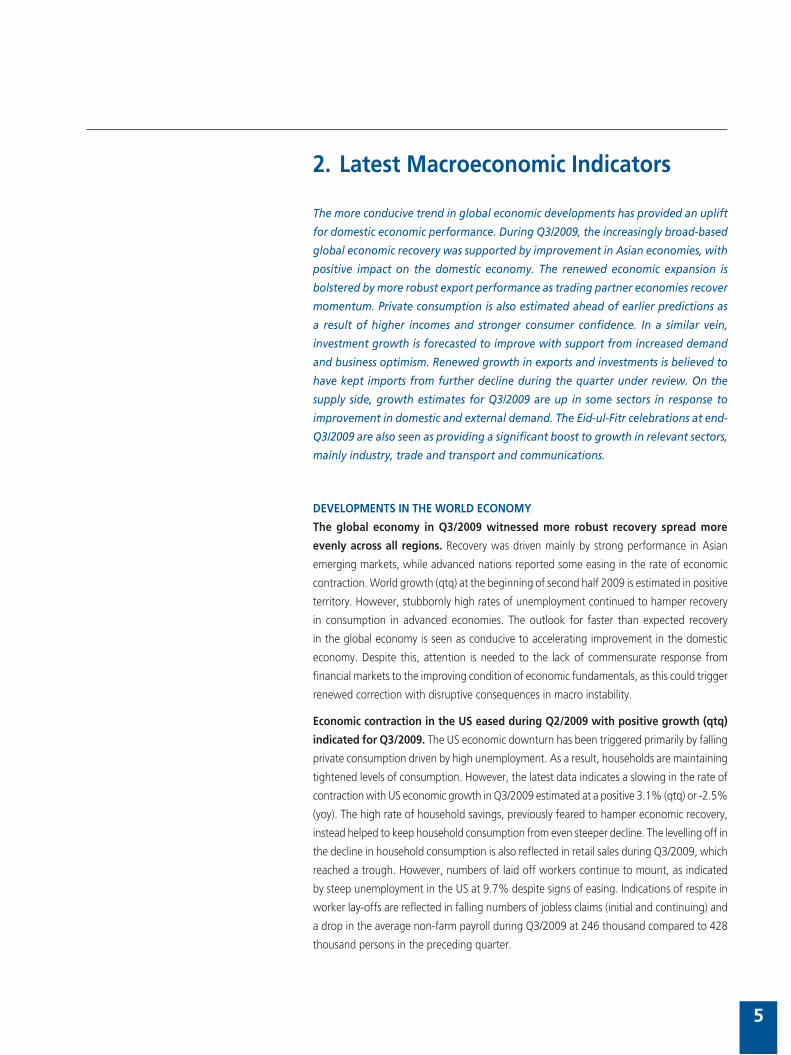
Given the ongoing improvement in domestic demand and global
economic conditions, preliminary figures for GDP growth in Q3/2009
are ahead of the preceding quarter. Key to this is the recovery indicated
in leading indicators for the GDP (Graph 2.1). Accordingly, GDP growth
in Q3/2009 is estimated at 4.2% (y-o-y). Higher economic growth during
Q3/2009 was bolstered by improvement in all components of aggregate
demand. Household consumption climbed more aggressively on surging
household spending in advance of the religious festive season, stronger
export revenues and improving consumer confidence. Export growth
is also estimated on an upward track in response to the sustained
improvement in trading partner demand, led by emerging markets, and
rising commodity prices. In a similar vein, indicators suggest renewed
investment growth on the back of strengthening demand and business
Graph 2.1
Leading Indicators of GDP
��������� ����������������
����
����
����
�����
�����
�����
����
����
����
�����
�����
�����
���� ���� ���� ���� ���� ���� ���� ����� �� ��� �� � �� ��� �� � �� ��� �� � �� ��� �� � �� ��� �� � �� ��� �� � �� ��� �� � �� ���
�������������������������������������� ����������������������������������������������������������� ��������������������������������������������������
��������������������������������������������������������������������������������������
����������������������������������������������������������������������������������������������
Latest Macroeconomic Indicators
7
optimism. The more robust export and investment growth during the
quarter is estimated to have prevented imports from further decline
(Table 2.1).
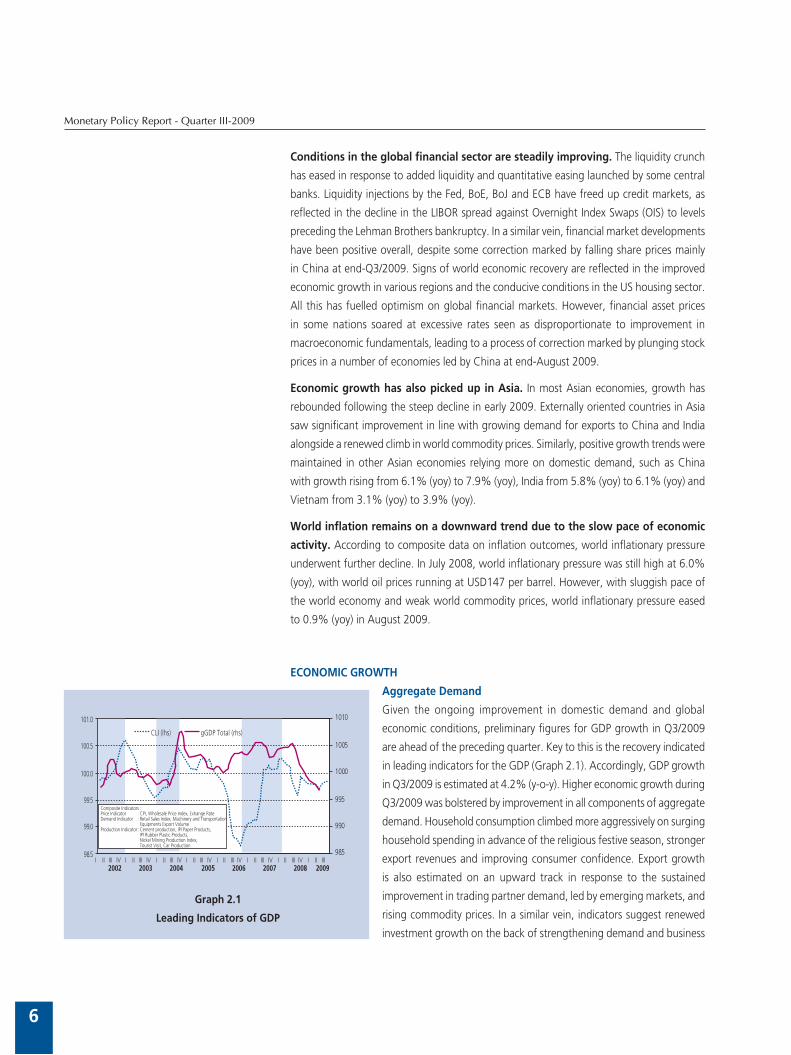
Household consumption in Q3/2009 is estimated above the levels
of the preceding quarter. This is consistent with the leading indicators
for household consumption, which point to improvement despite
remaining within the contractionary cycle for at least another quarter
(Graph 2.2). The buoyant growth in household consumption is explained
by rising purchasing power fuelled by stronger exports, planned payment
of holiday bonuses and more robust consumer confidence in the wake
of the presidential election. Added factors in household consumption are
the religious festive season and the school holidays early in Q3/2009. In
the overall analysis, growth in household consumption during Q3/2009
reached 4.9% (yoy).
Indications of improved household consumption in Q3/2009
are also reflected in movement in early indicators. Consumption
of durable goods widened further in early Q3/2009, with motorcycle
sales in the lead. Also reflecting the brisk growth in consumption was
more vigorous growth in consumer goods imports during July 2009. A
similar trend was also evident in higher sales reported by publicly-listed
companies trading in middle and upper class consumer goods. The retail
index similarly improved in early Q3/2009, strengthened by purchases of
stationery, clothing and supplies during the school holidays. However,
as of July 2009, no significant gains were evident in indicators related
to consumption financing, such as real growth in M1 and consumption
credit. Attesting to the relatively stable and even escalating level of public
purchasing power was the upward trend in credit card transactions
early in Q3/2009, even in spite of decline in debit card transactions. The
improvement in purchasing power is thought to have come from the
slowing rate of job losses, as visible in data published on 11 September
III IV I II III IV I II III*Indicators
Table 2.1
Economic Growth - Demand Side
2007
* Bank Indonesia Projection Figures
Source : Statistics Indonesia
Total Consumption 5.3 5.0 4.9 5.5 5.5 6.3 6.4 5.9 7.2 6.3 5.7
Private Consumption 5.1 5.5 5.0 5.7 5.5 5.3 4.8 5.3 5.8 4.8 4.9
Government Consumption 6.5 2.0 3.9 3.6 5.3 14.1 16.4 10.4 19.2 17.0 11.4
Gross Domestic Fixed Capital Formation 9.7 12.4 9.4 13.7 12.0 12.2 9.1 11.7 3.5 2.7 3.2
Export of Goods and Services 7.4 7.9 8.5 13.6 12.4 10.6 1.8 9.5 -19.1 -15.7 -12.4
Import of Goods and Services 7.0 13.9 9.0 18.0 16.1 11.0 -3.5 10.0 -24.1 -23.9 -20.3
GDP 6.6 5.8 6.3 6.2 6.4 6.4 5.2 6.1 4.4 4.0 4.2
20072008
20082009
Graph 2.2
Leading Indicators of Consumption
����
����
����
����
����
�����
�����
�����
�����
��
��
��
���
���
���
���
���
���
���� ���� ���� ���� ���� ���� ���� ����
��������������������������������������
� �� ��� �� � �� ��� �� � �� ��� �� � �� ��� �� � �� ��� �� � �� ��� �� � �� ��� �� � �� ��� ��
������������������������������������������
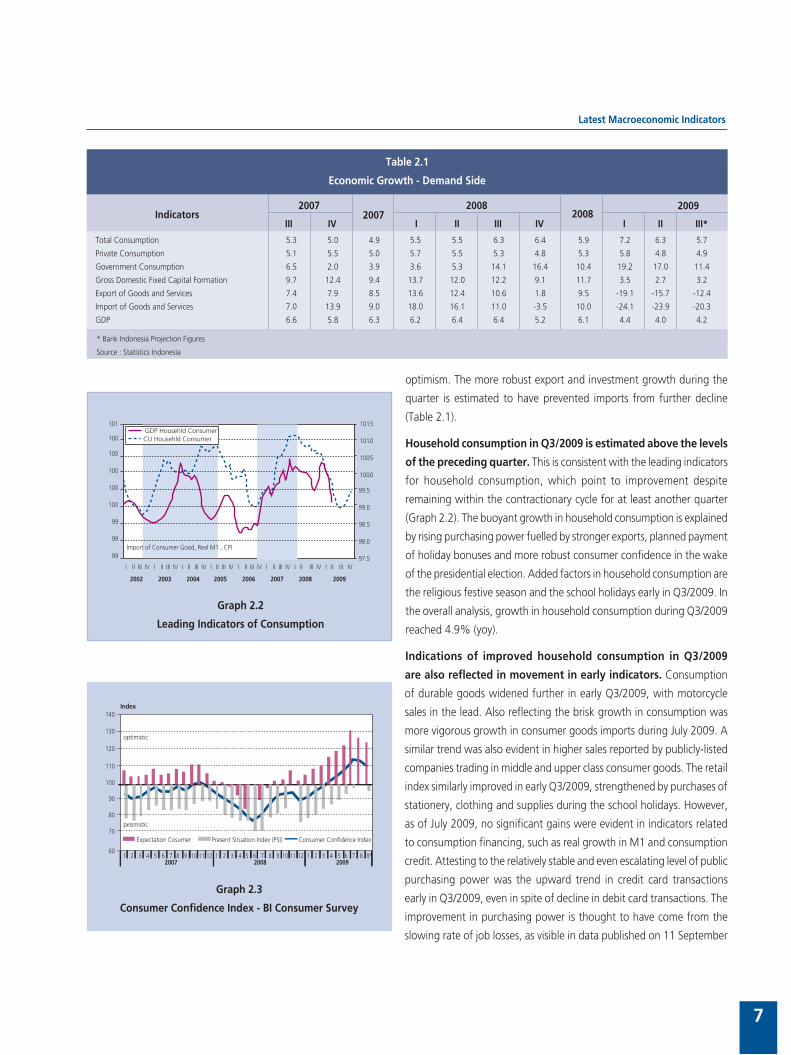
Graph 2.3
Consumer Confidence Index - BI Consumer Survey
��
��
��
��
���
���
���
���� ���� ����
������������������� ����������������������������� �������������������������
����������
����������
�����
���
���
� � � � � � � � � �� �� �� � � � � � � � � � �� �� �� � � � � � � � � ��
Monetary Policy Report - Quarter III-2009
8
2009 by the Ministry of Labour and Transmigration citing a 1,134
reduction in new worker dismissals. In similar developments, worker
remittances, representing another source of income, also climbed 5.8%
(qtq) to USD1.8 billion during Q2/2009. Consumer confidence was up
during Q3/2009 in response to perceptions of improvement in current
economic conditions and expectations of higher incomes (Graph 2.3).
The rise in the Consumer Confidence Index came most importantly
from improvement in the Current Situation Index components, public
perceptions of a healthier outlook for the economy and the easing of
public concerns over price increases for staple food items. This optimism
was consistent with the gains in the Consumer Tendency Index released
by the Central Statistics Agency (BPS), driven by expectations of higher
incomes during Q3/2009.
Growth in investment (gross fixed capital formation) is estimated
higher in Q3/2009 due to onset of recovery in external and
domestic demand. Despite this, the most recent leading investment
indicators suggest that investment growth will persist in the downward
cycle phase for at least the next quarter (Graph 2.4). Investment growth
is expected to climb after uncertainties in the global economy have eased
and with support from renewed export demand from trading partners.
The improvement in the global economy and domestic stability in the
aftermath of the Presidential Election provided a boost to business
optimism during Q3/2009. In response to these developments, estimated
investment growth during Q3/2009 reached 3.2% (y-o-y). In preliminary
figures, most of this growth has been generated by construction
investment (Graph 2.5).
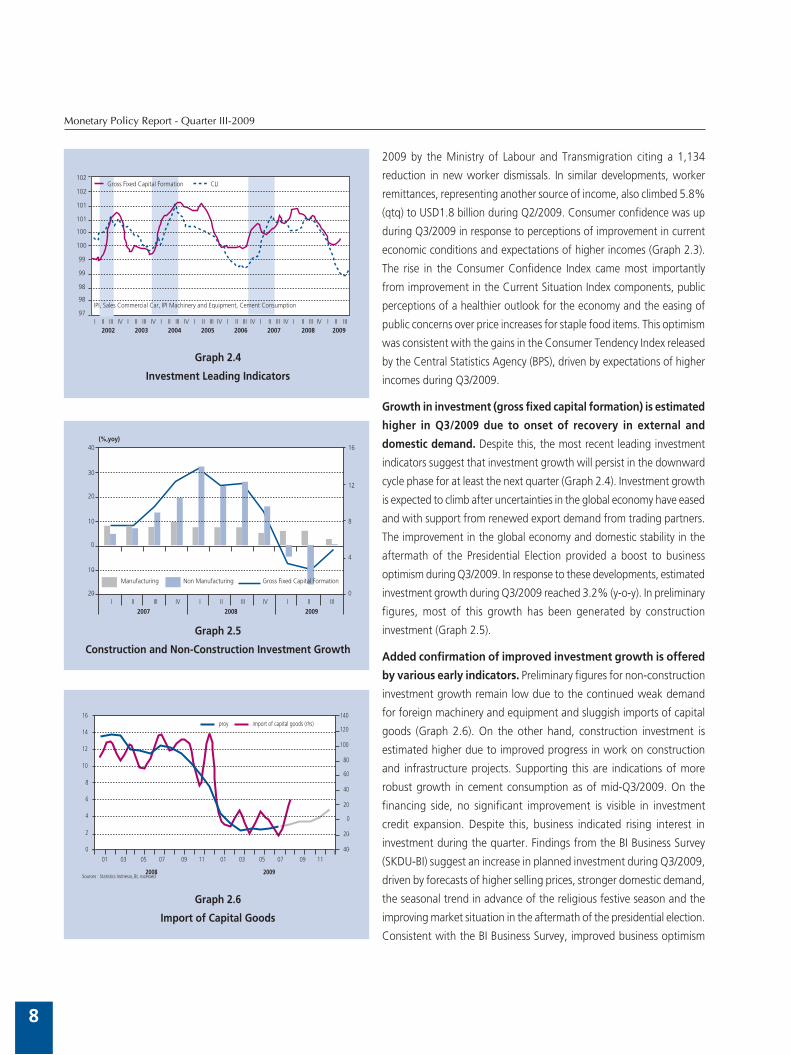
Added confirmation of improved investment growth is offered
by various early indicators. Preliminary figures for non-construction
investment growth remain low due to the continued weak demand
for foreign machinery and equipment and sluggish imports of capital
goods (Graph 2.6). On the other hand, construction investment is
estimated higher due to improved progress in work on construction
and infrastructure projects. Supporting this are indications of more
robust growth in cement consumption as of mid-Q3/2009. On the
financing side, no significant improvement is visible in investment
credit expansion. Despite this, business indicated rising interest in
investment during the quarter. Findings from the BI Business Survey
(SKDU-BI) suggest an increase in planned investment during Q3/2009,
driven by forecasts of higher selling prices, stronger domestic demand,
the seasonal trend in advance of the religious festive season and the
improving market situation in the aftermath of the presidential election.
Consistent with the BI Business Survey, improved business optimism
Graph 2.4
Investment Leading Indicators
��
��
��
��
��
���
���
���
���
���
���
� �� ��� �� � �� ��� �� � �� ��� �� � �� ��� �� � �� ��� �� � �� ��� �� � �� ��� �� � ������ ���� ���� ���� ���� ���� ���� ����
����������������������������� ���
��������������������������������������������������������������������������
���
Graph 2.5
Construction and Non-Construction Investment Growth
������������� �����������������
�
�
�
��
��
���
���
�
��
��
��
��
� �� ��� �� � �� ��� �� � ��
�������
���� ���� �������
�����������������������������
Graph 2.6
Import of Capital Goods
���
���
�
��
��
��
��
���
���
���
�
�
�
�
�
��
��
��
������ �����������������������������
��
����
�� �� �� �� �� �� �� �� �� �� ��
�����������������������������������������������
Latest Macroeconomic Indicators
9
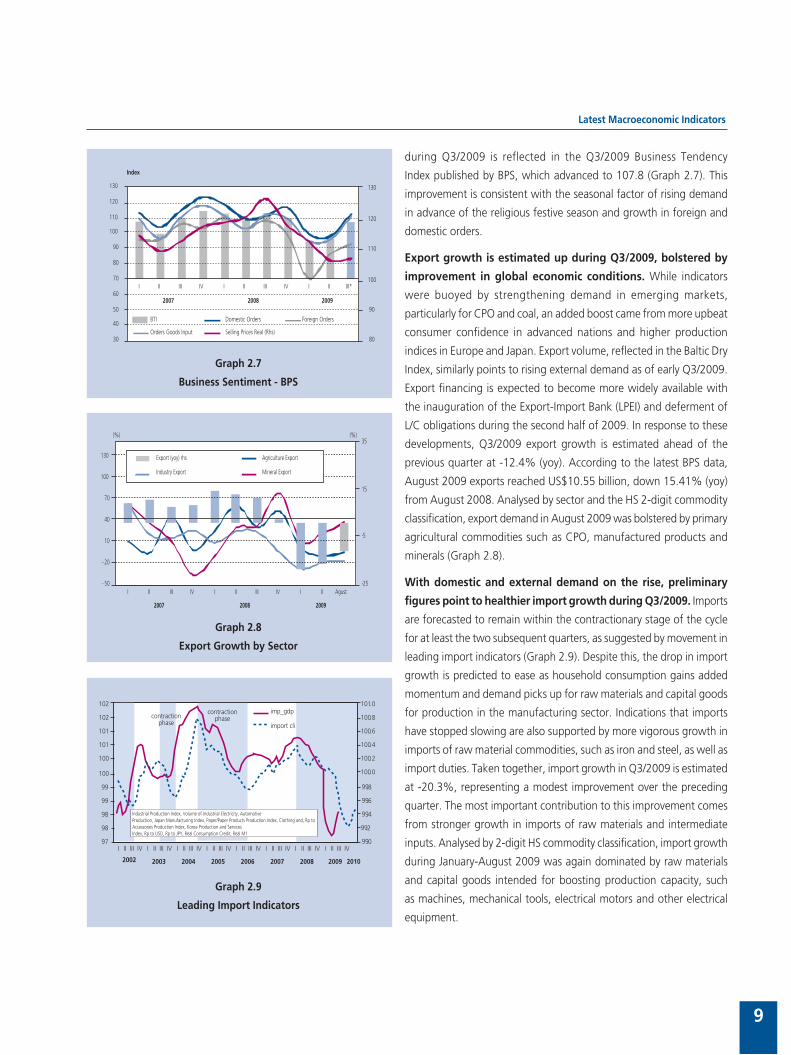
during Q3/2009 is reflected in the Q3/2009 Business Tendency
Index published by BPS, which advanced to 107.8 (Graph 2.7). This
improvement is consistent with the seasonal factor of rising demand
in advance of the religious festive season and growth in foreign and
domestic orders.
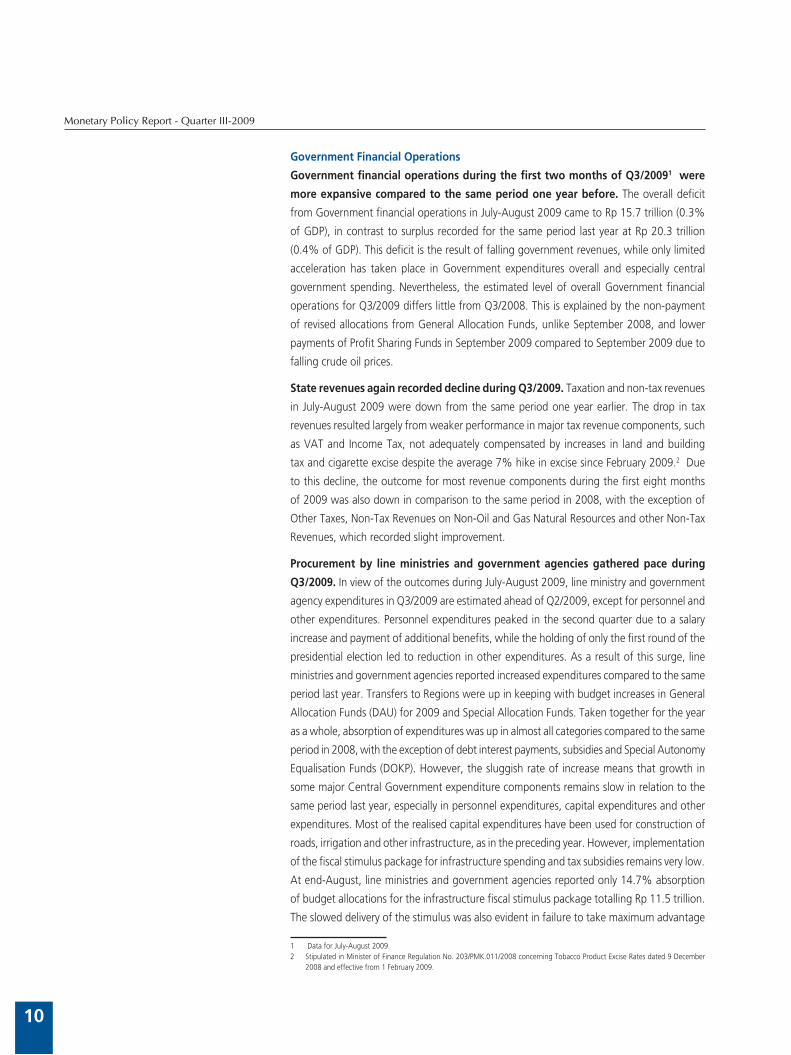
Export growth is estimated up during Q3/2009, bolstered by
improvement in global economic conditions. While indicators
were buoyed by strengthening demand in emerging markets,
particularly for CPO and coal, an added boost came from more upbeat
consumer confidence in advanced nations and higher production
indices in Europe and Japan. Export volume, reflected in the Baltic Dry
Index, similarly points to rising external demand as of early Q3/2009.
Export financing is expected to become more widely available with
the inauguration of the Export-Import Bank (LPEI) and deferment of
L/C obligations during the second half of 2009. In response to these
developments, Q3/2009 export growth is estimated ahead of the
previous quarter at -12.4% (yoy). According to the latest BPS data,
August 2009 exports reached US$10.55 billion, down 15.41% (yoy)
from August 2008. Analysed by sector and the HS 2-digit commodity
classification, export demand in August 2009 was bolstered by primary
agricultural commodities such as CPO, manufactured products and
minerals (Graph 2.8).
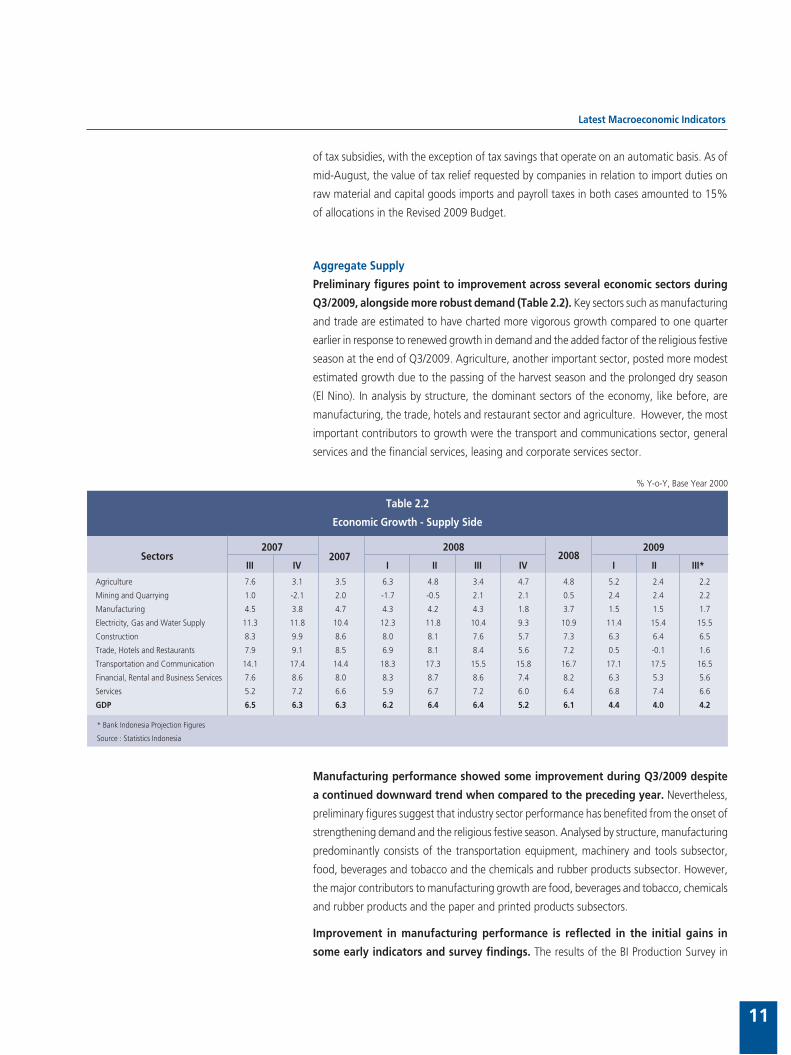
With domestic and external demand on the rise, preliminary
figures point to healthier import growth during Q3/2009. Imports
are forecasted to remain within the contractionary stage of the cycle
for at least the two subsequent quarters, as suggested by movement in
leading import indicators (Graph 2.9). Despite this, the drop in import
growth is predicted to ease as household consumption gains added
momentum and demand picks up for raw materials and capital goods
for production in the manufacturing sector. Indications that imports
have stopped slowing are also supported by more vigorous growth in
imports of raw material commodities, such as iron and steel, as well as
import duties. Taken together, import growth in Q3/2009 is estimated
at -20.3%, representing a modest improvement over the preceding
quarter. The most important contribution to this improvement comes
from stronger growth in imports of raw materials and intermediate
inputs. Analysed by 2-digit HS commodity classification, import growth
during January-August 2009 was again dominated by raw materials
and capital goods intended for boosting production capacity, such
as machines, mechanical tools, electrical motors and other electrical
equipment.
��
��
���
���
���
���
��
��
��
��
��
��
��
���
���
���
���
� �� ��� �� � �� ��� �� � �� ����
���� ���� ����
��� ��������������� ��������������
������������������ �������������������������
�����
Graph 2.7
Business Sentiment - BPS
Graph 2.8
Export Growth by Sector
���
��
��
��
� ��
� ��
��
��
��
���
���
� �� ��� �� � �� ��� �� � �� �����
���� ���� ����
��� ���
���������������� ������������������
��������������� ��������������
Graph 2.9
Leading Import Indicators
����
����
����
����
����
�����
�����
�����
�����
�����
�����
��
��
��
��
��
���
���
���
���
���
���
� �� ��� �� � �� ��� �� � �� ��� �� � �� ��� �� � �� ��� �� � �� ��� �� � �� ��� �� � �� ��� ��
���� ���� ���� ���� ���� ���� ���� ����
����������������
����������������
�������
����������
����
��������������������������������������������������������������������������������������������������������������������������������������������������������������������������������������������������������������������������������������������������������������������������������������������������
Monetary Policy Report - Quarter III-2009
10
Government Financial Operations
Government financial operations during the first two months of Q3/20091 were
more expansive compared to the same period one year before. The overall deficit
from Government financial operations in July-August 2009 came to Rp 15.7 trillion (0.3%
of GDP), in contrast to surplus recorded for the same period last year at Rp 20.3 trillion
(0.4% of GDP). This deficit is the result of falling government revenues, while only limited
acceleration has taken place in Government expenditures overall and especially central
government spending. Nevertheless, the estimated level of overall Government financial
operations for Q3/2009 differs little from Q3/2008. This is explained by the non-payment
of revised allocations from General Allocation Funds, unlike September 2008, and lower
payments of Profit Sharing Funds in September 2009 compared to September 2009 due to
falling crude oil prices.
State revenues again recorded decline during Q3/2009. Taxation and non-tax revenues
in July-August 2009 were down from the same period one year earlier. The drop in tax
revenues resulted largely from weaker performance in major tax revenue components, such
as VAT and Income Tax, not adequately compensated by increases in land and building
tax and cigarette excise despite the average 7% hike in excise since February 2009.2 Due
to this decline, the outcome for most revenue components during the first eight months
of 2009 was also down in comparison to the same period in 2008, with the exception of
Other Taxes, Non-Tax Revenues on Non-Oil and Gas Natural Resources and other Non-Tax
Revenues, which recorded slight improvement.
Procurement by line ministries and government agencies gathered pace during
Q3/2009. In view of the outcomes during July-August 2009, line ministry and government
agency expenditures in Q3/2009 are estimated ahead of Q2/2009, except for personnel and
other expenditures. Personnel expenditures peaked in the second quarter due to a salary
increase and payment of additional benefits, while the holding of only the first round of the
presidential election led to reduction in other expenditures. As a result of this surge, line
ministries and government agencies reported increased expenditures compared to the same
period last year. Transfers to Regions were up in keeping with budget increases in General
Allocation Funds (DAU) for 2009 and Special Allocation Funds. Taken together for the year
as a whole, absorption of expenditures was up in almost all categories compared to the same
period in 2008, with the exception of debt interest payments, subsidies and Special Autonomy
Equalisation Funds (DOKP). However, the sluggish rate of increase means that growth in
some major Central Government expenditure components remains slow in relation to the
same period last year, especially in personnel expenditures, capital expenditures and other
expenditures. Most of the realised capital expenditures have been used for construction of
roads, irrigation and other infrastructure, as in the preceding year. However, implementation
of the fiscal stimulus package for infrastructure spending and tax subsidies remains very low.
At end-August, line ministries and government agencies reported only 14.7% absorption
of budget allocations for the infrastructure fiscal stimulus package totalling Rp 11.5 trillion.
The slowed delivery of the stimulus was also evident in failure to take maximum advantage
1 Data for July-August 2009.2 Stipulated in Minister of Finance Regulation No. 203/PMK.011/2008 concerning Tobacco Product Excise Rates dated 9 December
2008 and effective from 1 February 2009.
Latest Macroeconomic Indicators
11
of tax subsidies, with the exception of tax savings that operate on an automatic basis. As of
mid-August, the value of tax relief requested by companies in relation to import duties on
raw material and capital goods imports and payroll taxes in both cases amounted to 15%
of allocations in the Revised 2009 Budget.
Aggregate Supply
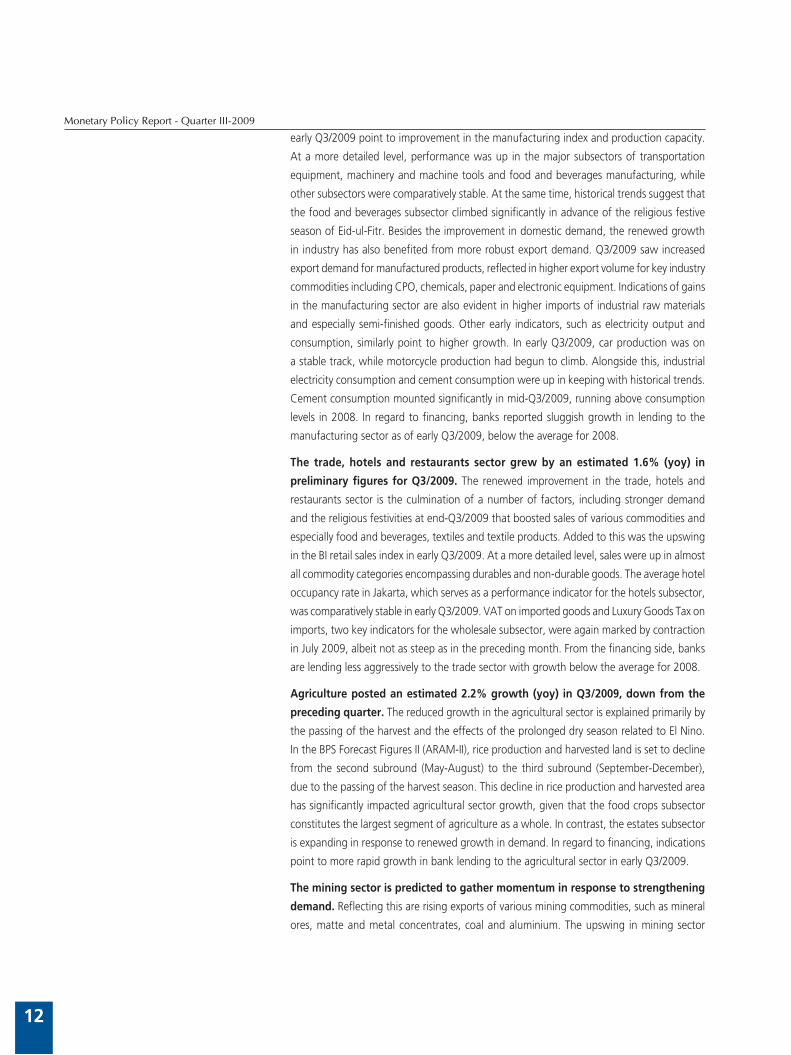
Preliminary figures point to improvement across several economic sectors during
Q3/2009, alongside more robust demand (Table 2.2). Key sectors such as manufacturing
and trade are estimated to have charted more vigorous growth compared to one quarter
earlier in response to renewed growth in demand and the added factor of the religious festive
season at the end of Q3/2009. Agriculture, another important sector, posted more modest
estimated growth due to the passing of the harvest season and the prolonged dry season
(El Nino). In analysis by structure, the dominant sectors of the economy, like before, are
manufacturing, the trade, hotels and restaurant sector and agriculture. However, the most
important contributors to growth were the transport and communications sector, general
services and the financial services, leasing and corporate services sector.
Manufacturing performance showed some improvement during Q3/2009 despite
a continued downward trend when compared to the preceding year. Nevertheless,
preliminary figures suggest that industry sector performance has benefited from the onset of
strengthening demand and the religious festive season. Analysed by structure, manufacturing
predominantly consists of the transportation equipment, machinery and tools subsector,
food, beverages and tobacco and the chemicals and rubber products subsector. However,
the major contributors to manufacturing growth are food, beverages and tobacco, chemicals
and rubber products and the paper and printed products subsectors.
Improvement in manufacturing performance is reflected in the initial gains in
some early indicators and survey findings. The results of the BI Production Survey in
% Y-o-Y, Base Year 2000
III IV I II III IV I II III*Sectors
Table 2.2
Economic Growth - Supply Side
2007
* Bank Indonesia Projection Figures
Source : Statistics Indonesia
Agriculture 7.6 3.1 3.5 6.3 4.8 3.4 4.7 4.8 5.2 2.4 2.2
Mining and Quarrying 1.0 -2.1 2.0 -1.7 -0.5 2.1 2.1 0.5 2.4 2.4 2.2
Manufacturing 4.5 3.8 4.7 4.3 4.2 4.3 1.8 3.7 1.5 1.5 1.7
Electricity, Gas and Water Supply 11.3 11.8 10.4 12.3 11.8 10.4 9.3 10.9 11.4 15.4 15.5
Construction 8.3 9.9 8.6 8.0 8.1 7.6 5.7 7.3 6.3 6.4 6.5
Trade, Hotels and Restaurants 7.9 9.1 8.5 6.9 8.1 8.4 5.6 7.2 0.5 -0.1 1.6
Transportation and Communication 14.1 17.4 14.4 18.3 17.3 15.5 15.8 16.7 17.1 17.5 16.5
Financial, Rental and Business Services 7.6 8.6 8.0 8.3 8.7 8.6 7.4 8.2 6.3 5.3 5.6
Services 5.2 7.2 6.6 5.9 6.7 7.2 6.0 6.4 6.8 7.4 6.6
GDP 6.5 6.3 6.3 6.2 6.4 6.4 5.2 6.1 4.4 4.0 4.2
20072008
20082009
Monetary Policy Report - Quarter III-2009
12
early Q3/2009 point to improvement in the manufacturing index and production capacity.
At a more detailed level, performance was up in the major subsectors of transportation
equipment, machinery and machine tools and food and beverages manufacturing, while
other subsectors were comparatively stable. At the same time, historical trends suggest that
the food and beverages subsector climbed significantly in advance of the religious festive
season of Eid-ul-Fitr. Besides the improvement in domestic demand, the renewed growth
in industry has also benefited from more robust export demand. Q3/2009 saw increased
export demand for manufactured products, reflected in higher export volume for key industry
commodities including CPO, chemicals, paper and electronic equipment. Indications of gains
in the manufacturing sector are also evident in higher imports of industrial raw materials
and especially semi-finished goods. Other early indicators, such as electricity output and
consumption, similarly point to higher growth. In early Q3/2009, car production was on
a stable track, while motorcycle production had begun to climb. Alongside this, industrial
electricity consumption and cement consumption were up in keeping with historical trends.
Cement consumption mounted significantly in mid-Q3/2009, running above consumption
levels in 2008. In regard to financing, banks reported sluggish growth in lending to the
manufacturing sector as of early Q3/2009, below the average for 2008.
The trade, hotels and restaurants sector grew by an estimated 1.6% (yoy) in
preliminary figures for Q3/2009. The renewed improvement in the trade, hotels and
restaurants sector is the culmination of a number of factors, including stronger demand
and the religious festivities at end-Q3/2009 that boosted sales of various commodities and
especially food and beverages, textiles and textile products. Added to this was the upswing
in the BI retail sales index in early Q3/2009. At a more detailed level, sales were up in almost
all commodity categories encompassing durables and non-durable goods. The average hotel
occupancy rate in Jakarta, which serves as a performance indicator for the hotels subsector,
was comparatively stable in early Q3/2009. VAT on imported goods and Luxury Goods Tax on
imports, two key indicators for the wholesale subsector, were again marked by contraction
in July 2009, albeit not as steep as in the preceding month. From the financing side, banks
are lending less aggressively to the trade sector with growth below the average for 2008.
Agriculture posted an estimated 2.2% growth (yoy) in Q3/2009, down from the
preceding quarter. The reduced growth in the agricultural sector is explained primarily by
the passing of the harvest and the effects of the prolonged dry season related to El Nino.
In the BPS Forecast Figures II (ARAM-II), rice production and harvested land is set to decline
from the second subround (May-August) to the third subround (September-December),
due to the passing of the harvest season. This decline in rice production and harvested area
has significantly impacted agricultural sector growth, given that the food crops subsector
constitutes the largest segment of agriculture as a whole. In contrast, the estates subsector
is expanding in response to renewed growth in demand. In regard to financing, indications
point to more rapid growth in bank lending to the agricultural sector in early Q3/2009.
The mining sector is predicted to gather momentum in response to strengthening
demand. Reflecting this are rising exports of various mining commodities, such as mineral
ores, matte and metal concentrates, coal and aluminium. The upswing in mining sector
Latest Macroeconomic Indicators
13
performance is also reflected in higher production and sales by mining companies. In regard
to financing, the mining sector was the recipient of increased lending at early Q3/2009.
The transport and communications sector again forged ahead with growth in
Q3/2009 estimated at 16.5% (yoy). One key indication of robust growth in this sector
is the ongoing expansion in numbers of cellular subscribers. Also reflecting growth is the
upbeat performance of telecommunications companies reported for Q2/2009. The seasonal
factor of the annual religious festivities is expected to boost telecommunications sector
performance in Q3/2009. In similar developments, performance was up in the transportation
subsector in early Q3/2009, reflected in higher air passenger numbers and cargo traffic at
Indonesia’s five major seaports (Belawan, Tanjung Priok, Tanjung Perak, Balikapan and
Makassar). Potential for even greater transportation subsector performance is expected with
the religious festive season at the end of Q3/2009. Concerning financing, bank lending for
transport and communications has been levelling off, with slow lending growth in early
Q3/2009 below the average for 2008.
The construction sector is estimated higher in Q3/2009 compared to the preceding
quarter, as suggested by various early indicators such as mounting cement consumption
reported at mid-Q3/2009. Similar signs are also evident in commercial property construction
reported in the Bank Indonesia Commercial Property Survey, which points to improvement
in Q2/2009. Concerning levels of financing, bank lending to the construction sector in early
Q3/2008 again came below the average rate of credit expansion in 2008. Nevertheless, the
onset of declining bank lending rates, mainly for home mortgages, is expected to have a
positive effect on property sector growth.
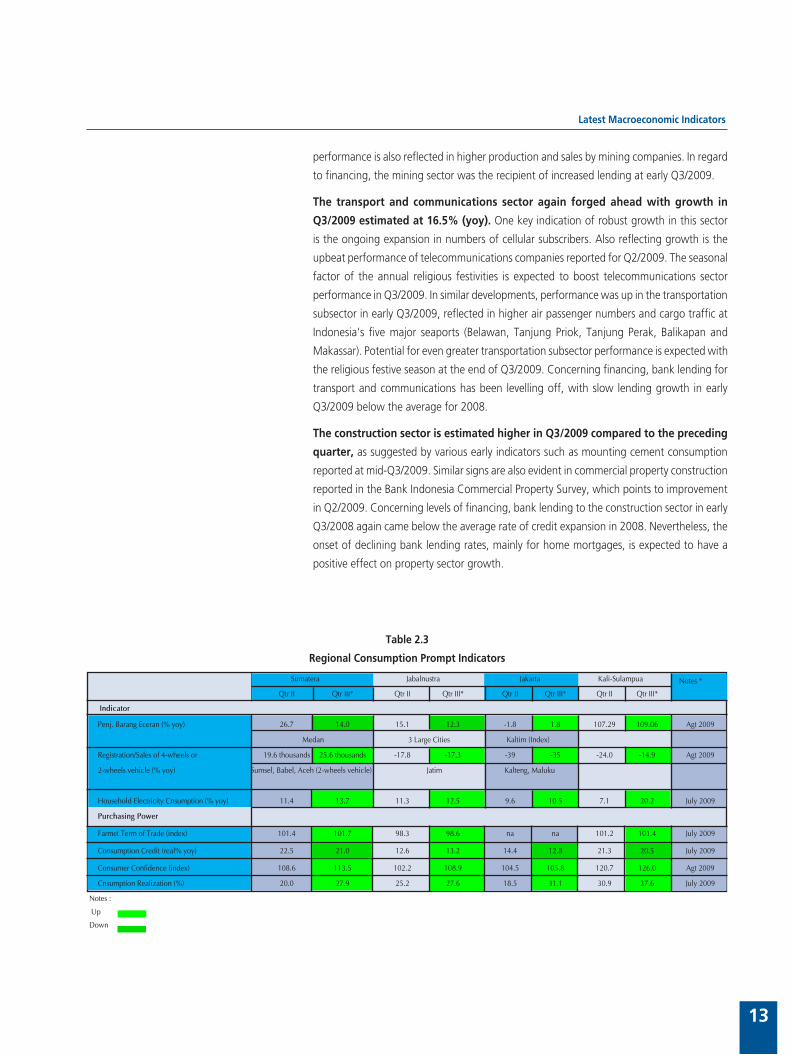
Notes :
Up
Down
Sumatera Jabalnustra Jakarta Kali-Sulampua Notes *
Qtr II Qtr III* Qtr II Qtr III* Qtr II Qtr III* Qtr II Qtr III*
Penj. Barang Eceran (% yoy) 26.7 14.0 15.1 12.3 -1.8 1.8 107.29 109.06 Agt 2009
Medan 3 Large Cities Kaltim (Index)
Registration/Sales of 4-wheels or 19.6 thousands 25.6 thousands -17.8 -17.3 -39 -35 -24.0 -14.9 Agt 2009
2-wheels vehicle (% yoy) Sumsel, Babel, Aceh (2-wheels vehicle) Jatim Kalteng, Maluku
Household Electricity Cnsumption (% yoy) 11.4 13.7 11.3 12.5 9.6 10.5 7.1 20.2 July 2009
Purchasing Power
Farmet Term of Trade (index) 101.4 101.7 98.3 98.6 na na 101.2 101.4 July 2009
Consumption Credit (real% yoy) 22.5 21.0 12.6 13.2 14.4 12.8 21.3 20.5 July 2009
Consumer Confidence (index) 108.6 113.5 102.2 108.9 104.5 105.8 120.7 126.0 Agt 2009
Cnsumption Realization (%) 20.0 27.9 25.2 27.6 18.5 31.1 30.9 37.6 July 2009
Indicator
Table 2.3
Regional Consumption Prompt Indicators
Monetary Policy Report - Quarter III-2009
14
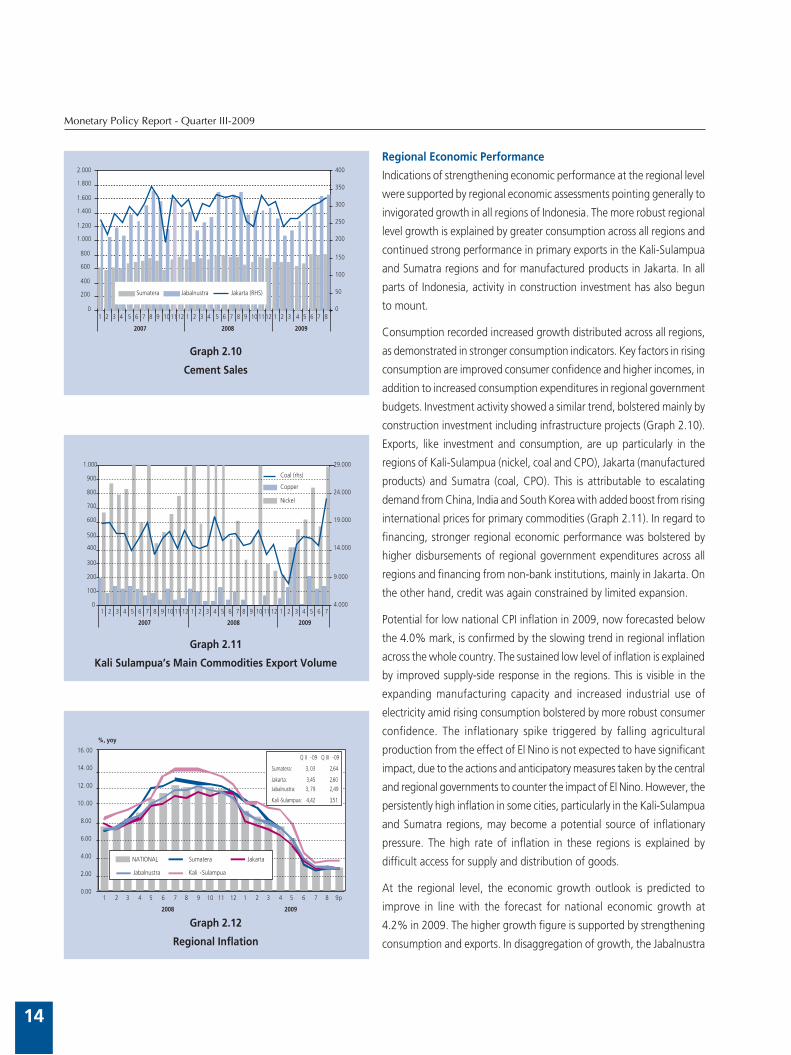
Regional Economic Performance
Indications of strengthening economic performance at the regional level
were supported by regional economic assessments pointing generally to
invigorated growth in all regions of Indonesia. The more robust regional
level growth is explained by greater consumption across all regions and
continued strong performance in primary exports in the Kali-Sulampua
and Sumatra regions and for manufactured products in Jakarta. In all
parts of Indonesia, activity in construction investment has also begun
to mount.
Consumption recorded increased growth distributed across all regions,
as demonstrated in stronger consumption indicators. Key factors in rising
consumption are improved consumer confidence and higher incomes, in
addition to increased consumption expenditures in regional government
budgets. Investment activity showed a similar trend, bolstered mainly by
construction investment including infrastructure projects (Graph 2.10).
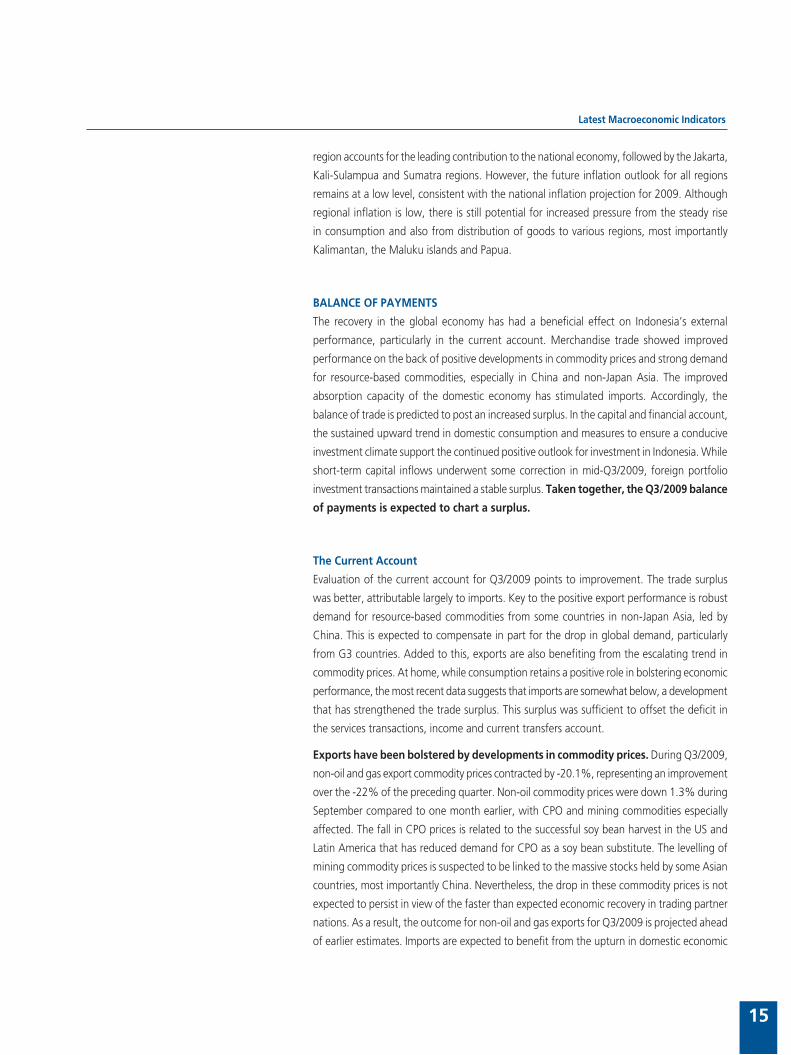
Exports, like investment and consumption, are up particularly in the
regions of Kali-Sulampua (nickel, coal and CPO), Jakarta (manufactured
products) and Sumatra (coal, CPO). This is attributable to escalating
demand from China, India and South Korea with added boost from rising
international prices for primary commodities (Graph 2.11). In regard to
financing, stronger regional economic performance was bolstered by
higher disbursements of regional government expenditures across all
regions and financing from non-bank institutions, mainly in Jakarta. On
the other hand, credit was again constrained by limited expansion.
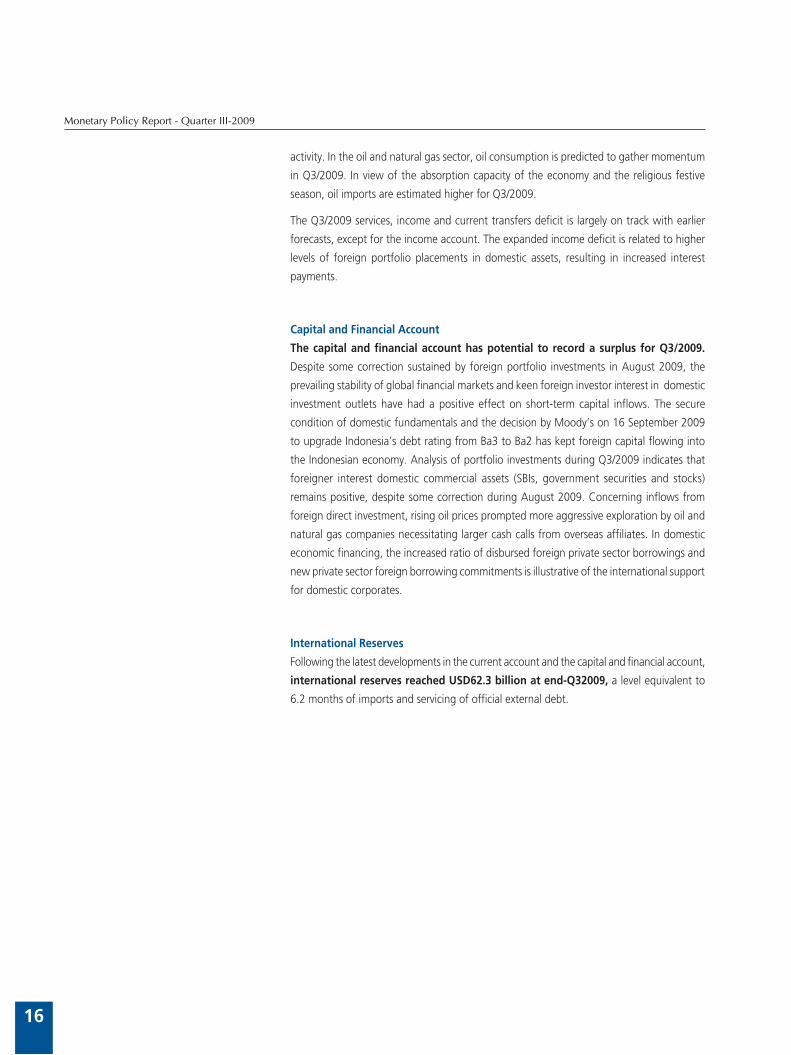
Potential for low national CPI inflation in 2009, now forecasted below
the 4.0% mark, is confirmed by the slowing trend in regional inflation
across the whole country. The sustained low level of inflation is explained
by improved supply-side response in the regions. This is visible in the
expanding manufacturing capacity and increased industrial use of
electricity amid rising consumption bolstered by more robust consumer
confidence. The inflationary spike triggered by falling agricultural
production from the effect of El Nino is not expected to have significant
impact, due to the actions and anticipatory measures taken by the central
and regional governments to counter the impact of El Nino. However, the
persistently high inflation in some cities, particularly in the Kali-Sulampua
and Sumatra regions, may become a potential source of inflationary
pressure. The high rate of inflation in these regions is explained by
difficult access for supply and distribution of goods.
At the regional level, the economic growth outlook is predicted to
improve in line with the forecast for national economic growth at
4.2% in 2009. The higher growth figure is supported by strengthening
consumption and exports. In disaggregation of growth, the Jabalnustra
Graph 2.10
Cement Sales
�
���
���
���
���
�����
�����
�����
�����
�����
�����
� � � � � � � � � ������ � � � � � � � � � ������ � � � � � � � �
���� ���� ����
�
��
���
���
���
���
���
���
���
�������� ����������� �������������
Graph 2.11
Kali Sulampua’s Main Commodities Export Volume
�
���
���
���
���
���
���
���
���
���
�����
� � � � � � � � � �� �� �� � � � � � � � � � �� �� �� � � � � � � �
���� ���� ����
�����
�����
������
������
������
������
������
������
����������
Graph 2.12
Regional Inflation
����
����
����
����
����
�����
�����
�����
�����
� � � � � � � � � �� �� �� � � � � � � � � ��
���� ����
������
���� ��� ����� ���
��������� �������������������
�������� ������������������������������� �������������������
���� ���������� �������������������
�������� �������� �������
����������� ���� ���������
Latest Macroeconomic Indicators
15
region accounts for the leading contribution to the national economy, followed by the Jakarta,
Kali-Sulampua and Sumatra regions. However, the future inflation outlook for all regions
remains at a low level, consistent with the national inflation projection for 2009. Although
regional inflation is low, there is still potential for increased pressure from the steady rise
in consumption and also from distribution of goods to various regions, most importantly
Kalimantan, the Maluku islands and Papua.
BALANCE OF PAYMENTS
The recovery in the global economy has had a beneficial effect on Indonesia’s external
performance, particularly in the current account. Merchandise trade showed improved
performance on the back of positive developments in commodity prices and strong demand
for resource-based commodities, especially in China and non-Japan Asia. The improved
absorption capacity of the domestic economy has stimulated imports. Accordingly, the
balance of trade is predicted to post an increased surplus. In the capital and financial account,
the sustained upward trend in domestic consumption and measures to ensure a conducive
investment climate support the continued positive outlook for investment in Indonesia. While
short-term capital inflows underwent some correction in mid-Q3/2009, foreign portfolio
investment transactions maintained a stable surplus. Taken together, the Q3/2009 balance
of payments is expected to chart a surplus.
The Current Account
Evaluation of the current account for Q3/2009 points to improvement. The trade surplus
was better, attributable largely to imports. Key to the positive export performance is robust
demand for resource-based commodities from some countries in non-Japan Asia, led by
China. This is expected to compensate in part for the drop in global demand, particularly
from G3 countries. Added to this, exports are also benefiting from the escalating trend in
commodity prices. At home, while consumption retains a positive role in bolstering economic
performance, the most recent data suggests that imports are somewhat below, a development
that has strengthened the trade surplus. This surplus was sufficient to offset the deficit in
the services transactions, income and current transfers account.
Exports have been bolstered by developments in commodity prices. During Q3/2009,
non-oil and gas export commodity prices contracted by -20.1%, representing an improvement
over the -22% of the preceding quarter. Non-oil commodity prices were down 1.3% during
September compared to one month earlier, with CPO and mining commodities especially
affected. The fall in CPO prices is related to the successful soy bean harvest in the US and
Latin America that has reduced demand for CPO as a soy bean substitute. The levelling of
mining commodity prices is suspected to be linked to the massive stocks held by some Asian
countries, most importantly China. Nevertheless, the drop in these commodity prices is not
expected to persist in view of the faster than expected economic recovery in trading partner
nations. As a result, the outcome for non-oil and gas exports for Q3/2009 is projected ahead
of earlier estimates. Imports are expected to benefit from the upturn in domestic economic
Monetary Policy Report - Quarter III-2009
16
activity. In the oil and natural gas sector, oil consumption is predicted to gather momentum
in Q3/2009. In view of the absorption capacity of the economy and the religious festive
season, oil imports are estimated higher for Q3/2009.
The Q3/2009 services, income and current transfers deficit is largely on track with earlier
forecasts, except for the income account. The expanded income deficit is related to higher
levels of foreign portfolio placements in domestic assets, resulting in increased interest
payments.
Capital and Financial Account
The capital and financial account has potential to record a surplus for Q3/2009.
Despite some correction sustained by foreign portfolio investments in August 2009, the
prevailing stability of global financial markets and keen foreign investor interest in domestic
investment outlets have had a positive effect on short-term capital inflows. The secure
condition of domestic fundamentals and the decision by Moody’s on 16 September 2009
to upgrade Indonesia’s debt rating from Ba3 to Ba2 has kept foreign capital flowing into
the Indonesian economy. Analysis of portfolio investments during Q3/2009 indicates that
foreigner interest domestic commercial assets (SBIs, government securities and stocks)
remains positive, despite some correction during August 2009. Concerning inflows from
foreign direct investment, rising oil prices prompted more aggressive exploration by oil and
natural gas companies necessitating larger cash calls from overseas affiliates. In domestic
economic financing, the increased ratio of disbursed foreign private sector borrowings and
new private sector foreign borrowing commitments is illustrative of the international support
for domestic corporates.
International Reserves
Following the latest developments in the current account and the capital and financial account,
international reserves reached USD62.3 billion at end-Q32009, a level equivalent to
6.2 months of imports and servicing of official external debt.
Monetary Indicators and Policy, Quarter III-2009
17
3. Monetary Indicators and Policy, Quarter III-2009
In Q3/2009, global economic developments were marked by steady improvement. The
faster than expected global economic recovery has imbued investors with optimism
for reinvesting in emerging markets. In addition, the solid condition of domestic
economic fundamentals underpinned movement in the exchange rate during
Q3/2009. The rupiah maintained an appreciating trend during Q3/2009 alongside
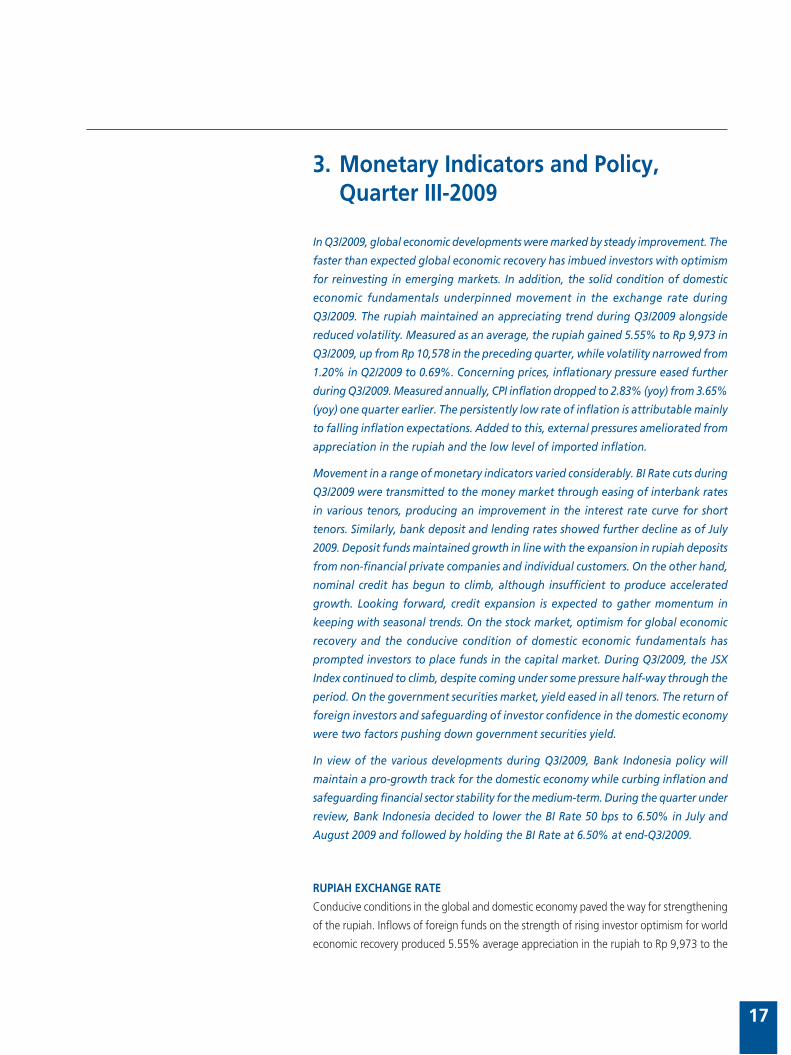
reduced volatility. Measured as an average, the rupiah gained 5.55% to Rp 9,973 in
Q3/2009, up from Rp 10,578 in the preceding quarter, while volatility narrowed from
1.20% in Q2/2009 to 0.69%. Concerning prices, inflationary pressure eased further
during Q3/2009. Measured annually, CPI inflation dropped to 2.83% (yoy) from 3.65%
(yoy) one quarter earlier. The persistently low rate of inflation is attributable mainly
to falling inflation expectations. Added to this, external pressures ameliorated from
appreciation in the rupiah and the low level of imported inflation.
Movement in a range of monetary indicators varied considerably. BI Rate cuts during
Q3/2009 were transmitted to the money market through easing of interbank rates
in various tenors, producing an improvement in the interest rate curve for short
tenors. Similarly, bank deposit and lending rates showed further decline as of July
2009. Deposit funds maintained growth in line with the expansion in rupiah deposits
from non-financial private companies and individual customers. On the other hand,
nominal credit has begun to climb, although insufficient to produce accelerated
growth. Looking forward, credit expansion is expected to gather momentum in
keeping with seasonal trends. On the stock market, optimism for global economic
recovery and the conducive condition of domestic economic fundamentals has
prompted investors to place funds in the capital market. During Q3/2009, the JSX
Index continued to climb, despite coming under some pressure half-way through the
period. On the government securities market, yield eased in all tenors. The return of
foreign investors and safeguarding of investor confidence in the domestic economy
were two factors pushing down government securities yield.
In view of the various developments during Q3/2009, Bank Indonesia policy will
maintain a pro-growth track for the domestic economy while curbing inflation and
safeguarding financial sector stability for the medium-term. During the quarter under
review, Bank Indonesia decided to lower the BI Rate 50 bps to 6.50% in July and
August 2009 and followed by holding the BI Rate at 6.50% at end-Q3/2009.
RUPIAH EXCHANGE RATE
Conducive conditions in the global and domestic economy paved the way for strengthening
of the rupiah. Inflows of foreign funds on the strength of rising investor optimism for world
economic recovery produced 5.55% average appreciation in the rupiah to Rp 9,973 to the
Monetary Policy Report - Quarter III-2009
18
US dollar from Rp 10,578 to the US dollar in the preceding quarter
(Graph 3.1). At end-Q3/2009, the rupiah closed at Rp 9,645, up 5.84%
over the close of the preceding quarter. The strengthening of the rupiah
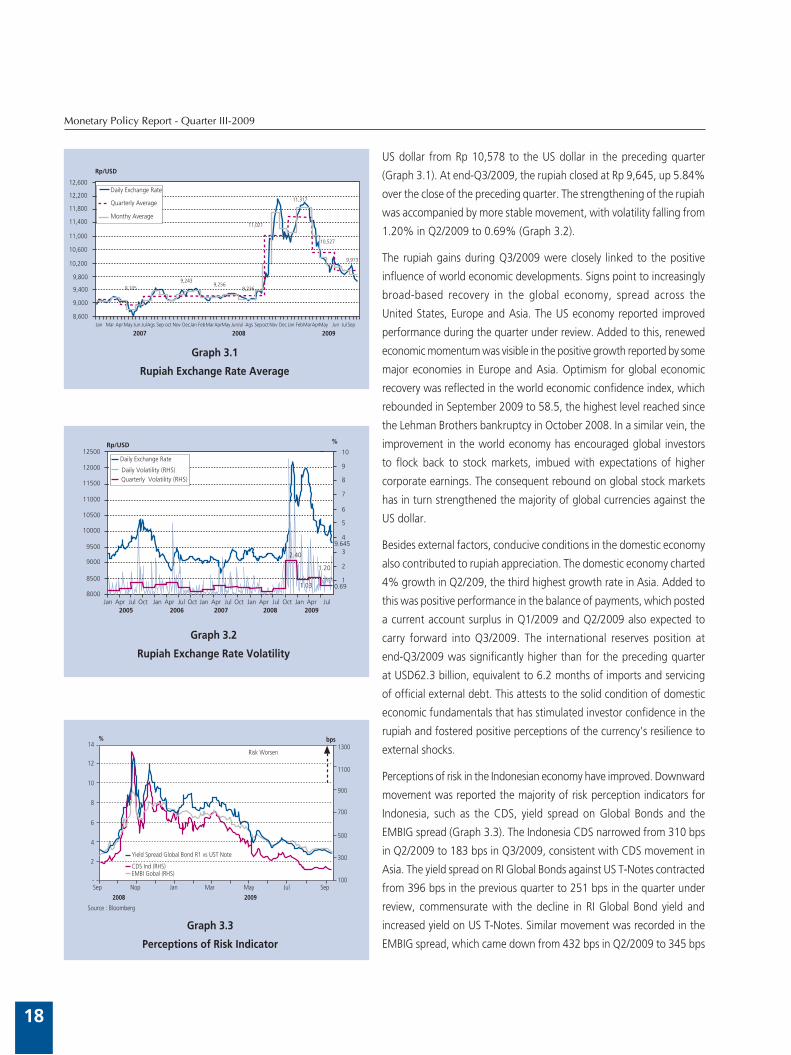
was accompanied by more stable movement, with volatility falling from
1.20% in Q2/2009 to 0.69% (Graph 3.2).
The rupiah gains during Q3/2009 were closely linked to the positive
influence of world economic developments. Signs point to increasingly
broad-based recovery in the global economy, spread across the
United States, Europe and Asia. The US economy reported improved
performance during the quarter under review. Added to this, renewed
economic momentum was visible in the positive growth reported by some
major economies in Europe and Asia. Optimism for global economic
recovery was reflected in the world economic confidence index, which
rebounded in September 2009 to 58.5, the highest level reached since
the Lehman Brothers bankruptcy in October 2008. In a similar vein, the
improvement in the world economy has encouraged global investors
to flock back to stock markets, imbued with expectations of higher
corporate earnings. The consequent rebound on global stock markets
has in turn strengthened the majority of global currencies against the
US dollar.
Besides external factors, conducive conditions in the domestic economy
also contributed to rupiah appreciation. The domestic economy charted
4% growth in Q2/209, the third highest growth rate in Asia. Added to
this was positive performance in the balance of payments, which posted
a current account surplus in Q1/2009 and Q2/2009 also expected to
carry forward into Q3/2009. The international reserves position at
end-Q3/2009 was significantly higher than for the preceding quarter
at USD62.3 billion, equivalent to 6.2 months of imports and servicing
of official external debt. This attests to the solid condition of domestic
economic fundamentals that has stimulated investor confidence in the
rupiah and fostered positive perceptions of the currency’s resilience to
external shocks.
Perceptions of risk in the Indonesian economy have improved. Downward
movement was reported the majority of risk perception indicators for
Indonesia, such as the CDS, yield spread on Global Bonds and the
EMBIG spread (Graph 3.3). The Indonesia CDS narrowed from 310 bps
in Q2/2009 to 183 bps in Q3/2009, consistent with CDS movement in
Asia. The yield spread on RI Global Bonds against US T-Notes contracted
from 396 bps in the previous quarter to 251 bps in the quarter under
review, commensurate with the decline in RI Global Bond yield and
increased yield on US T-Notes. Similar movement was recorded in the
EMBIG spread, which came down from 432 bps in Q2/2009 to 345 bps
Graph 3.1
Rupiah Exchange Rate Average
������
������
������
������
������
������
������
������
�����
�����
�����
�������� ��� ������ ��� ������ ��� ��� ��� ������ ��������� ������ ��� ��������� ������ ��� ������������ ���
���� ���� ����
����������
����������
������
������
������
�����������������
�������������������
��������������
�����
��� ���
Graph 3.2
Rupiah Exchange Rate Volatility
�����������
�����
�����
�����
�����
�����
����
����
����
������� ��� ��� ��� ��� ��� ��� ��� ��� ��� ��� ��� ��� ��� ��� ��� ��� ���
���� ���� ���� ���� ����
�
��
�
�
�
�
�
�
�
�
�
�����
����
����
����
�������������������������������������������������
�������������������
����
���
Graph 3.3
Perceptions of Risk Indicator
���������������������������������������
�����������������������������
�����������
���
��
��
�
�
�
�
���� ��� ��� ��� ��� ���
���� ����
���
���
���
���
���
������������������
����
����
���
���
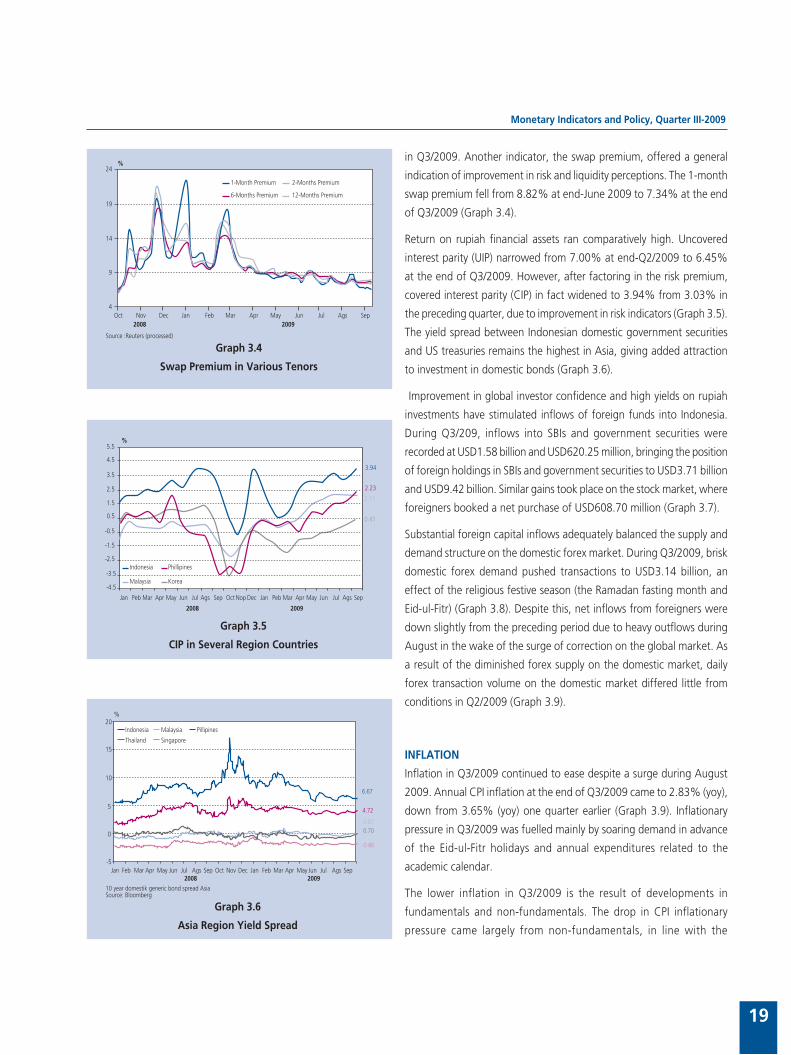
Monetary Indicators and Policy, Quarter III-2009
19
in Q3/2009. Another indicator, the swap premium, offered a general
indication of improvement in risk and liquidity perceptions. The 1-month
swap premium fell from 8.82% at end-June 2009 to 7.34% at the end
of Q3/2009 (Graph 3.4).
Return on rupiah financial assets ran comparatively high. Uncovered
interest parity (UIP) narrowed from 7.00% at end-Q2/2009 to 6.45%
at the end of Q3/2009. However, after factoring in the risk premium,
covered interest parity (CIP) in fact widened to 3.94% from 3.03% in
the preceding quarter, due to improvement in risk indicators (Graph 3.5).
The yield spread between Indonesian domestic government securities
and US treasuries remains the highest in Asia, giving added attraction
to investment in domestic bonds (Graph 3.6).
Improvement in global investor confidence and high yields on rupiah
investments have stimulated inflows of foreign funds into Indonesia.
During Q3/209, inflows into SBIs and government securities were
recorded at USD1.58 billion and USD620.25 million, bringing the position
of foreign holdings in SBIs and government securities to USD3.71 billion
and USD9.42 billion. Similar gains took place on the stock market, where
foreigners booked a net purchase of USD608.70 million (Graph 3.7).
Substantial foreign capital inflows adequately balanced the supply and
demand structure on the domestic forex market. During Q3/2009, brisk
domestic forex demand pushed transactions to USD3.14 billion, an
effect of the religious festive season (the Ramadan fasting month and
Eid-ul-Fitr) (Graph 3.8). Despite this, net inflows from foreigners were
down slightly from the preceding period due to heavy outflows during
August in the wake of the surge of correction on the global market. As
a result of the diminished forex supply on the domestic market, daily
forex transaction volume on the domestic market differed little from
conditions in Q2/2009 (Graph 3.9).
INFLATION
Inflation in Q3/2009 continued to ease despite a surge during August
2009. Annual CPI inflation at the end of Q3/2009 came to 2.83% (yoy),
down from 3.65% (yoy) one quarter earlier (Graph 3.9). Inflationary
pressure in Q3/2009 was fuelled mainly by soaring demand in advance
of the Eid-ul-Fitr holidays and annual expenditures related to the
academic calendar.
The lower inflation in Q3/2009 is the result of developments in
fundamentals and non-fundamentals. The drop in CPI inflationary
pressure came largely from non-fundamentals, in line with the
Graph 3.4
Swap Premium in Various Tenors
��������������� ����������������
���������������� �����������������
���
��
��
�
���� ��� ��� ��� ��� ��� ��� ��� ���
���� ����
���������������������������
��� ��� ���
Graph 3.5
CIP in Several Region Countries
��������� �����������
�������� �����
����
����
����
����
���
���
���
���
���
���
����
����
����
����
����
��� ��� ��� ��� ��� ��� ��� ��� ��� ��� ��� ��� ��� ��� ��� ��� ��� ���
���� ����
�
��� ��� ���
Graph 3.6
Asia Region Yield Spread
����������������������������������������������������������
��������
�
��� ��� ��� ��� ��� ��� ��� ��� ���
����
��� ��� ������ ��� ��� ��� ��� ���
��������� �������� ����������
�������� ���������
��
�
�
��
��
��
����
����
����
�����
��� ��� ���
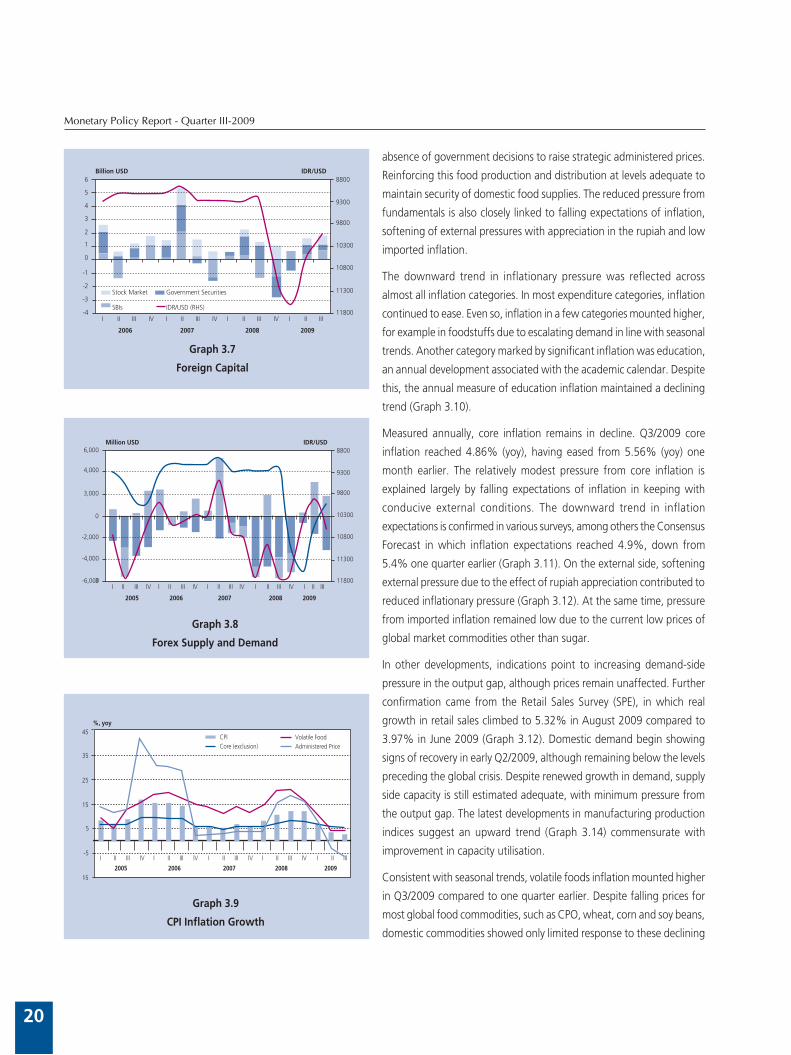
Monetary Policy Report - Quarter III-2009
20
absence of government decisions to raise strategic administered prices.
Reinforcing this food production and distribution at levels adequate to
maintain security of domestic food supplies. The reduced pressure from
fundamentals is also closely linked to falling expectations of inflation,
softening of external pressures with appreciation in the rupiah and low
imported inflation.
The downward trend in inflationary pressure was reflected across
almost all inflation categories. In most expenditure categories, inflation
continued to ease. Even so, inflation in a few categories mounted higher,
for example in foodstuffs due to escalating demand in line with seasonal
trends. Another category marked by significant inflation was education,
an annual development associated with the academic calendar. Despite
this, the annual measure of education inflation maintained a declining
trend (Graph 3.10).
Measured annually, core inflation remains in decline. Q3/2009 core
inflation reached 4.86% (yoy), having eased from 5.56% (yoy) one
month earlier. The relatively modest pressure from core inflation is
explained largely by falling expectations of inflation in keeping with
conducive external conditions. The downward trend in inflation
expectations is confirmed in various surveys, among others the Consensus
Forecast in which inflation expectations reached 4.9%, down from
5.4% one quarter earlier (Graph 3.11). On the external side, softening
external pressure due to the effect of rupiah appreciation contributed to
reduced inflationary pressure (Graph 3.12). At the same time, pressure
from imported inflation remained low due to the current low prices of
global market commodities other than sugar.
In other developments, indications point to increasing demand-side
pressure in the output gap, although prices remain unaffected. Further
confirmation came from the Retail Sales Survey (SPE), in which real
growth in retail sales climbed to 5.32% in August 2009 compared to
3.97% in June 2009 (Graph 3.12). Domestic demand begin showing
signs of recovery in early Q2/2009, although remaining below the levels
preceding the global crisis. Despite renewed growth in demand, supply
side capacity is still estimated adequate, with minimum pressure from
the output gap. The latest developments in manufacturing production
indices suggest an upward trend (Graph 3.14) commensurate with
improvement in capacity utilisation.
Consistent with seasonal trends, volatile foods inflation mounted higher
in Q3/2009 compared to one quarter earlier. Despite falling prices for
most global food commodities, such as CPO, wheat, corn and soy beans,
domestic commodities showed only limited response to these declining
Graph 3.7
Foreign Capital
�
�
�
�
�
�
�
��
��
��
��
���������������
����
����
�����
�����
�����
�����
�������
������������
����
���������������������
�������������
� �� ��� �� � �� ��� �� � �� ��� �� � �� ���
���� ���� ���� ����
Graph 3.8
Forex Supply and Demand
����������������������������
����������������������������
��������������������������������
����
�����
�����
�����
�
������
������
��������
���������������
����
����
�����
�����
�����
�����
�������
� �� ��� �� � �� ��� �� � �� ��� �� � �� ���
���� ���� ���� ����
� �� ��� ��
����
Graph 3.9
CPI Inflation Growth
���
��
�
��
��
��
��
�
���� ���� ����
�������������������
�������������������������������
������
�� ��� �� �
����
�� ��� �� �
����
�� ��� �� � �� ��� �� � �� ���
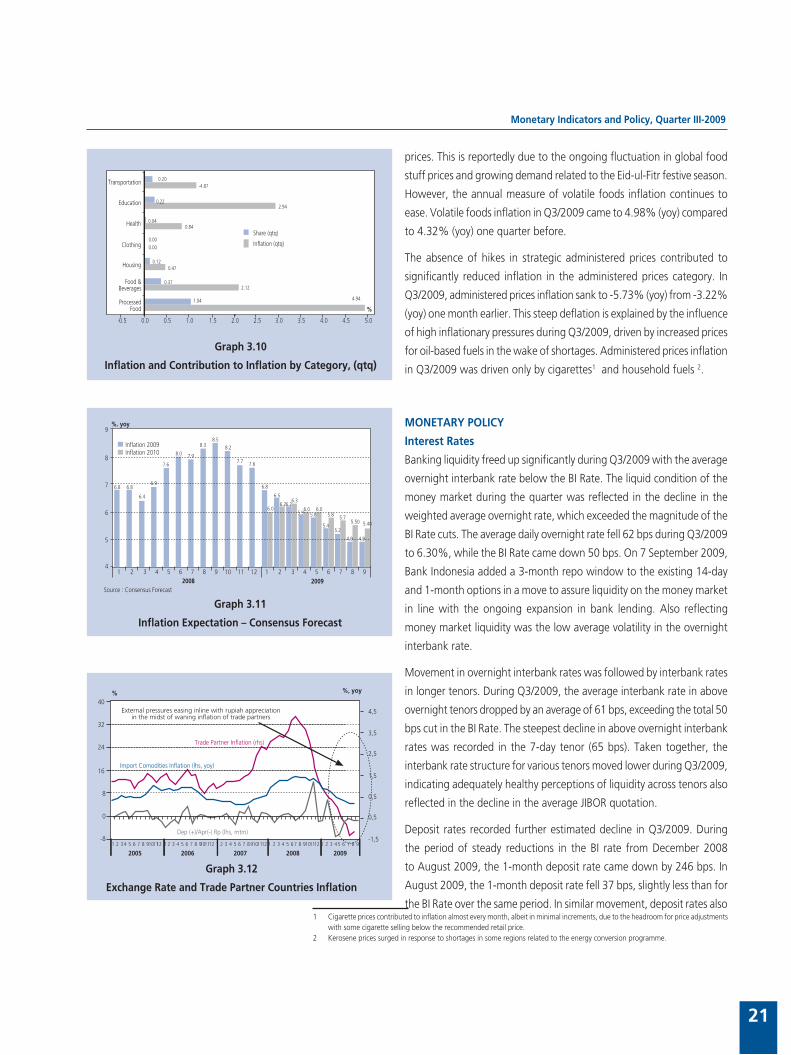
Monetary Indicators and Policy, Quarter III-2009
21
prices. This is reportedly due to the ongoing fluctuation in global food
stuff prices and growing demand related to the Eid-ul-Fitr festive season.
However, the annual measure of volatile foods inflation continues to
ease. Volatile foods inflation in Q3/2009 came to 4.98% (yoy) compared
to 4.32% (yoy) one quarter before.
The absence of hikes in strategic administered prices contributed to
significantly reduced inflation in the administered prices category. In
Q3/2009, administered prices inflation sank to -5.73% (yoy) from -3.22%
(yoy) one month earlier. This steep deflation is explained by the influence
of high inflationary pressures during Q3/2009, driven by increased prices
for oil-based fuels in the wake of shortages. Administered prices inflation
in Q3/2009 was driven only by cigarettes1 and household fuels 2.
MONETARY POLICY
Interest Rates
Banking liquidity freed up significantly during Q3/2009 with the average
overnight interbank rate below the BI Rate. The liquid condition of the
money market during the quarter was reflected in the decline in the
weighted average overnight rate, which exceeded the magnitude of the
BI Rate cuts. The average daily overnight rate fell 62 bps during Q3/2009
to 6.30%, while the BI Rate came down 50 bps. On 7 September 2009,
Bank Indonesia added a 3-month repo window to the existing 14-day
and 1-month options in a move to assure liquidity on the money market
in line with the ongoing expansion in bank lending. Also reflecting
money market liquidity was the low average volatility in the overnight
interbank rate.
Movement in overnight interbank rates was followed by interbank rates
in longer tenors. During Q3/2009, the average interbank rate in above
overnight tenors dropped by an average of 61 bps, exceeding the total 50
bps cut in the BI Rate. The steepest decline in above overnight interbank
rates was recorded in the 7-day tenor (65 bps). Taken together, the
interbank rate structure for various tenors moved lower during Q3/2009,
indicating adequately healthy perceptions of liquidity across tenors also
reflected in the decline in the average JIBOR quotation.
Deposit rates recorded further estimated decline in Q3/2009. During
the period of steady reductions in the BI rate from December 2008
to August 2009, the 1-month deposit rate came down by 246 bps. In
August 2009, the 1-month deposit rate fell 37 bps, slightly less than for
the BI Rate over the same period. In similar movement, deposit rates also 1 Cigarette prices contributed to inflation almost every month, albeit in minimal increments, due to the headroom for price adjustments
with some cigarette selling below the recommended retail price.2 Kerosene prices surged in response to shortages in some regions related to the energy conversion programme.
Graph 3.10
Inflation and Contribution to Inflation by Category, (qtq)
����
����
����
����
����
� �����
����
����
����
����
����
����
���� ��� ��� ��� ��� ���
�������������
���������������
�������
��������
������
���������
��������������
�����������
���������������
����
����
�
��� ��� ��� ��� ��� ���
Graph 3.11
Inflation Expectation – Consensus Forecast
�������
�
�
�
�
��� ���
���
���
���
��� ���
������
���
��� ���
���
���
���
���������
������ ���
��� ���
���
� � � � � � � � � �� �� �� � � � � � ����� ����
����������������������������
�
���
���
����
���
����
���
� � �
���������������������������
Graph 3.12
Exchange Rate and Trade Partner Countries Inflation
���
��
�
�
��
��
��
��
� � �� � � � � ������� �� � � � � � � ������� � � � � � � � �������� � � � � � �� � ������� � � � �� �
���� ���� ���� ���� ����
� ������
��������������������������������������
�����������������������������
����������������������������
�����������������������������������������������������������������������������������������������������������
���
���
���
���
���
����� � �
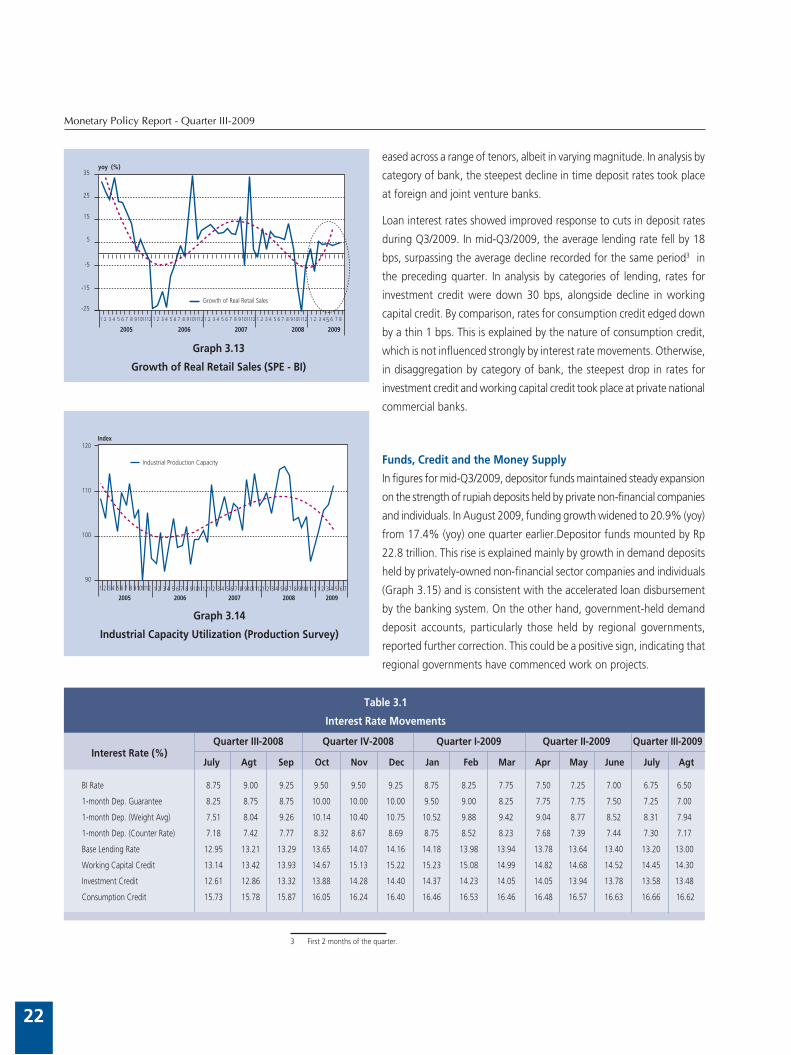
Monetary Policy Report - Quarter III-2009
22
eased across a range of tenors, albeit in varying magnitude. In analysis by
category of bank, the steepest decline in time deposit rates took place
at foreign and joint venture banks.
Loan interest rates showed improved response to cuts in deposit rates
during Q3/2009. In mid-Q3/2009, the average lending rate fell by 18
bps, surpassing the average decline recorded for the same period3 in
the preceding quarter. In analysis by categories of lending, rates for
investment credit were down 30 bps, alongside decline in working
capital credit. By comparison, rates for consumption credit edged down
by a thin 1 bps. This is explained by the nature of consumption credit,
which is not influenced strongly by interest rate movements. Otherwise,
in disaggregation by category of bank, the steepest drop in rates for
investment credit and working capital credit took place at private national
commercial banks.
Funds, Credit and the Money Supply
In figures for mid-Q3/2009, depositor funds maintained steady expansion
on the strength of rupiah deposits held by private non-financial companies
and individuals. In August 2009, funding growth widened to 20.9% (yoy)
from 17.4% (yoy) one quarter earlier.Depositor funds mounted by Rp
22.8 trillion. This rise is explained mainly by growth in demand deposits
held by privately-owned non-financial sector companies and individuals
(Graph 3.15) and is consistent with the accelerated loan disbursement
by the banking system. On the other hand, government-held demand
deposit accounts, particularly those held by regional governments,
reported further correction. This could be a positive sign, indicating that
regional governments have commenced work on projects.
3 First 2 months of the quarter.
July Agt Sep Oct Nov Dec Jan Feb Mar Apr May June July AgtInterest Rate (%)
Quarter III-2008 Quarter IV-2008 Quarter I-2009 Quarter II-2009 Quarter III-2009
Table 3.1
Interest Rate Movements
BI Rate 8.75 9.00 9.25 9.50 9.50 9.25 8.75 8.25 7.75 7.50 7.25 7.00 6.75 6.50
1-month Dep. Guarantee 8.25 8.75 8.75 10.00 10.00 10.00 9.50 9.00 8.25 7.75 7.75 7.50 7.25 7.00
1-month Dep. (Weight Avg) 7.51 8.04 9.26 10.14 10.40 10.75 10.52 9.88 9.42 9.04 8.77 8.52 8.31 7.94
1-month Dep. (Counter Rate) 7.18 7.42 7.77 8.32 8.67 8.69 8.75 8.52 8.23 7.68 7.39 7.44 7.30 7.17
Base Lending Rate 12.95 13.21 13.29 13.65 14.07 14.16 14.18 13.98 13.94 13.78 13.64 13.40 13.20 13.00
Working Capital Credit 13.14 13.42 13.93 14.67 15.13 15.22 15.23 15.08 14.99 14.82 14.68 14.52 14.45 14.30
Investment Credit 12.61 12.86 13.32 13.88 14.28 14.40 14.37 14.23 14.05 14.05 13.94 13.78 13.58 13.48
Consumption Credit 15.73 15.78 15.87 16.05 16.24 16.40 16.46 16.53 16.46 16.48 16.57 16.63 16.66 16.62
Graph 3.13
Growth of Real Retail Sales (SPE - BI)
��������
���������������������������
��
���� ���� ���� ���� ����
��
��
�
��
���
���
� � � � � � � � ������� � � � � � � � � �������� � � � � � � � ������� � � � � � � � � ������� � � � � � � � �
Graph 3.14
Industrial Capacity Utilization (Production Survey)
�����
������������������������������
���
���
���
��� � � � � � � � ������� � � � � � � � � �������� � � � � � � � �������� � � � � � � � �������� � � �
���� ���� ���� ���� ����� � �
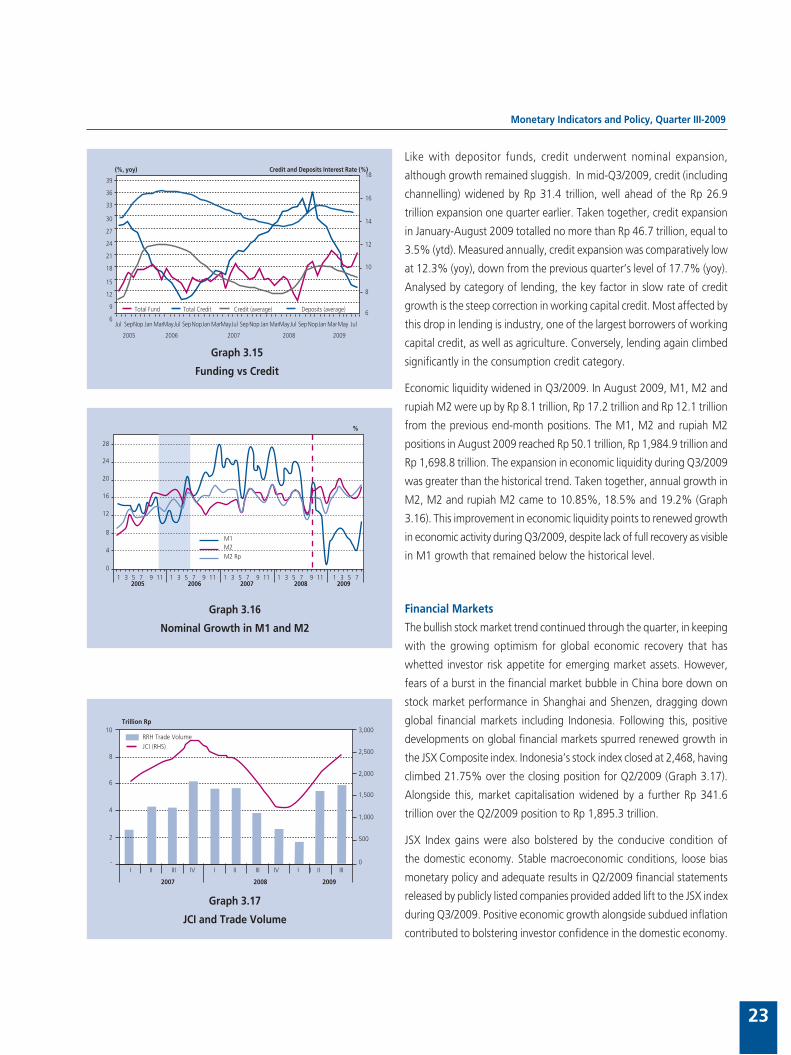
Monetary Indicators and Policy, Quarter III-2009
23
Like with depositor funds, credit underwent nominal expansion,
although growth remained sluggish. In mid-Q3/2009, credit (including
channelling) widened by Rp 31.4 trillion, well ahead of the Rp 26.9
trillion expansion one quarter earlier. Taken together, credit expansion
in January-August 2009 totalled no more than Rp 46.7 trillion, equal to
3.5% (ytd). Measured annually, credit expansion was comparatively low
at 12.3% (yoy), down from the previous quarter’s level of 17.7% (yoy).
Analysed by category of lending, the key factor in slow rate of credit
growth is the steep correction in working capital credit. Most affected by
this drop in lending is industry, one of the largest borrowers of working
capital credit, as well as agriculture. Conversely, lending again climbed
significantly in the consumption credit category.
Economic liquidity widened in Q3/2009. In August 2009, M1, M2 and
rupiah M2 were up by Rp 8.1 trillion, Rp 17.2 trillion and Rp 12.1 trillion
from the previous end-month positions. The M1, M2 and rupiah M2
positions in August 2009 reached Rp 50.1 trillion, Rp 1,984.9 trillion and
Rp 1,698.8 trillion. The expansion in economic liquidity during Q3/2009
was greater than the historical trend. Taken together, annual growth in
M2, M2 and rupiah M2 came to 10.85%, 18.5% and 19.2% (Graph
3.16). This improvement in economic liquidity points to renewed growth
in economic activity during Q3/2009, despite lack of full recovery as visible
in M1 growth that remained below the historical level.
Financial Markets
The bullish stock market trend continued through the quarter, in keeping
with the growing optimism for global economic recovery that has
whetted investor risk appetite for emerging market assets. However,
fears of a burst in the financial market bubble in China bore down on
stock market performance in Shanghai and Shenzen, dragging down
global financial markets including Indonesia. Following this, positive
developments on global financial markets spurred renewed growth in
the JSX Composite index. Indonesia’s stock index closed at 2,468, having
climbed 21.75% over the closing position for Q2/2009 (Graph 3.17).
Alongside this, market capitalisation widened by a further Rp 341.6
trillion over the Q2/2009 position to Rp 1,895.3 trillion.
JSX Index gains were also bolstered by the conducive condition of
the domestic economy. Stable macroeconomic conditions, loose bias
monetary policy and adequate results in Q2/2009 financial statements
released by publicly listed companies provided added lift to the JSX index
during Q3/2009. Positive economic growth alongside subdued inflation
contributed to bolstering investor confidence in the domestic economy.
Graph 3.16
Nominal Growth in M1 and M2
���������
��
��
��
��
��
�
�
�� � � � � �� � � � � � �� � � � � � �� � � � � � �� � � � �
���� ���� ���� ���� ����
�
Graph 3.15
Funding vs Credit
�
�
��
��
��
��
��
�
�
��
��
��
��
��
��
��
��
��
��
�������� �������������������������������������
���������� ������������ ���������������� ������������������
��� ������ ������������ ������������������ ������ ������������ ���������������
���� ���� ���� ���� ����
���
Graph 3.17
JCI and Trade Volume
��
�
�
�
�
�
�����
�����
�����
�����
�
�������������������������
�����������
� �
������������
�����
���
�� ��� �� � �� ��� �� � �� ���
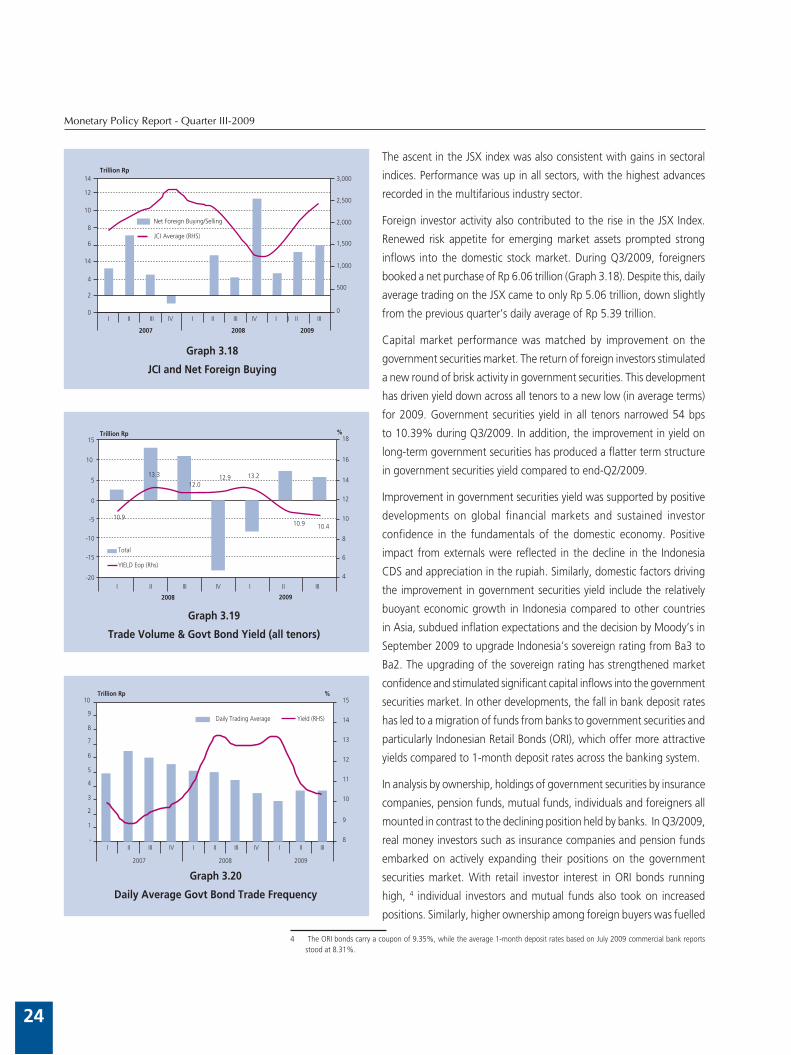
Monetary Policy Report - Quarter III-2009
24
The ascent in the JSX index was also consistent with gains in sectoral
indices. Performance was up in all sectors, with the highest advances
recorded in the multifarious industry sector.
Foreign investor activity also contributed to the rise in the JSX Index.
Renewed risk appetite for emerging market assets prompted strong
inflows into the domestic stock market. During Q3/2009, foreigners
booked a net purchase of Rp 6.06 trillion (Graph 3.18). Despite this, daily
average trading on the JSX came to only Rp 5.06 trillion, down slightly
from the previous quarter’s daily average of Rp 5.39 trillion.
Capital market performance was matched by improvement on the
government securities market. The return of foreign investors stimulated
a new round of brisk activity in government securities. This development
has driven yield down across all tenors to a new low (in average terms)
for 2009. Government securities yield in all tenors narrowed 54 bps
to 10.39% during Q3/2009. In addition, the improvement in yield on
long-term government securities has produced a flatter term structure
in government securities yield compared to end-Q2/2009.
Improvement in government securities yield was supported by positive
developments on global financial markets and sustained investor
confidence in the fundamentals of the domestic economy. Positive
impact from externals were reflected in the decline in the Indonesia
CDS and appreciation in the rupiah. Similarly, domestic factors driving
the improvement in government securities yield include the relatively
buoyant economic growth in Indonesia compared to other countries
in Asia, subdued inflation expectations and the decision by Moody’s in
September 2009 to upgrade Indonesia’s sovereign rating from Ba3 to
Ba2. The upgrading of the sovereign rating has strengthened market
confidence and stimulated significant capital inflows into the government
securities market. In other developments, the fall in bank deposit rates
has led to a migration of funds from banks to government securities and
particularly Indonesian Retail Bonds (ORI), which offer more attractive
yields compared to 1-month deposit rates across the banking system.
In analysis by ownership, holdings of government securities by insurance
companies, pension funds, mutual funds, individuals and foreigners all
mounted in contrast to the declining position held by banks. In Q3/2009,
real money investors such as insurance companies and pension funds
embarked on actively expanding their positions on the government
securities market. With retail investor interest in ORI bonds running
high, 4 individual investors and mutual funds also took on increased
positions. Similarly, higher ownership among foreign buyers was fuelled
4 The ORI bonds carry a coupon of 9.35%, while the average 1-month deposit rates based on July 2009 commercial bank reports stood at 8.31%.
Graph 3.20
Daily Average Govt Bond Trade Frequency
�
�
�
�
�
�
�
�
�
�
��
� �� ��� �� � �� ��� �� � �� ���
���� ���� ����
�
�
��
��
��
��
��
��
��������������������� �����������
����������� �
Graph 3.18
JCI and Net Foreign Buying
�� �����
�����
�����
�����
�
��������������������������
�����������������
�����������
� �
������������
�����
���
�� ��� �� � �� ��� �� � �� ���
��
��
�
�
��
�
�
�
Graph 3.19
Trade Volume & Govt Bond Yield (all tenors)
����
��������
���� ����
���� ����
�����
���������������
���
��
��
�
��
��
���
���� ����
��
�
�
���
���
��
��
�
�
� �� ��� �� � �� ���
�����������
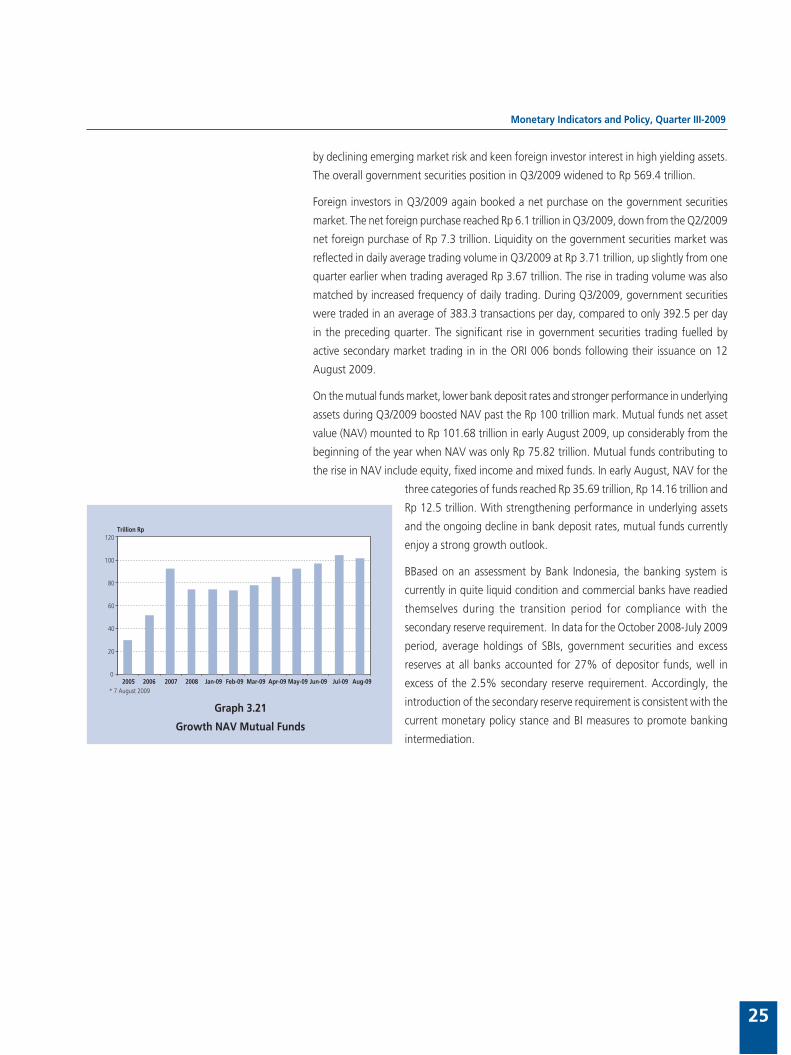
Monetary Indicators and Policy, Quarter III-2009
25
by declining emerging market risk and keen foreign investor interest in high yielding assets.
The overall government securities position in Q3/2009 widened to Rp 569.4 trillion.
Foreign investors in Q3/2009 again booked a net purchase on the government securities
market. The net foreign purchase reached Rp 6.1 trillion in Q3/2009, down from the Q2/2009
net foreign purchase of Rp 7.3 trillion. Liquidity on the government securities market was
reflected in daily average trading volume in Q3/2009 at Rp 3.71 trillion, up slightly from one
quarter earlier when trading averaged Rp 3.67 trillion. The rise in trading volume was also
matched by increased frequency of daily trading. During Q3/2009, government securities
were traded in an average of 383.3 transactions per day, compared to only 392.5 per day
in the preceding quarter. The significant rise in government securities trading fuelled by
active secondary market trading in in the ORI 006 bonds following their issuance on 12
August 2009.
On the mutual funds market, lower bank deposit rates and stronger performance in underlying
assets during Q3/2009 boosted NAV past the Rp 100 trillion mark. Mutual funds net asset
value (NAV) mounted to Rp 101.68 trillion in early August 2009, up considerably from the
beginning of the year when NAV was only Rp 75.82 trillion. Mutual funds contributing to
the rise in NAV include equity, fixed income and mixed funds. In early August, NAV for the
three categories of funds reached Rp 35.69 trillion, Rp 14.16 trillion and
Rp 12.5 trillion. With strengthening performance in underlying assets
and the ongoing decline in bank deposit rates, mutual funds currently
enjoy a strong growth outlook.
BBased on an assessment by Bank Indonesia, the banking system is
currently in quite liquid condition and commercial banks have readied
themselves during the transition period for compliance with the
secondary reserve requirement. In data for the October 2008-July 2009
period, average holdings of SBIs, government securities and excess
reserves at all banks accounted for 27% of depositor funds, well in
excess of the 2.5% secondary reserve requirement. Accordingly, the
introduction of the secondary reserve requirement is consistent with the
current monetary policy stance and BI measures to promote banking
intermediation.
Graph 3.21
Growth NAV Mutual Funds
�
��
��
��
��
���
���
���� ���� ���� ���� ������ ������ ������ ������ ������ ������ ������ ������
�����������
���������������
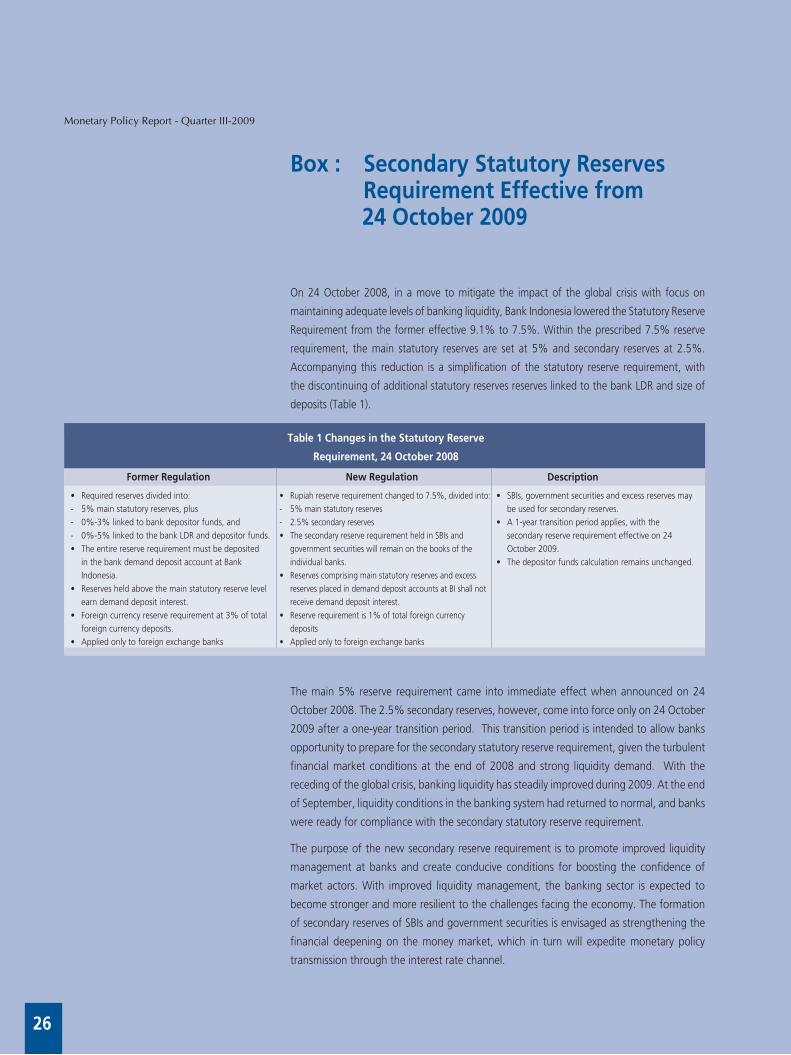
Monetary Policy Report - Quarter III-2009
26 26
Box : Secondary Statutory Reserves Requirement Effective from 24 October 2009
On 24 October 2008, in a move to mitigate the impact of the global crisis with focus on
maintaining adequate levels of banking liquidity, Bank Indonesia lowered the Statutory Reserve
Requirement from the former effective 9.1% to 7.5%. Within the prescribed 7.5% reserve
requirement, the main statutory reserves are set at 5% and secondary reserves at 2.5%.
Accompanying this reduction is a simplification of the statutory reserve requirement, with
the discontinuing of additional statutory reserves reserves linked to the bank LDR and size of
deposits (Table 1).
The main 5% reserve requirement came into immediate effect when announced on 24
October 2008. The 2.5% secondary reserves, however, come into force only on 24 October
2009 after a one-year transition period. This transition period is intended to allow banks
opportunity to prepare for the secondary statutory reserve requirement, given the turbulent
financial market conditions at the end of 2008 and strong liquidity demand. With the
receding of the global crisis, banking liquidity has steadily improved during 2009. At the end
of September, liquidity conditions in the banking system had returned to normal, and banks
were ready for compliance with the secondary statutory reserve requirement.
The purpose of the new secondary reserve requirement is to promote improved liquidity
management at banks and create conducive conditions for boosting the confidence of
market actors. With improved liquidity management, the banking sector is expected to
become stronger and more resilient to the challenges facing the economy. The formation
of secondary reserves of SBIs and government securities is envisaged as strengthening the
financial deepening on the money market, which in turn will expedite monetary policy
transmission through the interest rate channel.
26
New RegulationFormer Regulation Description
Table 1 Changes in the Statutory Reserve
Requirement, 24 October 2008
• Requiredreservesdividedinto:- 5% main statutory reserves, plus- 0%-3% linked to bank depositor funds, and - 0%-5% linked to the bank LDR and depositor funds.• Theentirereserverequirementmustbedeposited
in the bank demand deposit account at Bank Indonesia.
• Reservesheldabovethemainstatutoryreservelevelearn demand deposit interest.
• Foreigncurrencyreserverequirementat3%oftotalforeign currency deposits.
• Appliedonlytoforeignexchangebanks
• Rupiahreserverequirementchangedto7.5%,dividedinto:- 5% main statutory reserves- 2.5% secondary reserves• ThesecondaryreserverequirementheldinSBIsand
government securities will remain on the books of the individual banks.
• Reservescomprisingmainstatutoryreservesandexcessreserves placed in demand deposit accounts at BI shall not receive demand deposit interest.
• Reserverequirementis1%oftotalforeigncurrencydeposits
• Appliedonlytoforeignexchangebanks
• SBIs,governmentsecuritiesandexcessreservesmaybe used for secondary reserves.
• A1-yeartransitionperiodapplies,withthesecondary reserve requirement effective on 24 October 2009.
• Thedepositorfundscalculationremainsunchanged.
Monetary Policy Report - Quarter III-2009
The Indonesian Economic Outlook
27
4. The Indonesian Economic Outlook
The ongoing recovery in the global economy has helped bring improvement to the
domestic economy, As a result, the Indonesian economy has potential to outperform
earlier growth forecasts for 2009 and 2010, buoyed by brisk household consumption,
better than predicted export performance and the government stimulus. Key to the
continued strong household consumption are high levels of consumer confidence
engendered by low inflation and interest rates and the income effect of rising
exports. Similarly, exports will benefit from the strengthening global economic
recovery process and hikes in oil, natural gas and non-oil and gas commodity prices.
Investment is forecasted to maintain limited growth in view of currently low levels
of capacity utilisation. The fiscal stimulus has also bolstered the performance of the
domestic economy, as reflected in brisk growth in government consumption and
investment. On the supply side, renewed growth is forecasted across a range of
sectors, in tandem with rising domestic and external demand in tradable sectors. In
response to these developments, the Indonesian economy is on track for 4.0%-4.5%
growth in 2009, ahead of the original 3.5%-4.0% prediction. Similarly, for 2010,
Bank Indonesia forecasts economic growth in the range of 5.0%-5.5%. Vigilance is
still needed in regard to various risks from uncertainty in the recovery process for
world trade given that the stimulus-backed actions to boost recovery in advanced
nations are more oriented to domestic demand, the high unemployment besetting
developed nations and protectionist tendencies in operation in some countries after
the global crisis. At the same time, a close watch is needed on the risk of escalation
in world oil prices driven by speculative activity.
Concerning the inflation outlook, the downward inflation trend in 2009 is set to
continue, but with potential for a return to normality in 2010. During 2009, CPI
inflation is expected to stay on course for the inflation target set at 4.5%±1%. In
2010, CPI inflation is predicted to resume normal behaviour in the 5±1% range in
response to strengthening domestic economic activity, higher imported inflation from
increased commodity prices and rising inflation expectations. On the fundamentals
side, mounting inflationary pressure is predicted from increases in various non-
strategic administered prices. Despite this, only modest volatile foods inflation is
expected in view of adequate measures to safeguard the supply and distribution of
food and energy needs.
ASSUMPTIONS AND SCENARIOS
International Economic Conditions
The world economy, which underwent contraction during the first half of 2009, is forecasted
to chart more rapid recovery with positive growth in the second half of 2009. The recovery
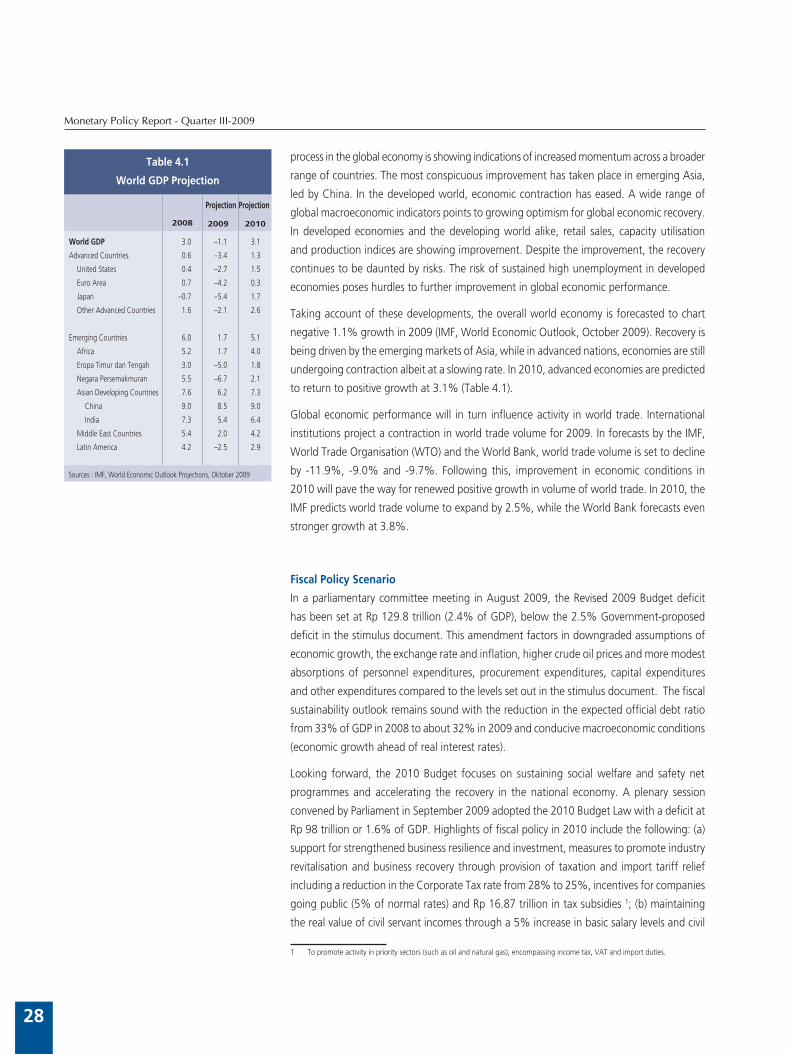
Monetary Policy Report - Quarter III-2009
28
process in the global economy is showing indications of increased momentum across a broader
range of countries. The most conspicuous improvement has taken place in emerging Asia,
led by China. In the developed world, economic contraction has eased. A wide range of
global macroeconomic indicators points to growing optimism for global economic recovery.
In developed economies and the developing world alike, retail sales, capacity utilisation
and production indices are showing improvement. Despite the improvement, the recovery
continues to be daunted by risks. The risk of sustained high unemployment in developed
economies poses hurdles to further improvement in global economic performance.
Taking account of these developments, the overall world economy is forecasted to chart
negative 1.1% growth in 2009 (IMF, World Economic Outlook, October 2009). Recovery is
being driven by the emerging markets of Asia, while in advanced nations, economies are still
undergoing contraction albeit at a slowing rate. In 2010, advanced economies are predicted
to return to positive growth at 3.1% (Table 4.1).
Global economic performance will in turn influence activity in world trade. International
institutions project a contraction in world trade volume for 2009. In forecasts by the IMF,
World Trade Organisation (WTO) and the World Bank, world trade volume is set to decline
by -11.9%, -9.0% and -9.7%. Following this, improvement in economic conditions in
2010 will pave the way for renewed positive growth in volume of world trade. In 2010, the
IMF predicts world trade volume to expand by 2.5%, while the World Bank forecasts even
stronger growth at 3.8%.
Fiscal Policy Scenario
In a parliamentary committee meeting in August 2009, the Revised 2009 Budget deficit
has been set at Rp 129.8 trillion (2.4% of GDP), below the 2.5% Government-proposed
deficit in the stimulus document. This amendment factors in downgraded assumptions of
economic growth, the exchange rate and inflation, higher crude oil prices and more modest
absorptions of personnel expenditures, procurement expenditures, capital expenditures
and other expenditures compared to the levels set out in the stimulus document. The fiscal
sustainability outlook remains sound with the reduction in the expected official debt ratio
from 33% of GDP in 2008 to about 32% in 2009 and conducive macroeconomic conditions
(economic growth ahead of real interest rates).
Looking forward, the 2010 Budget focuses on sustaining social welfare and safety net
programmes and accelerating the recovery in the national economy. A plenary session
convened by Parliament in September 2009 adopted the 2010 Budget Law with a deficit at
Rp 98 trillion or 1.6% of GDP. Highlights of fiscal policy in 2010 include the following: (a)
support for strengthened business resilience and investment, measures to promote industry
revitalisation and business recovery through provision of taxation and import tariff relief
including a reduction in the Corporate Tax rate from 28% to 25%, incentives for companies
going public (5% of normal rates) and Rp 16.87 trillion in tax subsidies 1; (b) maintaining
the real value of civil servant incomes through a 5% increase in basic salary levels and civil
1 To promote activity in priority sectors (such as oil and natural gas), encompassing income tax, VAT and import duties.
World GDP 3.0 –1.1 3.1
Advanced Countries 0.6 –3.4 1.3
United States 0.4 –2.7 1.5
Euro Area 0.7 –4.2 0.3
Japan –0.7 –5.4 1.7
Other Advanced Countries 1.6 –2.1 2.6
Emerging Countries 6.0 1.7 5.1
Africa 5.2 1.7 4.0
Eropa Timur dan Tengah 3.0 –5.0 1.8
Negara Persemakmuran 5.5 –6.7 2.1
Asian Developing Countries 7.6 6.2 7.3
China 9.0 8.5 9.0
India 7.3 5.4 6.4
Middle East Countries 5.4 2.0 4.2
Latin America 4.2 –2.5 2.9
Table 4.1
World GDP Projection
Sources : IMF, World Economic Outlook Projections, Oktober 2009
Projection Projection
2008 20102009
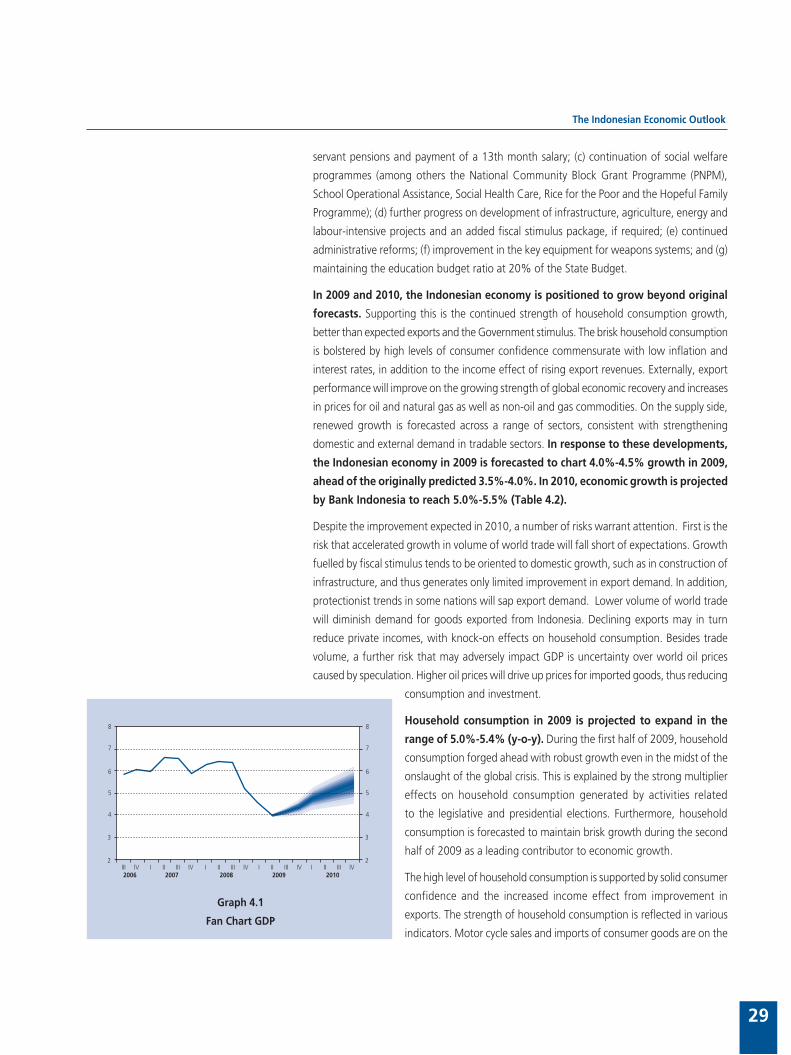
The Indonesian Economic Outlook
29
servant pensions and payment of a 13th month salary; (c) continuation of social welfare
programmes (among others the National Community Block Grant Programme (PNPM),
School Operational Assistance, Social Health Care, Rice for the Poor and the Hopeful Family
Programme); (d) further progress on development of infrastructure, agriculture, energy and
labour-intensive projects and an added fiscal stimulus package, if required; (e) continued
administrative reforms; (f) improvement in the key equipment for weapons systems; and (g)
maintaining the education budget ratio at 20% of the State Budget.
In 2009 and 2010, the Indonesian economy is positioned to grow beyond original
forecasts. Supporting this is the continued strength of household consumption growth,
better than expected exports and the Government stimulus. The brisk household consumption
is bolstered by high levels of consumer confidence commensurate with low inflation and
interest rates, in addition to the income effect of rising export revenues. Externally, export
performance will improve on the growing strength of global economic recovery and increases
in prices for oil and natural gas as well as non-oil and gas commodities. On the supply side,
renewed growth is forecasted across a range of sectors, consistent with strengthening
domestic and external demand in tradable sectors. In response to these developments,
the Indonesian economy in 2009 is forecasted to chart 4.0%-4.5% growth in 2009,
ahead of the originally predicted 3.5%-4.0%. In 2010, economic growth is projected
by Bank Indonesia to reach 5.0%-5.5% (Table 4.2).
Despite the improvement expected in 2010, a number of risks warrant attention. First is the
risk that accelerated growth in volume of world trade will fall short of expectations. Growth
fuelled by fiscal stimulus tends to be oriented to domestic growth, such as in construction of
infrastructure, and thus generates only limited improvement in export demand. In addition,
protectionist trends in some nations will sap export demand. Lower volume of world trade
will diminish demand for goods exported from Indonesia. Declining exports may in turn
reduce private incomes, with knock-on effects on household consumption. Besides trade
volume, a further risk that may adversely impact GDP is uncertainty over world oil prices
caused by speculation. Higher oil prices will drive up prices for imported goods, thus reducing
consumption and investment.
Household consumption in 2009 is projected to expand in the
range of 5.0%-5.4% (y-o-y). During the first half of 2009, household
consumption forged ahead with robust growth even in the midst of the
onslaught of the global crisis. This is explained by the strong multiplier
effects on household consumption generated by activities related
to the legislative and presidential elections. Furthermore, household
consumption is forecasted to maintain brisk growth during the second
half of 2009 as a leading contributor to economic growth.
The high level of household consumption is supported by solid consumer
confidence and the increased income effect from improvement in
exports. The strength of household consumption is reflected in various
indicators. Motor cycle sales and imports of consumer goods are on the
Graph 4.1
Fan Chart GDP
�
�
�
�
�
�
�
�
�
�
�
�
�
���� �� ��� ��� �� ��� ��� �� ��� ��� �� ��� ��� ������ ���� ���� ���� ����
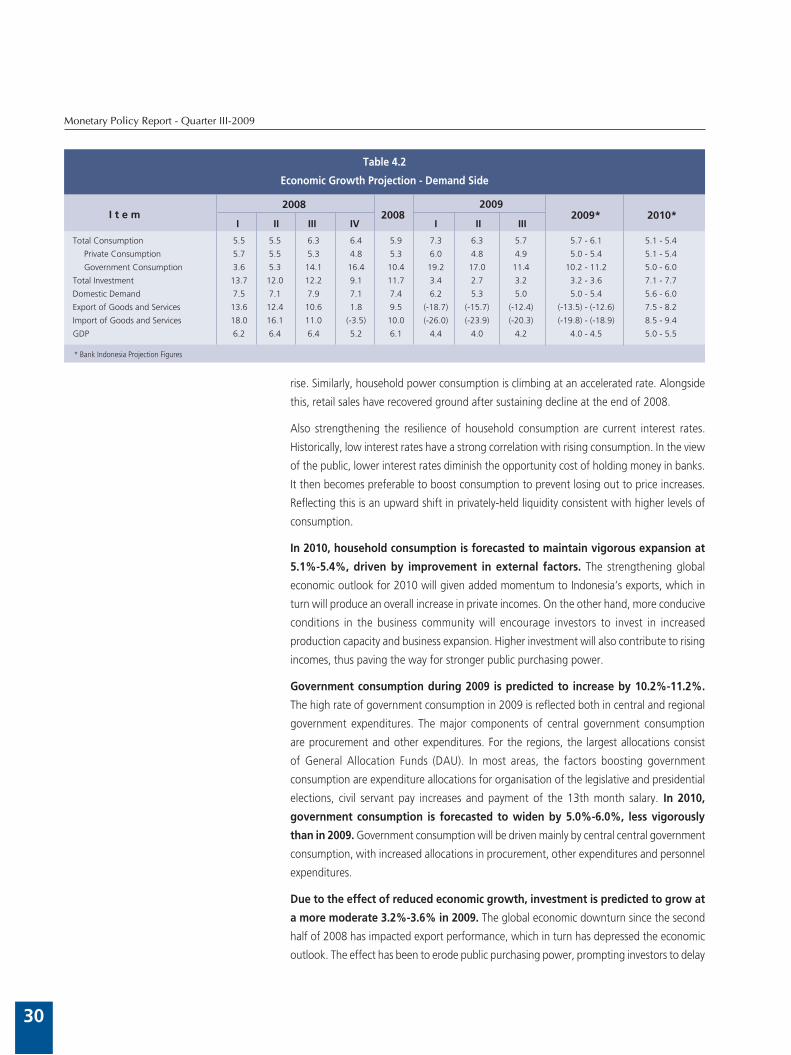
Monetary Policy Report - Quarter III-2009
30
rise. Similarly, household power consumption is climbing at an accelerated rate. Alongside
this, retail sales have recovered ground after sustaining decline at the end of 2008.
Also strengthening the resilience of household consumption are current interest rates.
Historically, low interest rates have a strong correlation with rising consumption. In the view
of the public, lower interest rates diminish the opportunity cost of holding money in banks.
It then becomes preferable to boost consumption to prevent losing out to price increases.
Reflecting this is an upward shift in privately-held liquidity consistent with higher levels of
consumption.
In 2010, household consumption is forecasted to maintain vigorous expansion at
5.1%-5.4%, driven by improvement in external factors. The strengthening global
economic outlook for 2010 will given added momentum to Indonesia’s exports, which in
turn will produce an overall increase in private incomes. On the other hand, more conducive
conditions in the business community will encourage investors to invest in increased
production capacity and business expansion. Higher investment will also contribute to rising
incomes, thus paving the way for stronger public purchasing power.
Government consumption during 2009 is predicted to increase by 10.2%-11.2%.
The high rate of government consumption in 2009 is reflected both in central and regional
government expenditures. The major components of central government consumption
are procurement and other expenditures. For the regions, the largest allocations consist
of General Allocation Funds (DAU). In most areas, the factors boosting government
consumption are expenditure allocations for organisation of the legislative and presidential
elections, civil servant pay increases and payment of the 13th month salary. In 2010,
government consumption is forecasted to widen by 5.0%-6.0%, less vigorously
than in 2009. Government consumption will be driven mainly by central central government
consumption, with increased allocations in procurement, other expenditures and personnel
expenditures.
Due to the effect of reduced economic growth, investment is predicted to grow at
a more moderate 3.2%-3.6% in 2009. The global economic downturn since the second
half of 2008 has impacted export performance, which in turn has depressed the economic
outlook. The effect has been to erode public purchasing power, prompting investors to delay
I II III IV I II III I t e m
Table 4.2
Economic Growth Projection - Demand Side
2008
* Bank Indonesia Projection Figures
Total Consumption 5.5 5.5 6.3 6.4 5.9 7.3 6.3 5.7 5.7 - 6.1 5.1 - 5.4
Private Consumption 5.7 5.5 5.3 4.8 5.3 6.0 4.8 4.9 5.0 - 5.4 5.1 - 5.4
Government Consumption 3.6 5.3 14.1 16.4 10.4 19.2 17.0 11.4 10.2 - 11.2 5.0 - 6.0
Total Investment 13.7 12.0 12.2 9.1 11.7 3.4 2.7 3.2 3.2 - 3.6 7.1 - 7.7
Domestic Demand 7.5 7.1 7.9 7.1 7.4 6.2 5.3 5.0 5.0 - 5.4 5.6 - 6.0
Export of Goods and Services 13.6 12.4 10.6 1.8 9.5 (-18.7) (-15.7) (-12.4) (-13.5) - (-12.6) 7.5 - 8.2
Import of Goods and Services 18.0 16.1 11.0 (-3.5) 10.0 (-26.0) (-23.9) (-20.3) (-19.8) - (-18.9) 8.5 - 9.4
GDP 6.2 6.4 6.4 5.2 6.1 4.4 4.0 4.2 4.0 - 4.5 5.0 - 5.5
20082009
2010*2009*
The Indonesian Economic Outlook
31
new investment with non-construction ventures especially affected. Reflecting investment
delays is the contraction in imports of raw materials and capital goods.
Nevertheless, the outlook is for the BI Rate cuts during the first half of 2009 to be followed
by reductions in loan interest rates during the second half. More affordable lending rates
have historically been followed by faster growth in non-construction investment on the back
of increased disbursement of investment credit. This is confirmed by signs of more vigorous
investment lending during Q3/2009. Similarly, construction investment is predicted to chart
positive growth in keeping with the government stimulus for infrastructure projects. Progress
in infrastructure project construction is reflected in the rising trend in construction investment
growth since Q1/2009. In the second half, construction investment is forecasted to expand
at a faster rate compared to January-June 2009. Indications of improvement are reflected in
cement consumption, with charted positive growth in Q3/2009, as well as mounting share
prices for companies operating in infrastructure.
Optimism for improvement in the economy is expected to boost investment growth
to 7.1%-7.7% in 2010. More favourable externals, domestic conditions bolstered by rising
purchasing power and a conducive climate for business certainty are factors in the more
rapid investment growth set for 2010. Besides this, the positive outlook for the Indonesian
economy will encourage foreign investors to take up foreign direct investment in Indonesia.
This positive outlook is evident from the decision by Moody’s to upgrade Indonesia’s credit
rating from Ba3 to Ba2. The upgraded rating is expected to have a beneficial effect on
capital inflows and cost of financing. Reinforcing this are the economic assessments by
world multilateral agencies such as the World Bank and ADB, which express optimism for
accelerated performance in the Indonesian economy during 2010.
The global economic contraction has resulted in significant decline in exports of
goods and services, predicted in 2009 to reach -13.5% to -12.6%. The global economic
downturn has led to a reduction in volume of world trade, a development that set in during
the second half of 2008. Furthermore, the declining of world trade will weaken demand for
goods exported from Indonesia. Even so, exports are believed to have hit their low in Q1/2009
and since, the world economy has mounted a faster than expected recovery. The accelerated
recovery will bolster future export performance, as reflected in the increased rate of export
growth each month. Besides demand, an important factor in the accelerated export growth
is the resource-based nature of Indonesia’s export commodities, which have been able to
recover quickly in response to increased demand in trading partner nations.
In 2010, global economic recovery will produce renewed acceleration in exports, with
growth reaching 7.5%-8.2%. The global economy is predicted to enter an expansionary
phase phase in 2010, having emerged from the crisis with the aid of various remedial actions
involving fiscal and monetary stimulus measures. Renewed momentum is predicted for the
economies of Indonesia’s major trading partners, such as Japan, China and Singapore, while
recovery at the global level will stimulate resurgent growth in volume of world trade. This
strengthened performance will position exports as one of the main engines of economic
growth in 2010.
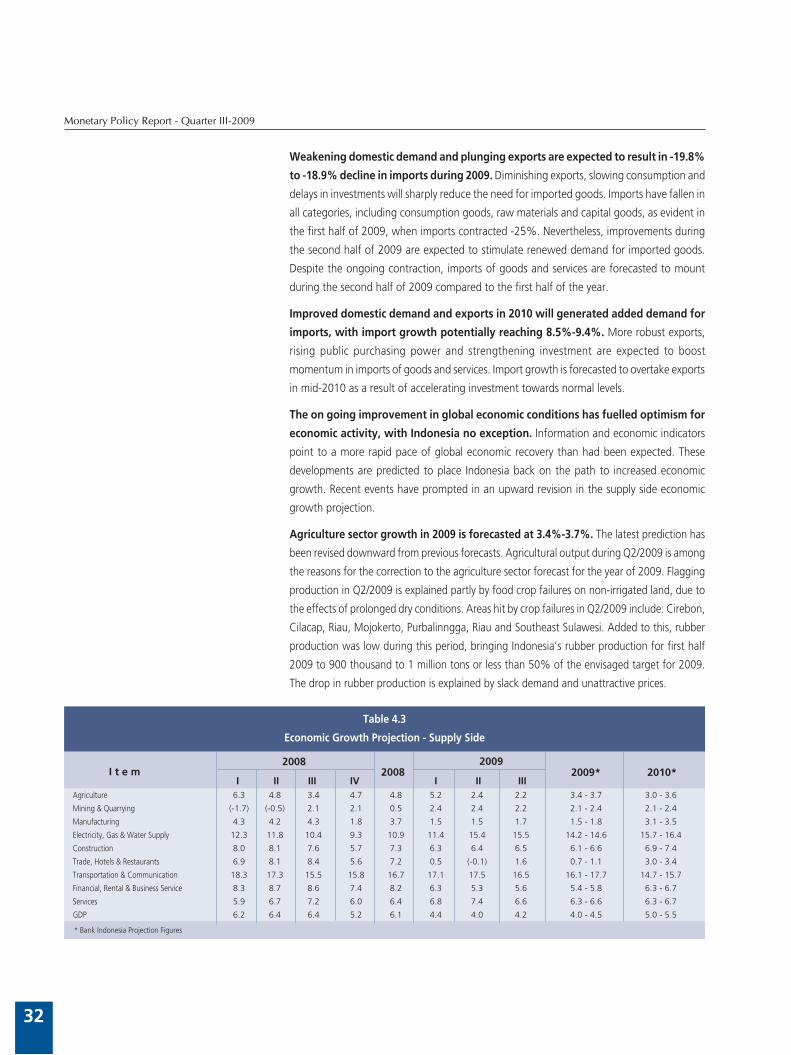
Monetary Policy Report - Quarter III-2009
32
Weakening domestic demand and plunging exports are expected to result in -19.8%
to -18.9% decline in imports during 2009. Diminishing exports, slowing consumption and
delays in investments will sharply reduce the need for imported goods. Imports have fallen in
all categories, including consumption goods, raw materials and capital goods, as evident in
the first half of 2009, when imports contracted -25%. Nevertheless, improvements during
the second half of 2009 are expected to stimulate renewed demand for imported goods.
Despite the ongoing contraction, imports of goods and services are forecasted to mount
during the second half of 2009 compared to the first half of the year.
Improved domestic demand and exports in 2010 will generated added demand for
imports, with import growth potentially reaching 8.5%-9.4%. More robust exports,
rising public purchasing power and strengthening investment are expected to boost
momentum in imports of goods and services. Import growth is forecasted to overtake exports
in mid-2010 as a result of accelerating investment towards normal levels.
The on going improvement in global economic conditions has fuelled optimism for
economic activity, with Indonesia no exception. Information and economic indicators
point to a more rapid pace of global economic recovery than had been expected. These
developments are predicted to place Indonesia back on the path to increased economic
growth. Recent events have prompted in an upward revision in the supply side economic
growth projection.
Agriculture sector growth in 2009 is forecasted at 3.4%-3.7%. The latest prediction has
been revised downward from previous forecasts. Agricultural output during Q2/2009 is among
the reasons for the correction to the agriculture sector forecast for the year of 2009. Flagging
production in Q2/2009 is explained partly by food crop failures on non-irrigated land, due to
the effects of prolonged dry conditions. Areas hit by crop failures in Q2/2009 include: Cirebon,
Cilacap, Riau, Mojokerto, Purbalinngga, Riau and Southeast Sulawesi. Added to this, rubber
production was low during this period, bringing Indonesia’s rubber production for first half
2009 to 900 thousand to 1 million tons or less than 50% of the envisaged target for 2009.
The drop in rubber production is explained by slack demand and unattractive prices.
I II III IV I II III I t e m
Table 4.3
Economic Growth Projection - Supply Side
2008
* Bank Indonesia Projection Figures
Agriculture 6.3 4.8 3.4 4.7 4.8 5.2 2.4 2.2 3.4 - 3.7 3.0 - 3.6
Mining & Quarrying (-1.7) (-0.5) 2.1 2.1 0.5 2.4 2.4 2.2 2.1 - 2.4 2.1 - 2.4
Manufacturing 4.3 4.2 4.3 1.8 3.7 1.5 1.5 1.7 1.5 - 1.8 3.1 - 3.5
Electricity, Gas & Water Supply 12.3 11.8 10.4 9.3 10.9 11.4 15.4 15.5 14.2 - 14.6 15.7 - 16.4
Construction 8.0 8.1 7.6 5.7 7.3 6.3 6.4 6.5 6.1 - 6.6 6.9 - 7.4
Trade, Hotels & Restaurants 6.9 8.1 8.4 5.6 7.2 0.5 (-0.1) 1.6 0.7 - 1.1 3.0 - 3.4
Transportation & Communication 18.3 17.3 15.5 15.8 16.7 17.1 17.5 16.5 16.1 - 17.7 14.7 - 15.7
Financial, Rental & Business Service 8.3 8.7 8.6 7.4 8.2 6.3 5.3 5.6 5.4 - 5.8 6.3 - 6.7
Services 5.9 6.7 7.2 6.0 6.4 6.8 7.4 6.6 6.3 - 6.6 6.3 - 6.7
GDP 6.2 6.4 6.4 5.2 6.1 4.4 4.0 4.2 4.0 - 4.5 5.0 - 5.5
20082009
2010*2009*
The Indonesian Economic Outlook
33
The El Nino effect -- originally feared to hit agricultural production in 2009 -- is not forecasted
to have significant impact. Production of fresh fruit bunches is predicted to rebound in the
second half of 2009 in line with the oil palm harvest season. Agricultural production in
the second half of the year is expected to provide adequately for food security, with rice
production expected to record a 2.8 million ton surplus. The rice surplus will be used to
cover the rice shortfall in 2010 that may arise from the effects of delayed planting caused
by El Nino.
Agriculture sector growth in 2010 is forecasted at 3.0%-3.6%. Food resilience is
predicted to remain strong in 2010 due to the various preparatory measures taken by the
government, including conversion of swamp lands to paddy fields. At this time, 1.8 million
hectares of swamp lands are available for use as rice paddies. Most agricultural infrastructure,
such as irrigation systems and reservoirs, is in serviceable condition. The government will
deploy agricultural extension workers to provide training and work alongside farmers. Other
government plans for boosting agricultural production include a 59% increase in fertiliser
subsidies over 2009 levels and provision of high quality seeds. To make superior quality seeds
available to farmers, the government will join forces with the private sector. The President
has also launched the Agriculture Revitalisation Phase II programme and has reinforced the
Food Resilience Council, chaired by the President himself.
In 2009, mining sector growth is forecasted at 2.1%-2.4%, up from the preceding year.
Improvement in the mining sector will come mainly from brisk exploration activity in search of
new mineral reserves. Exploration activity will focus mainly on nickel, gold, bauxite and coal.
Looking forward, coal will play an increasing role, primarily in relation to power generation.
Foreign investors from India and China have begun to eye the mining sector in Indonesia. For
the two countries, the main reason behind their aggressive pursuit of mining activity in Indonesia
is the need to achieve energy security. The International Energy Agency (IEA) predicts world
coal consumption to expand at an average of 2.6% per annum over the 2005-2015 period.
In 2010, growth in this sector is predicted at about the same level as 2009.
Since 2005, manufacturing has been in overall decline as indicated by less than 5% growth.
Conditions have worsened with the onset of the economic crisis. Manufacturing growth
in 2009 is projected to reach 1.5%-1.8% (yoy), ahead of the original forecast at 1.4%
(yoy). This upward revision is commensurate with the faster than expected improvement in
economic conditions. The worst of the global economic crisis passed in Q2/2009.
The onset of recovery in economic conditions has stirred fresh optimism in the business
community. Business has responded positively in such actions as increasing capacity and
production, as in the case of local steel manufacturers. Since June 2009, capacity utilisation
in the local steel industry has increased to 90% from the previous 60%, responding to
more rapid economic recovery and to anticipate more vigorous domestic demand. The
trough reached in domestic steel demand in Q1/2009 is well past. In other developments,
the footwear industry began stepping up activity in early Q2/2009. Footwear orders are up
in Indonesia due to a shift in orders away from China, Taiwan and South Korea. In those
countries, the footwear industry is losing competitiveness compared to Indonesia, due to
steep increases in production costs.
Monetary Policy Report - Quarter III-2009
34
In the outlook for 2010, global and domestic economic conditions are forecasted to improve
over 2009. Similar improvement is predicted for industry, buoyed by strengthening
exports and household consumption. Industry growth in 2010 is forecasted at 3.1%-
3.5%. Key to this growth will be the development of crude palm oil (CPO) based industries,
now prioritised by the government for development over the coming five years. At this time,
Indonesia produces only about 24 CPO derivative products. This measure will increase the
value added contributed by CPO-based industries. The CPO downstream industries prioritised
for development include fatty acids, stearic acids, margarine, glycerine, fatty alcohol, methyl
ester and surfactants. The vast potential for this development is underscored by Indonesia’s
ranking as a leading world producer of CPO.
In heavy industry, Indonesia has taken initial steps to develop maritime cable manufacturing
with a production plant slated to commence operation in November 2009. This industry
will provide vital support to the implementation of cabotage in domestic shipping. The
introduction of cabotage will strengthen demand for procurement of domestic cargo vessel
as owners replace foreign-flagged vessels previously used to carry domestic freight.
The trade, hotels and restaurants sector is the hardest hit for 2009. Growth in this
sector is forecasted at only 0.7%-1.1%, well below the 2008 growth recorded at 7.2%.
The downturn in the trade, hotels and restaurants sector is closely related to falling imports
and reduced activity in the industry sector. The steepest performance decline has taken place
in the wholesale and retail subsector. Even so, the faster than expected economic recovery
has created conducive conditions for the future growth of the trade, hotels and restaurants
sector. Reflecting this are month-on-month gains in the automotive and electronics markets.
Sole agents representing foreign brands have begun raising their sales targets for the second
half of 2009, which in turn has reinforced positive expectations for the trade subsector. The
bright prospects for the trade sector are also reflected in the growth of local franchises. As
of 2009, franchise operations in Indonesia represent a total of 750 brands.
The gathering momentum of global and domestic economic recovery in 2010 will usher in
more robust performance in the trade, hotels and restaurants sector. This sector is predicted
to grow 3.0%-3.4% during 2010. Improved performance in this sector will be driven mainly
by strengthened public purchasing power reflected in rising household consumption and
surging activity in industry.
In recent years, transport and communications has been a relatively high growth sector, even
during the height of the global economic crisis. Growth in transport and communications
during 2009 is forecasted at 16.1%-17.7%. The communications subsector contributes
significantly to the overall performance of the transport and communications sector.
Investment in development of communications technology is set to forge ahead, primarily
for enhancing communications services.
Communications networks now reach 90% of the population. Advancement in communications
technology has made services more affordable than ever before. The availability of comparatively
adequate infrastructure paves the way for even greater use of communications by the general
public. Services have not only become more affordable in cellular phones, but also in the world
of the internet. The development of Broadband Wireless Access (BWA) supports this trend.
The Indonesian Economic Outlook
35
Similarly, prospects are bright in the transportation subsector. Cargo handling in ports is set
to climb in line with growing activity in industry and trade. Furthermore, the introduction
of cabotage will strengthen the fortunes of the domestic sea freight industry, particularly
in the shipping of mining products. Indonesian shipping companies are ready to take over
from foreign vessels in such areas as floating storage and offloading (FSO) and floating
production storage and offloading (FPSO). To assume this role, domestic shipping countries
will require long-term contracts. If the contracts are long-term, bank financing for investment
in procuring the necessary vessels will be more easily obtainable.
In 2010, the transport and communications sector is predicted to keep forging ahead
with growth at 14.7%-15.7%. The brisk growth in this sector will be fuelled by product
innovations in communication and investment in technology for upgrading communications
services. Added to this, the improvement in economic conditions in 2010 will also pave the way
for more rapid growth in economic activity. Cargo traffic and business travel will both benefit
from this development. The lifting of the ban on flights to Europe will enable Indonesia’s
airlines to improve performance and contribute to growth in the transportation sector.
Construction sector growth in 2009 is predicted to reach 6.1%-6.6%. The onset of
renewed growth in purchasing power in tandem with rising optimism for future improvement
in economic conditions and declining loan interest rates is expected to boost activity in
the property business. Cement producers have taken action to anticipate this condition
by expanding capacity early in the second half of 2009. The property sector is the major
consumer of cement, accounting for up to 70% of cement supplied to the market, with
infrastructure absorbing approximately a further 10%. Cement plant construction is aimed
not only at expanding capacity, but also to respond to demand in future years.
Besides the property sector, a number of infrastructure projects are ready to go ahead,
having obtained confirmation of funding. The construction of the Jakarta Outer Ring Road
West 2 (JORR W2) project along a 7 km Ulujami to Kebon Jeruk route will receive Rp 800
billion funding from the Public Services Agency (BLU). With confirmation of funding in hand,
the land expropriation for the toll road can commence immediately and construction work
shortly thereafter, with operations targeted to begin in January 2010.
Another infrastructure project about to begin is the 1,200 MW Muara Tawas Add-On
combined cycle power plant, slated to cost USD1 billion or about Rp 10 trillion. This project
forms part of the accelerated programme for the second phase of the 10 thousand MW
power plant megaproject. The Japan Bank for International Cooperation (JBIC) has declared
its interest in funding this project. Another power generation project with approved funding
is the World Bank-funded 1,000 MW Upper Cisokan thermal power plant in West Bandung
Regency.
The construction sector is forecasted to chart even higher growth in 2010 at 6.9%-
7.4%. Construction activity in 2010 will be bolstered by the development of port facilities in
Sumatra over the next 5 years. The port developments form part of an agreement between
the Government (PT. Pelindo) and 11 strategic partners, signed on 20 August 2008. This
collaboration covers the operation of wharves and harbours, logistics and terminal handling
services, pilot and tugboat services, container handling, loading and unloading of CPO and
Monetary Policy Report - Quarter III-2009
36
infrastructure construction. These developments will require a combined investment of 500
million US dollars, which will be used for port expansion at Belawan, Batam, Dumai, Perawang
and Malahayati. Funding is being provided, among others, by the Islamic Development
Bank (IDB) and JBIC. Besides port construction, other infrastructure projects slated for
2010 include the completion of accelerated construction of the phase one 10 GW power
generating project, commencement of the second phase 10 GW powerplant megaproject
and toll road projects.
The financial services, leasing and corporate services sector is expected to chart 5.4%-
5.8% growth, down from 2008. Slackened economic activity will lower demand for financial
intermediary services. On the other hand, the 275 basis point reduction in the BI Rate from
January to September 2009 has met with only limited response from the banking system.
Given the signs of more robust recovery under way in the global and domestic economy,
banks are expected to show progressively improved response to changes in the BI Rate. This
will pave the way for more accessible and affordable funding for economic activities.
Despite the present constraints, the financial services, leasing and corporate services sector
still has the capacity to chart a respectable above 5% growth rate. The main driving force in
this sector is corporate services, particularly in relation to advertising. The flurry of election
activities in 2009 is thought to be the main source of growth in the advertising subsector.
Advertising spending in 2009 is estimated significantly higher than in 2008 as a result of
the election activities.
The invigorated pace of economic activity in 2010 will also bring added business to the
financial services, leasing and corporate services sector. Growth in the financial services,
leasing and corporate services sector during 2010 is forecasted at 6.3%-6.7%. The
improvement in the economic outlook will lower risks of doing business. This in turn will
bolster bank confidence in financing economic activities. Steady improvement in automotive
sales is also forecasted for 2010, bolstered by rising public purchasing power. This will
stimulate multifinance companies to play a more active role in facilitating car purchases by the
public. Most private purchases of motor vehicles have so far been conducted on credit.
In a similar vein, the corporate services subsector will see more robust growth. Intensifying
competition in the world of business means that research, product promotion and
organisation of exhibitions will become increasingly important parts of business activity.
Industries operating in these fields will therefore develop further and expand their contribution
to performance in the financial services, leasing and corporate services sector, possibly even
taking a dominant role.
INFLATION FORECAST
Concerning the inflation outlook, the downward inflation trend in 2009 is set to continue,
but with potential for a return to normality in 2010. Annual CPI inflation in 2009 is
forecasted within the inflation targeting range of 4.5%±1% (Graph 4.2). Key to
the reduced inflationary pressure in 2009 is low inflation in administered prices following
the government decision to lower fuel prices at the beginning of the year. The decline in
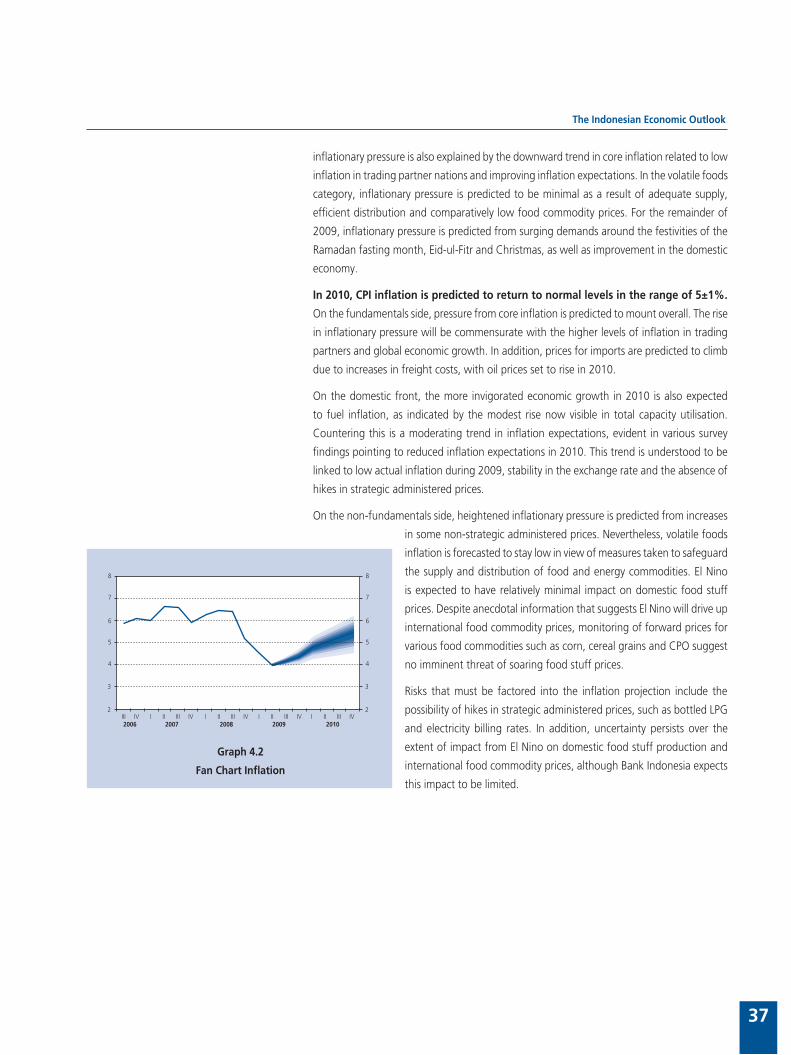
The Indonesian Economic Outlook
37
inflationary pressure is also explained by the downward trend in core inflation related to low
inflation in trading partner nations and improving inflation expectations. In the volatile foods
category, inflationary pressure is predicted to be minimal as a result of adequate supply,
efficient distribution and comparatively low food commodity prices. For the remainder of
2009, inflationary pressure is predicted from surging demands around the festivities of the
Ramadan fasting month, Eid-ul-Fitr and Christmas, as well as improvement in the domestic
economy.
In 2010, CPI inflation is predicted to return to normal levels in the range of 5±1%.
On the fundamentals side, pressure from core inflation is predicted to mount overall. The rise
in inflationary pressure will be commensurate with the higher levels of inflation in trading
partners and global economic growth. In addition, prices for imports are predicted to climb
due to increases in freight costs, with oil prices set to rise in 2010.
On the domestic front, the more invigorated economic growth in 2010 is also expected
to fuel inflation, as indicated by the modest rise now visible in total capacity utilisation.
Countering this is a moderating trend in inflation expectations, evident in various survey
findings pointing to reduced inflation expectations in 2010. This trend is understood to be
linked to low actual inflation during 2009, stability in the exchange rate and the absence of
hikes in strategic administered prices.
On the non-fundamentals side, heightened inflationary pressure is predicted from increases
in some non-strategic administered prices. Nevertheless, volatile foods
inflation is forecasted to stay low in view of measures taken to safeguard
the supply and distribution of food and energy commodities. El Nino
is expected to have relatively minimal impact on domestic food stuff
prices. Despite anecdotal information that suggests El Nino will drive up
international food commodity prices, monitoring of forward prices for
various food commodities such as corn, cereal grains and CPO suggest
no imminent threat of soaring food stuff prices.
Risks that must be factored into the inflation projection include the
possibility of hikes in strategic administered prices, such as bottled LPG
and electricity billing rates. In addition, uncertainty persists over the
extent of impact from El Nino on domestic food stuff production and
international food commodity prices, although Bank Indonesia expects
this impact to be limited.
Graph 4.2
Fan Chart Inflation
�
�
�
�
�
�
�
�
�
�
�
�
�
���� �� ��� ��� �� ��� ��� �� ��� ��� �� ��� ��� ������ ���� ���� ���� ����
Monetary Policy Report - Quarter III-2009
38
5. Monetary Policy Response, Q3/2009
On 5 October 2009, the Board of Governors Meeting at Bank Indonesia decided to hold
the BI Rate at 6.50%. The reasoning in this decision is that the 6.50% rate will remain
consistent with achievement of the 5% ± 1% inflation target for 2010 and takes account
of the gradual improvement in the banking response that is conducive to recovery in the
domestic eco nomy.
Inflation in September reached 1.05% (mtm), up significantly from 0.56% (mtm) in the
preceding month. This rise is explained mainly by the Eid-ul-Fitr festive season. As a result,
annual inflation climbed from August 2009 to 2.83% (y-o-y). During the last few months of
2009, inflationary pressure is forecasted to mount, albeit remaining below the levels reached
one year earlier. Administered prices are predicted to boost inflation, largely as a result of
increased toll road charges and cigarette prices.
Financial system stability will remain strong due to improving performance in the banking
system. Aggregate banking liquidity is also sufficient for banking activity in financing for
the economy. Despite this, the slow rate of credit expansion is set to continue, primarily in
response to the continued weak performance in the real sector (credit demand) and the
greater caution demonstrated by banks in lending (credit supply).
Bank Indonesia will stay the course with monetary policy conducive to real sector growth
while remaining committed to safeguarding medium and long-term economic stability. In the
banking sector, Bank Indonesia will continue to promote the banking intermediation process
and bolster the resilience of the banking system amid the global economic turmoil. Bank
Indonesia will also maintain close coordination with the Government in monitoring global,
regional and domestic economic developments and in taking actions as may be necessary.
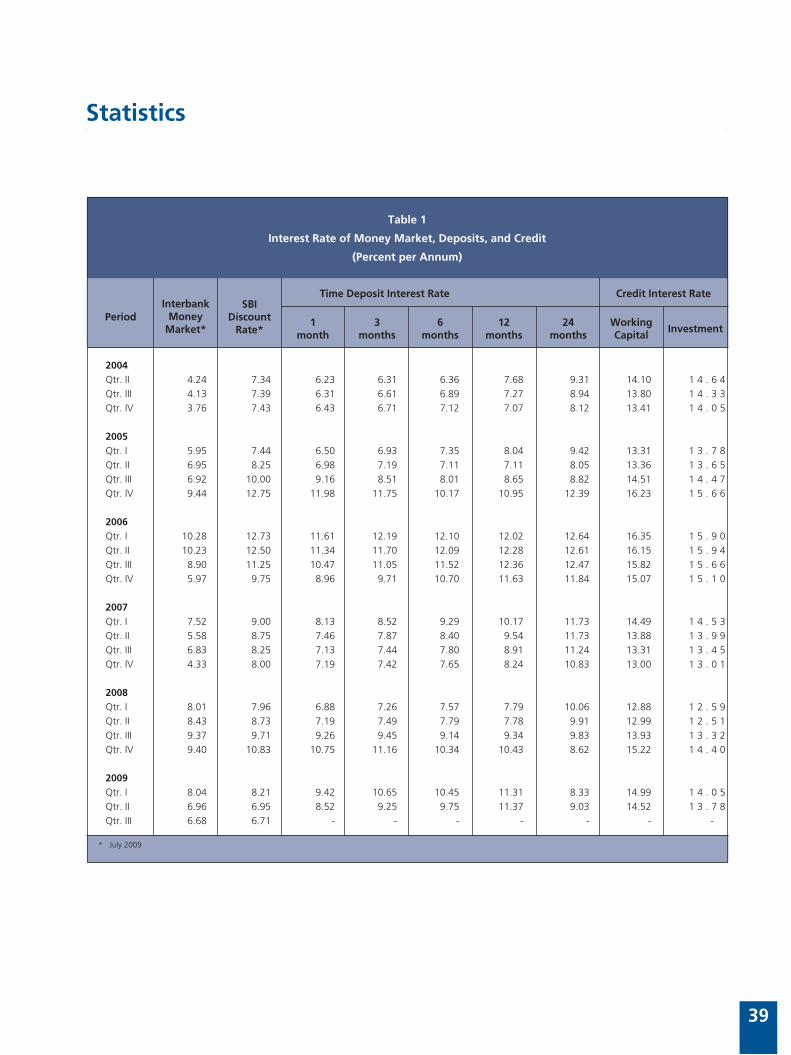
Statistics
39
Statistics
Table 1
Interest Rate of Money Market, Deposits, and Credit
(Percent per Annum)
PeriodInterbank
MoneyMarket*
SBIDiscount
Rate*
Time Deposit Interest Rate Credit Interest Rate
1month
3months
6months
12months
24months
4.24 7.34 6.23 6.31 6.36 7.68 9.31 14.10 1 4 . 6 4 4.13 7.39 6.31 6.61 6.89 7.27 8.94 13.80 1 4 . 3 3 3.76 7.43 6.43 6.71 7.12 7.07 8.12 13.41 1 4 . 0 5 5.95 7.44 6.50 6.93 7.35 8.04 9.42 13.31 1 3 . 7 8 6.95 8.25 6.98 7.19 7.11 7.11 8.05 13.36 1 3 . 6 5 6.92 10.00 9.16 8.51 8.01 8.65 8.82 14.51 1 4 . 4 7 9.44 12.75 11.98 11.75 10.17 10.95 12.39 16.23 1 5 . 6 6 10.28 12.73 11.61 12.19 12.10 12.02 12.64 16.35 1 5 . 9 0 10.23 12.50 11.34 11.70 12.09 12.28 12.61 16.15 1 5 . 9 4 8.90 11.25 10.47 11.05 11.52 12.36 12.47 15.82 1 5 . 6 6 5.97 9.75 8.96 9.71 10.70 11.63 11.84 15.07 1 5 . 1 0 7.52 9.00 8.13 8.52 9.29 10.17 11.73 14.49 1 4 . 5 3 5.58 8.75 7.46 7.87 8.40 9.54 11.73 13.88 1 3 . 9 9 6.83 8.25 7.13 7.44 7.80 8.91 11.24 13.31 1 3 . 4 5 4.33 8.00 7.19 7.42 7.65 8.24 10.83 13.00 1 3 . 0 1 8.01 7.96 6.88 7.26 7.57 7.79 10.06 12.88 1 2 . 5 9 8.43 8.73 7.19 7.49 7.79 7.78 9.91 12.99 1 2 . 5 1 9.37 9.71 9.26 9.45 9.14 9.34 9.83 13.93 1 3 . 3 2 9.40 10.83 10.75 11.16 10.34 10.43 8.62 15.22 1 4 . 4 0 8.04 8.21 9.42 10.65 10.45 11.31 8.33 14.99 1 4 . 0 5 6.96 6.95 8.52 9.25 9.75 11.37 9.03 14.52 1 3 . 7 8 6.68 6.71 - - - - - - -
WorkingCapital
Investment
2004Qtr. IIQtr. IIIQtr. IV
2005Qtr. IQtr. IIQtr. IIIQtr. IV
2006Qtr. IQtr. IIQtr. IIIQtr. IV
2007Qtr. IQtr. IIQtr. IIIQtr. IV
2008Qtr. IQtr. IIQtr. IIIQtr. IV
2009Qtr. IQtr. IIQtr. III
* July 2009
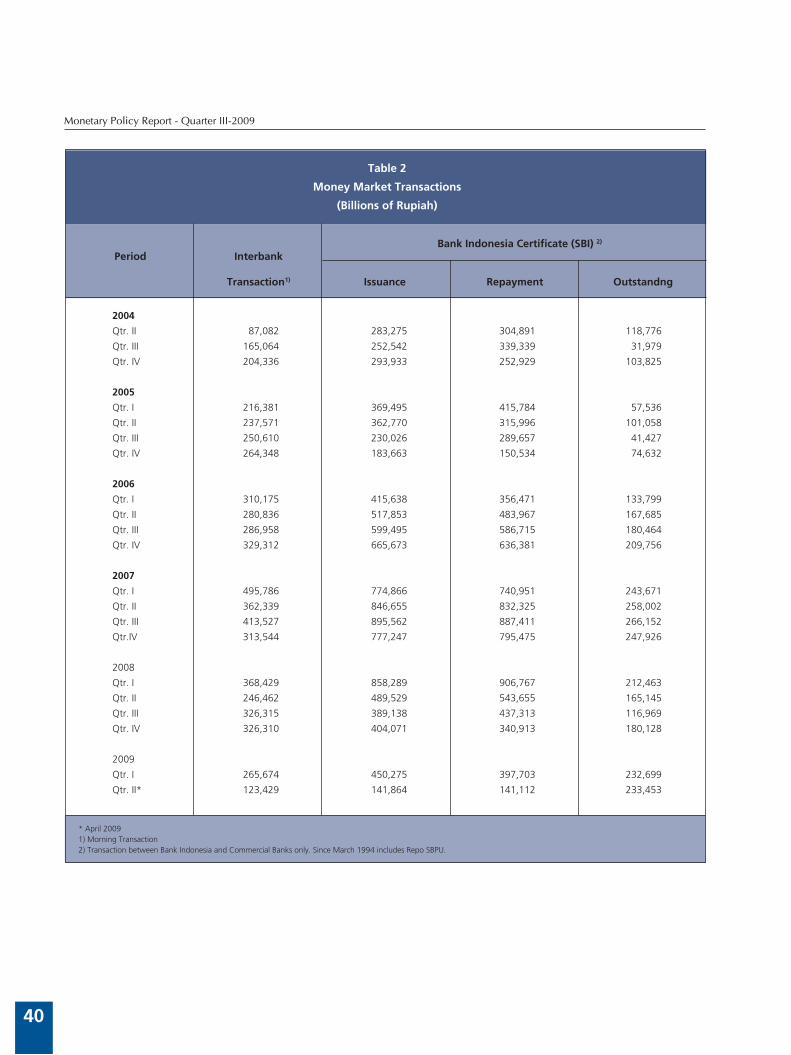
Monetary Policy Report - Quarter III-2009
40
Table 2
Money Market Transactions
(Billions of Rupiah)
Bank Indonesia Certificate (SBI) 2)
Period Interbank Transaction1) Issuance Repayment Outstandng
2004
Qtr. II
Qtr. III
Qtr. IV
2005
Qtr. I
Qtr. II
Qtr. III
Qtr. IV
2006
Qtr. I
Qtr. II
Qtr. III
Qtr. IV
2007
Qtr. I
Qtr. II
Qtr. III
Qtr.IV
2008
Qtr. I
Qtr. II
Qtr. III
Qtr. IV
2009
Qtr. I
Qtr. II*
* April 2009 1) Morning Transaction2) Transaction between Bank Indonesia and Commercial Banks only. Since March 1994 includes Repo SBPU.
87,082 283,275 304,891 118,776
165,064 252,542 339,339 31,979
204,336 293,933 252,929 103,825
216,381 369,495 415,784 57,536
237,571 362,770 315,996 101,058
250,610 230,026 289,657 41,427
264,348 183,663 150,534 74,632
310,175 415,638 356,471 133,799
280,836 517,853 483,967 167,685
286,958 599,495 586,715 180,464
329,312 665,673 636,381 209,756
495,786 774,866 740,951 243,671
362,339 846,655 832,325 258,002
413,527 895,562 887,411 266,152
313,544 777,247 795,475 247,926
368,429 858,289 906,767 212,463
246,462 489,529 543,655 165,145
326,315 389,138 437,313 116,969
326,310 404,071 340,913 180,128
265,674 450,275 397,703 232,699
123,429 141,864 141,112 233,453
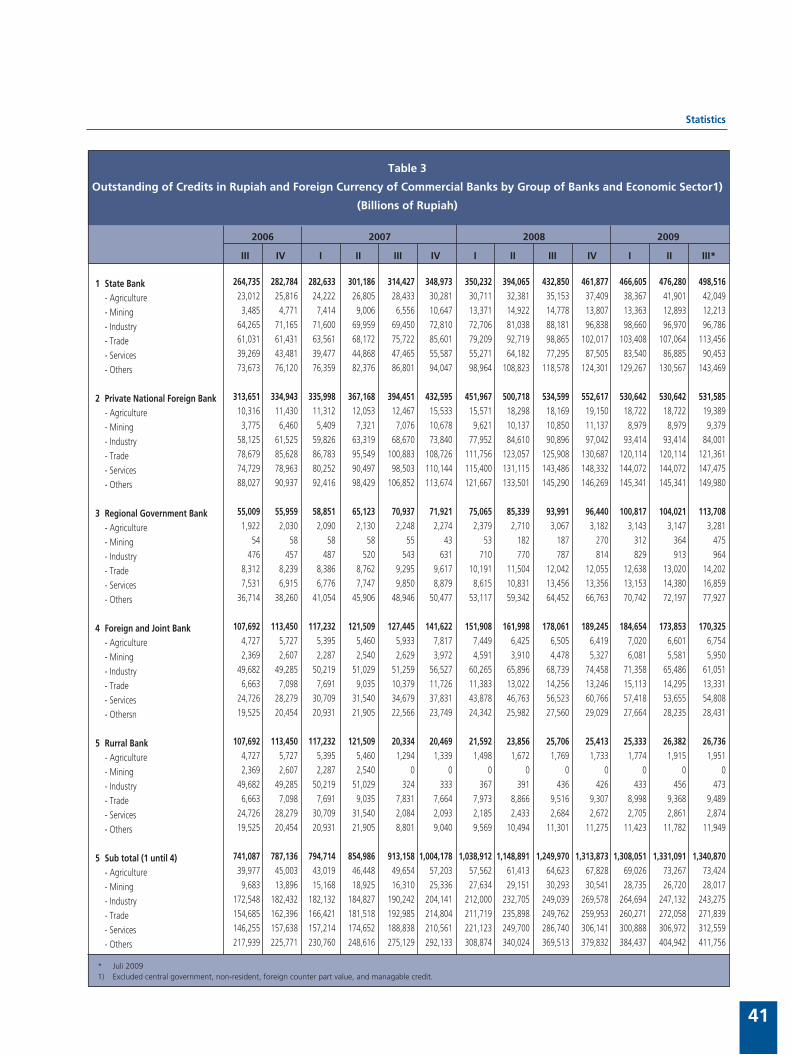
Statistics
41
III IV I II III IV I II III IV I II III*
* Juli 2009 1) Excluded central government, non-resident, foreign counter part value, and managable credit.
Table 3
Outstanding of Credits in Rupiah and Foreign Currency of Commercial Banks by Group of Banks and Economic Sector1)
(Billions of Rupiah)
1 State Bank - Agriculture - Mining - Industry - Trade - Services - Others
2 Private National Foreign Bank - Agriculture - Mining - Industry - Trade - Services - Others 3 Regional Government Bank - Agriculture - Mining - Industry - Trade - Services - Others 4 Foreign and Joint Bank - Agriculture - Mining - Industry - Trade - Services - Othersn
5 Rurral Bank - Agriculture - Mining - Industry - Trade - Services - Others
5 Sub total (1 until 4) - Agriculture - Mining - Industry - Trade - Services - Others
264,735 282,784 282,633 301,186 314,427 348,973 350,232 394,065 432,850 461,877 466,605 476,280 498,516 23,012 25,816 24,222 26,805 28,433 30,281 30,711 32,381 35,153 37,409 38,367 41,901 42,049 3,485 4,771 7,414 9,006 6,556 10,647 13,371 14,922 14,778 13,807 13,363 12,893 12,213 64,265 71,165 71,600 69,959 69,450 72,810 72,706 81,038 88,181 96,838 98,660 96,970 96,786 61,031 61,431 63,561 68,172 75,722 85,601 79,209 92,719 98,865 102,017 103,408 107,064 113,456 39,269 43,481 39,477 44,868 47,465 55,587 55,271 64,182 77,295 87,505 83,540 86,885 90,453 73,673 76,120 76,359 82,376 86,801 94,047 98,964 108,823 118,578 124,301 129,267 130,567 143,469 313,651 334,943 335,998 367,168 394,451 432,595 451,967 500,718 534,599 552,617 530,642 530,642 531,585 10,316 11,430 11,312 12,053 12,467 15,533 15,571 18,298 18,169 19,150 18,722 18,722 19,389 3,775 6,460 5,409 7,321 7,076 10,678 9,621 10,137 10,850 11,137 8,979 8,979 9,379 58,125 61,525 59,826 63,319 68,670 73,840 77,952 84,610 90,896 97,042 93,414 93,414 84,001 78,679 85,628 86,783 95,549 100,883 108,726 111,756 123,057 125,908 130,687 120,114 120,114 121,361 74,729 78,963 80,252 90,497 98,503 110,144 115,400 131,115 143,486 148,332 144,072 144,072 147,475 88,027 90,937 92,416 98,429 106,852 113,674 121,667 133,501 145,290 146,269 145,341 145,341 149,980 55,009 55,959 58,851 65,123 70,937 71,921 75,065 85,339 93,991 96,440 100,817 104,021 113,708 1,922 2,030 2,090 2,130 2,248 2,274 2,379 2,710 3,067 3,182 3,143 3,147 3,281 54 58 58 58 55 43 53 182 187 270 312 364 475 476 457 487 520 543 631 710 770 787 814 829 913 964 8,312 8,239 8,386 8,762 9,295 9,617 10,191 11,504 12,042 12,055 12,638 13,020 14,202 7,531 6,915 6,776 7,747 9,850 8,879 8,615 10,831 13,456 13,356 13,153 14,380 16,859 36,714 38,260 41,054 45,906 48,946 50,477 53,117 59,342 64,452 66,763 70,742 72,197 77,927 107,692 113,450 117,232 121,509 127,445 141,622 151,908 161,998 178,061 189,245 184,654 173,853 170,325 4,727 5,727 5,395 5,460 5,933 7,817 7,449 6,425 6,505 6,419 7,020 6,601 6,754 2,369 2,607 2,287 2,540 2,629 3,972 4,591 3,910 4,478 5,327 6,081 5,581 5,950 49,682 49,285 50,219 51,029 51,259 56,527 60,265 65,896 68,739 74,458 71,358 65,486 61,051 6,663 7,098 7,691 9,035 10,379 11,726 11,383 13,022 14,256 13,246 15,113 14,295 13,331 24,726 28,279 30,709 31,540 34,679 37,831 43,878 46,763 56,523 60,766 57,418 53,655 54,808 19,525 20,454 20,931 21,905 22,566 23,749 24,342 25,982 27,560 29,029 27,664 28,235 28,431 107,692 113,450 117,232 121,509 20,334 20,469 21,592 23,856 25,706 25,413 25,333 26,382 26,736 4,727 5,727 5,395 5,460 1,294 1,339 1,498 1,672 1,769 1,733 1,774 1,915 1,951 2,369 2,607 2,287 2,540 0 0 0 0 0 0 0 0 0 49,682 49,285 50,219 51,029 324 333 367 391 436 426 433 456 473 6,663 7,098 7,691 9,035 7,831 7,664 7,973 8,866 9,516 9,307 8,998 9,368 9,489 24,726 28,279 30,709 31,540 2,084 2,093 2,185 2,433 2,684 2,672 2,705 2,861 2,874 19,525 20,454 20,931 21,905 8,801 9,040 9,569 10,494 11,301 11,275 11,423 11,782 11,949 741,087 787,136 794,714 854,986 913,158 1,004,178 1,038,912 1,148,891 1,249,970 1,313,873 1,308,051 1,331,091 1,340,870 39,977 45,003 43,019 46,448 49,654 57,203 57,562 61,413 64,623 67,828 69,026 73,267 73,424 9,683 13,896 15,168 18,925 16,310 25,336 27,634 29,151 30,293 30,541 28,735 26,720 28,017 172,548 182,432 182,132 184,827 190,242 204,141 212,000 232,705 249,039 269,578 264,694 247,132 243,275 154,685 162,396 166,421 181,518 192,985 214,804 211,719 235,898 249,762 259,953 260,271 272,058 271,839 146,255 157,638 157,214 174,652 188,838 210,561 221,123 249,700 286,740 306,141 300,888 306,972 312,559 217,939 225,771 230,760 248,616 275,129 292,133 308,874 340,024 369,513 379,832 384,437 404,942 411,756
2006 2007 2008 2009
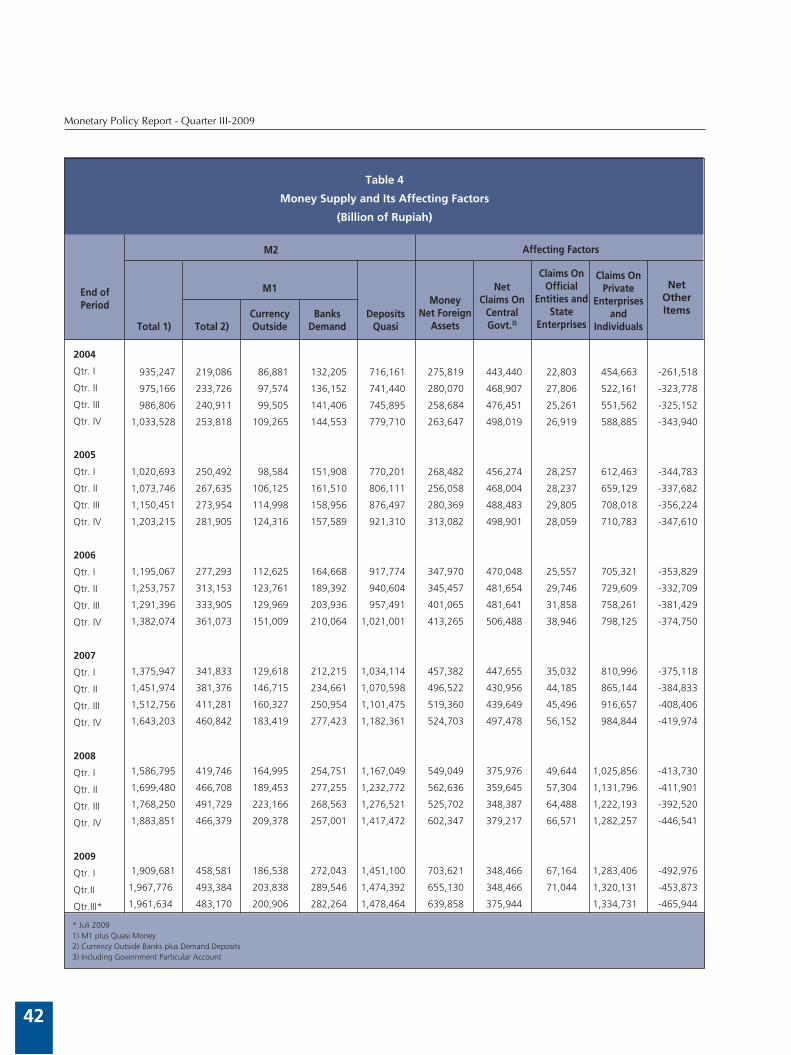
Monetary Policy Report - Quarter III-2009
42
* Juli 2009 1) M1 plus Quasi Money2) Currency Outside Banks plus Demand Deposits3) Including Government Particular Account
Table 4
Money Supply and Its Affecting Factors
(Billion of Rupiah)
M2 Affecting Factors
End ofPeriod
Total 1) Total 2)
M1
CurrencyOutside
BanksDemand
DepositsQuasi
MoneyNet Foreign
Assets
NetClaims On
CentralGovt.3)
Claims OnOfficial
Entities andState
Enterprises
Claims OnPrivate
Enterprisesand
Individuals
2004
Qtr. I
Qtr. II
Qtr. III
Qtr. IV
2005
Qtr. I
Qtr. II
Qtr. III
Qtr. IV
2006
Qtr. I
Qtr. II
Qtr. III
Qtr. IV
2007
Qtr. I
Qtr. II
Qtr. III
Qtr. IV
2008
Qtr. I
Qtr. II
Qtr. III
Qtr. IV
2009
Qtr. I
Qtr.II
Qtr.III*
935,247 219,086 86,881 132,205 716,161 275,819 443,440 22,803 454,663 -261,518
975,166 233,726 97,574 136,152 741,440 280,070 468,907 27,806 522,161 -323,778
986,806 240,911 99,505 141,406 745,895 258,684 476,451 25,261 551,562 -325,152
1,033,528 253,818 109,265 144,553 779,710 263,647 498,019 26,919 588,885 -343,940
1,020,693 250,492 98,584 151,908 770,201 268,482 456,274 28,257 612,463 -344,783
1,073,746 267,635 106,125 161,510 806,111 256,058 468,004 28,237 659,129 -337,682
1,150,451 273,954 114,998 158,956 876,497 280,369 488,483 29,805 708,018 -356,224
1,203,215 281,905 124,316 157,589 921,310 313,082 498,901 28,059 710,783 -347,610
1,195,067 277,293 112,625 164,668 917,774 347,970 470,048 25,557 705,321 -353,829
1,253,757 313,153 123,761 189,392 940,604 345,457 481,654 29,746 729,609 -332,709
1,291,396 333,905 129,969 203,936 957,491 401,065 481,641 31,858 758,261 -381,429
1,382,074 361,073 151,009 210,064 1,021,001 413,265 506,488 38,946 798,125 -374,750
1,375,947 341,833 129,618 212,215 1,034,114 457,382 447,655 35,032 810,996 -375,118
1,451,974 381,376 146,715 234,661 1,070,598 496,522 430,956 44,185 865,144 -384,833
1,512,756 411,281 160,327 250,954 1,101,475 519,360 439,649 45,496 916,657 -408,406
1,643,203 460,842 183,419 277,423 1,182,361 524,703 497,478 56,152 984,844 -419,974
1,586,795 419,746 164,995 254,751 1,167,049 549,049 375,976 49,644 1,025,856 -413,730
1,699,480 466,708 189,453 277,255 1,232,772 562,636 359,645 57,304 1,131,796 -411,901
1,768,250 491,729 223,166 268,563 1,276,521 525,702 348,387 64,488 1,222,193 -392,520
1,883,851 466,379 209,378 257,001 1,417,472 602,347 379,217 66,571 1,282,257 -446,541
1,909,681 458,581 186,538 272,043 1,451,100 703,621 348,466 67,164 1,283,406 -492,976
1,967,776 493,384 203,838 289,546 1,474,392 655,130 348,466 71,044 1,320,131 -453,873
1,961,634 483,170 200,906 282,264 1,478,464 639,858 375,944 1,334,731 -465,944
NetOtherItems
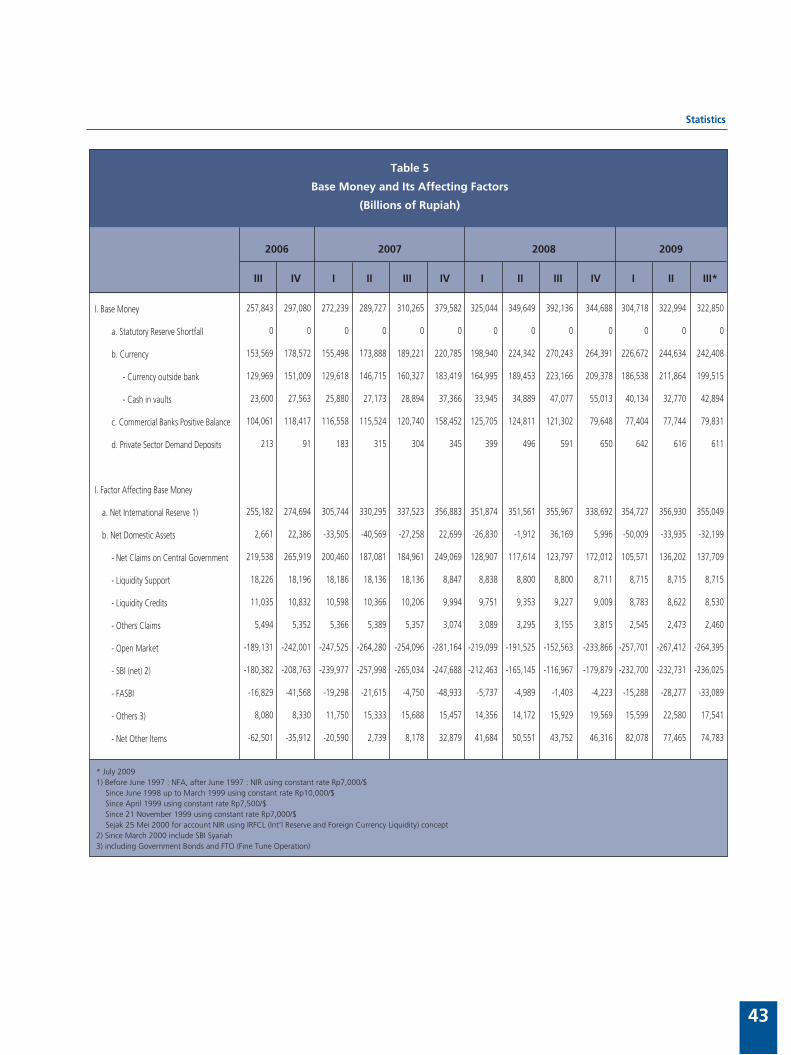
Statistics
43
Table 5
Base Money and Its Affecting Factors
(Billions of Rupiah)
257,843 297,080 272,239 289,727 310,265 379,582 325,044 349,649 392,136 344,688 304,718 322,994 322,850
0 0 0 0 0 0 0 0 0 0 0 0 0
153,569 178,572 155,498 173,888 189,221 220,785 198,940 224,342 270,243 264,391 226,672 244,634 242,408
129,969 151,009 129,618 146,715 160,327 183,419 164,995 189,453 223,166 209,378 186,538 211,864 199,515
23,600 27,563 25,880 27,173 28,894 37,366 33,945 34,889 47,077 55,013 40,134 32,770 42,894
104,061 118,417 116,558 115,524 120,740 158,452 125,705 124,811 121,302 79,648 77,404 77,744 79,831
213 91 183 315 304 345 399 496 591 650 642 616 611
255,182 274,694 305,744 330,295 337,523 356,883 351,874 351,561 355,967 338,692 354,727 356,930 355,049
2,661 22,386 -33,505 -40,569 -27,258 22,699 -26,830 -1,912 36,169 5,996 -50,009 -33,935 -32,199
219,538 265,919 200,460 187,081 184,961 249,069 128,907 117,614 123,797 172,012 105,571 136,202 137,709
18,226 18,196 18,186 18,136 18,136 8,847 8,838 8,800 8,800 8,711 8,715 8,715 8,715
11,035 10,832 10,598 10,366 10,206 9,994 9,751 9,353 9,227 9,009 8,783 8,622 8,530
5,494 5,352 5,366 5,389 5,357 3,074 3,089 3,295 3,155 3,815 2,545 2,473 2,460
-189,131 -242,001 -247,525 -264,280 -254,096 -281,164 -219,099 -191,525 -152,563 -233,866 -257,701 -267,412 -264,395
-180,382 -208,763 -239,977 -257,998 -265,034 -247,688 -212,463 -165,145 -116,967 -179,879 -232,700 -232,731 -236,025
-16,829 -41,568 -19,298 -21,615 -4,750 -48,933 -5,737 -4,989 -1,403 -4,223 -15,288 -28,277 -33,089
8,080 8,330 11,750 15,333 15,688 15,457 14,356 14,172 15,929 19,569 15,599 22,580 17,541
-62,501 -35,912 -20,590 2,739 8,178 32,879 41,684 50,551 43,752 46,316 82,078 77,465 74,783
2006 2007 2008 2009
III IV I II III IV I II III IV I II III*
I. Base Money
a. Statutory Reserve Shortfall
b. Currency
- Currency outside bank
- Cash in vaults
c. Commercial Banks Positive Balance
d. Private Sector Demand Deposits
I. Factor Affecting Base Money
a. Net International Reserve 1)
b. Net Domestic Assets
- Net Claims on Central Government
- Liquidity Support
- Liquidity Credits
- Others Claims
- Open Market
- SBI (net) 2)
- FASBI
- Others 3)
- Net Other Items
* July 2009 1) Before June 1997 : NFA, after June 1997 : NIR using constant rate Rp7,000/$ Since June 1998 up to March 1999 using constant rate Rp10,000/$ Since April 1999 using constant rate Rp7,500/$ Since 21 November 1999 using constant rate Rp7,000/$ Sejak 25 Mei 2000 for account NIR using IRFCL (Int’l Reserve and Foreign Currency Liquidity) concept2) Since March 2000 include SBI Syariah3) including Government Bonds and FTO (Fine Tune Operation)
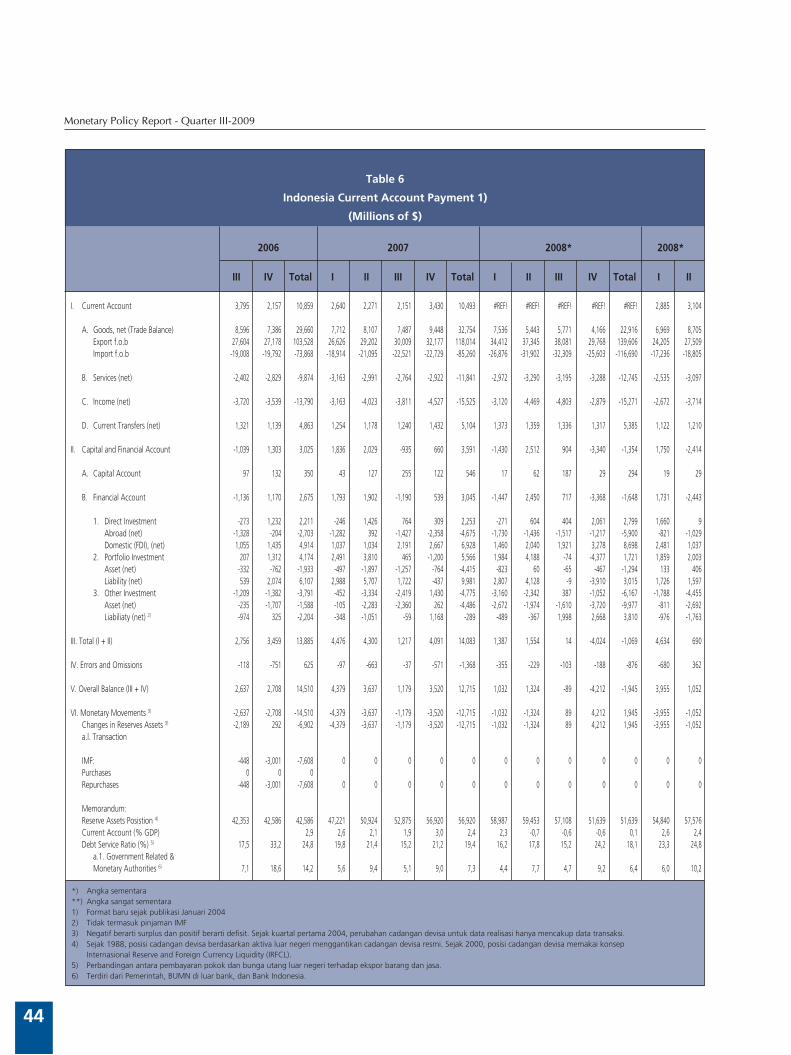
Monetary Policy Report - Quarter III-2009
44
Table 6
Indonesia Current Account Payment 1)
(Millions of $)
2006 2007 2008* 2008*
III IV Total I II III IV Total I II III IV Total I II
I. Current Account
A. Goods, net (Trade Balance) Export f.o.b Import f.o.b
B. Services (net)
C. Income (net)
D. Current Transfers (net)
II. Capital and Financial Account
A. Capital Account B. Financial Account
1. Direct Investment Abroad (net) Domestic (FDI), (net) 2. Portfolio Investment Asset (net) Liability (net) 3. Other Investment Asset (net) Liabiliaty (net) 2)
III. Total (I + II)
IV. Errors and Omissions
V. Overall Balance (III + IV)
VI. Monetary Movements 3)
Changes in Reserves Assets 3)
a.l. Transaction
IMF: Purchases Repurchases
Memorandum: Reserve Assets Posistion 4)
Current Account (% GDP) Debt Service Ratio (%) 5)
a.1. Government Related & Monetary Authorities 6) *) Angka sementara **) Angka sangat sementara 1) Format baru sejak publikasi Januari 2004 2) Tidak termasuk pinjaman IMF3) Negatif berarti surplus dan positif berarti defisit. Sejak kuartal pertama 2004, perubahan cadangan devisa untuk data realisasi hanya mencakup data transaksi. 4) Sejak 1988, posisi cadangan devisa berdasarkan aktiva luar negeri menggantikan cadangan devisa resmi. Sejak 2000, posisi cadangan devisa memakai konsep
Internasional Reserve and Foreign Currency Liquidity (IRFCL). 5) Perbandingan antara pembayaran pokok dan bunga utang luar negeri terhadap ekspor barang dan jasa. 6) Terdiri dari Pemerintah, BUMN di luar bank, dan Bank Indonesia.
3,795 2,157 10,859 2,640 2,271 2,151 3,430 10,493 #REF! #REF! #REF! #REF! #REF! 2,885 3,104 8,596 7,386 29,660 7,712 8,107 7,487 9,448 32,754 7,536 5,443 5,771 4,166 22,916 6,969 8,705 27,604 27,178 103,528 26,626 29,202 30,009 32,177 118,014 34,412 37,345 38,081 29,768 139,606 24,205 27,509 -19,008 -19,792 -73,868 -18,914 -21,095 -22,521 -22,729 -85,260 -26,876 -31,902 -32,309 -25,603 -116,690 -17,236 -18,805 -2,402 -2,829 -9,874 -3,163 -2,991 -2,764 -2,922 -11,841 -2,972 -3,290 -3,195 -3,288 -12,745 -2,535 -3,097 -3,720 -3,539 -13,790 -3,163 -4,023 -3,811 -4,527 -15,525 -3,120 -4,469 -4,803 -2,879 -15,271 -2,672 -3,714 1,321 1,139 4,863 1,254 1,178 1,240 1,432 5,104 1,373 1,359 1,336 1,317 5,385 1,122 1,210 -1,039 1,303 3,025 1,836 2,029 -935 660 3,591 -1,430 2,512 904 -3,340 -1,354 1,750 -2,414 97 132 350 43 127 255 122 546 17 62 187 29 294 19 29 -1,136 1,170 2,675 1,793 1,902 -1,190 539 3,045 -1,447 2,450 717 -3,368 -1,648 1,731 -2,443 -273 1,232 2,211 -246 1,426 764 309 2,253 -271 604 404 2,061 2,799 1,660 9 -1,328 -204 -2,703 -1,282 392 -1,427 -2,358 -4,675 -1,730 -1,436 -1,517 -1,217 -5,900 -821 -1,029 1,055 1,435 4,914 1,037 1,034 2,191 2,667 6,928 1,460 2,040 1,921 3,278 8,698 2,481 1,037 207 1,312 4,174 2,491 3,810 465 -1,200 5,566 1,984 4,188 -74 -4,377 1,721 1,859 2,003 -332 -762 -1,933 -497 -1,897 -1,257 -764 -4,415 -823 60 -65 -467 -1,294 133 406 539 2,074 6,107 2,988 5,707 1,722 -437 9,981 2,807 4,128 -9 -3,910 3,015 1,726 1,597 -1,209 -1,382 -3,791 -452 -3,334 -2,419 1,430 -4,775 -3,160 -2,342 387 -1,052 -6,167 -1,788 -4,455 -235 -1,707 -1,588 -105 -2,283 -2,360 262 -4,486 -2,672 -1,974 -1,610 -3,720 -9,977 -811 -2,692 -974 325 -2,204 -348 -1,051 -59 1,168 -289 -489 -367 1,998 2,668 3,810 -976 -1,763 2,756 3,459 13,885 4,476 4,300 1,217 4,091 14,083 1,387 1,554 14 -4,024 -1,069 4,634 690 -118 -751 625 -97 -663 -37 -571 -1,368 -355 -229 -103 -188 -876 -680 362 2,637 2,708 14,510 4,379 3,637 1,179 3,520 12,715 1,032 1,324 -89 -4,212 -1,945 3,955 1,052 -2,637 -2,708 -14,510 -4,379 -3,637 -1,179 -3,520 -12,715 -1,032 -1,324 89 4,212 1,945 -3,955 -1,052 -2,189 292 -6,902 -4,379 -3,637 -1,179 -3,520 -12,715 -1,032 -1,324 89 4,212 1,945 -3,955 -1,052 -448 -3,001 -7,608 0 0 0 0 0 0 0 0 0 0 0 0 0 0 0 -448 -3,001 -7,608 0 0 0 0 0 0 0 0 0 0 0 0
42,353 42,586 42,586 47,221 50,924 52,875 56,920 56,920 58,987 59,453 57,108 51,639 51,639 54,840 57,576 2,9 2,6 2,1 1,9 3,0 2,4 2,3 -0,7 -0,6 -0,6 0,1 2,6 2,4 17,5 33,2 24,8 19,8 21,4 15,2 21,2 19,4 16,2 17,8 15,2 24,2 18,1 23,3 24,8 7,1 18,6 14,2 5,6 9,4 5,1 9,0 7,3 4,4 7,7 4,7 9,2 6,4 6,0 10,2
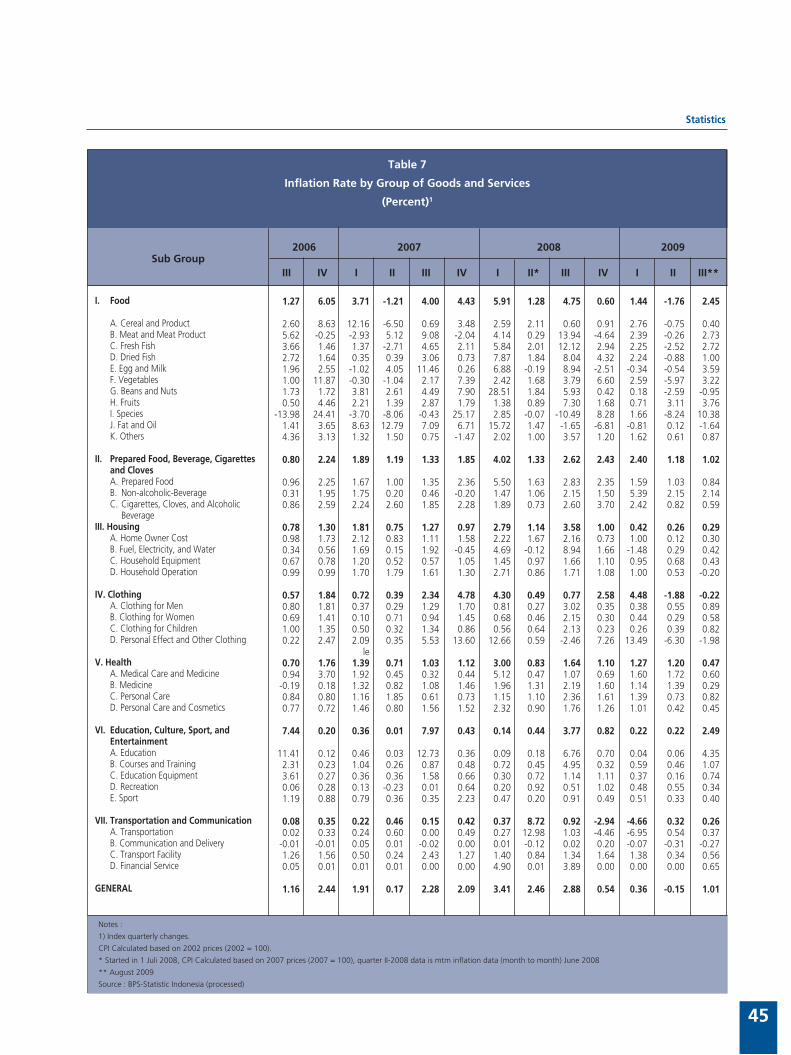
Statistics
45
Notes :
1) Index quarterly changes.
CPI Calculated based on 2002 prices (2002 = 100).
* Started in 1 Juli 2008, CPI Calculated based on 2007 prices (2007 = 100), quarter II-2008 data is mtm inflation data (month to month) June 2008
** August 2009
Source : BPS-Statistic Indonesia (processed)
Table 7
Inflation Rate by Group of Goods and Services
(Percent)1
1.27 6.05 3.71 -1.21 4.00 4.43 5.91 1.28 4.75 0.60 1.44 -1.76 2.45 2.60 8.63 12.16 -6.50 0.69 3.48 2.59 2.11 0.60 0.91 2.76 -0.75 0.40 5.62 -0.25 -2.93 5.12 9.08 -2.04 4.14 0.29 13.94 -4.64 2.39 -0.26 2.73 3.66 1.46 1.37 -2.71 4.65 2.11 5.84 2.01 12.12 2.94 2.25 -2.52 2.72 2.72 1.64 0.35 0.39 3.06 0.73 7.87 1.84 8.04 4.32 2.24 -0.88 1.00 1.96 2.55 -1.02 4.05 11.46 0.26 6.88 -0.19 8.94 -2.51 -0.34 -0.54 3.59 1.00 11.87 -0.30 -1.04 2.17 7.39 2.42 1.68 3.79 6.60 2.59 -5.97 3.22 1.73 1.72 3.81 2.61 4.49 7.90 28.51 1.84 5.93 0.42 0.18 -2.59 -0.95 0.50 4.46 2.21 1.39 2.87 1.79 1.38 0.89 7.30 1.68 0.71 3.11 3.76 -13.98 24.41 -3.70 -8.06 -0.43 25.17 2.85 -0.07 -10.49 8.28 1.66 -8.24 10.38 1.41 3.65 8.63 12.79 7.09 6.71 15.72 1.47 -1.65 -6.81 -0.81 0.12 -1.64 4.36 3.13 1.32 1.50 0.75 -1.47 2.02 1.00 3.57 1.20 1.62 0.61 0.87 0.80 2.24 1.89 1.19 1.33 1.85 4.02 1.33 2.62 2.43 2.40 1.18 1.02 0.96 2.25 1.67 1.00 1.35 2.36 5.50 1.63 2.83 2.35 1.59 1.03 0.84 0.31 1.95 1.75 0.20 0.46 -0.20 1.47 1.06 2.15 1.50 5.39 2.15 2.14 0.86 2.59 2.24 2.60 1.85 2.28 1.89 0.73 2.60 3.70 2.42 0.82 0.59 0.78 1.30 1.81 0.75 1.27 0.97 2.79 1.14 3.58 1.00 0.42 0.26 0.29 0.98 1.73 2.12 0.83 1.11 1.58 2.22 1.67 2.16 0.73 1.00 0.12 0.30 0.34 0.56 1.69 0.15 1.92 -0.45 4.69 -0.12 8.94 1.66 -1.48 0.29 0.42 0.67 0.78 1.20 0.52 0.57 1.05 1.45 0.97 1.66 1.10 0.95 0.68 0.43 0.99 0.99 1.70 1.79 1.61 1.30 2.71 0.86 1.71 1.08 1.00 0.53 -0.20 0.57 1.84 0.72 0.39 2.34 4.78 4.30 0.49 0.77 2.58 4.48 -1.88 -0.22 0.80 1.81 0.37 0.29 1.29 1.70 0.81 0.27 3.02 0.35 0.38 0.55 0.89 0.69 1.41 0.10 0.71 0.94 1.45 0.68 0.46 2.15 0.30 0.44 0.29 0.58 1.00 1.35 0.50 0.32 1.34 0.86 0.56 0.64 2.13 0.23 0.26 0.39 0.82 0.22 2.47 2.09 0.35 5.53 13.60 12.66 0.59 -2.46 7.26 13.49 -6.30 -1.98 le 0.70 1.76 1.39 0.71 1.03 1.12 3.00 0.83 1.64 1.10 1.27 1.20 0.47 0.94 3.70 1.92 0.45 0.32 0.44 5.12 0.47 1.07 0.69 1.60 1.72 0.60 -0.19 0.18 1.32 0.82 1.08 1.46 1.96 1.31 2.19 1.60 1.14 1.39 0.29 0.84 0.80 1.16 1.85 0.61 0.73 1.15 1.10 2.36 1.61 1.39 0.73 0.82 0.77 0.72 1.46 0.80 1.56 1.52 2.32 0.90 1.76 1.26 1.01 0.42 0.45 7.44 0.20 0.36 0.01 7.97 0.43 0.14 0.44 3.77 0.82 0.22 0.22 2.49 11.41 0.12 0.46 0.03 12.73 0.36 0.09 0.18 6.76 0.70 0.04 0.06 4.35 2.31 0.23 1.04 0.26 0.87 0.48 0.72 0.45 4.95 0.32 0.59 0.46 1.07 3.61 0.27 0.36 0.36 1.58 0.66 0.30 0.72 1.14 1.11 0.37 0.16 0.74 0.06 0.28 0.13 -0.23 0.01 0.64 0.20 0.92 0.51 1.02 0.48 0.55 0.34 1.19 0.88 0.79 0.36 0.35 2.23 0.47 0.20 0.91 0.49 0.51 0.33 0.40 0.08 0.35 0.22 0.46 0.15 0.42 0.37 8.72 0.92 -2.94 -4.66 0.32 0.26 0.02 0.33 0.24 0.60 0.00 0.49 0.27 12.98 1.03 -4.46 -6.95 0.54 0.37 -0.01 -0.01 0.05 0.01 -0.02 0.00 0.01 -0.12 0.02 0.20 -0.07 -0.31 -0.27 1.26 1.56 0.50 0.24 2.43 1.27 1.40 0.84 1.34 1.64 1.38 0.34 0.56 0.05 0.01 0.01 0.01 0.00 0.00 4.90 0.01 3.89 0.00 0.00 0.00 0.65 1.16 2.44 1.91 0.17 2.28 2.09 3.41 2.46 2.88 0.54 0.36 -0.15 1.01
Sub Group 2006 2007 2008 2009 III IV I II III IV I II* III IV I II III**
I. Food A. Cereal and Product B. Meat and Meat Product C. Fresh Fish D. Dried Fish E. Egg and Milk F. Vegetables G. Beans and Nuts H. Fruits I. Species J. Fat and Oil K. Others
II. Prepared Food, Beverage, Cigarettes and Cloves A. Prepared Food B. Non-alcoholic-Beverage C. Cigarettes, Cloves, and Alcoholic BeverageIII. Housing A. Home Owner Cost B. Fuel, Electricity, and Water C. Household Equipment D. Household Operation IV. Clothing A. Clothing for Men B. Clothing for Women C. Clothing for Children D. Personal Effect and Other Clothing
V. Health A. Medical Care and Medicine B. Medicine C. Personal Care D. Personal Care and Cosmetics
VI. Education, Culture, Sport, and Entertainment A. Education B. Courses and Training C. Education Equipment D. Recreation E. Sport
VII. Transportation and Communication A. Transportation B. Communication and Delivery C. Transport Facility D. Financial Service
GENERAL
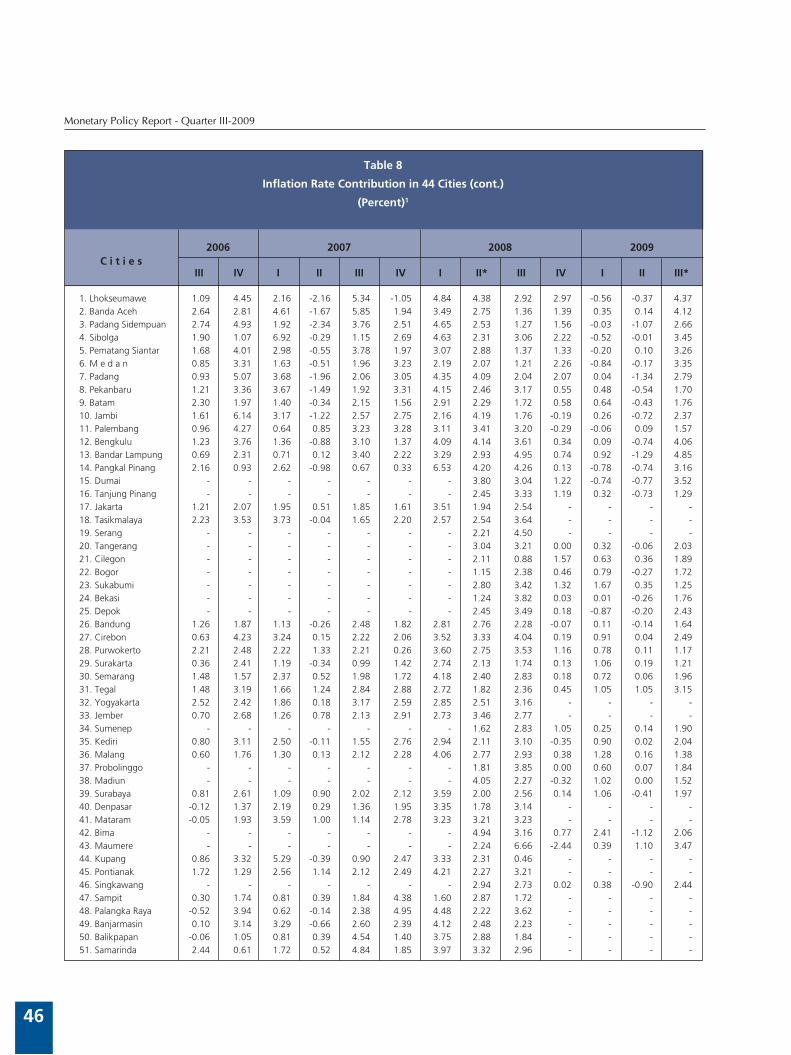
Monetary Policy Report - Quarter III-2009
46
Table 8
Inflation Rate Contribution in 44 Cities (cont.)
(Percent)1
1.09 4.45 2.16 -2.16 5.34 -1.05 4.84 4.38 2.92 2.97 -0.56 -0.37 4.37 2.64 2.81 4.61 -1.67 5.85 1.94 3.49 2.75 1.36 1.39 0.35 0.14 4.12 2.74 4.93 1.92 -2.34 3.76 2.51 4.65 2.53 1.27 1.56 -0.03 -1.07 2.66 1.90 1.07 6.92 -0.29 1.15 2.69 4.63 2.31 3.06 2.22 -0.52 -0.01 3.45 1.68 4.01 2.98 -0.55 3.78 1.97 3.07 2.88 1.37 1.33 -0.20 0.10 3.26 0.85 3.31 1.63 -0.51 1.96 3.23 2.19 2.07 1.21 2.26 -0.84 -0.17 3.35 0.93 5.07 3.68 -1.96 2.06 3.05 4.35 4.09 2.04 2.07 0.04 -1.34 2.79 1.21 3.36 3.67 -1.49 1.92 3.31 4.15 2.46 3.17 0.55 0.48 -0.54 1.70 2.30 1.97 1.40 -0.34 2.15 1.56 2.91 2.29 1.72 0.58 0.64 -0.43 1.76 1.61 6.14 3.17 -1.22 2.57 2.75 2.16 4.19 1.76 -0.19 0.26 -0.72 2.37 0.96 4.27 0.64 0.85 3.23 3.28 3.11 3.41 3.20 -0.29 -0.06 0.09 1.57 1.23 3.76 1.36 -0.88 3.10 1.37 4.09 4.14 3.61 0.34 0.09 -0.74 4.06 0.69 2.31 0.71 0.12 3.40 2.22 3.29 2.93 4.95 0.74 0.92 -1.29 4.85 2.16 0.93 2.62 -0.98 0.67 0.33 6.53 4.20 4.26 0.13 -0.78 -0.74 3.16 - - - - - - - 3.80 3.04 1.22 -0.74 -0.77 3.52 - - - - - - - 2.45 3.33 1.19 0.32 -0.73 1.29 1.21 2.07 1.95 0.51 1.85 1.61 3.51 1.94 2.54 - - - - 2.23 3.53 3.73 -0.04 1.65 2.20 2.57 2.54 3.64 - - - - - - - - - - - 2.21 4.50 - - - - - - - - - - - 3.04 3.21 0.00 0.32 -0.06 2.03 - - - - - - - 2.11 0.88 1.57 0.63 0.36 1.89 - - - - - - - 1.15 2.38 0.46 0.79 -0.27 1.72 - - - - - - - 2.80 3.42 1.32 1.67 0.35 1.25 - - - - - - - 1.24 3.82 0.03 0.01 -0.26 1.76 - - - - - - - 2.45 3.49 0.18 -0.87 -0.20 2.43 1.26 1.87 1.13 -0.26 2.48 1.82 2.81 2.76 2.28 -0.07 0.11 -0.14 1.64 0.63 4.23 3.24 0.15 2.22 2.06 3.52 3.33 4.04 0.19 0.91 0.04 2.49 2.21 2.48 2.22 1.33 2.21 0.26 3.60 2.75 3.53 1.16 0.78 0.11 1.17 0.36 2.41 1.19 -0.34 0.99 1.42 2.74 2.13 1.74 0.13 1.06 0.19 1.21 1.48 1.57 2.37 0.52 1.98 1.72 4.18 2.40 2.83 0.18 0.72 0.06 1.96 1.48 3.19 1.66 1.24 2.84 2.88 2.72 1.82 2.36 0.45 1.05 1.05 3.15 2.52 2.42 1.86 0.18 3.17 2.59 2.85 2.51 3.16 - - - - 0.70 2.68 1.26 0.78 2.13 2.91 2.73 3.46 2.77 - - - - - - - - - - - 1.62 2.83 1.05 0.25 0.14 1.90 0.80 3.11 2.50 -0.11 1.55 2.76 2.94 2.11 3.10 -0.35 0.90 0.02 2.04 0.60 1.76 1.30 0.13 2.12 2.28 4.06 2.77 2.93 0.38 1.28 0.16 1.38 - - - - - - - 1.81 3.85 0.00 0.60 0.07 1.84 - - - - - - - 4.05 2.27 -0.32 1.02 0.00 1.52 0.81 2.61 1.09 0.90 2.02 2.12 3.59 2.00 2.56 0.14 1.06 -0.41 1.97 -0.12 1.37 2.19 0.29 1.36 1.95 3.35 1.78 3.14 - - - - -0.05 1.93 3.59 1.00 1.14 2.78 3.23 3.21 3.23 - - - - - - - - - - - 4.94 3.16 0.77 2.41 -1.12 2.06 - - - - - - - 2.24 6.66 -2.44 0.39 1.10 3.47 0.86 3.32 5.29 -0.39 0.90 2.47 3.33 2.31 0.46 - - - - 1.72 1.29 2.56 1.14 2.12 2.49 4.21 2.27 3.21 - - - - - - - - - - - 2.94 2.73 0.02 0.38 -0.90 2.44 0.30 1.74 0.81 0.39 1.84 4.38 1.60 2.87 1.72 - - - - -0.52 3.94 0.62 -0.14 2.38 4.95 4.48 2.22 3.62 - - - - 0.10 3.14 3.29 -0.66 2.60 2.39 4.12 2.48 2.23 - - - - -0.06 1.05 0.81 0.39 4.54 1.40 3.75 2.88 1.84 - - - - 2.44 0.61 1.72 0.52 4.84 1.85 3.97 3.32 2.96 - - - -
C i t i e s 2006 2007 2008 2009
III IV I II III IV I II* III IV I II III*
1. Lhokseumawe2. Banda Aceh3. Padang Sidempuan4. Sibolga5. Pematang Siantar6. M e d a n7. Padang8. Pekanbaru9. Batam10. Jambi11. Palembang12. Bengkulu13. Bandar Lampung14. Pangkal Pinang15. Dumai16. Tanjung Pinang17. Jakarta18. Tasikmalaya19. Serang20. Tangerang21. Cilegon22. Bogor23. Sukabumi24. Bekasi25. Depok26. Bandung27. Cirebon28. Purwokerto29. Surakarta30. Semarang31. Tegal32. Yogyakarta33. Jember34. Sumenep35. Kediri36. Malang37. Probolinggo38. Madiun39. Surabaya40. Denpasar41. Mataram42. Bima43. Maumere44. Kupang45. Pontianak46. Singkawang47. Sampit48. Palangka Raya49. Banjarmasin50. Balikpapan51. Samarinda
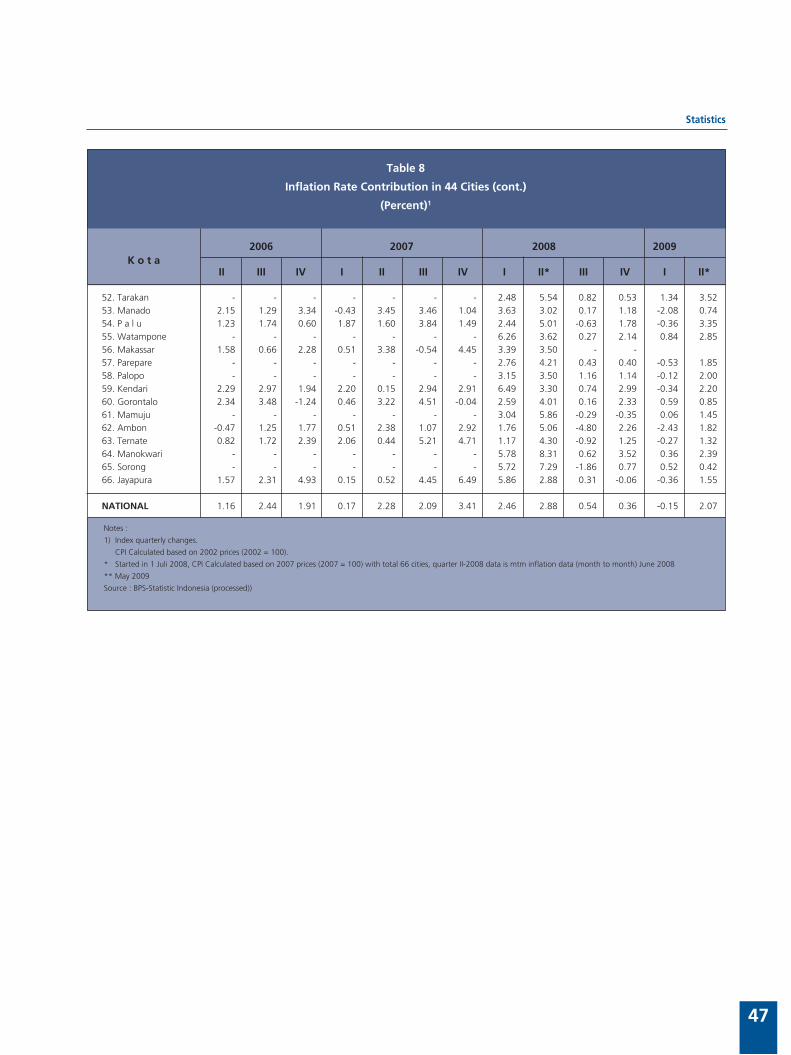
Statistics
47
Notes :
1) Index quarterly changes.
CPI Calculated based on 2002 prices (2002 = 100).
* Started in 1 Juli 2008, CPI Calculated based on 2007 prices (2007 = 100) with total 66 cities, quarter II-2008 data is mtm inflation data (month to month) June 2008
** May 2009
Source : BPS-Statistic Indonesia (processed))
Table 8
Inflation Rate Contribution in 44 Cities (cont.)
(Percent)1
- - - - - - - 2.48 5.54 0.82 0.53 1.34 3.52 2.15 1.29 3.34 -0.43 3.45 3.46 1.04 3.63 3.02 0.17 1.18 -2.08 0.74 1.23 1.74 0.60 1.87 1.60 3.84 1.49 2.44 5.01 -0.63 1.78 -0.36 3.35 - - - - - - - 6.26 3.62 0.27 2.14 0.84 2.85 1.58 0.66 2.28 0.51 3.38 -0.54 4.45 3.39 3.50 - - - - - - - - - 2.76 4.21 0.43 0.40 -0.53 1.85 - - - - - - - 3.15 3.50 1.16 1.14 -0.12 2.00 2.29 2.97 1.94 2.20 0.15 2.94 2.91 6.49 3.30 0.74 2.99 -0.34 2.20 2.34 3.48 -1.24 0.46 3.22 4.51 -0.04 2.59 4.01 0.16 2.33 0.59 0.85 - - - - - - - 3.04 5.86 -0.29 -0.35 0.06 1.45 -0.47 1.25 1.77 0.51 2.38 1.07 2.92 1.76 5.06 -4.80 2.26 -2.43 1.82 0.82 1.72 2.39 2.06 0.44 5.21 4.71 1.17 4.30 -0.92 1.25 -0.27 1.32 - - - - - - - 5.78 8.31 0.62 3.52 0.36 2.39 - - - - - - - 5.72 7.29 -1.86 0.77 0.52 0.42 1.57 2.31 4.93 0.15 0.52 4.45 6.49 5.86 2.88 0.31 -0.06 -0.36 1.55 1.16 2.44 1.91 0.17 2.28 2.09 3.41 2.46 2.88 0.54 0.36 -0.15 2.07
K o t a 2006 2007 2008 2009
II III IV I II III IV I II* III IV I II*
52. Tarakan53. Manado54. P a l u55. Watampone56. Makassar57. Parepare58. Palopo59. Kendari60. Gorontalo61. Mamuju62. Ambon63. Ternate64. Manokwari65. Sorong66. Jayapura
NATIONAL
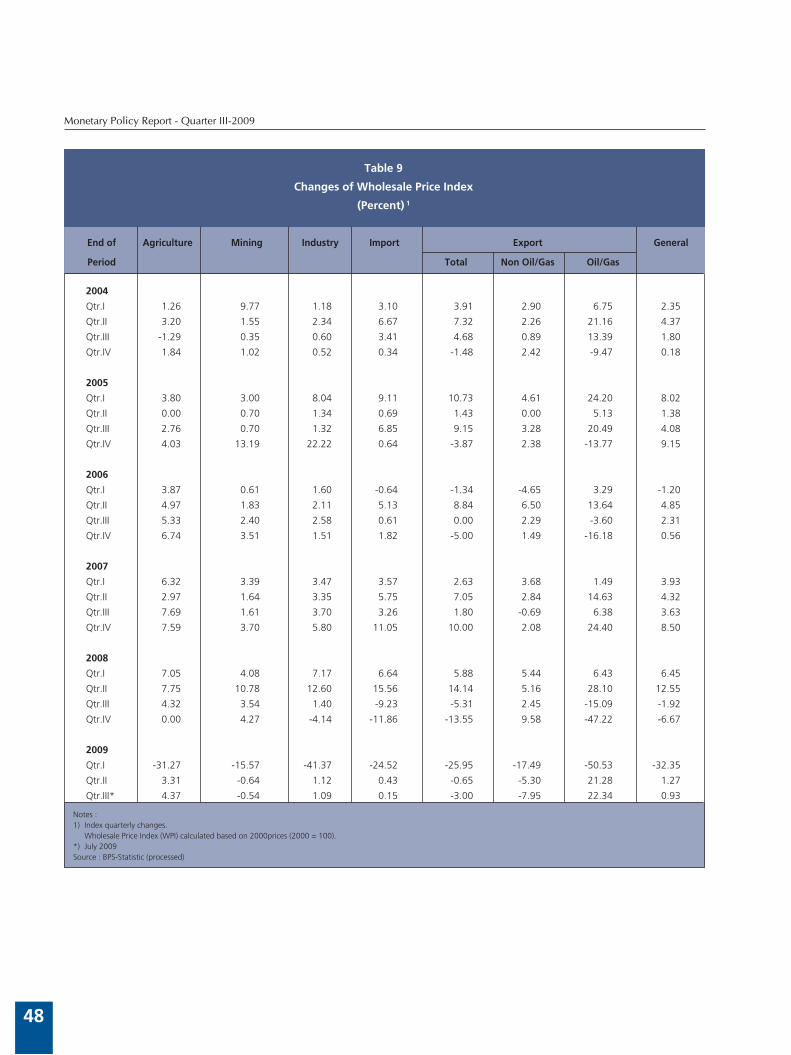
Monetary Policy Report - Quarter III-2009
48
Notes :1) Index quarterly changes. Wholesale Price Index (WPI) calculated based on 2000prices (2000 = 100).*) July 2009Source : BPS-Statistic (processed)
Table 9
Changes of Wholesale Price Index
(Percent) 1
1.26 9.77 1.18 3.10 3.91 2.90 6.75 2.35
3.20 1.55 2.34 6.67 7.32 2.26 21.16 4.37
-1.29 0.35 0.60 3.41 4.68 0.89 13.39 1.80
1.84 1.02 0.52 0.34 -1.48 2.42 -9.47 0.18
3.80 3.00 8.04 9.11 10.73 4.61 24.20 8.02
0.00 0.70 1.34 0.69 1.43 0.00 5.13 1.38
2.76 0.70 1.32 6.85 9.15 3.28 20.49 4.08
4.03 13.19 22.22 0.64 -3.87 2.38 -13.77 9.15
3.87 0.61 1.60 -0.64 -1.34 -4.65 3.29 -1.20
4.97 1.83 2.11 5.13 8.84 6.50 13.64 4.85
5.33 2.40 2.58 0.61 0.00 2.29 -3.60 2.31
6.74 3.51 1.51 1.82 -5.00 1.49 -16.18 0.56
6.32 3.39 3.47 3.57 2.63 3.68 1.49 3.93
2.97 1.64 3.35 5.75 7.05 2.84 14.63 4.32
7.69 1.61 3.70 3.26 1.80 -0.69 6.38 3.63
7.59 3.70 5.80 11.05 10.00 2.08 24.40 8.50
7.05 4.08 7.17 6.64 5.88 5.44 6.43 6.45
7.75 10.78 12.60 15.56 14.14 5.16 28.10 12.55
4.32 3.54 1.40 -9.23 -5.31 2.45 -15.09 -1.92
0.00 4.27 -4.14 -11.86 -13.55 9.58 -47.22 -6.67
-31.27 -15.57 -41.37 -24.52 -25.95 -17.49 -50.53 -32.35
3.31 -0.64 1.12 0.43 -0.65 -5.30 21.28 1.27
4.37 -0.54 1.09 0.15 -3.00 -7.95 22.34 0.93
End of Agriculture Mining Industry Import Export General
Period Total Non Oil/Gas Oil/Gas
2004
Qtr.I
Qtr.II
Qtr.III
Qtr.IV
2005
Qtr.I
Qtr.II
Qtr.III
Qtr.IV
2006
Qtr.I
Qtr.II
Qtr.III
Qtr.IV
2007
Qtr.I
Qtr.II
Qtr.III
Qtr.IV
2008
Qtr.I
Qtr.II
Qtr.III
Qtr.IV
2009
Qtr.I
Qtr.II
Qtr.III*