Embed Size (px)
Citation preview

$1.4B $1.4B$1.9B $2.0B $1.6B
$1.2B $1.2B
$1.4B$1.8B
$2.1B$0.7B $0.8B
$1.1B
$1.3B $1.5B
2015 2016 2017 2018 2019
Capital Allocation
Capex Share Repurchase Dividend
JANUARY 19, 2015 Financial Modeling, Leverage, Comparable Analysis and Valuation prepared by Jencil Philip, ACA
Johnson Controls, Inc. (574) 210‐5115 [email protected]
Introduction
Johnson Controls, Inc. is a diversified industrial conglomerate and a leading global player in HVAC systems, Automotive Seating and Automotive Battery sector. This document summarizes a detailed Financial model, Valuation, Leverage and Peer Comparable Analysis, included as Annexure-1 to this document. The spreadsheet attached (Annexure-2) is an interactive model than can be toggled between Options 1-4 (Base case/Target/Upside/Downside). This memo summarizes the Base case which is in line with the Forward Looking Statement issued by Johnson Controls Management.
Base Case projections: 5 year forecast, 2015-2019
The Base case projections are in line with JCI Management outlook. 2015 estimates are Adjusted EPS of $3.63, Free Cash flow $1.5 billion and Debt to Capitalization 34%.
The 5 year EPS1 projections are mostly in line Analysts’ consensus estimate. There is a slight variance in 2017, where the Base case EPS projection is 6% higher than the consensus estimate, primarily due to expected realization of M&A synergies and reduction in SG&A expenses on account of operational efficiencies.
EPS YOY % Growth 5 Year CAGR 2015 2016 2017 2018 2019
14.5% 17.4% 19.1% 10.1% 2.9% 12.7%
Capital allocation in 2015 is in line with Management outlook – Capex $1.4B, Dividend $1.04/share and Share repurchase $1.2B. Capex spent is projected between 3.2% to 4.5% of Sales over 2015-2019. Dividend payout ratio is maintained between 31% to 46%, Dividend per share 5 year CAGR estimated at 23%. Cash returned to shareholders through stock repurchase over the 5 year projection period estimated at $7.8 billion.
1 EPS Adjusted for Non‐recurring and unusual items and transaction/integration cost
12.9x
14.7x
16.8x
18.9x 19.0x
17.4x
2.0x 1.5x 1.4x 1.3x 1.3x 1.3x0.4x 0.3x 0.3x 0.3x 0.3x 0.3x
0.0x
2.0x
4.0x
6.0x
8.0x
10.0x
12.0x
14.0x
16.0x
18.0x
20.0x
2014 2015 2016 2017 2018 2019
Base case ‐ Forecast Debt Statistics
EBITDA / Interest Debt / EBITDA Debt / Capitalization
$8.2B
$10.5B$11.9B
$13.7B$14.9B $15.0B
$6.7B $6.4B $6.7B $7.2B $7.6B $8.1B
0.0B
2.0B
4.0B
6.0B
8.0B
10.0B
12.0B
14.0B
16.0B
2014 2015 2016 2017 2018 2019
Maximum Debt capacity
Total Debt Capacity Forecast Debt
Details 2014 2015 2016 2017 2018 2019Base Case ROE 10% 18% 20% 22% 22% 21%
ROE @ additional debt 11% 26% 31% 38% 41% 37%
Leverage Benchmarking
The current Debt to Capitalization ratio of JCI stands at 36%. The Base case projections maintain this ratio at a conservative range of 33-34% over the forecast period. However based on analysis of diversified industrial peers of JCI, there is scope for raising additional debt in the current low interest environment while remaining Investment grade.
Peers Ingersoll-Rand and Textron have Investment grade credit ratings with an average Debt / EBITDA of 2.5x as of Fiscal 2014. JCI’s Fiscal 2014 Debt / EBITDA is 2.0x and projected to reduce to 1.30x by 2019. As of Fiscal 2014 JCI’s interest coverage ratio is 12.9x which is substantially higher than that of the aforementioned peers who average 6.2x. Further JCI’s coverage ratio is expected to improve to 17.4x by 2019. This presents an opportunity to potentially increase leverage while still maintaining Investment grade.
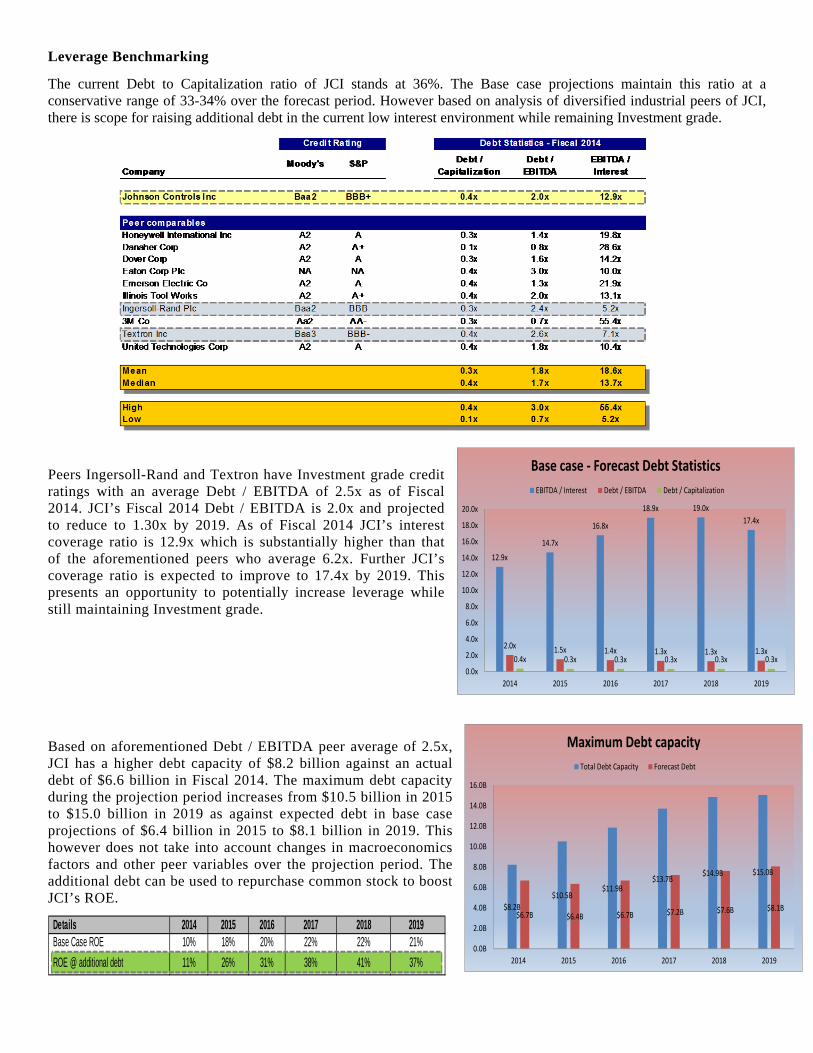
Based on aforementioned Debt / EBITDA peer average of 2.5x, JCI has a higher debt capacity of $8.2 billion against an actual debt of $6.6 billion in Fiscal 2014. The maximum debt capacity during the projection period increases from $10.5 billion in 2015 to $15.0 billion in 2019 as against expected debt in base case projections of $6.4 billion in 2015 to $8.1 billion in 2019. This however does not take into account changes in macroeconomics factors and other peer variables over the projection period. The additional debt can be used to repurchase common stock to boost JCI’s ROE.

Debt Skyline
The repayment schedule of JCI’s debt is represented in the Debt skyline.
JCI’s Long term debt is mostly fixed rate. The wide gaps between years 2025-2035 and 2037-2040 may present re-pricing risk in the event of a falling interest rate environment. There is scope for a mix of floating rate debt and smaller tranches of fixed rate debt for shorter maturity terms or with call features.
Between years 2015-2022 a combined debt repayment of $3.2 billion is due. This huge volume faces potential market liquidity risk in the event of refinancing. It would be ideal to spread out the maturities of future debt.
Performance Benchmarking
JCI’s historical profitability ratios are lagging behind peer comparables among diversified conglomerates, HVAC and Automotive industry, while faring above average among the Power solutions industry peers.
High, 13%
High, 19%
High, 29%
Mean, 8%
Mean, 11%
Mean, 18%
Low, 4%
Low, 6%
Low, 10%
JCI 4%
JCI, 10%
JCI 10%
0% 5% 10% 15% 20% 25% 30% 35%
ROA
ROIC
ROE
Profitability ratios ‐ Diversified Industrial comparables
3M
Textron / Eaton
3M
Eaton
Eaton
3M
High, 18%
High, 25%
High, 47%
Mean, 9%
Mean, 15%
Mean, 23%
Low, 4%
Low, 7%
Low, 7%
JCI 4%
JCI, 10%
JCI,10%
0% 5% 10% 15% 20% 25% 30% 35% 40% 45% 50%
ROA
ROIC
ROE
Profitability ratios ‐ HVAC comparables
Aaon
Comfort
Aaon
Comfort
Comfort
Aaon
High, 8%
High, 9%
High, 19%
Mean, 4%
Mean, 5%
Mean, 12%
Low, 0%
Low, 1%
Low, 7%
JCI 4%
JCI, 10%
JCI, 10%
0% 2% 4% 6% 8% 10% 12% 14% 16% 18% 20%
ROA
ROIC
ROE
Profitability ratios ‐ Power comparables
Camel
Exide
Camel
GS Yuasa
Exide
Camel
High, 7%
High, 15%
High, 20%
Mean, 7%
Mean, 12%
Mean, 18%
Low, 6%
Low, 9%
Low, 17%
JCI 4%
JCI 10%
JCI, 10%
0% 5% 10% 15% 20% 25%
ROA
ROIC
ROE
Profitability ratios ‐ Automotive comparables
Lear
Huntsman
Huntsman
Lear
Huntsman
Lear

High, 52%
High, 27%
High, 22%
High, 20%
Mean, 35%
Mean, 19%
Mean, 15%
Mean, 10%
Low, 17%
Low, 11%
Low, 7%
Low, 4%
JCI, 15%
JCI, 8%
JCI, 5%
JCI, 3%
0% 10% 20% 30% 40% 50% 60%
Gross Profit
EBITDA
EBIT
Net Income
PROFITABILITY MARGINS ‐ DIVERSIFIED INDUSTRIAL COMPARABLES
3M
Textron
Illinois Tool Works
Danaher
3M
Textron
Textron
Textron
High, 33%
High, 23%
High, 19%
High, 12%
Mean, 27%
Mean, 13%
Mean, 10%
Mean, 5%
Low, 18%
Low, 4%
Low, 3%
Low, 1%
JCI, 15%
JCI, 8%
JCI 5%
JCI, 3%
0% 5% 10% 15% 20% 25% 30% 35%
Gross Profit
EBITDA
EBIT
Net Income
PROFITABILITY MARGINS ‐ HVAC COMPARABLES
Aaon
Comfort
Aaon
Daikin
Aaon
Comfort
Comfort
Comfort
High, 17%
High, 11%
High, 8%
High, 4%
Mean, 13%
Mean, 9%
Mean, 7%
Mean, 3%
Low, 9%
Low, 8%
Low, 6%
Low, 3%
JCI 15%
JCI 8%
JCI, 5%
JCI, 3%
0% 2% 4% 6% 8% 10% 12% 14% 16% 18%
Gross Profit
EBITDA
EBIT
Net Income
PROFITABILITY MARGINS ‐ AUTOMOTIVE COMPARABLES
Huntsman
Lear
Huntsman
Huntsman
Huntsman
Lear
Lear
Lear
Low, ‐6%
Low, ‐4%
Low, ‐10%
Low, ‐2%
Mean, 9%
Mean, 6%
Mean, 9%
Mean, 12%
High, 29%
High, 13%
High, 33%
High, 21%
JCI 18%
JCI, 20%
JCI, 10%
JCI 48%
‐20% ‐10% 0% 10% 20% 30% 40% 50% 60%
Growth ‐ Diversified Industrial comparablesEst. 2 year EPS CAGR
Hist. 2 year EPS CAGR
Hist. 2 year EBITDA CAGR
Est. 2 year EBITDA CAGR
Ingersoll‐Rand
Honeywell
Ingersoll‐Rand
Honeywell
Ingersoll‐Rand
Dover
Ingersoll‐Rand
Dover
Low, ‐15%
Low, 0%
Low, ‐9%
Low, 0%
Mean, 16%
Mean, 11%
Mean, 41%
Mean, 11%
High, 38%
High, 18%
High, 122%
High, 20%
JCI, 18%
JCI, 20%
JCI, 10%
JCI 48%
‐40% ‐20% 0% 20% 40% 60% 80% 100% 120% 140%
Growth ‐ HVAC comparablesEst. 2 year EPS CAGR
Hist. 2 year EPS CAGR
Hist. 2 year EBITDA CAGR
Est. 2 year EBITDA CAGR
Aaon
Daikin
Aaon
Daikin
Trane
Trane
Trane
Trane
A similar trend is observed for historical profitability margins between and JCI and its peers.
On the other hand JCI’s estimated forward 2 year EPS and EBITDA CAGR outperforms its peers. The Base case estimates are largely in line with consensus estimates. This can be largely attributed to the success of JCI’s acquisition and divestiture strategy in managing its business portfolios and to internal operational improvement initiatives.
High, 23%
High, 18%
High, 15%
High, 13%
Mean, 18%
Mean, 9%
Mean, 6%
Mean, 2%
Low, 13%
Low, 3%
Low, 0%
Low, ‐9%
JCI, 15%
JCI, 8%
JCI, 5%
JCI 3%
‐15% ‐10% ‐5% 0% 5% 10% 15% 20% 25%
Gross Profit
EBITDA
EBIT
Net Income
PROFITABILITY MARGINS ‐ POWER COMPARABLES
Camel
Exide
Camel
Camel
Camel
Exide
Exide
Chaowei

Low, ‐4%
Low, 15%
Low, ‐11%
Low, 27%
Mean, 8%
Mean, 16%
Mean, ‐1%
Mean, 27%
High, 19%
High, 17%
High, 8%
High, 28%
JCI, 18%
JCI, 20%
JCI, 10%
JCI, 48%
‐20% ‐10% 0% 10% 20% 30% 40% 50% 60%
Growth ‐ Automotive comparablesEst. 2 year EPS CAGR
Hist. 2 year EPS CAGR
Hist. 2 year EBITDA CAGR
Est. 2 year EBITDA CAGR
Huntsman
Lear
Lear
Lear
Huntsman
Huntsman
Huntsman
Lear
Low, ‐21%
Low, 0%
Low, ‐46%
Low, 0%
Mean, 1%
Mean, 16%
Mean, ‐12%
Mean, 23%
High, 28%
High, 34%
High, 13%
High, 40%
JCI, 18%
JCI, 20%
JCI, 10%
JCI, 48%
‐60% ‐40% ‐20% 0% 20% 40% 60%
Growth ‐ Power comparables Est. 2 year EPS CAGR
Hist. 2 year EPS CAGR
Hist. 2 year EBITDA CAGR
Est. 2 year EBITDA CAGR
GS Yuasa
Camel
Camel
Camel
Exide
Exide
Chaowei
Exide
EV / 2015E EBITDA 10.2x2015E EBITDA 4,184
Enterprise Value 42,778 Less: Total Debt (6,680) Less: Preferred Stock - Less: Noncontrolling Interest - Plus: Cash and Cash Equivalents 409
Implied Equity Value $36,507
Fully Diluted Shares Outstanding 675.000
Implied Share Price $54.08
Implied Equity Value and Share Price
Valuation
Valuation was performed employing Discounted cash flow and Public company comparable techniques. JCI stock is currently trading close to its implied share price derived from DCF technique.
Discounted Cash flow
Public Company Comparable
Enterprise Value Implied Perpetuity Growth RateCumulative Present Value of FCF $8,514 Enterprise Value 35,568 Terminal Year Free Cash Flow $3,359
Less: Total Debt (6,680) WACC 10.7%Terminal Value Less: Preferred Stock - Terminal Value 44,906 Terminal Year EBITDA $5,988 Less: Noncontrolling Interest -
Exit Multiple 7.5x Plus: Cash and Cash Equivalents 409 Implied Perpetuity Growth Rate 3.0% Terminal Value $44,906 Discount Factor 0.60 Implied Equity Value $29,297 Implied EV/EBITDA
Present Value of Terminal Value $27,054 Enterprise Value $35,568 % of Enterprise Value 76.1% Fully Diluted Shares Outstanding 675.000 Fiscal 2014 EBITDA 3,274
Enterprise Value $35,568 Implied Share Price $43.40 Implied EV/EBITDA 10.9x
Implied Equity Value and Share Price

Annexure-1
Financial Modeling, Leverage, Comparable Analysisand Valuation
prepared by Jencil Philip

Johnson Controls, Inc.Leverage Benchmarking($ in millions, 5 year forecast: 2015-2019) Operating Scenario : Base
Company
Johnson Controls Inc Baa2 BBB+ 0.4x 2.0x 12.9x
Peer comparables1
Honeywell International Inc A2 A 0.3x 1.4x 19.8xDanaher Corp A2 A+ 0.1x 0.8x 28.6xDover Corp A2 A 0.3x 1.6x 14.2xEaton Corp Plc NA NA 0.4x 3.0x 10.0xEmerson Electric Co A2 A 0.4x 1.3x 21.9xIllinois Tool Works A2 A+ 0.4x 2.0x 13.1xIngersoll-Rand Plc Baa2 BBB 0.3x 2.4x 5.2x3M Co Aa2 AA- 0.3x 0.7x 55.4xTextron Inc Baa3 BBB- 0.4x 2.6x 7.1xUnited Technologies Corp A2 A 0.4x 1.8x 10.4x
Mean 0.3x 1.8x 18.6xMedian 0.4x 1.7x 13.7x
High 0.4x 3.0x 55.4xLow 0.1x 0.7x 5.2x
Historical Debt Statistics 2014 2015 2016 2017 2018 2019
Debt / Capitalization 0.4x 0.3x 0.3x 0.3x 0.3x 0.3xDebt / EBITDA 2.0x 1.5x 1.4x 1.3x 1.3x 1.3xEBITDA / Interest 12.9x 14.7x 16.8x 18.9x 19.0x 17.4x
Debt CapacityDebt / EBITDA3 2.5x 2.5x 2.5x 2.5x 2.5x 2.5xEBITDA $3,274 $4,184 $4,723 $5,459 $5,913 $5,988Forecast Debt $6,680 $6,357 $6,677 $7,218 $7,623 $8,066Total Debt Capacity $8,228 $10,515 $11,868 $13,718 $14,860 $15,047Additional Debt Capacity $1,548 $4,158 $5,191 $6,500 $7,237 $6,981Net Issuance / (repayment) $1,548 $2,611 $1,033 $1,309 $738 ($256)
Base Case ROE 10% 18% 20% 22% 22% 21%ROE @ additional debt4 11% 26% 31% 38% 41% 37%
Notes:1. Diversified industrial peers of JCI are included in the comparable universe. Source: 10-K2. Benchmarking based on Fiscal 2014 results. 3. Potential Debt capacity while remaining Investment grade, based on peer comparables - Ingersoll and Textron4. Additional debt assumed to be used to repurchase common stock. Interest on additional debt @4.3%.
Credit Rating Debt Statistics - Fiscal 2014
Projection
Debt / Capitalization
Debt / EBITDA
EBITDA / Interest
Moody's S&P

Johnson Controls, Inc.Performance Benchmarking($ in millions, 5 year forecast: 2015-2019) Operating Scenario : Base
ROA ROIC ROECompany (%) (%) (%) (%)
Johnson Controls Inc 4% 10% 10% 15% 8% 5% 3% 3% 3% -3% -10% 18% 20% -37% 92% 35% 10% 48%
Diversified Industrial comparablesHoneywell International Inc 8% 14% 25% 28% 17% 15% 10% 6% 4% 3% 24% 29% 5% 6% 27% 32% 33% 11%Danaher Corp 6% 8% 12% 52% 22% 17% 14% 5% 5% 5% 6% 3% 8% 31% 0% 7% 10% 11%Dover Corp 9% 12% 20% 38% 21% 16% 9% 19% 10% -2% 22% 12% -4% 132% 46% 12% 16% -2%Eaton Corp Plc 4.4% 6% 10% 31% 15% 11% 8% 8% 19% 3% 10% 23% 8% 280% 60% 3% -7% 10%Emerson Electric Co 11% 16% 21% 41% 20% 17% 9% -1% 0% 2% 3% 1% 1% -17% 9% 10% 7% 7%Illinois Tool Works 9% 11% 20% 40% 22% 20% 20% 3% -4% 3% 10% 1% 10% 341% 31% -6% 10% 20%Ingersoll-Rand Plc 5% 8% 12% 30% 13% 10% 6% 19% -5% 5% 47% -6% 13% 102% 4% 60% -10% 21%3M Co 13% 19% 29% 48% 27% 22% 15% 3% 3% 3% 8% 5% 6% 35% 19% 12% 8% 11%Textron Inc 4.4% 8% 14% 17% 11% 7% 4% 11% 5% 11% 16% 8% 10% 56% -39% 21% 18% 19%United Technologies Corp 7% 12% 20% 28% 18% 16% 10% 4% 8% 3% 19% 13% 6% -8% 73% 19% 9% 8%
Mean 8% 11% 18% 35% 19% 15% 10% 8% 5% 3% 16% 9% 6% 96% 23% 17% 9% 12%Median 8% 12% 20% 35% 19% 16% 9% 5% 4% 3% 13% 6% 7% 45% 23% 12% 9% 11%High 13% 19% 29% 52% 27% 22% 20% 19% 19% 11% 47% 29% 13% 341% 73% 60% 33% 21%Low 4% 6% 10% 17% 11% 7% 4% -1% -5% -2% 3% -6% -4% -17% -39% -6% -10% -2%
HVAC comparablesAaon Inc 18% 25% 24% 30% 23% 19% 12% 6% 9% 12% 14% 27% 18% -10% 18% 10% 41% 20%Daikin Industries Ltd 6% 7% 14% 33% 14% 10% 6% 17% 21% 8% 31% 38% 16% 254% 65% 17% 122% 18%Trane Inc 7% 22% 47% 28% 11% 10% 2% 18% -13% 0% 23% -15% 0% 0% 42% 18% -9% 0%Comfort Systems Usa Inc 4% 7% 7% 18% 4% 3% 1% 3% 3% 5% -12% 12% 9% -51% -29% -30% 9% 5%
Mean 9% 15% 23% 27% 13% 10% 5% 11% 5% 6% 14% 16% 11% 48% 24% 4% 41% 11%Median 6% 15% 19% 29% 12% 10% 4% 12% 6% 7% 18% 20% 12% -5% 30% 14% 25% 12%High 18% 25% 47% 33% 23% 19% 12% 18% 21% 12% 31% 38% 18% 254% 65% 18% 122% 20%Low 4% 7% 7% 18% 4% 3% 1% 3% -13% 0% -12% -15% 0% -51% -29% -30% -9% 0%
Automotive comparablesHuntsman Corp 6% 9% 20% 17% 11% 8% 4% 3% 1% 8% 23% -4% 15% -30% -32% 700% -11% 28%Lear Corp 7% 15% 17% 9% 8% 6% 3% 11% 10% 8% 27% 19% 17% 114% 99% -57% 8% 27%
Mean 7% 12% 18% 13% 9% 7% 3% 7% 5% 8% 25% 8% 16% 42% 33% 321% -1% 27%Median 7% 12% 18% 13% 9% 7% 3% 7% 5% 8% 25% 8% 16% 42% 33% 321% -1% 27%High 7% 15% 20% 17% 11% 8% 4% 11% 10% 8% 27% 19% 17% 114% 99% 700% 8% 28%Low 6% 9% 17% 9% 8% 6% 3% 3% 1% 8% 23% -4% 15% -30% -32% -57% -11% 27%
Power comparablesGS Yuasa Corp 4% 6% 7% 22% 10% 6% 3% 26% 15% 9% 62% 16% 19% 0% 0% 107% -3% 40%Exide Technologies 0% 1% - 14% 3% 0% -9% -6% -3% 0% 9% -21% 0% 0% -55% - - 0%Chaowei Power Holdings Ltd 4% 5% 11% 13% 4% 3% 1% 43% 53% 17% -12% -20% 11% 0% 0% -53% -46% 25%Camel Group Co Ltd-A 8% 9% 19% 23% 18% 15% 13% 13% 16% 25% 32% 28% 34% 0% 0% 56% 13% 26%
Mean 4% 5% 12% 18% 9% 6% 2% 19% 20% 13% 23% 1% 16% 0% -14% 37% -12% 23%Median 4% 6% 11% 18% 7% 4% 2% 19% 16% 13% 21% -2% 15% 0% 0% 56% -3% 26%High 8% 9% 19% 23% 18% 15% 13% 43% 53% 25% 62% 28% 34% 0% 0% 107% 13% 40%Low 0% 1% 7% 13% 3% 0% -9% -6% -3% 0% -12% -21% 0% 0% -55% -53% -46% 0%
Overall
Mean 7% 11% 18% 28% 15% 11% 7% 11% 8% 6% 18% 8% 10% 62% 17% 49% 12% 15%Median 7% 9% 19% 28% 15% 11% 7% 7% 5% 5% 17% 10% 9% 3% 13% 12% 9% 15%
High 18% 25% 47% 52% 27% 22% 20% 43% 53% 25% 62% 38% 34% 341% 99% 700% 122% 40%Low 0% 1% 7% 9% 3% 0% -9% -6% -13% -2% -12% -21% -4% -51% -55% -57% -46% -2%
Notes:1. Profitability ratios based on Fiscal 2014 results. 2. Diluted EPS after excluding non-recurring / unusual items and transaction / integration cost3. 5 year forward EPS growth estimate
Profitability MarginsProfitability ratios1 GrowthFCF GrowthEBITDASales EPS2Gross
Profit EBITDA EBITNet
Income Hist. 2-year
Hist. 1-year
Est. 2-year
Hist. 1-year
Hist. 2-year
Est. 2-year
Est. 2-year
Hist. 1-year
Hist. 2-year
Hist. 1-year
Hist. 2-year

Johnson Controls, Inc.Valuation: Discounted Cash Flow ($ in millions, 5 year forecast: 2015-2019) Operating Scenario : Base
2015 2016 2017 2018 2019
EBIT $3,207 $3,689 $4,319 $4,669 $4,697
Income taxes 802 922 1,080 1,167 1,174
EBIAT $2,405 $2,767 $3,240 $3,502 $3,523
Plus: Depreciation & Amortization 977 1,033 1,139 1,244 1,291
Less: Capital Expenditures (1,355) (1,413) (1,900) (1,989) (1,619)
Less: Additions to Definite Life Intangibles - - - - -
Less: (Inc) /Dec in Net Working Capital (449) (464) (151) (94) 165
Unlevered Free Cash Flow $1,579 $1,924 $2,328 $2,663 $3,359
% growth 21.9% 21.0% 14.4% 26.1%
WACC 10.7%
Enterprise Value Implied Perpetuity Growth RateCumulative Present Value of FCF $8,514 Enterprise Value 35,568 Terminal Year Free Cash Flow $3,359
Less: Total Debt (6,680) WACC 10.7%Terminal Value Less: Preferred Stock - Terminal Value 44,906 Terminal Year EBITDA $5,988 Less: Noncontrolling Interest - Exit Multiple1 7.5x Plus: Cash and Cash Equivalents 409 Implied Perpetuity Growth Rate 3.0% Terminal Value $44,906Discount Factor 0.60 Implied Equity Value $29,297 Implied EV/EBITDA Present Value of Terminal Value2 $27,054 Enterprise Value $35,568 % of Enterprise Value 76.1% Fully Diluted Shares Outstanding 675.000 Fiscal 2014 EBITDA 3,274
Enterprise Value $35,568 Implied Share Price $43.40 Implied EV/EBITDA 10.9x
Implied Equity Value Sensitivity Analysis Implied Share Price Sensitivity Analysis
29,297 5.5x 6.5x 7.5x 8.5x 9.5x 43.40 5.5x 6.5x 7.5x 8.5x 9.5x8.7% 24,486 28,437 32,389 36,341 40,292 8.7% 36.28 42.13 47.98 53.84 59.699.7% 23,253 27,028 30,802 34,577 38,352 9.7% 34.45 40.04 45.63 51.23 56.82
10.7% 22,083 25,690 29,297 32,904 36,512 10.7% 32.72 38.06 43.40 48.75 54.0911.7% 20,972 24,421 27,869 31,318 34,766 11.7% 31.07 36.18 41.29 46.40 51.5112.7% 19,917 23,215 26,513 29,811 33,110 12.7% 29.51 34.39 39.28 44.17 49.05
Notes:1. Exit multiple of 7.5x is at the lower end of Diversified peer multiple range. This brings the implied perpetuity growth rate to a justifiable rate of 3.0%.2. Present Value of Terminal value is 76% of Enterprise value. This is at a higher end due to relatively shorter forecast period of 5 years. Hence long range steady state assumptions not factored in.
Exit MultipleExit Multiple
Projection Period
Implied Equity Value and Share Price
WA
CC
WA
CC

Johnson Controls, Inc.Valuation: Comparable Companies analysis($ in millions, 5 year forecast: 2015-2019) Operating Scenario : Base
Current % ofShare 52-wk. Equity Enterprise LTM 2015E LTM 2015E LTM 2015E
Company Ticker Price High Value Value Sales Sales EBITDA EBITDA EPS EPS
Johnson Controls Inc JCI $46.76 89% $42,828 $3,274 8% 18% 10% 20% 48%
Diversified Industrial comparablesHoneywell International Inc HON $98.93 97% 77,443 77,933 40,427 6,875 17% 29% 33% 5% 11% 1.9x 1.9.x 11.3x 9.8x 18.6x 16.8xDanaher Corp DHR $85.53 98% 60,101 59,181 19,763 4,366 22% 3% 10% 8% 11% 3.0x 2.9.x 13.6x 12.7x 22.4x 20.9xDover Corp DOV $69.64 72% 11,516 13,533 9,118 1,901 21% 12% 16% -4% -2% 1.5x 1.6.x 7.1x 8.2x 12.6x 14.4xEaton Corp Plc ETN $66.06 83% 31,352 39,451 22,514 3,445 15% 23% -7% 8% 10% 1.8x 1.7.x 11.5x 10.1x 18.7x 13.5xEmerson Electric Co EMR $60.90 87% 42,158 45,081 24,537 4,885 20% 1% 7% 1% 7% 1.8x 1.8.x 9.3x 8.8x 20.1x 15.4xIllinois Tool Works ITW $93.57 96% 36,580 39,295 14,534 3,260 22% 1% 10% 10% 20% 2.7x 2.7.x 12.1x 11.0x 21.2x 18.3xIngersoll-Rand Plc IR $61.75 95% 16,393 19,043 12,750 1,621 13% -6% -10% 13% 21% 1.5x 1.4.x 11.7x 10.2x 22.8x 17.0x3M Co MMM $161.62 96% 102,797 107,489 31,671 8,467 27% 5% 8% 6% 11% 3.4x 3.3.x 12.7x 12.2x 22.2x 20.2xTextron Inc TXT $42.58 96% 11,754 15,292 13,288 1,392 11% 8% 18% 10% 19% 1.2x 1.1.x 11.0x 9.5x 21.4x 17.0xUnited Technologies Corp UTX $114.02 94% 103,947 120,391 64,863 11,952 18% 13% 9% 6% 8% 1.9x 1.8.x 10.1x 9.9x 16.8x 16.5x
Mean 2.1x 2.0x 11.0x 10.2x 19.7x 17.0xMedian 1.9x 1.8x 11.4x 10.0x 20.7x 16.9xHigh 3.4x 3.3x 13.6x 12.7x 22.8x 20.9xLow 1.2x 1.1x 7.1x 8.2x 12.6x 13.5x
EV / 2015E EBITDA1 10.2x2015E EBITDA 4,184
Enterprise Value 42,778 36,507 54.08Less: Total Debt (6,680) 8.2x 28,138 8.2x 41.69Less: Preferred Stock - 9.2x 32,322 9.2x 47.89Less: Noncontrolling Interest - 10.2x 36,507 10.2x 54.08Plus: Cash and Cash Equivalents 409 11.2x 40,691 11.2x 60.28
12.2x 44,875 12.2x 66.48 Implied Equity Value $36,507
Fully Diluted Shares Outstanding 675.000
Implied Share Price $54.08
Notes:1. Average EV / EBITDA multiple of three comparables companies chosen on the basis of similar forward growth estimates.
EV / 2015E EBITDA
Implied Equity Value Sensitivity Analysis
Implied Share price Sensitivity Analysis
EV / 2015E EBITDA
Implied Equity Value and Share Price
Est. 2 Yr EPS Gr
%
Enterprise Value / Price /
LTM Revenue
LTM EBITDA
EBITDA (%)
Hist. 2 Yr EBITDA Gr
%
Hist. 2 Yr EPS Gr
%
Est. 2 Yr EBITDA Gr
%

Johnson Controls, Inc.Income Statement Projections($ in millions, 5 year forecast: 2015-2019) Operating Scenario : Base
Historical Period CAGR CAGR
2012 2013 2014 ('12 - '14) 2015 2016 2017 2018 2019 ('15 - '19)
Sales $40,604 $41,410 $42,828 2.7% $42,339 $40,359 $42,227 $44,195 $46,269 1.6%
% growth NA 2.0% 3.4% -1.1% -4.7% 4.6% 4.7% 4.7%
Cost of Goods Sold 33,943 33,993 35,246 33,709 31,601 32,757 33,973 35,308
Gross Profit1 $6,661 $7,417 $7,582 6.7% $8,630 $8,759 $9,470 $10,222 $10,961 7.7%
% margin 14.4% 15.6% 15.5% 18.1% 19.1% 19.7% 20.3% 20.9%
Selling, General & Administrative 4,311 3,780 4,308 4,446 4,036 4,012 4,309 4,974
EBITDA $2,350 $3,637 $3,274 18.0% $4,184 $4,723 $5,459 $5,913 $5,988 12.8%
Depreciation 768 877 869 882 943 1,053 1,161 1,214
Amortization 56 75 86 95 90 86 83 77
EBIT $1,526 $2,685 $2,319 23.3% $3,207 $3,689 $4,319 $4,669 $4,697 15.2%
% margin 3.8% 6.5% 5.4% 7.6% 9.1% 10.2% 10.6% 10.2%
Interest expense 248 266 254 285 281 288 312 344
Interest (income) (17) (19) (10) (3) (6) (9) (11) (13)
Other non-operating (income) / expense 247 950 435 212 202 211 221 231
Equity (income) / loss (338) (399) (395) (395) (395) (395) (395) (395)
Pretax Income $1,386 $1,887 $2,035 $3,109 $3,607 $4,224 $4,543 $4,530
Income taxes 161 696 482 777 902 1,056 1,136 1,132
Income from continuing operations $1,225 $1,191 $1,553 12.6% $2,331 $2,706 $3,168 $3,407 $3,397 16.9%
% margin 3.0% 2.9% 3.6% 5.5% 6.7% 7.5% 7.7% 7.3%
Discontinued operations income / (loss) 85 101 (218) - - - - -
Net income $1,310 $1,292 $1,335 $2,331 $2,706 $3,168 $3,407 $3,397
Non-controlling interests 126 114 120 120 120 120 120 120
Net income attributable to JCI $1,184 $1,178 $1,215 1.3% $2,211 $2,586 $3,048 $3,287 $3,277 22.0%
% margin 2.9% 2.8% 2.8% 5.2% 6.4% 7.2% 7.4% 7.1%
Diluted weighted average shares (in millions) 688.372 688.889 675.000 666.787 653.178 641.087 626.597 608.772
Earnings per share $1.72 $1.71 $1.80 $3.32 $3.96 $4.75 $5.25 $5.38 24.5%
% growth NA -0.6% 5.3% 84.3% 19.4% 20.1% 10.3% 2.6%
AssumptionsSales (% growth) NA 2.0% 3.4% -1.1% -4.7% 4.6% 4.7% 4.7%Gross margin (% sales) 16.4% 17.9% 17.7% 20.4% 21.7% 22.4% 23.1% 23.7%SG&A (% sales) 10.6% 9.1% 10.1% 10.5% 10.0% 9.5% 9.8% 10.8%Other Expense / (Income) (% of sales) 0.6% 2.3% 1.0% 0.5% 0.5% 0.5% 0.5% 0.5%Tax Rate 11.6% 36.9% 23.7% 25.0% 25.0% 25.0% 25.0% 25.0%
Notes:1. Gross Profit is calculated excluding Depreciation and Amortization (D&A). GP % Margin is after D&A.2. No mark-to-market adjustments assumed for pension and post retirement plans in the forecast period. 3. EPS Adjusted for Non-recurring and unusual items and transaction/integration cost.
Excluding non-recurring / unusual items and transaction / integration cost
Adjusted Segment income $2,269 $2,672 $3,099 16.9% $3,814 $4,286 $4,926 $5,285 $5,323 11.4% % growth NA 17.8% 16.0% 23.06% 12.39% 14.92% 7.31% 0.71%
Adjusted EPS3 $2.60 $2.35 $3.17 10.4% $3.63 $4.27 $5.08 $5.60 $5.76 12.7% % growth NA -9.5% 34.8% 14.5% 17.4% 19.1% 10.1% 2.9%
Projection Period

Johnson Controls, Inc.Balance Sheet Projections($ in millions, 5 year forecast: 2015-2019) Operating Scenario : Base
Historical Period2012 2013 2014 2015 2016 2017 2018 2019
Cash and Cash Equivalents 265 1,055 409 968 1,488 2,124 2,311 2,801
Accounts Receivable, net 7,308 7,206 5,871 6,380 6,413 6,710 7,144 7,352
Inventories 2,343 2,325 2,477 2,401 2,251 2,333 2,327 2,322
Assets held for sale - 804 2,157 - - - - -
Other Current Assets 2,827 2,308 2,193 2,117 2,018 2,111 2,210 2,313
Total Current Assets $12,743 $13,698 $13,107 $11,866 $12,170 $13,279 $13,991 $14,788
Property, Plant and Equipment, net 6,440 6,585 6,314 6,787 7,256 8,103 8,931 9,336
Goodwill 6,982 6,589 7,127 7,127 7,127 7,127 7,127 7,127
Definite life Intangibles, net 632 683 1,092 997 907 821 738 661
Indefinite life Intangibles 315 316 547 547 547 547 547 547
Investment in Affiliates 948 1,024 1,018 1,018 1,018 1,018 1,018 1,018
Noncurrent Assets held for sale - - 630 - - - - -
Other Noncurrent Assets 2,894 2,623 2,969 2,969 2,969 2,969 2,969 2,969 Total Assets $30,954 $31,518 $32,804 $31,311 $31,994 $33,864 $35,321 $36,446
Short-term debt 323 119 183 - - - - -
Current portion of Long-term debt 424 819 140 915 773 405 295 500
Accounts Payable 6,114 6,318 5,270 5,264 4,848 5,026 5,305 5,611
Accrued Liabilities 1,090 1,215 1,124 1,180 1,106 1,146 1,189 1,236
Liabilities held for sale - 402 1,801 - - - - -
Other Current Liabilities 2,904 3,244 3,176 3,034 2,844 2,948 3,058 3,178
Total Current Liabilities 10,855 $12,117 $11,694 $10,393 $9,571 $9,525 $9,847 $10,524
Revolver - - - - - - - -
Long-term debt 5,321 4,560 6,357 5,442 5,904 6,813 7,328 7,566
Pension and postretirement benefit 1,248 750 865 865 865 865 865 865
Other long-term liabilities 1,504 1,360 2,132 2,132 2,132 2,132 2,132 2,132
Total liabilities: $18,928 $18,787 $21,048 $18,832 $18,473 $19,336 $20,172 $21,087
Total Stockholders' Equity 12,026 12,731 11,756 12,479 13,522 14,528 15,148 15,360
Total Liabilities and Equity $30,954 $31,518 $32,804 $31,311 $31,994 $33,864 $35,321 $36,446
Parity check (A = L+E) - - - - - - - -
Assumptions
Days Sales Outstanding (DSO) 65.7 63.5 50.0 55.0 58.0 58.0 59.0 58.0 Days Inventory Held (DIH) 25.2 25.0 25.7 26.0 26.0 26.0 25.0 24.0 Other Current Assets (% of sales) 7.0% 5.6% 5.1% 5.0% 5.0% 5.0% 5.0% 5.0%
Days Payable Outstanding (DPO) 65.7 67.8 54.6 57.0 56.0 56.0 57.0 58.0 Accrued Liabilities (% cost of sales) 3.2% 3.6% 3.2% 3.5% 3.5% 3.5% 3.5% 3.5%Other Current Liabilities (% cost of sales) 8.6% 9.5% 9.0% 9.0% 9.0% 9.0% 9.0% 9.0%
Notes:1. Effect of future Acquisitions and Divestitures are excluded from the forecast period. Hence Cash balance in years 2017-19 is on the higher side.
Projection Period
Current Assets
Current Liabilities
2. Movement in Other Comprehensive Income such as Foreign currency translation, Gain/Loss on Derivatives and Marketable securities are excluded from the forecast period.

Johnson Controls, Inc.Cash Flow Statement Projections($ in millions, 5 year forecast: 2015-2019) Operating Scenario : Base
Projection Period
2015 2016 2017 2018 2019
Operating Activities
Net income attributable to JCI 2,211 2,586 3,048 3,287 3,277
Net income attributable to Non-controlling interests 120 120 120 120 120
Net Income 2,331 2,706 3,168 3,407 3,397
Plus: Depreciation 882 943 1,053 1,161 1,214
Plus: Amortization 95 90 86 83 77
Plus: Stock-based compensation expense 103 137 144 135 163
(Inc.) / Dec. in Working Capital (449) (464) (151) (94) 165
Change in Other Long-Term Assets and Liabilities - - - - -
Cash Flow from Operating Activities 2,963 3,412 4,301 4,692 5,017
Investing Activities
Capital Expenditures (1,355) (1,413) (1,900) (1,989) (1,619)
Additions to Definite Life Intangibles - - - - -
Business Divestitures1 986 - - - -
Other Investing Activities - - - - -
Cash Flow from Investing Activities (369) ($1,413) ($1,900) ($1,989) ($1,619)
Cash Flow Available for Financing Activities 2,594 $1,999 $2,401 $2,703 $3,397
Financing Activities
Revolving Credit Facility - - - - -
Issuance of Long-Term Debt - 1,235 1,314 810 738
(Repayment) of Long-Term Debt (140) (915) (773) (405) (295)
Issuance of Short-Term Debt - - - - -
(Repayment) of Short-Term Debt (183) - - - -
Option proceeds 169 196 226 257 290
Dividends (681) (796) (1,091) (1,341) (1,501)
(Equity Repurchase) (1,200) (1,199) (1,441) (1,837) (2,138)
Cash Flow from Financing Activities ($2,035) ($1,479) ($1,765) ($2,516) ($2,907)
Excess / (Deficit) Cash for the Period $559 $520 $636 $187 $490
Beginning Cash Balance $409 $968 $1,488 $2,124 $2,311 Ending Cash Balance $968 $1,488 $2,124 $2,311 $2,801
Notes:
1. Assets held for sale are assumed be divested at Net Asset Value, hence no gain or loss recognized on the divestitures.

Johnson Controls, Inc.Working Capital Projections($ in millions, 5 year forecast: 2015-2019) Operating Scenario : Base
Historical Period
2012 2013 2014 2015 2016 2017 2018 2019
Sales 40,604 41,410 42,828 42,339 40,359 42,227 44,195 46,269
Cost of goods sold 33,943 33,993 35,246 33,709 31,601 32,757 33,973 35,308
Working capital balances
Accounts Receivable, net 7,308 7,206 5,871 6,380 6,413 6,710 7,144 7,352
Inventories 2,343 2,325 2,477 2,401 2,251 2,333 2,327 2,322
Other Current Assets 2,827 2,308 2,193 2,117 2,018 2,111 2,210 2,313
Total Non-Cash Current Assets: 12,478 $11,839 $10,541 $10,898 $10,682 $11,155 $11,681 $11,987
Accounts Payable 6,114 6,318 5,270 5,264 4,848 5,026 5,305 5,611
Accrued Liabilities 1,090 1,215 1,124 1,180 1,106 1,146 1,189 1,236
Other Current Liabilities 2,904 3,244 3,176 3,034 2,844 2,948 3,058 3,178
Total Non-Debt Current Liabilities 10,108 $10,777 9,570 9,478 $8,798 $9,120 $9,552 $10,024
Net working capital / (deficit) $2,370 $1,062 $971 $1,420 $1,884 $2,034 $2,129 $1,963
(Increase) / Decrease in Working Capital ($781) $1,308 $91 ($449) ($464) ($151) ($94) $165
Assumptions
Days Sales Outstanding (DSO) 65.7 63.5 50.0 55.0 58.0 58.0 59.0 58.0
Days Inventory Held (DIH) 25.2 25.0 25.7 26.0 26.0 26.0 25.0 24.0
Other Current Assets (% of sales) 7.0% 5.6% 5.1% 5.0% 5.0% 5.0% 5.0% 5.0%
Days Payable Outstanding (DPO) 65.7 67.8 54.6 57.0 56.0 56.0 57.0 58.0
Accrued Liabilities (% cost of sales) 3.2% 3.6% 3.2% 3.5% 3.5% 3.5% 3.5% 3.5%
Other Current Liabilities (% cost of sales) 8.6% 9.5% 9.0% 9.0% 9.0% 9.0% 9.0% 9.0%
Cash Conversion Cycle 25.1 20.6 21.1 24.0 28.0 28.0 27.0 24.0
Days change NA (4.5) 0.5 2.9 4.0 - (1.0) (3.0)
Numbers of days in the period 365
Projection Period
Current Liabilities
Current Assets

Johnson Controls, Inc.Other Long-Term Items Projections($ in millions, 5 year forecast: 2015-2019) Operating Scenario : Base
Historical Period2012 2013 2014 2015 2016 2017 2018 2019
Assets
Indefinite life intangibles 315 316 547 547 547 547 547 547
Goodwill 6,982 6,589 7,127 7,127 7,127 7,127 7,127 7,127
Investment in Affiliates 948 1,024 1,018 1,018 1,018 1,018 1,018 1,018
Other Noncurrent Assets - 2,623 2,969 2,969 2,969 2,969 2,969 2,969
Deferred Tax Asset - 1,349 1,834 1,834 1,834 1,834 1,834 1,834
Others - 1,274 1,135 1,135 1,135 1,135 1,135 1,135
Total Other Long-Term Assets: $8,245 $10,552 $11,661 11,661 $11,661 $11,661 $11,661 $11,661
(Increase) / Decrease in Other Assets: ($2,307) ($1,109) $0 $0 $0 $0 $0
Liabilities
Pension/postretirement benefit obligations 1,248 750 865 865 865 865 865 865
Other long-term liabilities 1,504 1,360 2,132 2,132 2,132 2,132 2,132 2,132
Total Non-Debt Current Liabilities $2,752 $2,110 $2,997 $2,997 $2,997 $2,997 $2,997 $2,997
Increase / (decrease) in other long-term liabilities: ($642) $887 $0 $0 $0 $0 $0
Change in Other Long-Term Assets and Liabilities ($2,949) ($222) $0 $0 $0 $0 $0
Held for saleNoncurrent Assets held for sale - - 630 - - - - -
Cash received on Divestiture $0 $0 $630 $0 $0 $0 $0 $0
Projection Period

Johnson Controls, Inc.Divestitures($ in millions, 5 year forecast: 2015-2019) Operating Scenario : Base
Historical Period2012 2013 2014 2015 2016 2017 2018 2019
Held for saleAssets held for sale - 804 2,157 ‐ ‐ ‐ ‐ ‐ Noncurrent Assets held for sale - - 630 - - - - - Liabilities held for sale - (402) (1,801) ‐ ‐ ‐ ‐ ‐
Cash received on Divestiture - 402 986 - - - - -
Notes:1. Assets held for sale are assumed be divested at Net Asset Value, hence no gain or loss recognized on the divestitures.
Projection Period

Johnson Controls, Inc.Capex Projections($ in millions, 5 year forecast: 2015-2019) Operating Scenario : Base
Historical Period
2012 2013 2014 2015 2016 2017 2018 2019 Step function
Sales 40,604 41,410 42,828 42,339 40,359 42,227 44,195 46,269
Capital Expenditures 1,831 1,377 1,199 1,355 1,413 1,900 1,989 1,619
Capital Expenditures as % of Sales 4.5% 3.3% 2.8% 3.2% 3.5% 4.5% 4.5% 3.5%
Depreciation expense 768 877 869 882 943 1,053 1,161 1,214
Depreciation as % of Capex 41.9% 63.7% 72.5% 65.1% 66.8% 55.4% 58.4% 74.9%
Depreciation as % of PP&E, net 11.9% 13.3% 13.8% 13.0% 13.0% 13.0% 13.0% 13.0% 0.0%
Beginning Net PP&E 6,314 6,787 7,256 8,103 8,931
Capital expenditures 1,355 1,413 1,900 1,989 1,619
(Depreciation expense) (882) (943) (1,053) (1,161) (1,214)
(Asset sales and write-offs) - - - - -
Ending Net PP&E $6,440 $6,585 $6,314 $6,787 $7,256 $8,103 $8,931 $9,336
Projection Period

Johnson Controls, Inc.Definite Life Intangibles Projections($ in millions, 5 year forecast: 2015-2019) Operating Scenario : Base
Historical Period
2012 2013 2014 2015 2016 2017 2018 2019 Step function
Sales 40,604 41,410 42,828 42,339 40,359 42,227 44,195 46,269 Additions to Definite Life Intangibles1
(60) 56 450 - - - - -
Additions as % of Sales (0.1%) 0.1% 1.1% 0.0% 0.0% 0.0% 0.0% 0.0% 0.0%
Amortization expense 56.00 75.00 86.00 95.0 90.0 86.0 83.0 77.0
Amortization as % of Intangibles, net 8.9% 11.0% 7.9% 9.5% 9.9% 10.5% 11.2% 11.6%
Beginning Definite Life Intangibles 1,092.0 997.0 907.0 821.0 738.0
Additions to Definite Life Intangibles - - - - -
(Amortization expense) (95.0) (90.0) (86.0) (83.0) (77.0)
(Write-offs) - - - - -
Ending Net Intangibles $632 $683 $1,092 $997 $907 $821 $738 $661
Notes:
1. Since the additions to Intangible Assets is primarily from business acquisitions, no further additions are considered in forecast period.
Projection Period

Johnson Controls, Inc.Shareholders' Equity Projections($ in millions, 5 year forecast: 2015-2019) Operating Scenario : Base
Historical Period2012 2013 2014 2015 2016 2017 2018 2019
Beginning Equity balance 11,756 12,479 13,522 14,528 15,148 Net income 2,331 2,706 3,168 3,407 3,397 Stock-based compensation expense 103 137 144 135 163 Repurchase of equity (1,200) (1,199) (1,441) (1,837) (2,138) Dividends (681) (796) (1,091) (1,341) (1,501) Option proceeds 169 196 226 257 290
Ending Equity balance $12,026 $12,731 $11,756 12,479 $13,522 $14,528 $15,148 $15,360Step function
Share repurchase assumptionsCurrent year EPS $1.72 $1.71 $1.80 $3.32 $3.96 $4.75 $5.25 $5.38Assumed P/E multiple 15.8x 24.6x 24.7x 15.7x 15.7x 15.7x 15.7x 15.7x 0.0xProjected share price $27.17 $42.13 $44.49 $52.07 $62.15 $74.65 $82.36 $84.52Shares repurchased - millions 3.706 9.467 25.622 23.050 19.300 19.300 22.300 25.300 3.000$ Amount Repurchased $102 $350 $1,249 $1,200 $1,199 $1,441 $1,837 $2,138 11.4%
New shares from exercised optionsNew shares issued from options - millions2 1.9 11.6 6.6 6.000 6.500 7.000 7.500 8.000 0.500Average strike price 28.22 30.22 32.22 34.22 36.22 2.000Option proceeds $40 $254 $186 $169 $196 $226 $257 $290
Dividend assumptionsDividends 477 513 568 681 796 1,091 1,341 1,501 Net income 1,184 1,178 1,215 2,211 2,586 3,048 3,287 3,277 Dividend payout ratio 40.3% 43.5% 46.7% 30.8% 30.8% 35.8% 40.8% 45.8% 5.0%Dividend per share 0.72 0.76 0.88 1.04 1.24 1.73 2.17 2.49 23.1%
% growth 5.6% 15.8% 18% 19% 40% 25% 15%
Share Repurchase ProgramOpening balance - 650 2,401 1,201 2,001 2,061 224 Authorized1 1,000 3,000 - 2,000 1,500 - 2,000 Repurchased (350) (1,249) (1,200) (1,199) (1,441) (1,837) (2,138)
Ending Balance $650 $2,401 $1,201 $2,001 $2,061 $224 $86
Unrecognized compensation cost - Nonvested Stock options Vesting period Unrecognized
Stock Options 1.3 15 12 3 - - - RSU's 2.0 38 19 19 - - - PSU's 1.8 24 13 11 - - -
$77 $44 $33 $0 $0 $0
Stock compensation plan
Opening balance 22.097 16.000 36.398 34.000 28.100 22.200 16.300 10.400 Terminated plan - (9.363) - - - - - - Common Stock reserved under plan - 37.000 - - - - - - Stock Options granted (5.018) (5.555) (0.789) (4.000) (4.000) (4.000) (4.000) (4.000) 0.000SAR's granted (0.670) (1.019) (0.048) (1.000) (1.000) (1.000) (1.000) (1.000) 0.000RSU's granted (0.409) (0.516) (1.234) (0.500) (0.500) (0.500) (0.500) (0.500) 0.000PSU's granted - (0.548) (0.327) (0.400) (0.400) (0.400) (0.400) (0.400) 0.000
16.000 36.000 34.000 28.100 22.200 16.300 10.400 4.500 Total Stock-based compensation expense $55 $91 $81 $103 $137 $144 $135 $163Deferred compensation expense
2015 Grant $60 $60 $60 - - 2016 Grant - $44 $44 $44 - 2017 Grant - - $41 $41 $412018 Grant - - - $50 $502019 Grant - - - - $73
Notes:1. Forecast period assumes additional allocation of resources to the share repurchase program.2. Excludes RSU's and PSU's
Projection Period

Johnson Controls, Inc.Shares Outstanding Projections($ in millions, 5 year forecast: 2015-2019) Operating Scenario : Base
Historical Period2012 2013 2014 2015 2016 2017 2018 2019
Beginning balance - Basic (Actual) 665.497 649.182 637.118 625.554 611.489 Shares issued from options 6.000 6.500 7.000 7.500 8.000 Shares issued from RSUs and PSUs 0.736 0.736 0.736 0.736 0.736 Shares repurchased (23.050) (19.300) (19.300) (22.300) (25.300)
Ending Equity balance - Basic (Actual) 682.308 684.536 665.497 649.182 637.118 625.554 611.489 594.925
Average basic shares 680.460 684.884 667.582 657.340 643.150 631.336 618.521 603.207 Effects of other Dilutive Securities 7.912 4.005 7.418 9.447 10.028 9.751 8.076 5.565
Average Diluted Shares 688.372 688.889 675.000 666.787 653.178 641.087 626.597 608.772
Dilutive Securities Outstanding Step functionStock Options1 22.728 20.728 18.228 15.228 11.728 7.728 RSU's1 1.954 1.718 1.483 1.247 1.011 0.776 PSU's1 0.794 0.930 1.020 1.080 1.120 1.147
25.476 23.376 20.730 17.555 13.859 9.650 Strike price
Stock Options 28.83 29.83 30.83 31.83 32.83 33.83 1.000RSU's 40.52 41.52 42.52 43.52 44.52 45.52 1.000PSU's 37.32 38.32 39.32 40.32 41.32 42.32 1.000
ProceedsStock Options 655 618 562 485 385 261 RSU's 79 71 63 54 45 35 PSU's 30 36 40 44 46 49
$764 $725 $665 $583 $476 $345
Projected share price $52.07 $62.15 $74.65 $82.36 $84.52Shares repurchased 13.929 10.702 7.804 5.783 4.085 Dilutive Securities 9.447 10.028 9.751 8.076 5.565
Notes:1. Average vesting/exercise period is assumed to be 3 years
Projection Period

Johnson Controls, Inc.Debt and Interest Projections($ in millions, 5 year forecast: 2015-2019) Operating Scenario : Base
Historical Period2012 2013 2014 2015 2016 2017 2018 2019
Cash flow available for Financing activities 2,594 1,999 2,401 2,703 3,397 Repurchase of equity (1,200) (1,199) (1,441) (1,837) (2,138) Dividends (681) (796) (1,091) (1,341) (1,501) Option proceeds 169 196 226 257 290 Plus: Beginning Cash balance 409 968 1,488 2,124 2,311 Less: Minimum Cash balance (212) (202) (211) (221) (231)
Cash available for debt repayment $1,079 $966 $1,372 $1,685 $2,127Long-Term Debt issuance - 1,235 1,314 810 738 Long-Term Debt (repayment) (140) (915) (773) (405) (295) Short-Term Debt issuance - - - - - Short-Term Debt (repayment) (183) - - - -
Excess cash available for revolver $756 $1,286 $1,913 $2,090 $2,569
RevolverBeginning balance - - - - - Issuance / (repayment) of revolver - - - - - Ending balance $0 $0 $0 $0 $0 $0 $0 $0
Short-term debtBeginning balance 183 - - - - Issuance - - - - - (Repayment) (183) - - - - Ending balance $323 $119 $183 $0 $0 $0 $0 $0
Long-term debtBeginning balance 6,497 6,357 6,677 7,218 7,623 Issuance LT debt refinancing option-------------> - 1,235 1,314 810 738 (Repayment) Repayment schedule as per 10K-----> (140) (915) (773) (405) (295) Ending balance $5,321 $4,560 $6,497 $6,357 $6,677 $7,218 $7,623 $8,066
Revolver Average balances $0 $0 $0 $0 $0LIBOR curve 0.62% 1.07% 1.41% 1.63% 1.79%Spread 3.20% 3.20% 3.20% 3.20% 3.20%Interest rate 3.82% 4.27% 4.61% 4.83% 4.99%Interest expense $0 $0 $0 $0 $0
Short-term debt Average balances $92 $0 $0 $0 $0LIBOR curve 0.62% 1.07% 1.41% 1.63% 1.79%Spread 3.18% 3.18% 3.18% 3.18% 3.18%Interest rate 3.80% 4.25% 4.59% 4.80% 4.97%Interest expense $3 $0 $0 $0 $0
Long-term debt Average balances $6,427 $6,517 $6,948 $7,421 $7,845Interest rate 4.38% 4.32% 4.15% 4.20% 4.38%Interest expense $282 $281 $288 $312 $344
Total interest expense $285.2 $281.4 $288.2 $311.7 $343.5
Cash balances Average balances 689 1,228 1,806 2,217 2,556 Interest rate 0.50% 0.50% 0.50% 0.50% 0.50%Interest (income) ($3) ($6) ($9) ($11) ($13)
Revolver balance for the periodEuro credit facility 437 152 152 84 - US$ credit facility 185 - - - - New credit facility - 440 468 565 680
$622 $593 $620 $649 $680
Other Committed credit lines $1,800 $1,696 $1,775 $1,857 $1,945
Exchange rateUS$/Euro 1.20006 US$/GBP 1.53255
Revolver (% sales) 1.47%Other (% sales) 4.20%
Projection Period

Johnson Controls, Inc.Valuation: Discounted Cash Flow ($ in millions, 5 year forecast: 2015-2019) Operating Scenario : Base
WACC Calculation Market Cap
Target Capital Structure Debt/ Efective Unlevered Shares outstanding 667.582
Debt-to-Total Capitalization 17.6% Company Equity Tax Rate Beta Quoted price4$46.76
Equity-to-Total Capitalization 82.4% Honeywell International Inc 1.32 46.1% 27.5% 0.99 Market Cap $31,216
Danaher Corp 1.17 12.8% 23.8% 1.07
Dover Corp 1.48 69.4% 26.9% 0.98
Cost of Debt Eaton Corp Plc 1.72 54.3% 6.0% 1.14Cost-of-Debt5 4.7% Emerson Electric Co 1.30 59.3% 34.8% 0.94
Tax Rate 25.0% Illinois Tool Works 1.29 96.5% 29.8% 0.77
After-tax Cost of Debt 3.5% Ingersoll-Rand Plc 1.36 55.7% 27.9% 0.97
3M Co 1.10 45.4% 29.0% 0.83
Textron Inc 1.76 86.8% 28.6% 1.09
Cost of Equity United Technologies Corp 1.13 56.3% 24.1% 0.79Risk-free Rate1
2.5%Market Risk Premium2
6.62% Mean 1.36 56.4% 0.98
Levered Beta 1.46
Size Premium 0.00%
Cost of Equity 12.2% JCI Relevered Beta
Mean Target Target
Unlevered Debt/ Marginal Relevered
WACC 10.7% Beta Equity Tax Rate Beta
Relevered Beta 0.98 21.4% 25.0% 1.14
WACC Sensitivity Analysis
Pre-tax Cost of Debt
10.7% 3.7% 4.2% 4.7% 5.2% 5.7%
2.6% 10.1% 10.1% 10.1% 10.2% 10.2%
7.6% 10.3% 10.3% 10.3% 10.3% 10.4%
17.6% 10.5% 10.6% 10.7% 10.7% 10.8%
27.6% 10.8% 10.9% 11.0% 11.1% 11.2%
37.6% 11.1% 11.2% 11.4% 11.5% 11.6%
Target Capital Structure Beta
Peer Average 33% Comparable Co's 1.14
Financial outlook 33% Bloomberg (Raw) 1.69
Bloomberg (Adjusted) 1.46
Notes:1. 30-year U.S. Treasury rates. Source: Bloomberg
2. Source: Ibbotson SBBI Valuation Yearbook
3. Five year levered Beta. Source: Bloomberg
4. Share price as of 01/09/2014
5. YTM of $450M 30 year Unsecured note issued on 06/10/2014
Comparable Companies Unlevered Beta
Levered Beta3
De
bt-
to-T
ota
l C
ap
ita
liza
tio
n

Johnson Controls, Inc.Assumptions: Income Statement ($ in millions, 5 year forecast: 2015-2019) Operating Scenario : Base
Historical Projection Period Historical Projection Period Historical Projection Period
Year 1 Year 2 Year 3 Year 4 Year 5 Year 1 Year 2 Year 3 Year 4 Year 5 Year 1 Year 2 Year 3 Year 4 Year 5
2014 2015 2016 2017 2018 2019 2014 2015 2016 2017 2018 2019 2014 2015 2016 2017 2018 2019
Income Statement Assumptions Building Efficiency Automotive Experience Power Solutions
Sales (% growth) 10.0% 6.5% 6.5% 6.5% 6.5% (5.5%) 2.5% 2.5% 2.5% 2.5% 9.0% 5.5% 5.5% 5.5% 5.5%
Base 1 10.0% 6.5% 6.5% 6.5% 6.5% (5.5%) 2.5% 2.5% 2.5% 2.5% 9.0% 5.5% 5.5% 5.5% 5.5%
Target 2 11.0% 7.5% 7.5% 7.5% 7.5% (4.0%) 3.5% 3.5% 3.5% 3.5% 10.0% 6.5% 6.5% 6.5% 6.5%
Upside 3 12.0% 9.0% 9.0% 9.0% 9.0% (3.0%) 4.5% 4.5% 4.5% 4.5% 11.0% 7.5% 7.5% 7.5% 7.5%
Downside 4 9.0% 5.5% 5.5% 5.5% 5.5% (6.5%) 1.5% 1.5% 1.5% 1.5% 8.0% 4.5% 4.5% 4.5% 4.5%
Sales $14,164 $16,012 $15,752 $16,776 $17,866 $19,027 $22,032 $19,099 $16,981 $17,405 $17,841 $18,287 $6,632 $7,229 $7,626 $8,046 $8,488 $8,955
Gross Margin (% sales) 18.1% 18.6% 19.1% 19.6% 20.1% 10.8% 11.3% 11.8% 12.3% 12.7% 37.4% 37.9% 38.4% 38.9% 39.4%
Base 1 18.1% 18.6% 19.1% 19.6% 20.1% 10.8% 11.3% 11.8% 12.3% 12.7% 37.4% 37.9% 38.4% 38.9% 39.4%
Target 2 19.0% 19.5% 20.0% 20.5% 21.0% 12.0% 12.5% 13.0% 13.5% 14.0% 38.5% 39.0% 39.5% 40.0% 40.5%
Upside 3 20.0% 20.5% 21.0% 21.5% 22.0% 13.0% 13.5% 14.0% 14.5% 15.0% 39.5% 40.0% 40.5% 41.0% 41.5%
Downside 4 17.0% 17.5% 18.0% 18.5% 19.0% 9.5% 10.0% 10.5% 11.0% 11.5% 36.0% 36.5% 37.0% 37.5% 38.0%
Cost of Goods Sold $13,120 $12,829 $13,578 $14,372 $15,211 $17,038 $15,066 $15,357 $15,654 $15,957 $4,529 $4,740 $4,960 $5,190 $5,431
DivestitureAutomotive Interiors (4,501) (2,532) - Global Workplace Solutions (4,079) (4,038) -
Acquisitions / JVADT 800 Hitachi JV 3,000
GWS & Interiors forecast adjustment $10,885 $11,974 $17,531 $16,567 $6,632
GWS & Interiors forecast adjustment (1.0%) (100.0%) (25.0%) (100.0%)
Combined Revenue $42,828 $42,339 $40,359 $42,227 $44,195 $46,269
Adj: Divestiture + Acquisition $35,048

Johnson Controls, Inc.Assumptions: Income Statement and Cash Flow Statement($ in millions, 5 year forecast: 2015-2019) Operating Scenario : Base
Projection Period
Year 1 Year 2 Year 3 Year 4 Year 5
2015 2016 2017 2018 2019
Income Statement Assumptions
SG&A (% sales) 10.5% 10.0% 9.5% 9.8% 10.8%
Base 1 10.5% 10.0% 9.5% 9.8% 10.8%
Target 2 11.0% 11.0% 10.5% 10.5% 11.5%
Upside 3 9.0% 8.5% 8.5% 9.0% 9.0%
Downside 4 11.5% 11.0% 10.5% 11.0% 12.0%
Other Expense / (Income) (% of sales) 0.5% 0.5% 0.5% 0.5% 0.5%
Base 1 0.5% 0.5% 0.5% 0.5% 0.5%
Target 2 0.8% 0.8% 0.8% 0.8% 0.8%
Upside 3 0.3% 0.3% 0.3% 0.3% 0.3%
Downside 4 1.0% 1.0% 1.0% 1.0% 1.0%
Cash Flow Statement Assumptions
Capital Expenditures (% sales) 3.2% 3.5% 4.5% 4.5% 3.5%
Base 1 3.2% 3.5% 4.5% 4.5% 3.5%
Target 2 4.0% 4.5% 5.0% 5.0% 4.0%
Upside 3 5.0% 5.5% 5.0% 4.0% 4.0%
Downside 4 2.0% 2.0% 1.8% 1.8% 1.8%

Johnson Controls, Inc.Assumptions: Balance Sheet($ in millions, 5 year forecast: 2015-2019) Operating Scenario Base
Projection Period
Year 1 Year 2 Year 3 Year 4 Year 5
2015 2016 2017 2018 2019
Current Assets
Days Sales Outstanding (DSO) 55.0 58.0 58.0 59.0 58.0
Base 1 55.0 58.0 58.0 59.0 58.0
Target 2 52.5 56.0 56.0 57.0 57.0
Upside 3 47.5 52.5 55.0 52.0 52.0
Downside 4 57.5 60.0 62.0 61.0 60.0
Days Inventory Held (DIH) 26.00 26.00 26.00 25.00 24.00
Base 1 26.00 26.00 26.00 25.00 24.00
Target 2 23.00 23.00 23.00 22.00 22.00
Upside 3 21.00 21.00 21.00 20.00 20.00
Downside 4 28.00 28.00 28.00 27.00 27.00
Prepaids and Other Current Assets (% sales) 5.0% 5.0% 5.0% 5.0% 5.0%
Base 1 5.0% 5.0% 5.0% 5.0% 5.0%
Target 2 4.0% 4.0% 4.0% 4.0% 4.0%
Upside 3 3.0% 3.0% 3.0% 3.0% 3.0%
Downside 4 7.0% 7.0% 7.0% 7.0% 7.0%
Minimum Cash balance (% sales) 0.5% 0.5% 0.5% 0.5% 0.5%
Base 1 0.5% 0.5% 0.5% 0.5% 0.5%
Target 2 1.0% 1.0% 1.0% 1.0% 1.0%
Upside 3 0.3% 0.3% 0.3% 0.3% 0.3%
Downside 4 1.5% 1.5% 1.5% 1.5% 1.5%
Current Liabilities
Days Payable Outstanding (DPO) 57.0 56.0 56.0 57.0 58.0
Base 1 57.0 56.0 56.0 57.0 58.0
Target 2 60.0 59.0 59.0 54.0 55.0
Upside 3 62.0 61.0 60.0 56.0 57.0
Downside 4 55.0 54.0 53.0 55.0 56.0
Accrued Liabilities (% sales) 3.5% 3.5% 3.5% 3.5% 3.5%
Base 1 3.5% 3.5% 3.5% 3.5% 3.5%
Target 2 3.0% 3.0% 3.0% 3.0% 3.0%
Upside 3 2.0% 2.5% 2.5% 2.5% 2.5%
Downside 4 4.0% 4.0% 4.0% 4.0% 4.0%
Other Current Liabilities (% sales) 9.0% 9.0% 9.0% 9.0% 9.0%
Base 1 9.0% 9.0% 9.0% 9.0% 9.0%
Target 2 8.0% 8.0% 8.0% 8.0% 8.0%
Upside 3 7.0% 7.0% 7.0% 7.0% 7.0%
Downside 4 10.0% 10.0% 10.0% 10.0% 10.0%
Debt RefinancingUnsecured Notes (% of retired debt) - % 135.0% 170.0% 200.0% 250.0%
Base 1 - % 135.0% 170.0% 200.0% 250.0%
Target 2 120.0% 130.0% 130.0% 120.0% 110.0%
Upside 3 80.0% 70.0% 70.0% 60.0% 50.0%
Downside 4 130.0% 140.0% 140.0% 130.0% 120.0%

Johnson Controls, Inc.Financial Outlook($ in millions, 5 year forecast: 2015-2019) Operating Scenario : Base
High Low Avg High Low Avg
Building Efficiency 9.00% 11.00% 10.00% 6.00% 7.00% 6.50%
Automotive Experience -5.00% -6.00% -5.50% 2.00% 3.00% 2.50%
2014 2013
Power Solutions 8.00% 10.00% 9.00% 5.00% 6.00% 5.50% GP Margin 15.5% 15.6%
Segment income %
Building Efficiency 6.6% 6.7%
Automotive Experience 4.0% 3.4%
Power Solutions 16.0% 15.8%
High Low Avg Delta High Low Avg Delta Annual 6.7% 6.5%
GP Margin %
Building Efficiency 15% 16%
Automotive Experience 9% 8%
Power Solutions 37% 38%
Building Efficiency 9.40% 9.60% 9.50% 2.93% 11.00% 12.00% 11.50% 2.00% 0.50%
Automotive Experience 5.40% 5.70% 5.55% 1.53% 7.00% 8.00% 7.50% 1.95% 0.49%
Power Solutions 16.40% 16.60% 16.50% 0.50% 18.00% 19.00% 18.50% 2.00% 0.50%
2015 2016 2017 2018 2019EPSJP Morgan $3.70 $4.35Wells Fargo $3.60 $4.00Consensus estimate $3.62 $4.14 $4.77 $5.50 $5.68Base case forecast $3.63 $4.27 $5.08 $5.60 $5.76
Variance 0.4% 3.0% 6.2% 1.8% 1.4%
PriceJP Morgan $52.00Wells Fargo $46.50
Consensus estimate
2015 Outlook Beyond Outlook
2015 Outlook Beyond Outlook