Embed Size (px)
Citation preview
Jason Franken
School of Agriculture
Western Illinois University
Coordination of the California Wine-Grape
Supply Chain
Quality is a key competitive factor in wine industry.
Several ways to organize/manage wine-grape supply chainOral agreements, formal written contracts, & common
ownership & management of neighboring stages in chain.
Organizational economics (Grossman & Hart, 1986; Williamson, 1975; 1979) Uncertainty & investments influence vertical
coordination!Applied to explain:
CA grower marketing (Goodhue, Heien, Lee, & Sumner, 2003)Spanish wineries procurement decisions
(Fernández-Olmos, Rosell-Martínez, & Espitia-Escuer, 2009)
Motivation
Investigate vertical coordination of 98 CA grape handlersHandler procurement
Informal & formal contracts & in-house productionContract complexity & number & type of contract
termsHandler marketing
Factor analytic measures (Hair, et al., 1995)Limit measurement errorConserve degrees of freedom in regression
analysis
Contributes a broader, more comprehensive perspectiveMarketing, procurement, & contract terms
Objective
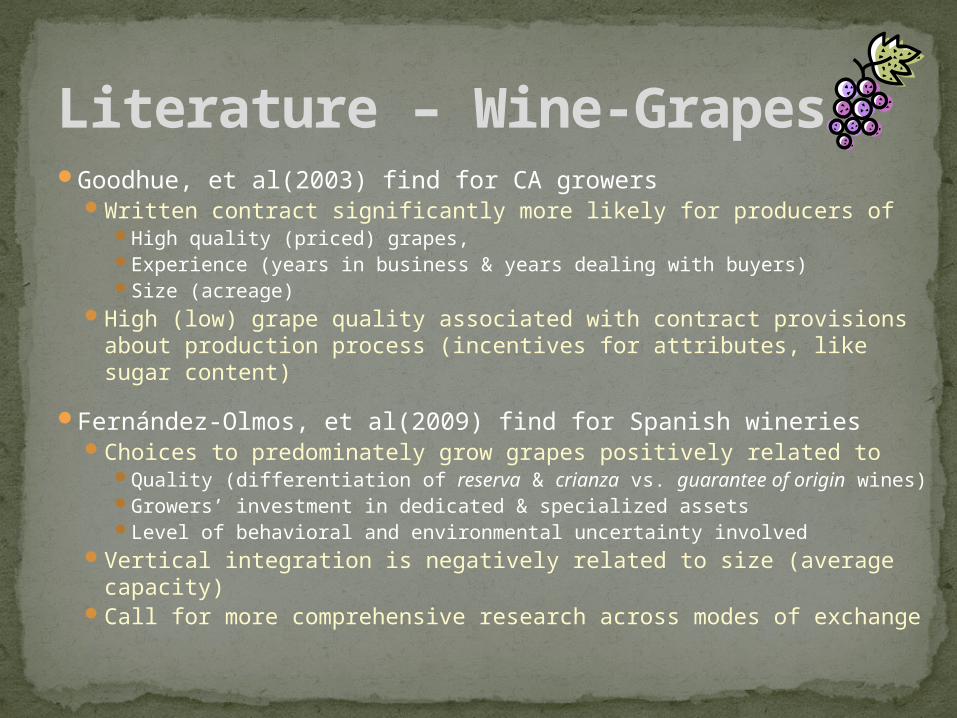
Goodhue, et al(2003) find for CA growers Written contract significantly more likely for producers of
High quality (priced) grapes, Experience (years in business & years dealing with buyers)Size (acreage)
High (low) grape quality associated with contract provisions about production process (incentives for attributes, like sugar content)
Fernández-Olmos, et al(2009) find for Spanish wineries Choices to predominately grow grapes positively related to
Quality (differentiation of reserva & crianza vs. guarantee of origin wines)
Growers’ investment in dedicated & specialized assetsLevel of behavioral and environmental uncertainty involved
Vertical integration is negatively related to size (average capacity) Call for more comprehensive research across modes of exchange
Literature – Wine-Grapes
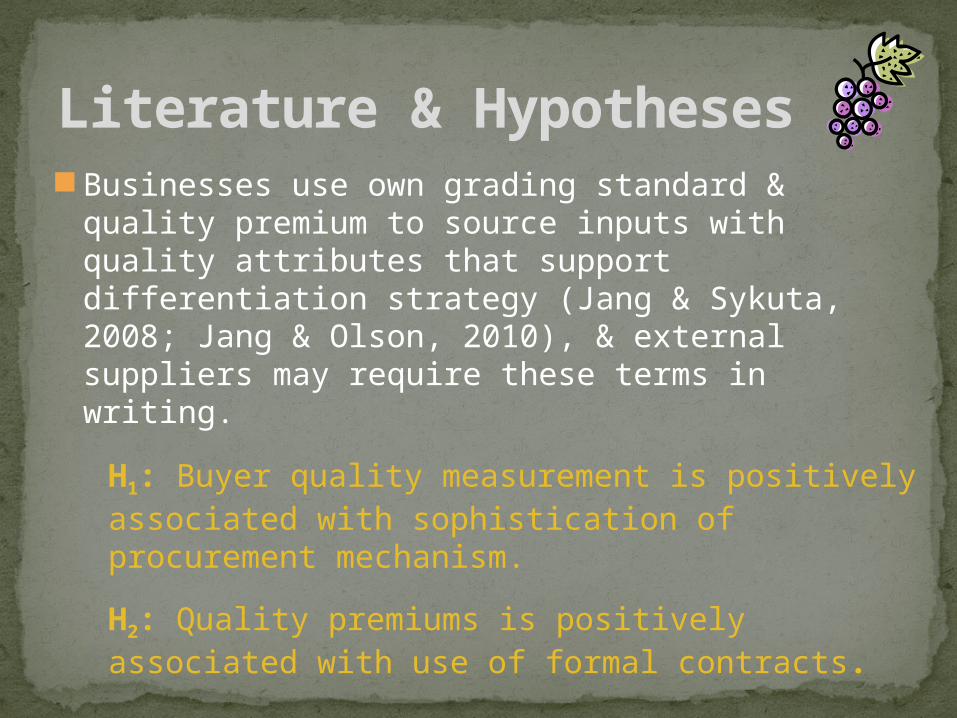
Businesses use own grading standard & quality premium to source inputs with quality attributes that support differentiation strategy (Jang & Sykuta, 2008; Jang & Olson, 2010), & external suppliers may require these terms in writing.
H1: Buyer quality measurement is positively associated with sophistication of procurement mechanism.
H2: Quality premiums is positively associated with use of formal contracts.
Literature & Hypotheses
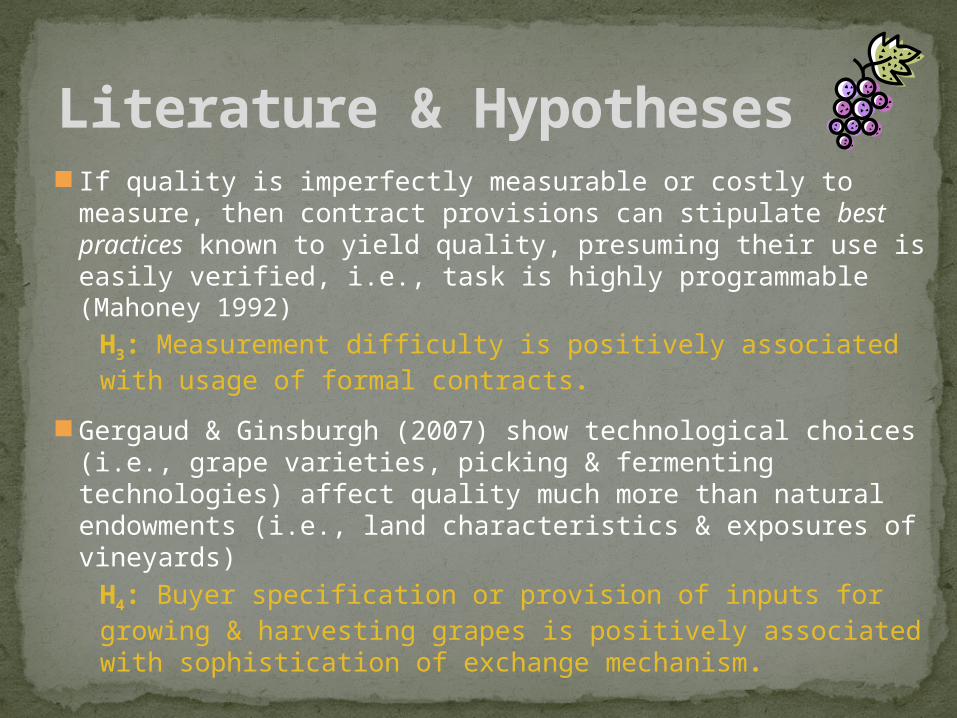
If quality is imperfectly measurable or costly to measure, then contract provisions can stipulate best practices known to yield quality, presuming their use is easily verified, i.e., task is highly programmable (Mahoney 1992)
H3: Measurement difficulty is positively associated with usage of formal contracts.
Gergaud & Ginsburgh (2007) show technological choices (i.e., grape varieties, picking & fermenting technologies) affect quality much more than natural endowments (i.e., land characteristics & exposures of vineyards)
H4: Buyer specification or provision of inputs for growing & harvesting grapes is positively associated with sophistication of exchange mechanism.
Literature & Hypotheses
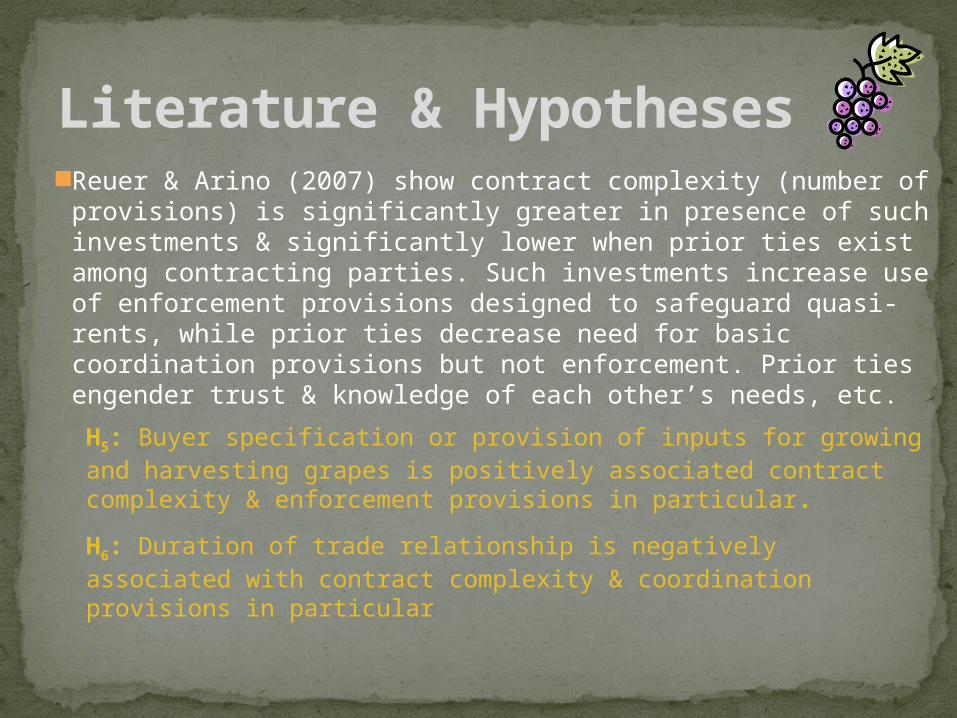
Reuer & Arino (2007) show contract complexity (number of provisions) is significantly greater in presence of such investments & significantly lower when prior ties exist among contracting parties. Such investments increase use of enforcement provisions designed to safeguard quasi-rents, while prior ties decrease need for basic coordination provisions but not enforcement. Prior ties engender trust & knowledge of each other’s needs, etc.
H5: Buyer specification or provision of inputs for growing and harvesting grapes is positively associated contract complexity & enforcement provisions in particular.
H6: Duration of trade relationship is negatively associated with contract complexity & coordination provisions in particular
Literature & Hypotheses
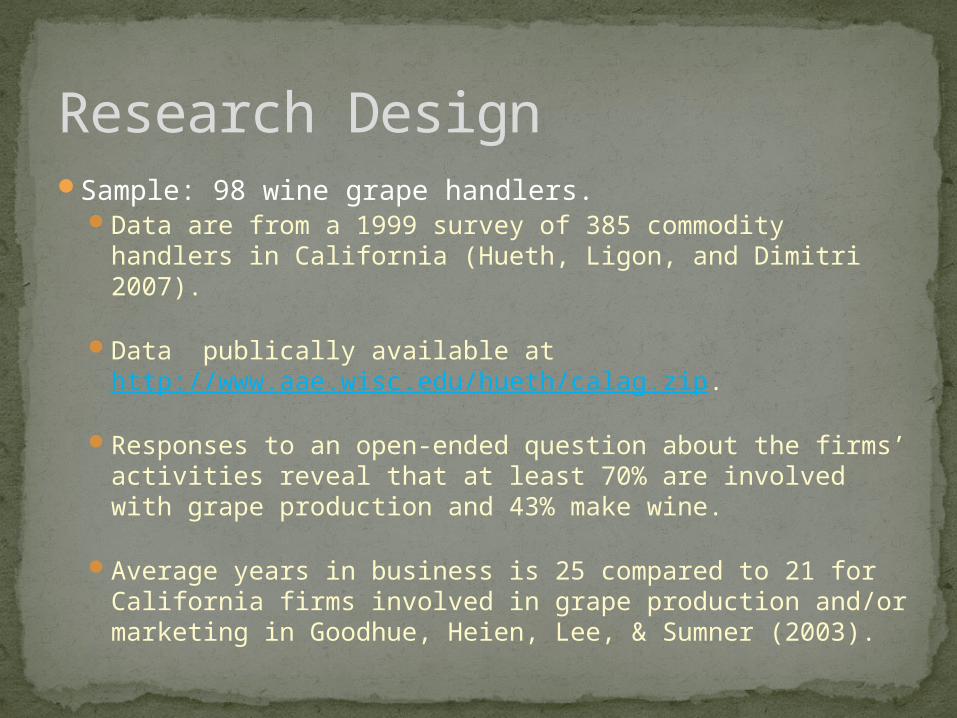
Research DesignSample: 98 wine grape handlers.
Data are from a 1999 survey of 385 commodity handlers in California (Hueth, Ligon, and Dimitri 2007).
Data publically available at http://www.aae.wisc.edu/hueth/calag.zip.
Responses to an open-ended question about the firms’ activities reveal that at least 70% are involved with grape production and 43% make wine.
Average years in business is 25 compared to 21 for California firms involved in grape production and/or marketing in Goodhue, Heien, Lee, & Sumner (2003).
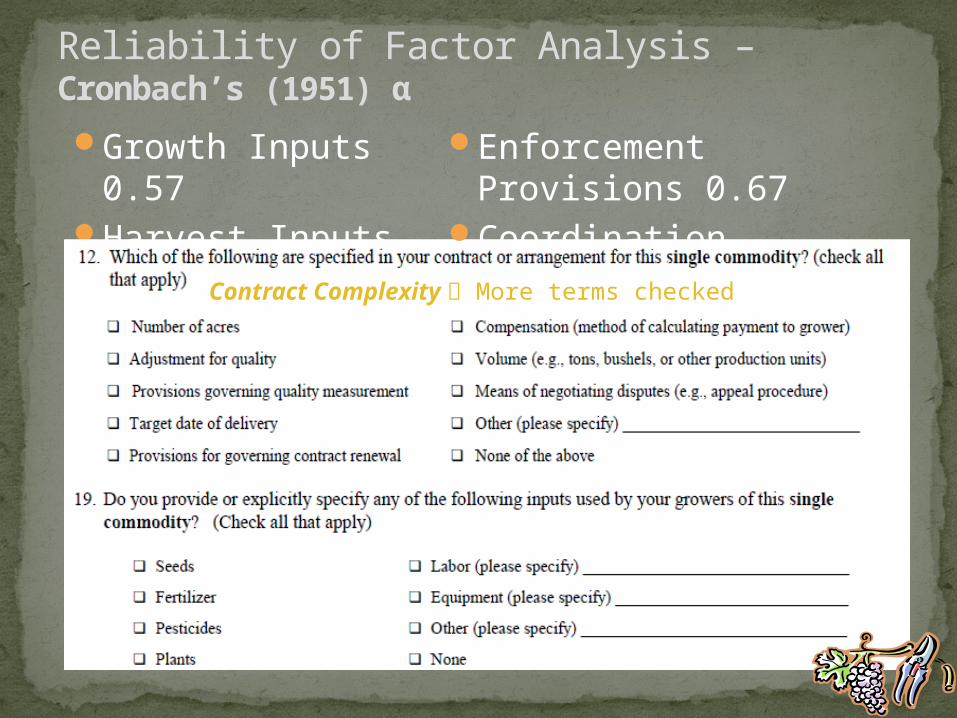
Growth Inputs 0.57Harvest Inputs 0.70
Reliability of Factor Analysis – Cronbach’s (1951) α
Enforcement Provisions 0.67
Coordination Provisions 0.39Contract Complexity More terms
checked
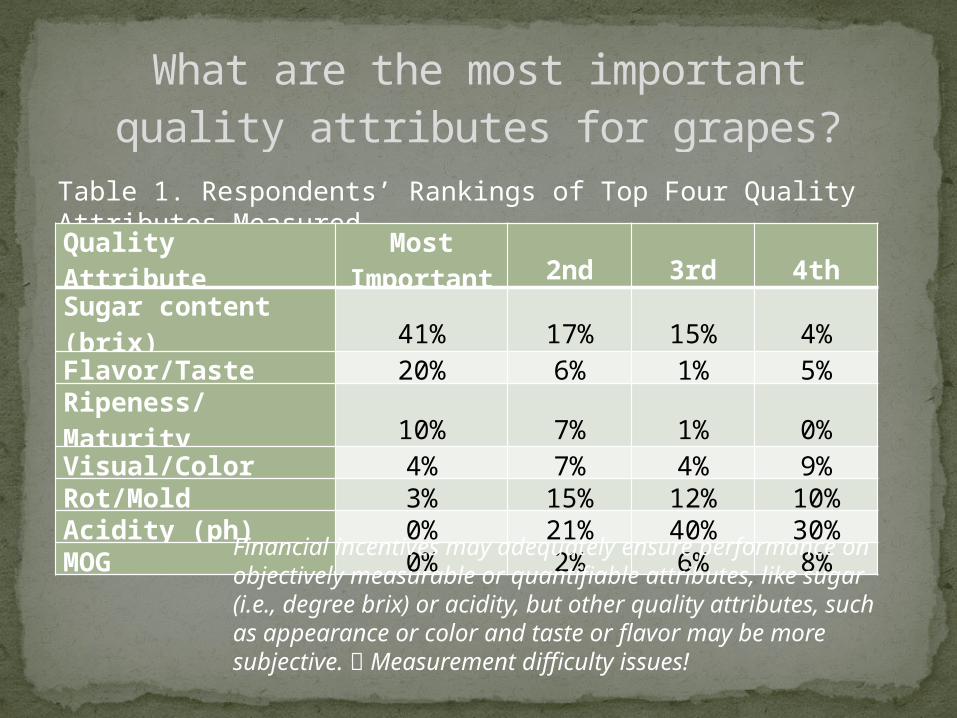
Table 1. Respondents’ Rankings of Top Four Quality Attributes Measured.
N = 98.
Quality AttributeMost
Important 2nd 3rd 4thSugar content (brix) 41% 17% 15% 4%Flavor/Taste 20% 6% 1% 5%Ripeness/Maturity 10% 7% 1% 0%Visual/Color 4% 7% 4% 9%Rot/Mold 3% 15% 12% 10%Acidity (ph) 0% 21% 40% 30%MOG 0% 2% 6% 8%
What are the most important quality attributes for grapes?
Financial incentives may adequately ensure performance on objectively measurable or quantifiable attributes, like sugar (i.e., degree brix) or acidity, but other quality attributes, such as appearance or color and taste or flavor may be more subjective. Measurement difficulty issues!
11
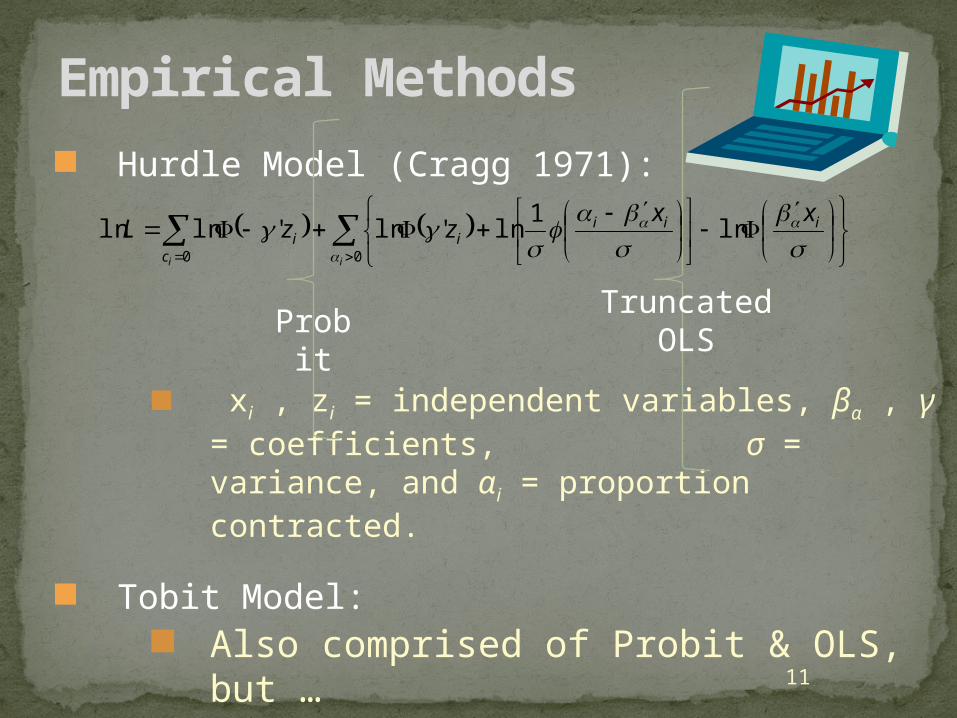
Empirical Methods Hurdle Model (Cragg 1971):
xi , zi = independent variables, βα , γ = coefficients, σ = variance, and αi = proportion contracted.
Tobit Model: Also comprised of Probit & OLS, but … β is same for adoption & proportion
decisions.
ProbitTruncated OLS
00
ln1
ln'ln'lnlnii
iiii
ci
xxzzL
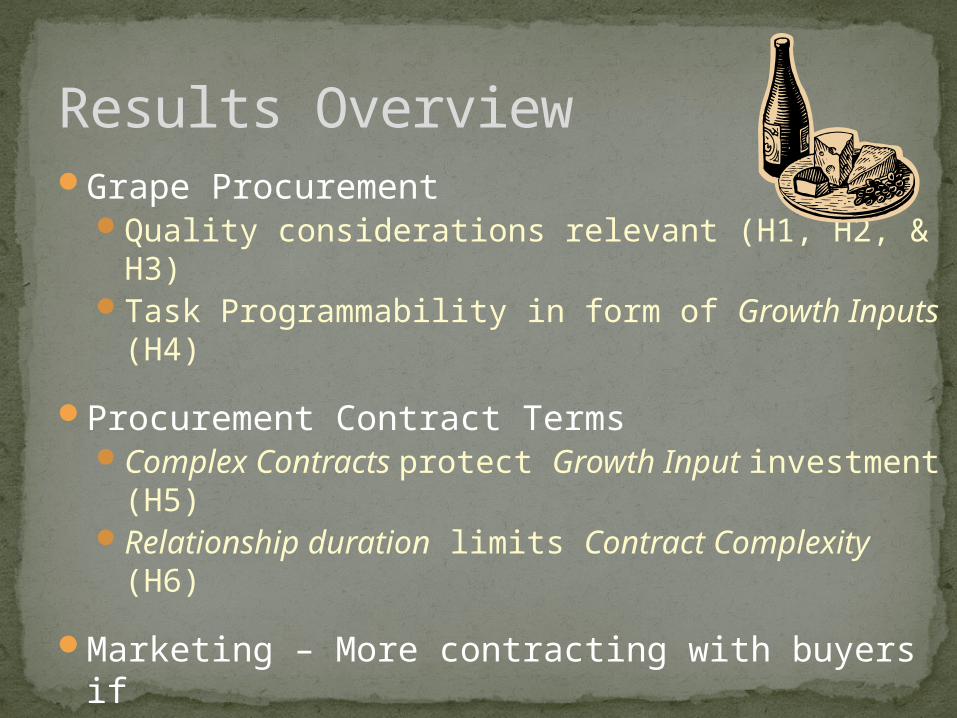
Grape ProcurementQuality considerations relevant (H1, H2, & H3)Task Programmability in form of Growth Inputs
(H4)
Procurement Contract TermsComplex Contracts protect Growth Input
investment (H5)Relationship duration limits Contract Complexity
(H6)
Marketing – More contracting with buyers ifSell to retailers (e.g., supermarkets) or wholesalers (e.g.,
brokers, processors, shippers)Contract with growers & higher probability if quality premium
Results Overview
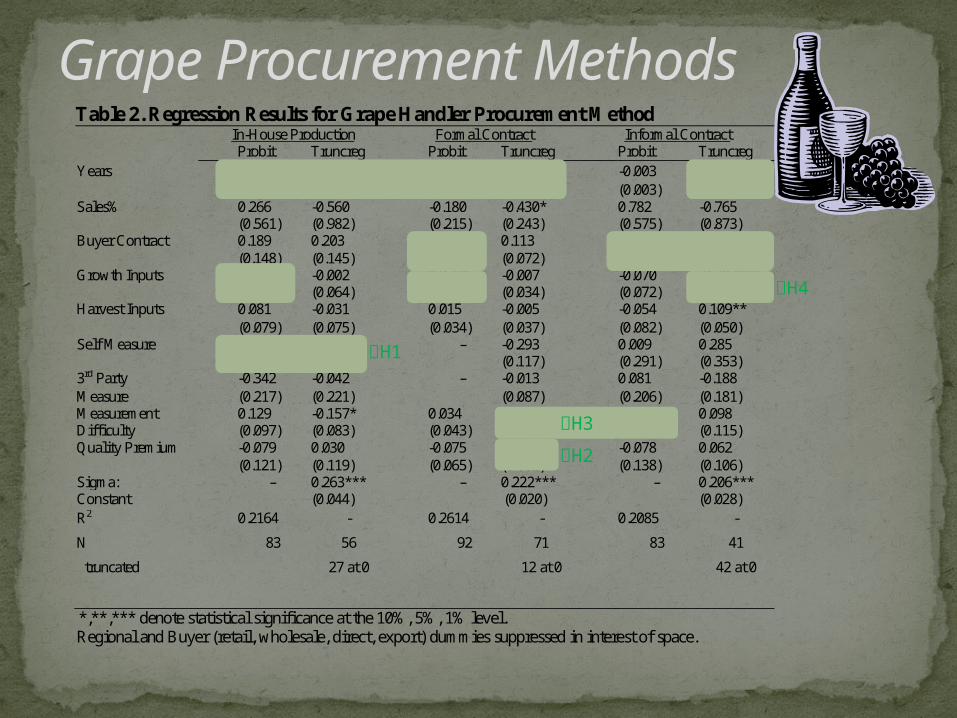
Grape Procurement Methods Table 2. Regression Results for Grape Handler Procurement Method
In-House Production Formal Contract Informal Contract
Probit Truncreg
Probit Truncreg
Probit Truncreg Years
0.011** 0.008***
-0.002* -0.003**
-0.003 0.010**
(0.004) (0.003) (0.001) (0.002) (0.003) (0.004) Sales% 0.266 -0.560 -0.180 -0.430* 0.782 -0.765 (0.561) (0.982) (0.215) (0.243) (0.575) (0.873) Buyer Contract 0.189 0.203 0.205*** 0.113 -0.433** -0.754*** (0.148) (0.145) (0.080) (0.072) (0.172) (0.154) Growth Inputs 0.181** -0.002 0.073* -0.007 -0.070 -0.307*** (0.077) (0.064) (0.039) (0.034) (0.072) (0.083) Harvest Inputs 0.081 -0.031 0.015 -0.005 -0.054 0.109** (0.079) (0.075) (0.034) (0.037) (0.082) (0.050) Self Measure 0.539** 0.842** – -0.293 0.009 0.285 (0.253) (0.398) (0.117) (0.291) (0.353) 3rd Party -0.342 -0.042 – -0.013 0.081 -0.188 Measure (0.217) (0.221) (0.087) (0.206) (0.181) Measurement 0.129 -0.157* 0.034 0.125*** -0.276** 0.098 Difficulty (0.097) (0.083) (0.043) (0.040) (0.110) (0.115) Quality Premium -0.079 0.030 -0.075 0.130** -0.078 0.062 (0.121) (0.119) (0.065) (0.062) (0.138) (0.106) Sigma: – 0.263*** – 0.222*** – 0.206*** Constant (0.044) (0.020) (0.028) R2 0.2164 - 0.2614 - 0.2085 -
N 83 56 92 71 83 41
truncated 27 at 0 12 at 0 42 at 0
*,**,*** denote statistical significance at the 10%, 5%, 1% level. Regional and Buyer (retail, wholesale, direct, export) dummies suppressed in interest of space.
H1
H2
H3
H4
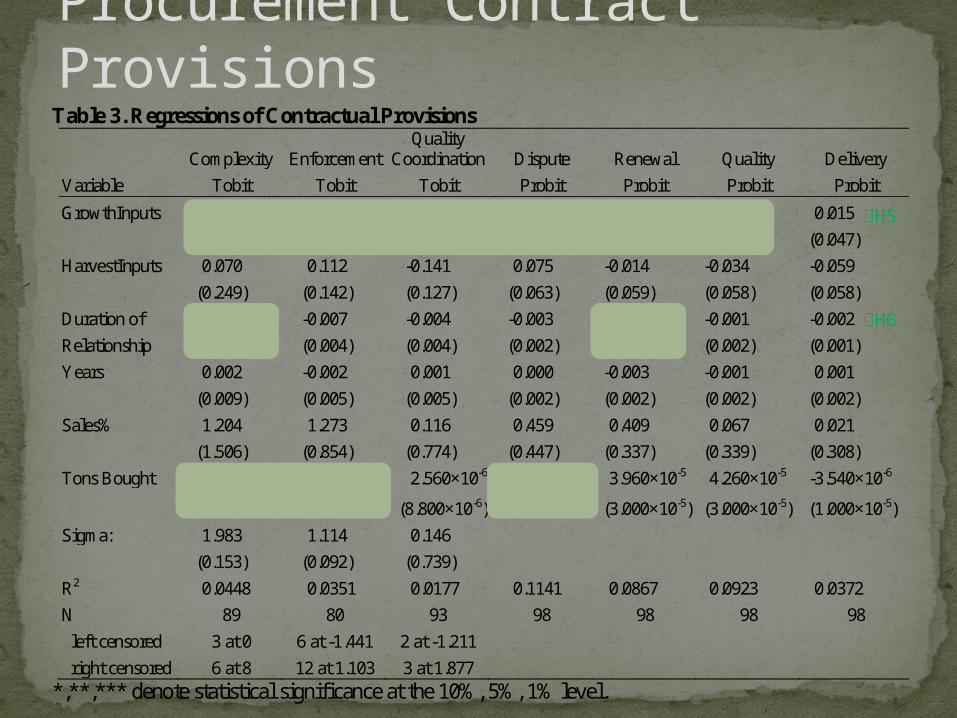
Procurement Contract Provisions
Table 3. Regressions of Contractual Provisions
Complexity Enforcement
Quality Coordination Dispute Renewal Quality Delivery
Variable Tobit Tobit Tobit Probit Probit Probit Probit
GrowthInputs 0.800*** 0.282** 0.210* 0.133** 0.126** 0.169** 0.015
(0.247) (0.140) (0.125) (0.065) (0.064) (0.067) (0.047)
HarvestInputs 0.070 0.112 -0.141 0.075 -0.014 -0.034 -0.059
(0.249) (0.142) (0.127) (0.063) (0.059) (0.058) (0.058)
Duration of -0.019** -0.007 -0.004 -0.003 -0.003* -0.001 -0.002
Relationship (0.008) (0.004) (0.004) (0.002) (0.002) (0.002) (0.001)
Years 0.002 -0.002 0.001 0.000 -0.003 -0.001 0.001
(0.009) (0.005) (0.005) (0.002) (0.002) (0.002) (0.002)
Sales% 1.204 1.273 0.116 0.459 0.409 0.067 0.021
(1.506) (0.854) (0.774) (0.447) (0.337) (0.339) (0.308)
Tons Bought 3.390×10-5* 1.690×10-5* 2.560×10-6 7.130×10⁻⁵** 3.960×10⁻⁵ 4.260×10⁻⁵ -3.540×10⁻⁶
(1.710×10⁻⁵) (9.700×10⁻⁶) (8.800×10⁻⁶) (3.000×10⁻⁵) (3.000×10⁻⁵) (3.000×10⁻⁵) (1.000×10⁻⁵)
Sigma: 1.983 1.114 0.146
(0.153) (0.092) (0.739)
R2 0.0448 0.0351 0.0177 0.1141 0.0867 0.0923 0.0372
N 89 80 93 98 98 98 98
left censored 3 at 0 6 at -1.441 2 at -1.211 right censored 6 at 8 12 at 1.103 3 at 1.877 *,**,*** denote statistical significance at the 10%, 5%, 1% level.
H5
H6
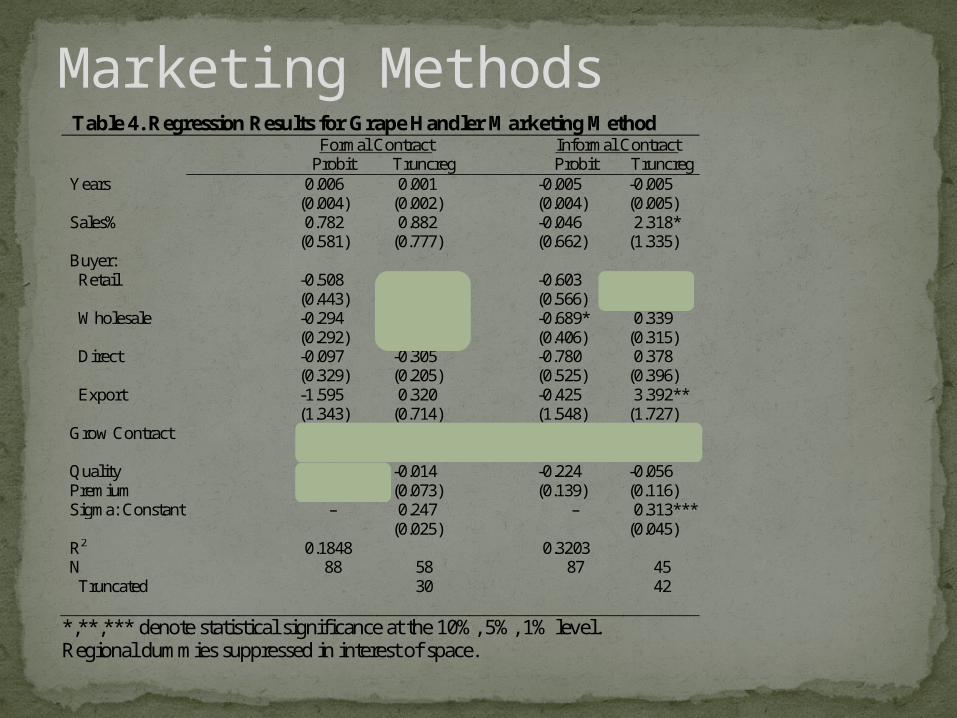
Marketing Methods Table 4. Regression Results for Grape Handler Marketing Method Formal Contract Informal Contract Probit Truncreg Probit Truncreg Years
0.006 0.001
-0.005 -0.005
(0.004) (0.002)
(0.004) (0.005) Sales%
0.782 0.882
-0.046 2.318*
(0.581) (0.777)
(0.662) (1.335) Buyer:
Retail
-0.508 0.469*
-0.603 0.862*
(0.443) (0.270)
(0.566) (0.490)
Wholesale
-0.294 0.427**
-0.689* 0.339
(0.292) (0.180)
(0.406) (0.315)
Direct
-0.097 -0.305
-0.780 0.378
(0.329) (0.205)
(0.525) (0.396)
Export
-1.595 0.320
-0.425 3.392**
(1.343) (0.714)
(1.548) (1.727)
Grow Contract
0.544*** 0.411***
-1.296*** -0.468**
(0.195) (0.161)
(0.303) (0.212)
Quality
0.204* -0.014
-0.224 -0.056 Premium
(0.115) (0.073)
(0.139) (0.116)
Sigma: Constant
– 0.247
– 0.313***
(0.025)
(0.045)
R2 0.1848 0.3203 N 88 58 87 45 Truncated 30 42
*,**,*** denote statistical significance at the 10%, 5%, 1% level. Regional dummies suppressed in interest of space.
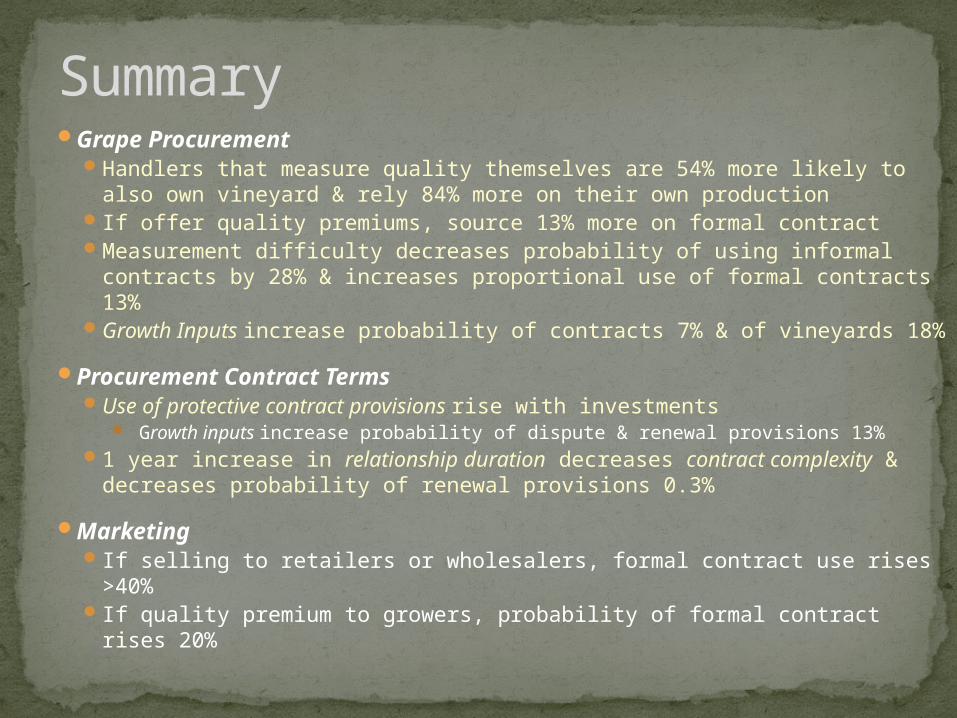
Grape Procurement Handlers that measure quality themselves are 54% more likely to
also own vineyard & rely 84% more on their own production If offer quality premiums, source 13% more on formal contract Measurement difficulty decreases probability of using informal
contracts by 28% & increases proportional use of formal contracts 13%
Growth Inputs increase probability of contracts 7% & of vineyards 18%
Procurement Contract Terms Use of protective contract provisions rise with investments
Growth inputs increase probability of dispute & renewal provisions 13% 1 year increase in relationship duration decreases contract
complexity & decreases probability of renewal provisions 0.3%
Marketing If selling to retailers or wholesalers, formal contract use rises >40% If quality premium to growers, probability of formal contract rises 20%
Summary
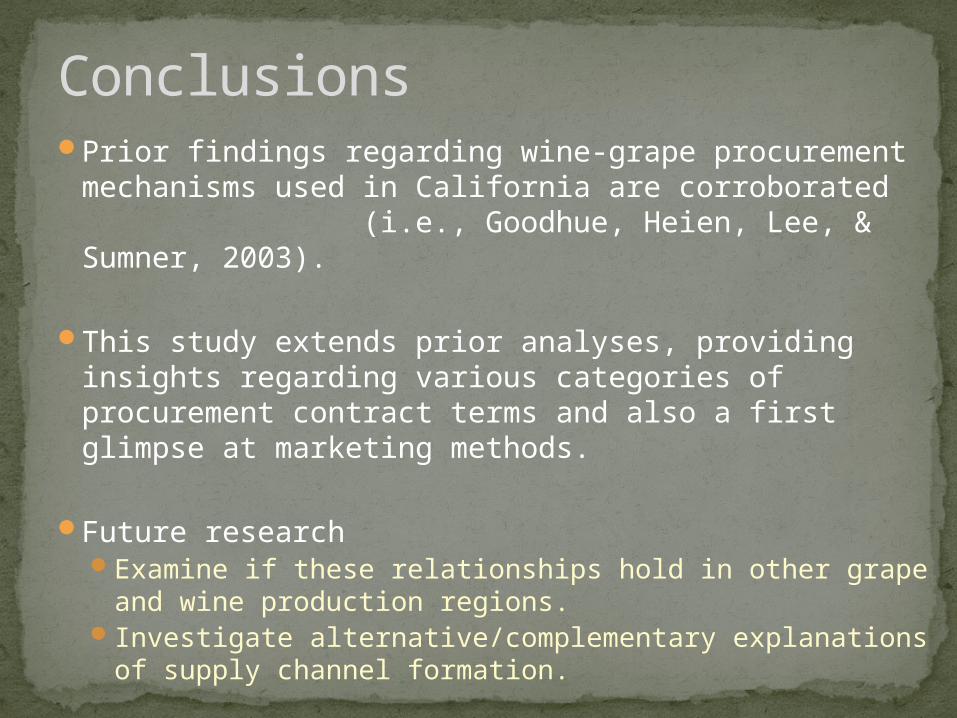
Prior findings regarding wine-grape procurement mechanisms used in California are corroborated (i.e., Goodhue, Heien, Lee, & Sumner, 2003).
This study extends prior analyses, providing insights regarding various categories of procurement contract terms and also a first glimpse at marketing methods.
Future researchExamine if these relationships hold in other grape and
wine production regions.Investigate alternative/complementary explanations of
supply channel formation.
Conclusions

Any Questions?
19
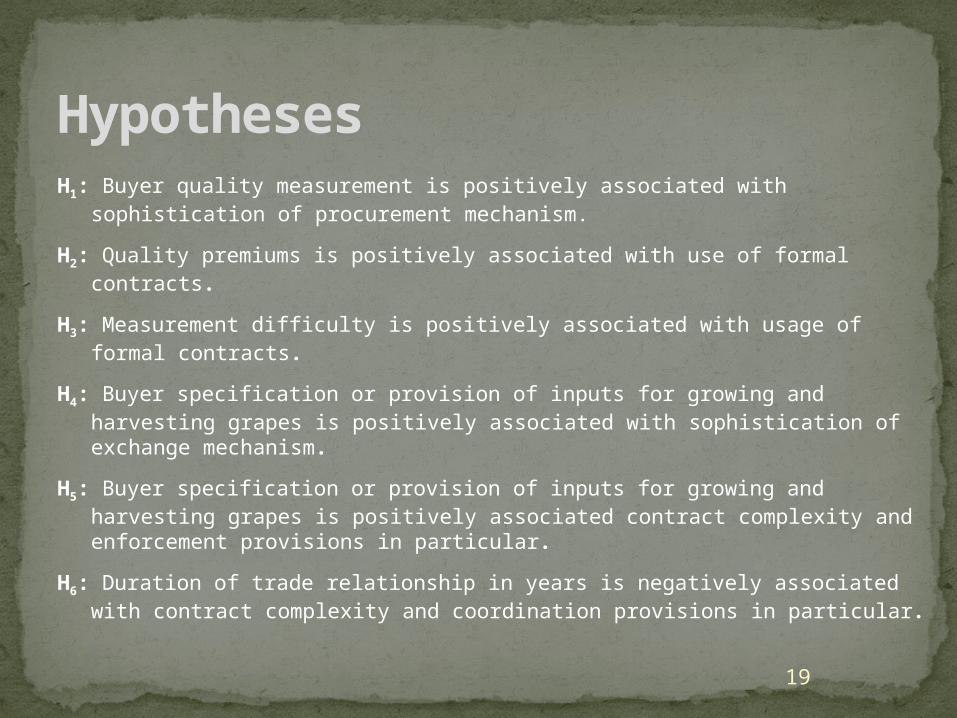
HypothesesH1: Buyer quality measurement is positively associated with sophistication of
procurement mechanism.
H2: Quality premiums is positively associated with use of formal contracts.
H3: Measurement difficulty is positively associated with usage of formal contracts.
H4: Buyer specification or provision of inputs for growing and harvesting grapes is positively associated with sophistication of exchange mechanism.
H5: Buyer specification or provision of inputs for growing and harvesting grapes is positively associated contract complexity and enforcement provisions in particular.
H6: Duration of trade relationship in years is negatively associated with contract complexity and coordination provisions in particular.
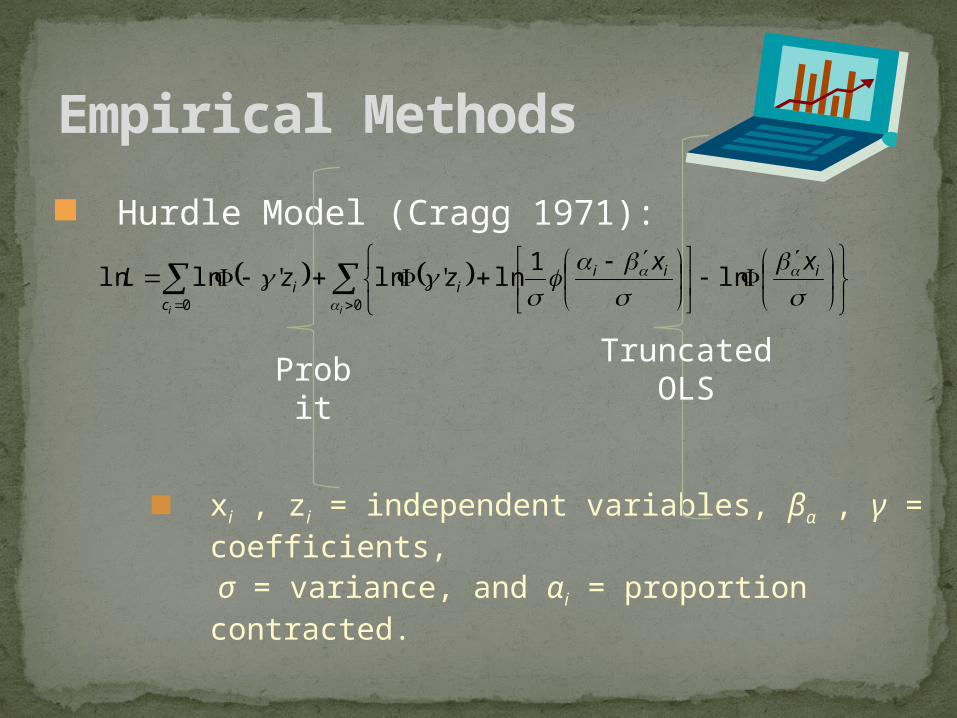
Empirical Methods
Hurdle Model (Cragg 1971):
xi , zi = independent variables, βα , γ = coefficients,
σ = variance, and αi = proportion contracted.
ProbitTruncated OLS
00
ln1
ln'ln'lnlnii
iiii
ci
xxzzL
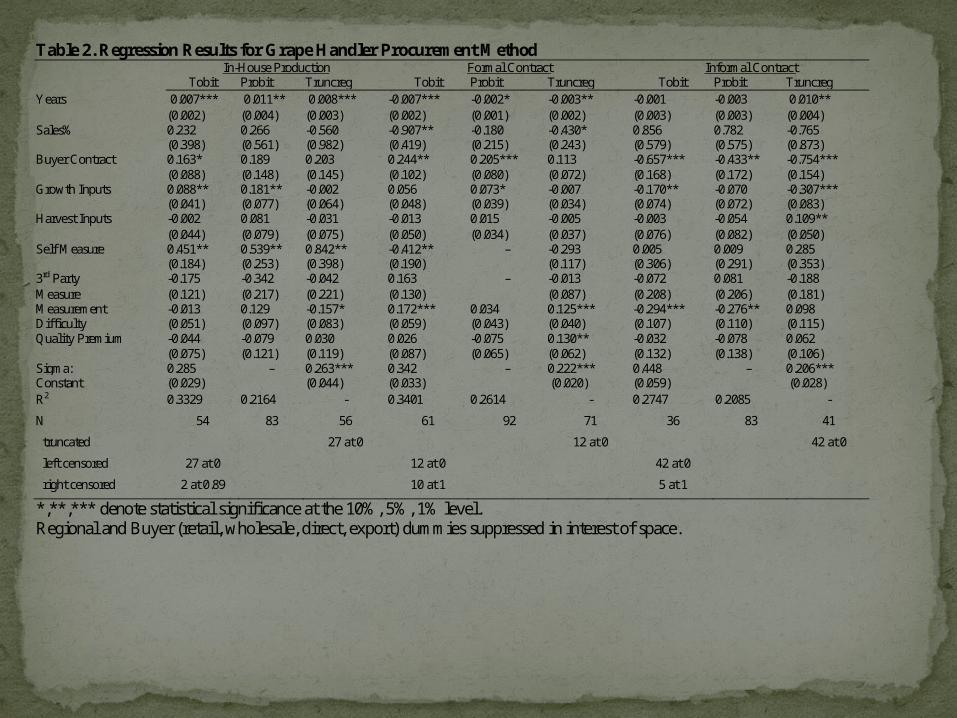
Table 2. Regression Results for Grape Handler Procurement Method
In-House Production Formal Contract Informal Contract
Tobit Probit Truncreg Tobit Probit Truncreg Tobit Probit Truncreg Years 0.007*** 0.011** 0.008*** -0.007*** -0.002* -0.003** -0.001 -0.003 0.010** (0.002) (0.004) (0.003) (0.002) (0.001) (0.002) (0.003) (0.003) (0.004) Sales% 0.232 0.266 -0.560 -0.907** -0.180 -0.430* 0.856 0.782 -0.765 (0.398) (0.561) (0.982) (0.419) (0.215) (0.243) (0.579) (0.575) (0.873) Buyer Contract 0.163* 0.189 0.203 0.244** 0.205*** 0.113 -0.657*** -0.433** -0.754*** (0.088) (0.148) (0.145) (0.102) (0.080) (0.072) (0.168) (0.172) (0.154) Growth Inputs 0.088** 0.181** -0.002 0.056 0.073* -0.007 -0.170** -0.070 -0.307*** (0.041) (0.077) (0.064) (0.048) (0.039) (0.034) (0.074) (0.072) (0.083) Harvest Inputs -0.002 0.081 -0.031 -0.013 0.015 -0.005 -0.003 -0.054 0.109** (0.044) (0.079) (0.075) (0.050) (0.034) (0.037) (0.076) (0.082) (0.050) Self Measure 0.451** 0.539** 0.842** -0.412** – -0.293 0.005 0.009 0.285 (0.184) (0.253) (0.398) (0.190) (0.117) (0.306) (0.291) (0.353) 3rd Party -0.175 -0.342 -0.042 0.163 – -0.013 -0.072 0.081 -0.188 Measure (0.121) (0.217) (0.221) (0.130) (0.087) (0.208) (0.206) (0.181) Measurement -0.013 0.129 -0.157* 0.172*** 0.034 0.125*** -0.294*** -0.276** 0.098 Difficulty (0.051) (0.097) (0.083) (0.059) (0.043) (0.040) (0.107) (0.110) (0.115) Quality Premium -0.044 -0.079 0.030 0.026 -0.075 0.130** -0.032 -0.078 0.062 (0.075) (0.121) (0.119) (0.087) (0.065) (0.062) (0.132) (0.138) (0.106) Sigma: 0.285 – 0.263*** 0.342 – 0.222*** 0.448 – 0.206*** Constant (0.029) (0.044) (0.033) (0.020) (0.059) (0.028) R2 0.3329 0.2164 - 0.3401 0.2614 - 0.2747 0.2085 -
N 54 83 56 61 92 71 36 83 41
truncated 27 at 0 12 at 0 42 at 0
left censored 27 at 0 12 at 0 42 at 0
right censored 2 at 0.89 10 at 1 5 at 1
*,**,*** denote statistical significance at the 10%, 5%, 1% level. Regional and Buyer (retail, wholesale, direct, export) dummies suppressed in interest of space.