Embed Size (px)
Citation preview
P/N:0302-1899A June.2004
Operation Manual
JASCO
Fourier Transform Infrared Spectrometer
FT/IR-4000 and 6000 series
i
Safety Considerations To ensure operation safety, this instrument must be operated correctly and maintained according to a regular schedule. Carefully read to fully understand all safety precautions in this manual before operating the instrument. Please take a moment to understand what the signal words WARNING!, CAUTION, and Note mean in this manual.
(1) Safety symbols
Instruction manual symbol. If the product is marked with this symbol, refer to the instrument manuals to protect the instrument against damage.
WARNING! A WARNING! indicates a potentially hazardous situation which, if not
avoided, could result in serious injury or even death. CAUTION A CAUTION indicates a potentially hazardous situation which, if not avoided,
may result in minor or moderate injury. It may also be used to alert against damaging the equipment.
Do not proceed beyond a WARNING! or CAUTION notice until you understand the hazardous conditions and have taken the appropriate steps.
Note A Note provides additional information to help the operator achieve optimal
instrument performance.
ii
Preface This instruction manual serves as a guide for using this instrument. It is intended to instruct first-time users on how to properly use the instrument, and to serve as a reference for experienced users. Before using the instrument, read this instruction manual carefully, and make sure you fully understand its contents. This manual should be easily accessible to the operator at all times during instrument operation. When not using the instrument, keep this manual stored in a safe place. Should this instruction manual be lost, order a replacement from your local JASCO distributor.
iii
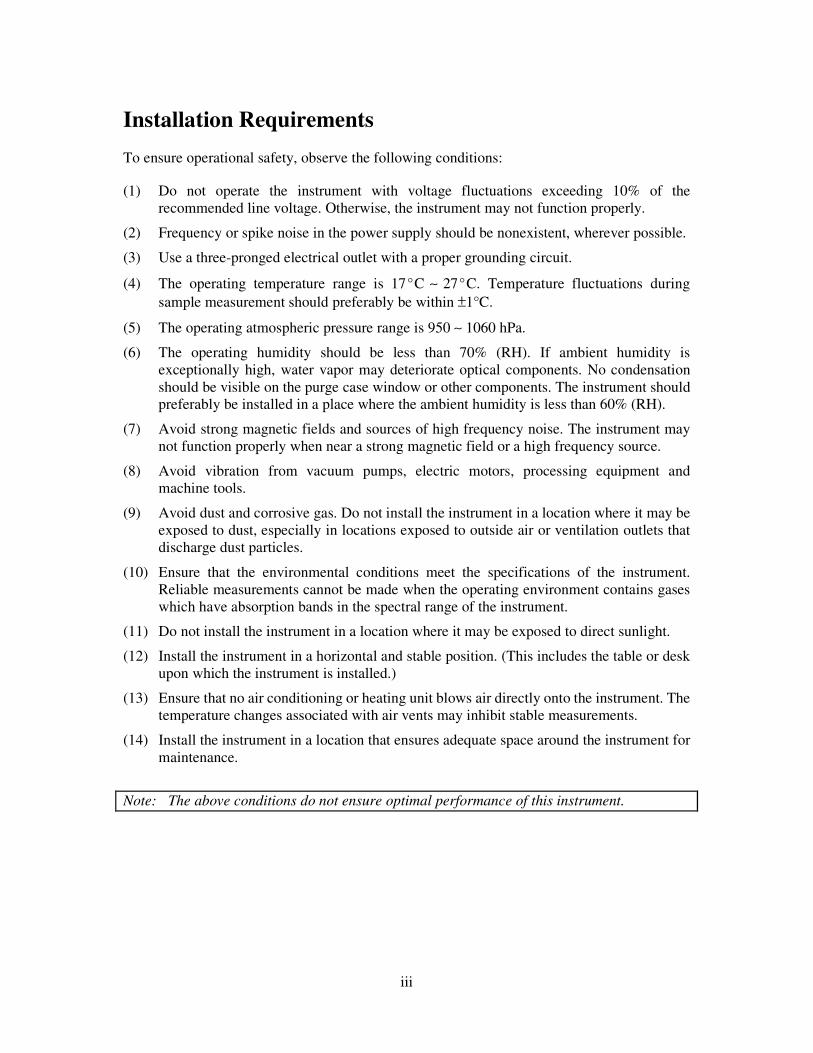
Installation Requirements To ensure operational safety, observe the following conditions: (1) Do not operate the instrument with voltage fluctuations exceeding 10% of the
recommended line voltage. Otherwise, the instrument may not function properly.
(2) Frequency or spike noise in the power supply should be nonexistent, wherever possible.
(3) Use a three-pronged electrical outlet with a proper grounding circuit.
(4) The operating temperature range is 17°C ∼ 27°C. Temperature fluctuations during sample measurement should preferably be within ±1°C.
(5) The operating atmospheric pressure range is 950 ∼ 1060 hPa.
(6) The operating humidity should be less than 70% (RH). If ambient humidity is exceptionally high, water vapor may deteriorate optical components. No condensation should be visible on the purge case window or other components. The instrument should preferably be installed in a place where the ambient humidity is less than 60% (RH).
(7) Avoid strong magnetic fields and sources of high frequency noise. The instrument may not function properly when near a strong magnetic field or a high frequency source.
(8) Avoid vibration from vacuum pumps, electric motors, processing equipment and machine tools.
(9) Avoid dust and corrosive gas. Do not install the instrument in a location where it may be exposed to dust, especially in locations exposed to outside air or ventilation outlets that discharge dust particles.
(10) Ensure that the environmental conditions meet the specifications of the instrument. Reliable measurements cannot be made when the operating environment contains gases which have absorption bands in the spectral range of the instrument.
(11) Do not install the instrument in a location where it may be exposed to direct sunlight.
(12) Install the instrument in a horizontal and stable position. (This includes the table or desk upon which the instrument is installed.)
(13) Ensure that no air conditioning or heating unit blows air directly onto the instrument. The temperature changes associated with air vents may inhibit stable measurements.
(14) Install the instrument in a location that ensures adequate space around the instrument for maintenance.
Note: The above conditions do not ensure optimal performance of this instrument.
iv
Servicing Contact your local JASCO distributor for instrument servicing. In addition, contact your JASCO distributor before moving the instrument to another location. Consumable parts should be ordered according to part number from your local JASCO distributor. If a part number is unknown, give your JASCO distributor the model name and serial number of your instrument. Notices (1) JASCO shall not be held liable, either directly or indirectly, for any consequential damage
incurred as a result of product use.
(2) Prohibitions on the use of JASCO software:
• Copying software for purposes other than backup. • Transfer or licensing of the right to use software to a third party. • Disclosure of confidential information regarding software. • Modification of software. • Use of software on multiple workstations, network terminals, or by other methods
(not applicable under a network licensing agreement concluded with JASCO). (3) The contents of this manual are subject to change without notice for product improvement.
(4) This manual is considered complete and accurate at publication.
(5) This manual does not guarantee the validity of any patent rights or other rights.
(6) In general, company names and product names are trademarks or registered trademarks of the respective companies.
(7) JASCO and the JASCO logo are registered trademarks of JASCO Corporation
� JASCO Corporation, 2002. All rights reserved. Printed in JAPAN.
v
Limited Warranty Products sold by JASCO, unless otherwise specified, are warranted for a period of one year from the date of shipment to be free of defects in materials and workmanship. If any defects in the product are found during this warranty period, JASCO will repair or replace the defective part(s) or product free of charge. THIS WARRANTY DOES NOT APPLY TO DEFECTS RESULTING FROM THE FOLLOWING: 1) IMPROPER OR INADEQUATE INSTALLATION 2) IMPROPER OR INADEQUATE OPERATION, MAINTENANCE, ADJUSTMENT OR
CALIBRATION 3) UNAUTHORIZED MODIFICATION OR MISUSE 4) USE OF CONSUMABLE PARTS NOT SUPPLIED BY AN AUTHORIZED JASCO
DISTRIBUTOR 5) CORROSION DUE TO THE USE OF IMPROPER SOLVENTS, SAMPLES, OR DUE TO
SURROUNDING GASES 6) ACCIDENTS BEYOND JASCO'S CONTROL, INCLUDING NATURAL DISASTERS This warranty does not cover the consumable parts listed below: 1) Tungsten lamp and other light sources 2) Mirrors in the source section, and cell windows 3) Fuses, batteries, glassware, chart paper and ink THE WARRANTY FOR ALL PARTS SUPPLIED AND REPAIRS PROVIDED UNDER THIS WARRANTY EXPIRES ON THE WARRANTY EXPIRATION DATE OF THE ORIGINAL PRODUCT. FOR INQUIRIES CONCERNING REPAIR SERVICE, CONTACT YOUR JASCO DISTRIBUTOR AFTER CONFIRMING THE MODEL NAME AND SERIAL NUMBER OF YOUR INSTRUMENT. JASCO Corporation 2967-5, Ishikawa-cho, Hachioji-shi
Tokyo 192-8537, JAPAN
vi
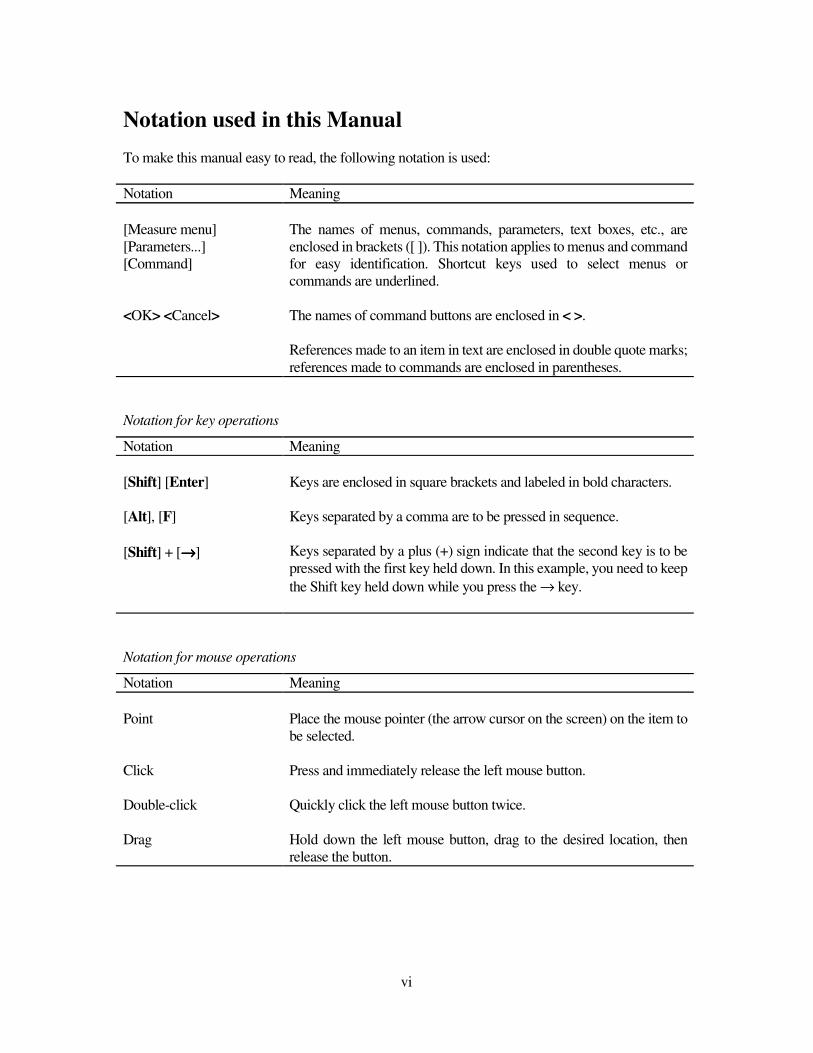
Notation used in this Manual To make this manual easy to read, the following notation is used: Notation Meaning [Measure menu] [Parameters...] [Command] <OK> <Cancel>
The names of menus, commands, parameters, text boxes, etc., are enclosed in brackets ([ ]). This notation applies to menus and command for easy identification. Shortcut keys used to select menus or commands are underlined. The names of command buttons are enclosed in < >. References made to an item in text are enclosed in double quote marks; references made to commands are enclosed in parentheses.
Notation for key operations
Notation Meaning [Shift] [Enter] [Alt], [F] [Shift] + [→→→→]
Keys are enclosed in square brackets and labeled in bold characters. Keys separated by a comma are to be pressed in sequence. Keys separated by a plus (+) sign indicate that the second key is to be pressed with the first key held down. In this example, you need to keep the Shift key held down while you press the → key.
Notation for mouse operations
Notation Meaning Point Click Double-click Drag
Place the mouse pointer (the arrow cursor on the screen) on the item to be selected. Press and immediately release the left mouse button. Quickly click the left mouse button twice. Hold down the left mouse button, drag to the desired location, then release the button.
vii
Contents
Safety Considerations ............................................................................................................ i
Preface.................................................................................................................................. ii
Installation Requirements ................................................................................................... iii
Servicing...............................................................................................................................iv
Notices ..................................................................................................................................iv
Limited Warranty ..................................................................................................................v
Notation used in this Manual ...............................................................................................vi
Contents...............................................................................................................................vii
1 Introduction .....................................................................................................................1 1.1 Measurement System Configuration of Fourier Transform Infrared Spectrometer........ 1
1.1.1 Hardware .......................................................................................................................... 1 1.1.2 Software............................................................................................................................ 1
1.2 Organization ............................................................................................................................ 2
1.3 21 CFR Part 11 ......................................................................................................................... 2
1.4 Features of the 21 CFR Part 11-compatible Spectra Manager ............................................ 3
1.5 Scope of Description in This Manual..................................................................................... 5
1.6 Components of the Program Screen ...................................................................................... 5 1.6.1 View window.................................................................................................................... 5 1.6.2 Dialog ............................................................................................................................... 6
2 Introduction to Spectra Measurement..............................................................................8 2.1 Start-up..................................................................................................................................... 9
2.1.1 FT-IR start-up ................................................................................................................... 9 2.1.2 PC and Windows start-up and Setting FT-IR properties .................................................. 9 2.1.3 Spectra Manager start-up................................................................................................ 14
2.2 Measurement.......................................................................................................................... 16 2.2.1 Setting of Instrument Measurement Parameters............................................................. 16 2.2.2 Background measurement .............................................................................................. 20 2.2.3 Sample measurement...................................................................................................... 21 2.2.4 Saving the spectrum........................................................................................................ 23
3 Spectra Manager Reference...........................................................................................25 3.1 Analysis Applications ............................................................................................................. 25
3.2 Measurement Applications .................................................................................................... 25
3.3 Exit ........................................................................................................................................... 26
4 Spectra Measurement Reference....................................................................................27 4.1 [File] Menu............................................................................................................................. 29
4.1.1 [Save data…] .................................................................................................................. 29 4.1.2 [Analysis send] ............................................................................................................... 29
viii
4.1.3 [Open Parameters…] ...................................................................................................... 29 4.1.4 [Save Parameters…] ....................................................................................................... 30 4.1.4 [Exit]............................................................................................................................... 30
4.2 [Measure] Menu..................................................................................................................... 30 4.2.1 [Cancel] .......................................................................................................................... 31 4.2.2 [Sample] ......................................................................................................................... 32 4.2.3 [Background] .................................................................................................................. 32 4.2.4 [Monitor Sample] ........................................................................................................... 32 4.2.5 [Monitor Background].................................................................................................... 33 4.2.6 [Sample Measurement +]................................................................................................ 34 4.2.7 [Background Measurement +] ........................................................................................ 35 4.2.8 [Parameters...]................................................................................................................. 35
4.2.8.1 [Standard] page ......................................................................................................................36 4.2.8.2 [Information] page .................................................................................................................37 4.2.8.3 [Data] tab ...............................................................................................................................38 4.2.8.4 [Optics] tab.............................................................................................................................39 4.2.8.5 [FFT/Timer] tab .....................................................................................................................41
4.3 [Settings] Menu...................................................................................................................... 42 4.3.1 [Auto Align…] ............................................................................................................... 42
4.4 [View] Menu........................................................................................................................... 43 4.4.1 [Scale...] .......................................................................................................................... 43 4.4.2 [Pattern...] ....................................................................................................................... 44 4.4.3 [Font...] ........................................................................................................................... 45 4.4.4 [Grid...] ........................................................................................................................... 46 4.4.5 [Style...] .......................................................................................................................... 46 4.4.6 [Toolbar…]..................................................................................................................... 47 4.4.7 [Status bar]...................................................................................................................... 47 4.4.8 [Spectrum Information] .................................................................................................. 47 4.4.9 [Customize Toolbar...].................................................................................................... 47
4.5 [Help] Menu ........................................................................................................................... 48 4.5.1 [About...] ........................................................................................................................ 48
1
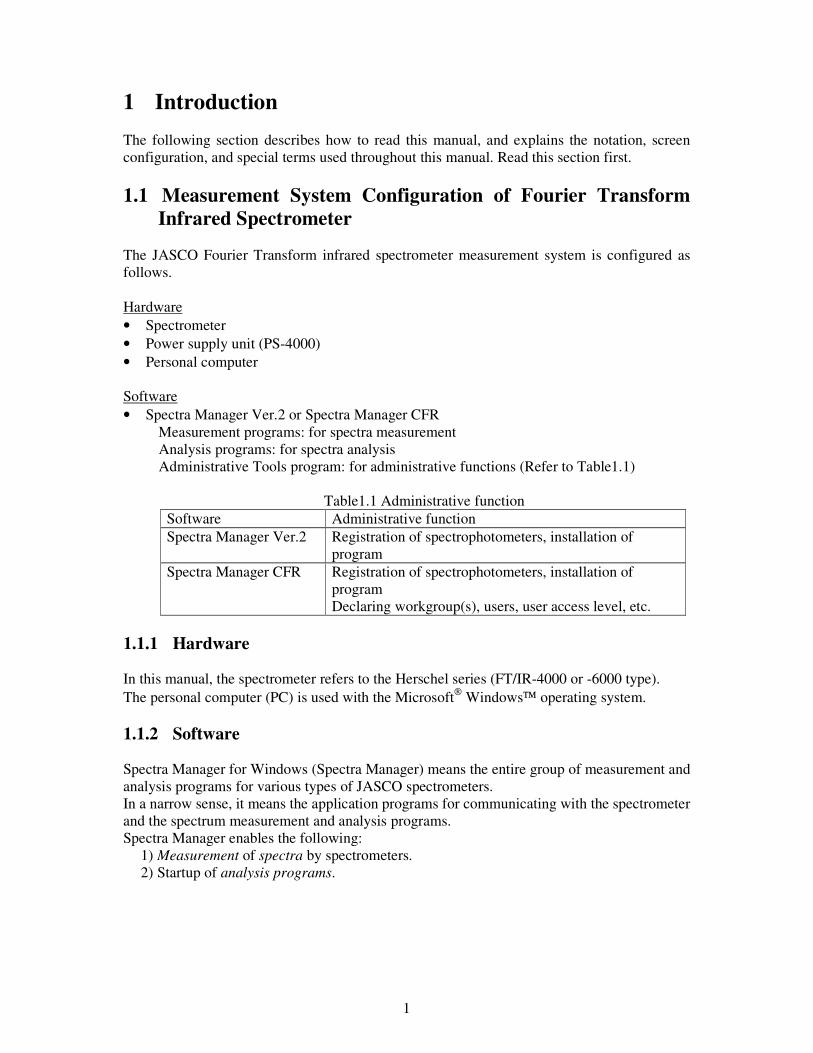
1 Introduction The following section describes how to read this manual, and explains the notation, screen configuration, and special terms used throughout this manual. Read this section first. 1.1 Measurement System Configuration of Fourier Transform
Infrared Spectrometer The JASCO Fourier Transform infrared spectrometer measurement system is configured as follows. Hardware • Spectrometer • Power supply unit (PS-4000) • Personal computer Software • Spectra Manager Ver.2 or Spectra Manager CFR
Measurement programs: for spectra measurement Analysis programs: for spectra analysis Administrative Tools program: for administrative functions (Refer to Table1.1)
Table1.1 Administrative function Software Administrative function Spectra Manager Ver.2 Registration of spectrophotometers, installation of
program Spectra Manager CFR Registration of spectrophotometers, installation of
program Declaring workgroup(s), users, user access level, etc.
1.1.1 Hardware In this manual, the spectrometer refers to the Herschel series (FT/IR-4000 or -6000 type). The personal computer (PC) is used with the Microsoft Windows operating system. 1.1.2 Software Spectra Manager for Windows (Spectra Manager) means the entire group of measurement and analysis programs for various types of JASCO spectrometers. In a narrow sense, it means the application programs for communicating with the spectrometer and the spectrum measurement and analysis programs. Spectra Manager enables the following:
1) Measurement of spectra by spectrometers. 2) Startup of analysis programs.
2
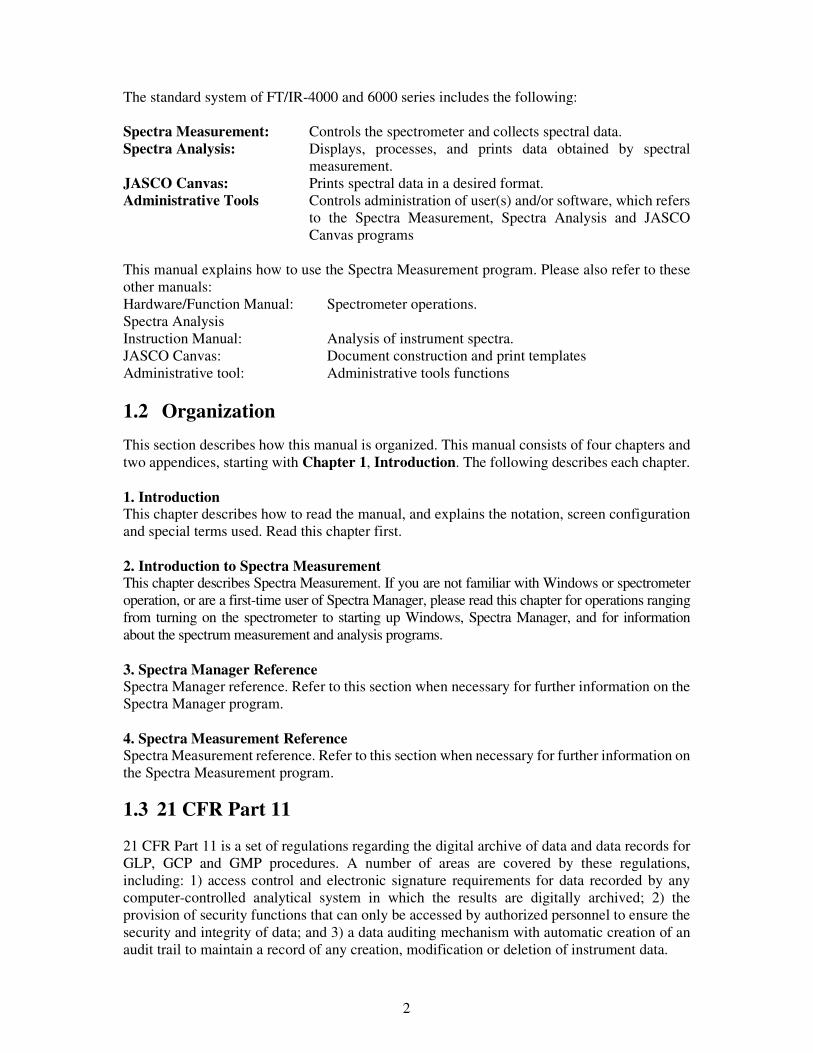
The standard system of FT/IR-4000 and 6000 series includes the following: Spectra Measurement: Controls the spectrometer and collects spectral data. Spectra Analysis: Displays, processes, and prints data obtained by spectral
measurement. JASCO Canvas: Prints spectral data in a desired format. Administrative Tools Controls administration of user(s) and/or software, which refers
to the Spectra Measurement, Spectra Analysis and JASCO Canvas programs
This manual explains how to use the Spectra Measurement program. Please also refer to these other manuals: Hardware/Function Manual: Spectrometer operations. Spectra Analysis Instruction Manual: Analysis of instrument spectra. JASCO Canvas: Document construction and print templates Administrative tool: Administrative tools functions 1.2 Organization This section describes how this manual is organized. This manual consists of four chapters and two appendices, starting with Chapter 1, Introduction. The following describes each chapter. 1. Introduction This chapter describes how to read the manual, and explains the notation, screen configuration and special terms used. Read this chapter first. 2. Introduction to Spectra Measurement This chapter describes Spectra Measurement. If you are not familiar with Windows or spectrometer operation, or are a first-time user of Spectra Manager, please read this chapter for operations ranging from turning on the spectrometer to starting up Windows, Spectra Manager, and for information about the spectrum measurement and analysis programs. 3. Spectra Manager Reference Spectra Manager reference. Refer to this section when necessary for further information on the Spectra Manager program. 4. Spectra Measurement Reference Spectra Measurement reference. Refer to this section when necessary for further information on the Spectra Measurement program.
1.3 21 CFR Part 11 21 CFR Part 11 is a set of regulations regarding the digital archive of data and data records for GLP, GCP and GMP procedures. A number of areas are covered by these regulations, including: 1) access control and electronic signature requirements for data recorded by any computer-controlled analytical system in which the results are digitally archived; 2) the provision of security functions that can only be accessed by authorized personnel to ensure the security and integrity of data; and 3) a data auditing mechanism with automatic creation of an audit trail to maintain a record of any creation, modification or deletion of instrument data.
3
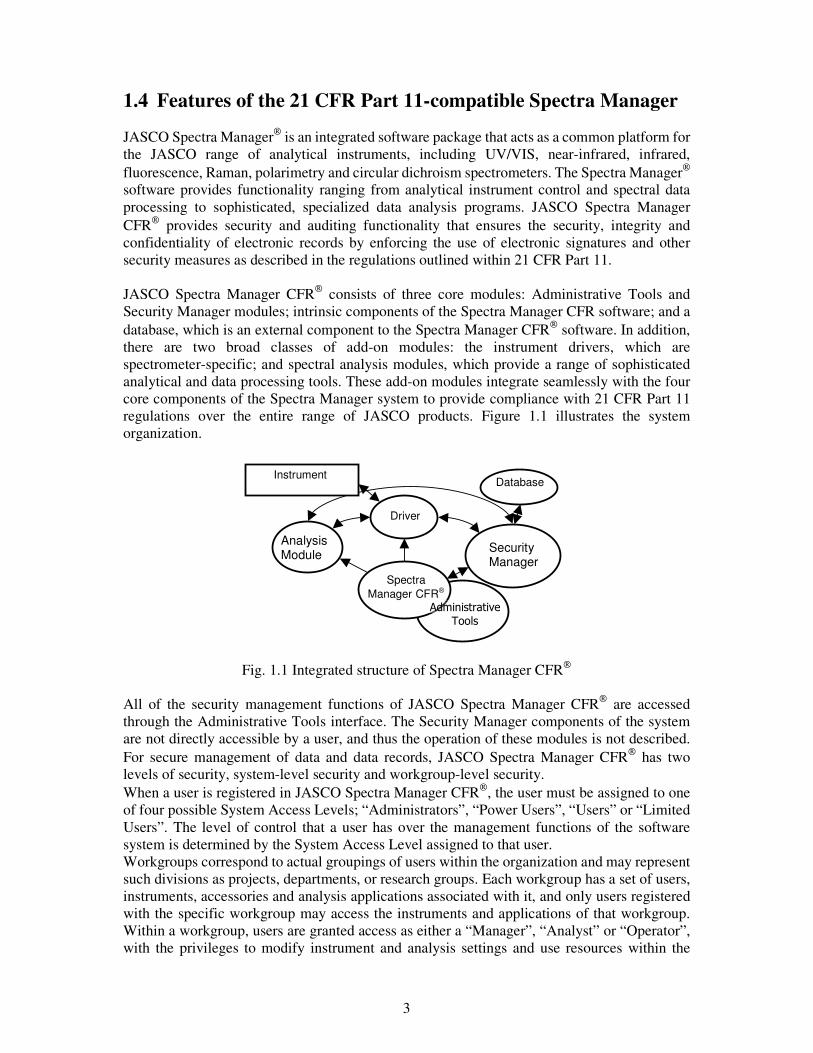
1.4 Features of the 21 CFR Part 11-compatible Spectra Manager JASCO Spectra Manager is an integrated software package that acts as a common platform for the JASCO range of analytical instruments, including UV/VIS, near-infrared, infrared, fluorescence, Raman, polarimetry and circular dichroism spectrometers. The Spectra Manager software provides functionality ranging from analytical instrument control and spectral data processing to sophisticated, specialized data analysis programs. JASCO Spectra Manager CFR provides security and auditing functionality that ensures the security, integrity and confidentiality of electronic records by enforcing the use of electronic signatures and other security measures as described in the regulations outlined within 21 CFR Part 11. JASCO Spectra Manager CFR consists of three core modules: Administrative Tools and Security Manager modules; intrinsic components of the Spectra Manager CFR software; and a database, which is an external component to the Spectra Manager CFR software. In addition, there are two broad classes of add-on modules: the instrument drivers, which are spectrometer-specific; and spectral analysis modules, which provide a range of sophisticated analytical and data processing tools. These add-on modules integrate seamlessly with the four core components of the Spectra Manager system to provide compliance with 21 CFR Part 11 regulations over the entire range of JASCO products. Figure 1.1 illustrates the system organization.
Fig. 1.1 Integrated structure of Spectra Manager CFR
All of the security management functions of JASCO Spectra Manager CFR are accessed through the Administrative Tools interface. The Security Manager components of the system are not directly accessible by a user, and thus the operation of these modules is not described. For secure management of data and data records, JASCO Spectra Manager CFR has two levels of security, system-level security and workgroup-level security. When a user is registered in JASCO Spectra Manager CFR, the user must be assigned to one of four possible System Access Levels; “Administrators”, “Power Users”, “Users” or “Limited Users”. The level of control that a user has over the management functions of the software system is determined by the System Access Level assigned to that user. Workgroups correspond to actual groupings of users within the organization and may represent such divisions as projects, departments, or research groups. Each workgroup has a set of users, instruments, accessories and analysis applications associated with it, and only users registered with the specific workgroup may access the instruments and applications of that workgroup. Within a workgroup, users are granted access as either a “Manager”, “Analyst” or “Operator”, with the privileges to modify instrument and analysis settings and use resources within the
Spectra Manager CFR
Analysis Module
Driver
Security Manager
Database
�������������
�����
Instrument
4
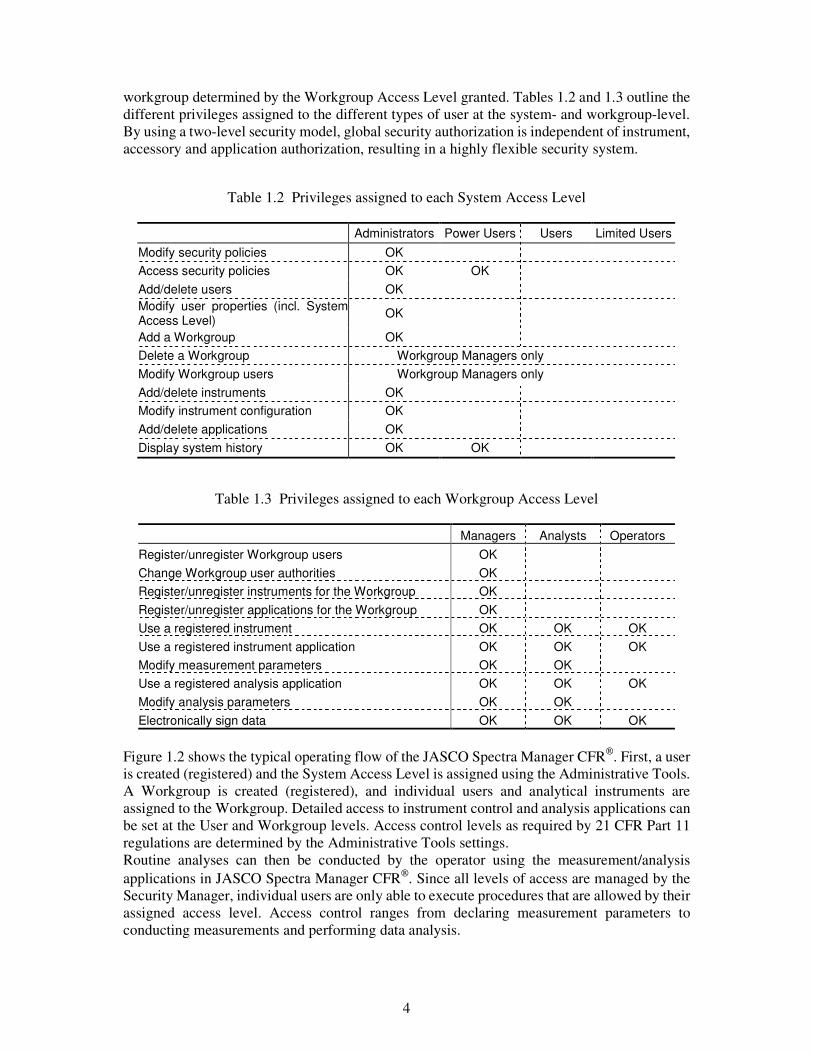
workgroup determined by the Workgroup Access Level granted. Tables 1.2 and 1.3 outline the different privileges assigned to the different types of user at the system- and workgroup-level. By using a two-level security model, global security authorization is independent of instrument, accessory and application authorization, resulting in a highly flexible security system.
Table 1.2 Privileges assigned to each System Access Level
Administrators Power Users Users Limited Users Modify security policies OK Access security policies OK OKAdd/delete users OK Modify user properties (incl. System Access Level) OK
Add a Workgroup OK Delete a Workgroup Workgroup Managers onlyModify Workgroup users Workgroup Managers onlyAdd/delete instruments OK Modify instrument configuration OK Add/delete applications OK Display system history OK OK
Table 1.3 Privileges assigned to each Workgroup Access Level
Managers Analysts Operators Register/unregister Workgroup users OK Change Workgroup user authorities OK Register/unregister instruments for the Workgroup OK Register/unregister applications for the Workgroup OK Use a registered instrument OK OK OK Use a registered instrument application OK OK OK Modify measurement parameters OK OK Use a registered analysis application OK OK OK Modify analysis parameters OK OK Electronically sign data OK OK OK
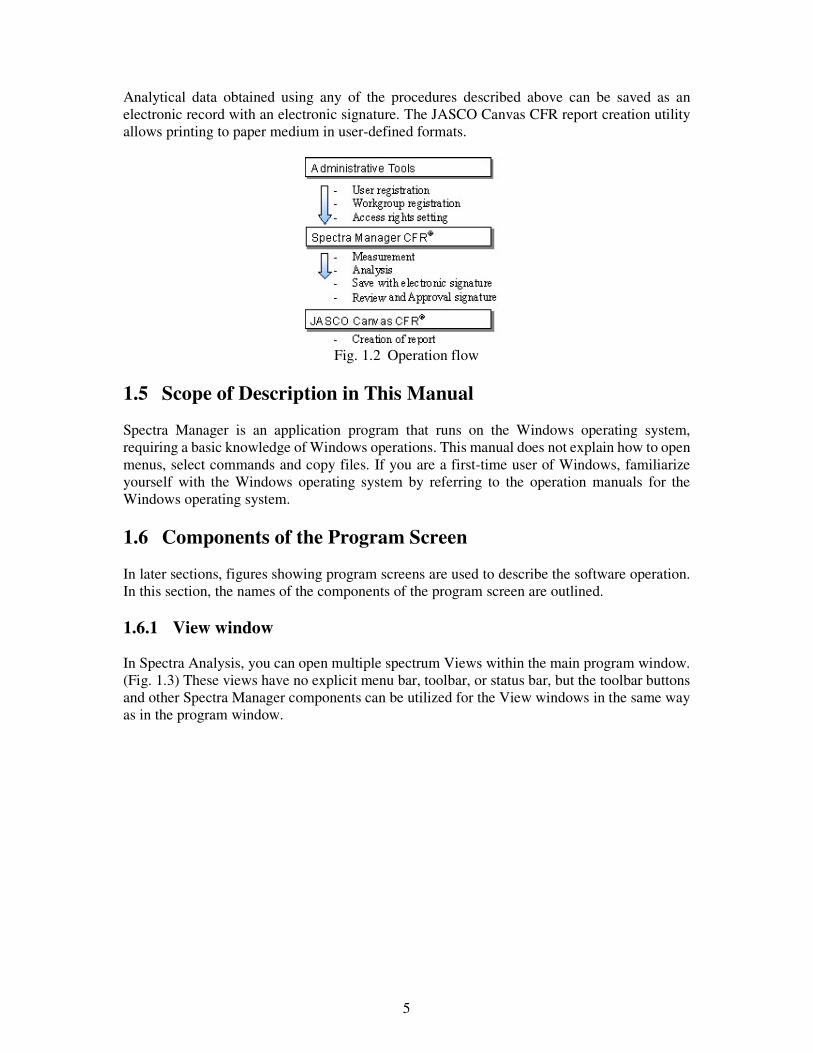
Figure 1.2 shows the typical operating flow of the JASCO Spectra Manager CFR. First, a user is created (registered) and the System Access Level is assigned using the Administrative Tools. A Workgroup is created (registered), and individual users and analytical instruments are assigned to the Workgroup. Detailed access to instrument control and analysis applications can be set at the User and Workgroup levels. Access control levels as required by 21 CFR Part 11 regulations are determined by the Administrative Tools settings. Routine analyses can then be conducted by the operator using the measurement/analysis applications in JASCO Spectra Manager CFR. Since all levels of access are managed by the Security Manager, individual users are only able to execute procedures that are allowed by their assigned access level. Access control ranges from declaring measurement parameters to conducting measurements and performing data analysis.
5
Analytical data obtained using any of the procedures described above can be saved as an electronic record with an electronic signature. The JASCO Canvas CFR report creation utility allows printing to paper medium in user-defined formats.
Fig. 1.2 Operation flow
1.5 Scope of Description in This Manual Spectra Manager is an application program that runs on the Windows operating system, requiring a basic knowledge of Windows operations. This manual does not explain how to open menus, select commands and copy files. If you are a first-time user of Windows, familiarize yourself with the Windows operating system by referring to the operation manuals for the Windows operating system. 1.6 Components of the Program Screen In later sections, figures showing program screens are used to describe the software operation. In this section, the names of the components of the program screen are outlined. 1.6.1 View window In Spectra Analysis, you can open multiple spectrum Views within the main program window. (Fig. 1.3) These views have no explicit menu bar, toolbar, or status bar, but the toolbar buttons and other Spectra Manager components can be utilized for the View windows in the same way as in the program window.
6
Fig.1.3 [Spectra Analysis] view window
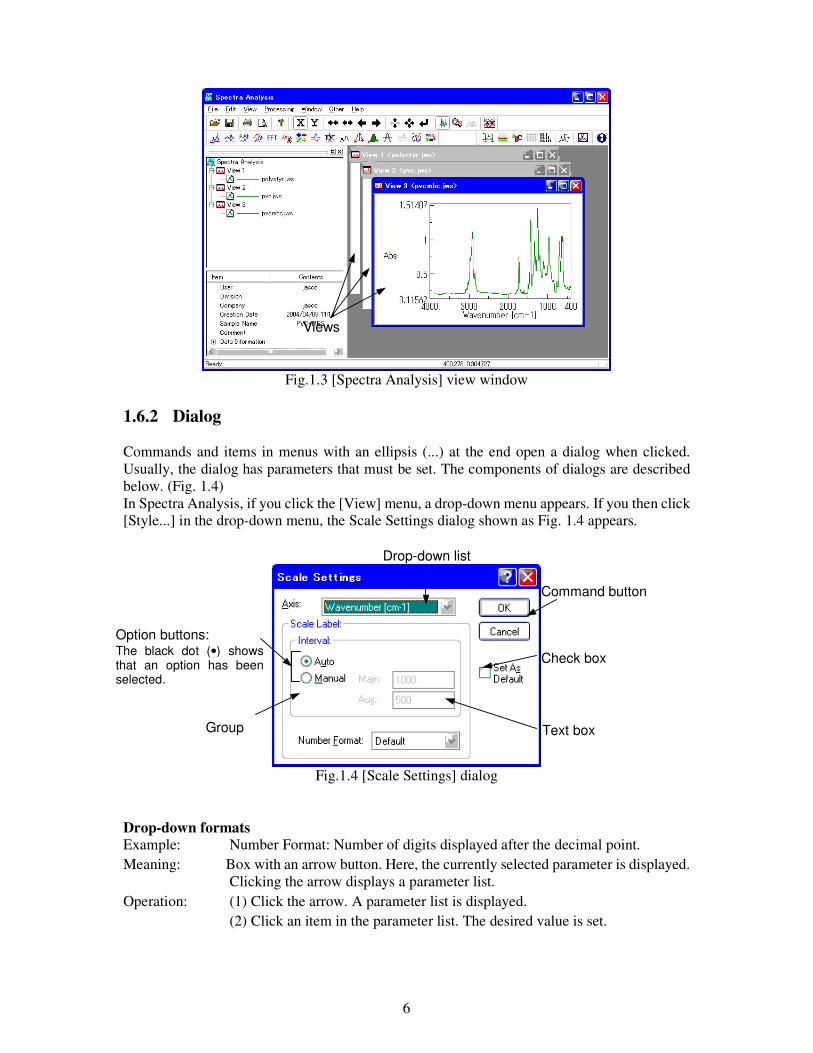
1.6.2 Dialog Commands and items in menus with an ellipsis (...) at the end open a dialog when clicked. Usually, the dialog has parameters that must be set. The components of dialogs are described below. (Fig. 1.4) In Spectra Analysis, if you click the [View] menu, a drop-down menu appears. If you then click [Style...] in the drop-down menu, the Scale Settings dialog shown as Fig. 1.4 appears.
Fig.1.4 [Scale Settings] dialog
Drop-down formats Example: Number Format: Number of digits displayed after the decimal point. Meaning: Box with an arrow button. Here, the currently selected parameter is displayed.
Clicking the arrow displays a parameter list. Operation: (1) Click the arrow. A parameter list is displayed. (2) Click an item in the parameter list. The desired value is set.
Views
Option buttons: The black dot (•) shows that an option has been selected.
Group Text box
Check box
Command button
Drop-down list
7
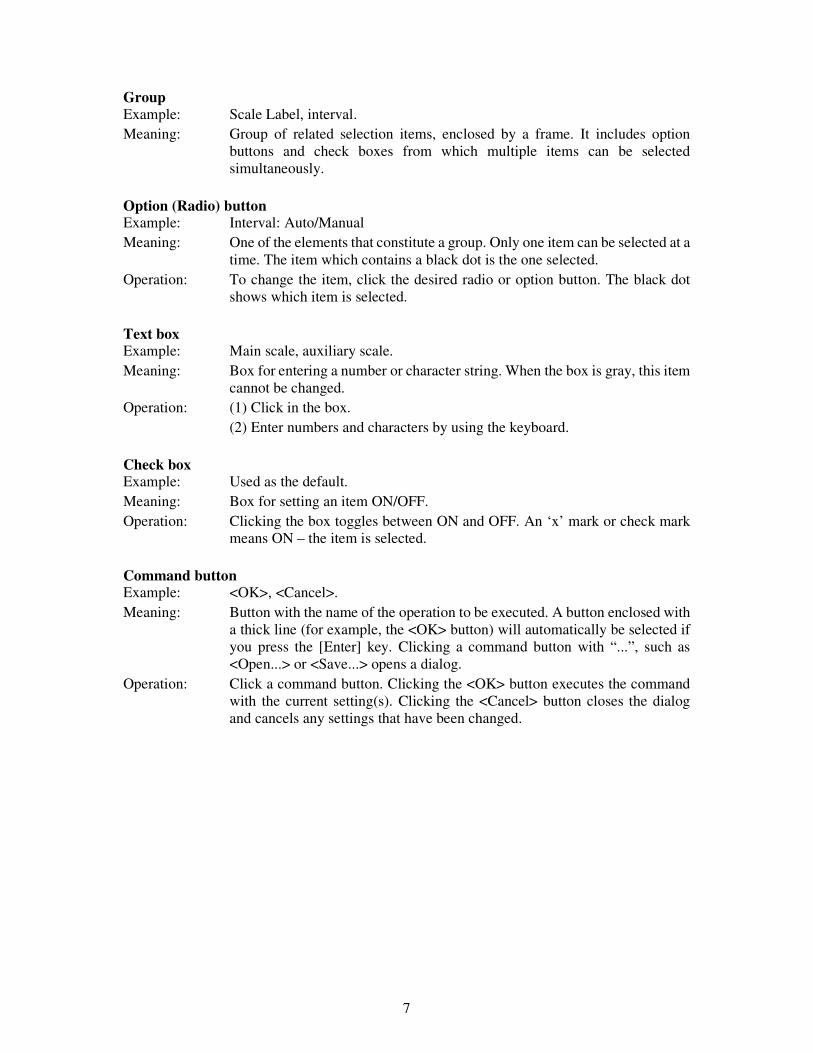
Group Example: Scale Label, interval. Meaning: Group of related selection items, enclosed by a frame. It includes option
buttons and check boxes from which multiple items can be selected simultaneously.
Option (Radio) button Example: Interval: Auto/Manual Meaning: One of the elements that constitute a group. Only one item can be selected at a
time. The item which contains a black dot is the one selected. Operation: To change the item, click the desired radio or option button. The black dot
shows which item is selected. Text box Example: Main scale, auxiliary scale. Meaning: Box for entering a number or character string. When the box is gray, this item
cannot be changed. Operation: (1) Click in the box. (2) Enter numbers and characters by using the keyboard. Check box Example: Used as the default. Meaning: Box for setting an item ON/OFF. Operation: Clicking the box toggles between ON and OFF. An ‘x’ mark or check mark
means ON – the item is selected. Command button Example: <OK>, <Cancel>. Meaning: Button with the name of the operation to be executed. A button enclosed with
a thick line (for example, the <OK> button) will automatically be selected if you press the [Enter] key. Clicking a command button with “...”, such as <Open...> or <Save...> opens a dialog.
Operation: Click a command button. Clicking the <OK> button executes the command with the current setting(s). Clicking the <Cancel> button closes the dialog and cancels any settings that have been changed.
8
2 Introduction to Spectra Measurement This chapter describes how to use the Spectra Measurement and Spectra Analysis programs using typical examples. Some functions are not described here. See the reference chapters later in the manual for full descriptions of all program functions. This chapter describes how to: 1. Start-up: Turn on the spectrometer and start Spectra Manager 2. Measure: Measure a polystyrene film 3. Save: Save the collected spectrum 4. Exit: Exit the Spectra Manager program and turn off communication with
the spectrometer Note: The Spectra Manager CFR program complies with the FDA 21-CFR part-11
regulations. Therefore, three different levels of authority (manager, analyst and operator) can be assigned to users by the Administrative Tools program. In Spectra Measurement programs, managers and analysts have access to all functionalities. In contrast, operators cannot modify parameter settings. In this manual, all functions are explained in the context of a manager or analyst using the program.
9
2.1 Start-up This section describes how to turn on the spectrometer and start up the Spectra Manager software. 2.1.1 FT-IR start-up Always turn on the RESUME switch before turning on the POWER switch. (1) To start initialization (when the RESUME switch is not already on), turn on the RESUME
switch (back of the instrument), wait five to ten minutes, and then turn on the POWER switch (top of the instrument).
(2) Turn on power to the PC only after the End of initialization beep sounds (3 beeps). Note: It is strongly recommended that the RESUME switch is left on at all times, and the
POWER switch used to initialize the spectrometer for spectra collection.
2.1.2 PC and Windows start-up and Setting FT-IR properties Turn on the PC and monitor power switches. Windows will start up, after which the following start-up desktop is displayed on the screen. FT-IR properties need to be set prior to using the FT-IR instrument. The method for setting the instrument properties is described below. Note: Only users with Administrator privilege have access to this function.
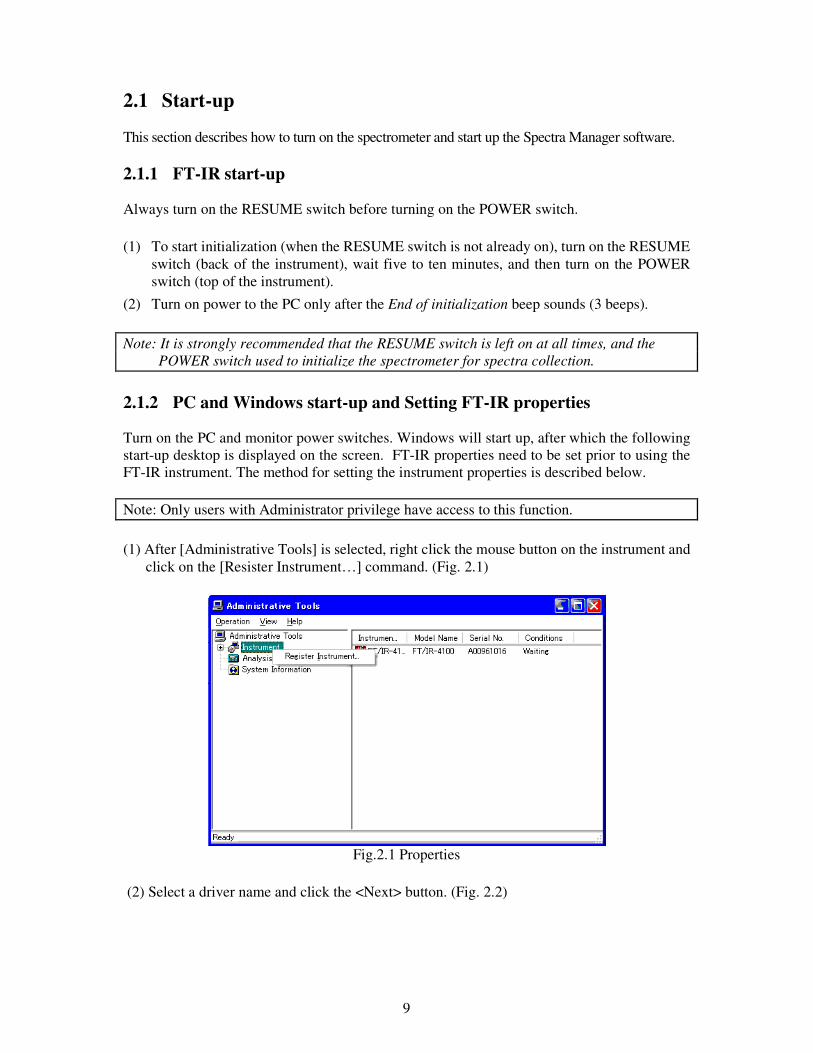
(1) After [Administrative Tools] is selected, right click the mouse button on the instrument and
click on the [Resister Instrument…] command. (Fig. 2.1)
Fig.2.1 Properties
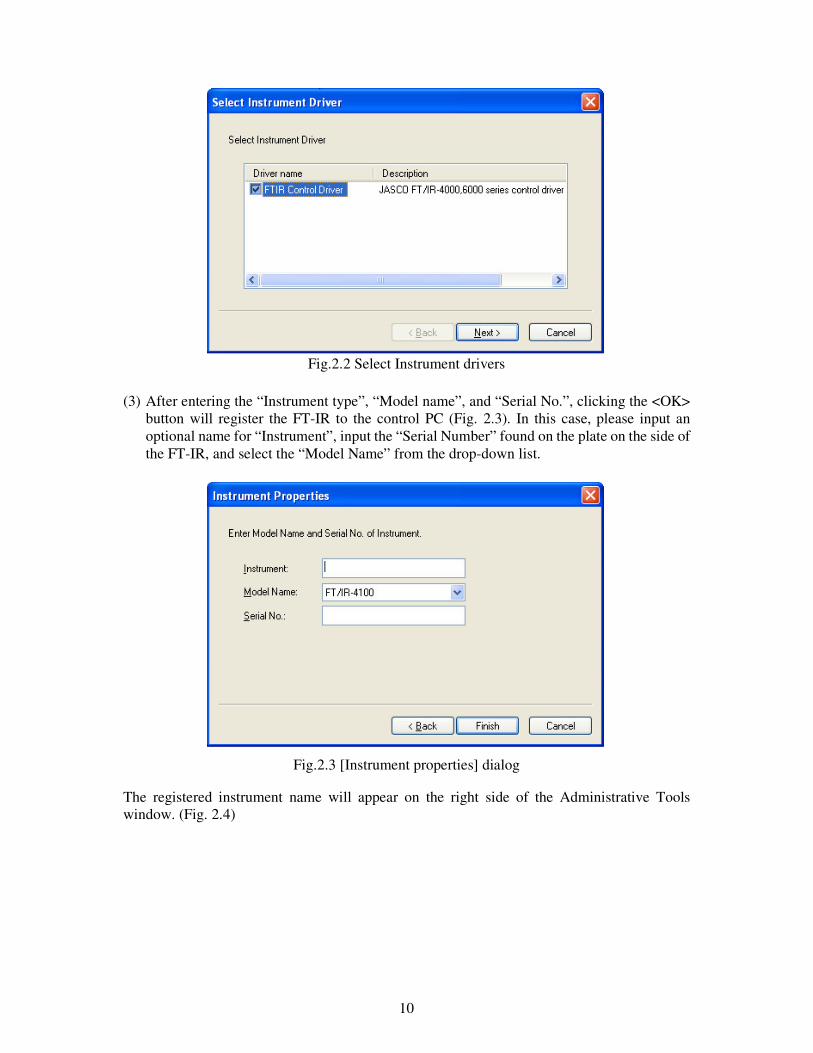
(2) Select a driver name and click the <Next> button. (Fig. 2.2)
10
Fig.2.2 Select Instrument drivers
(3) After entering the “Instrument type”, “Model name”, and “Serial No.”, clicking the <OK>
button will register the FT-IR to the control PC (Fig. 2.3). In this case, please input an optional name for “Instrument”, input the “Serial Number” found on the plate on the side of the FT-IR, and select the “Model Name” from the drop-down list.
Fig.2.3 [Instrument properties] dialog
The registered instrument name will appear on the right side of the Administrative Tools window. (Fig. 2.4)
11
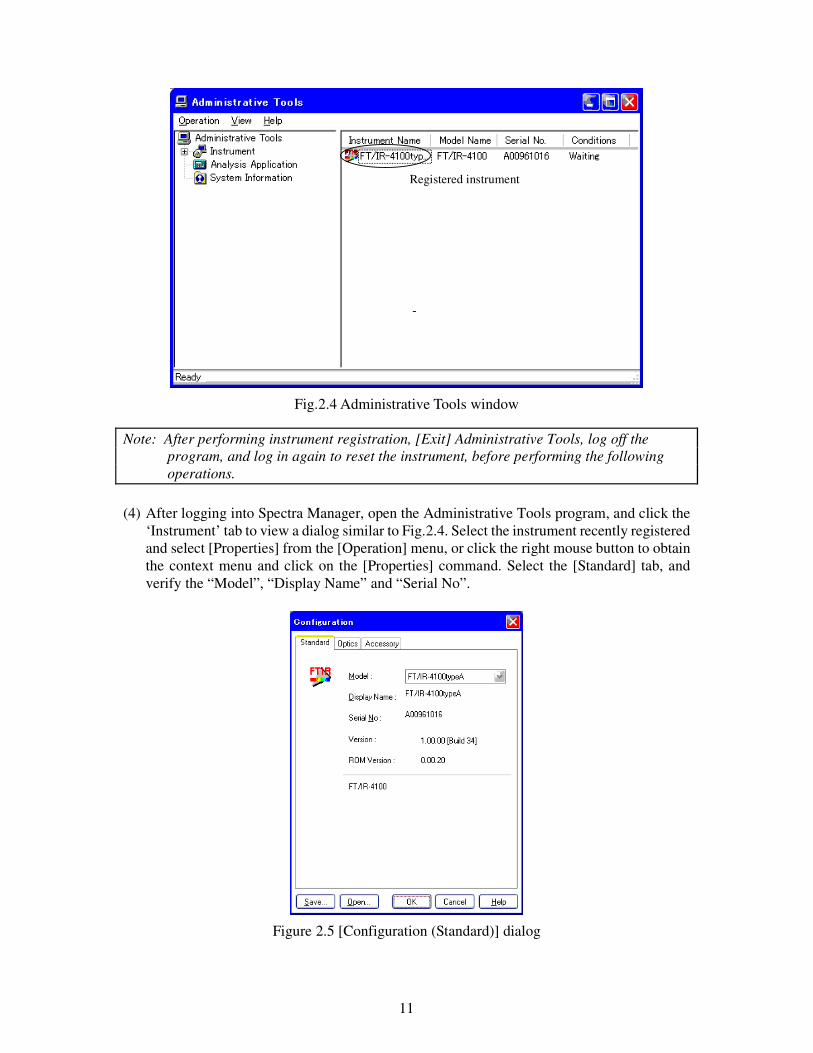
Fig.2.4 Administrative Tools window
Note: After performing instrument registration, [Exit] Administrative Tools, log off the program, and log in again to reset the instrument, before performing the following operations.
(4) After logging into Spectra Manager, open the Administrative Tools program, and click the
‘Instrument’ tab to view a dialog similar to Fig.2.4. Select the instrument recently registered and select [Properties] from the [Operation] menu, or click the right mouse button to obtain the context menu and click on the [Properties] command. Select the [Standard] tab, and verify the “Model”, “Display Name” and “Serial No”.
Figure 2.5 [Configuration (Standard)] dialog
Registered instrument
12
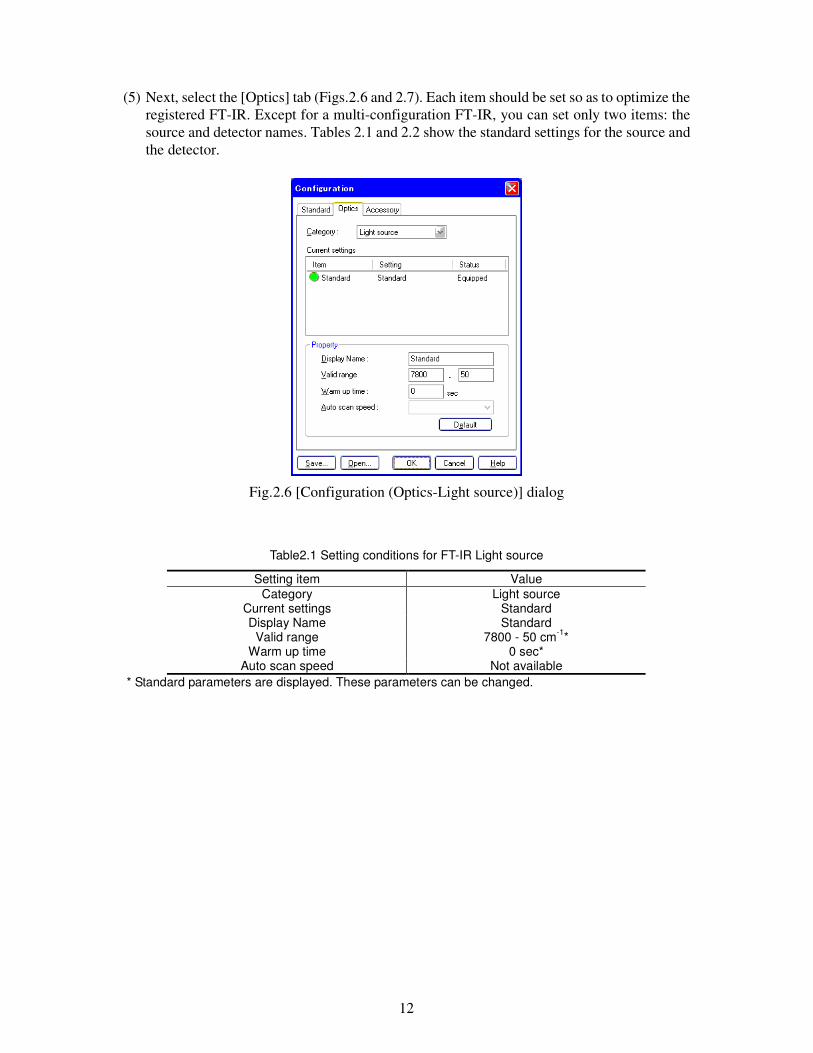
(5) Next, select the [Optics] tab (Figs.2.6 and 2.7). Each item should be set so as to optimize the registered FT-IR. Except for a multi-configuration FT-IR, you can set only two items: the source and detector names. Tables 2.1 and 2.2 show the standard settings for the source and the detector.
Fig.2.6 [Configuration (Optics-Light source)] dialog
Table2.1 Setting conditions for FT-IR Light source
Setting item Value Category Light source
Current settings Standard Display Name Standard
Valid range 7800 - 50 cm-1* Warm up time 0 sec*
Auto scan speed Not available * Standard parameters are displayed. These parameters can be changed.
13
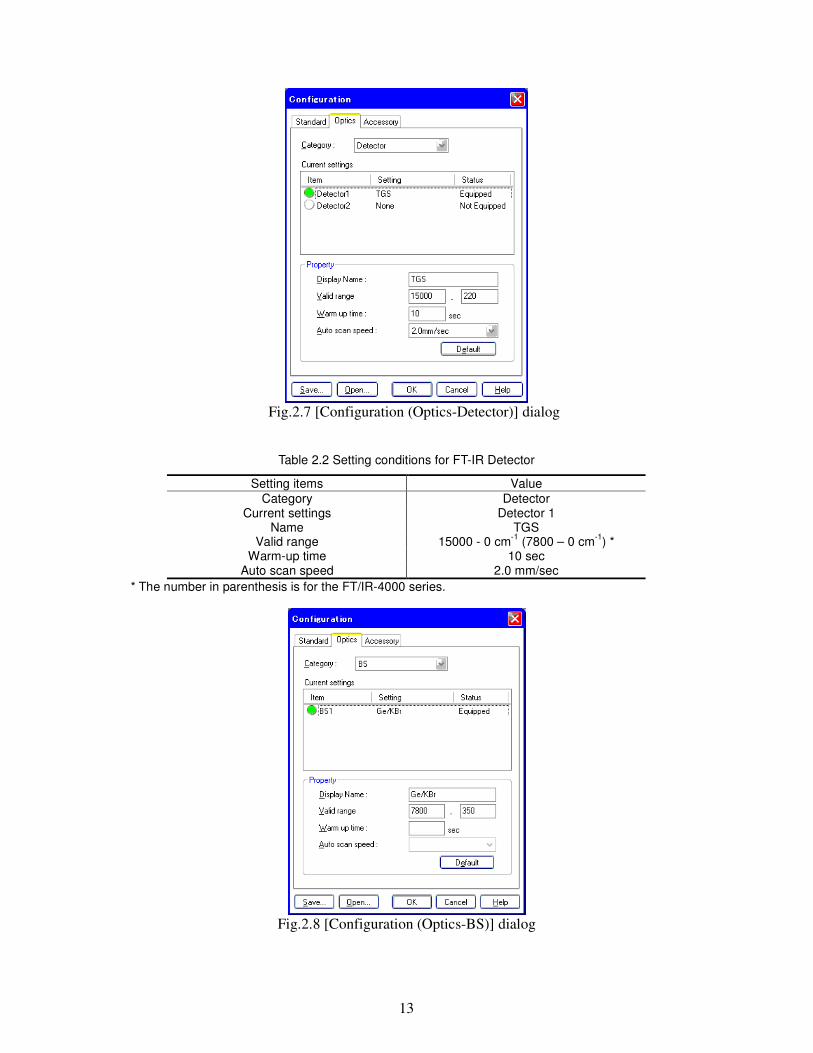
Fig.2.7 [Configuration (Optics-Detector)] dialog
Table 2.2 Setting conditions for FT-IR Detector
Setting items Value Category Detector
Current settings Detector 1 Name TGS
Valid range 15000 - 0 cm-1 (7800 – 0 cm-1) * Warm-up time 10 sec
Auto scan speed 2.0 mm/sec * The number in parenthesis is for the FT/IR-4000 series.
Fig.2.8 [Configuration (Optics-BS)] dialog
14
Table 2.3 Setting conditions for FT-IR Beam spliter
Setting items Value Category BS
Current settings BS1 Name Ge/KBr
Valid range 7800 - 350 cm-1 * Warm-up time Not available
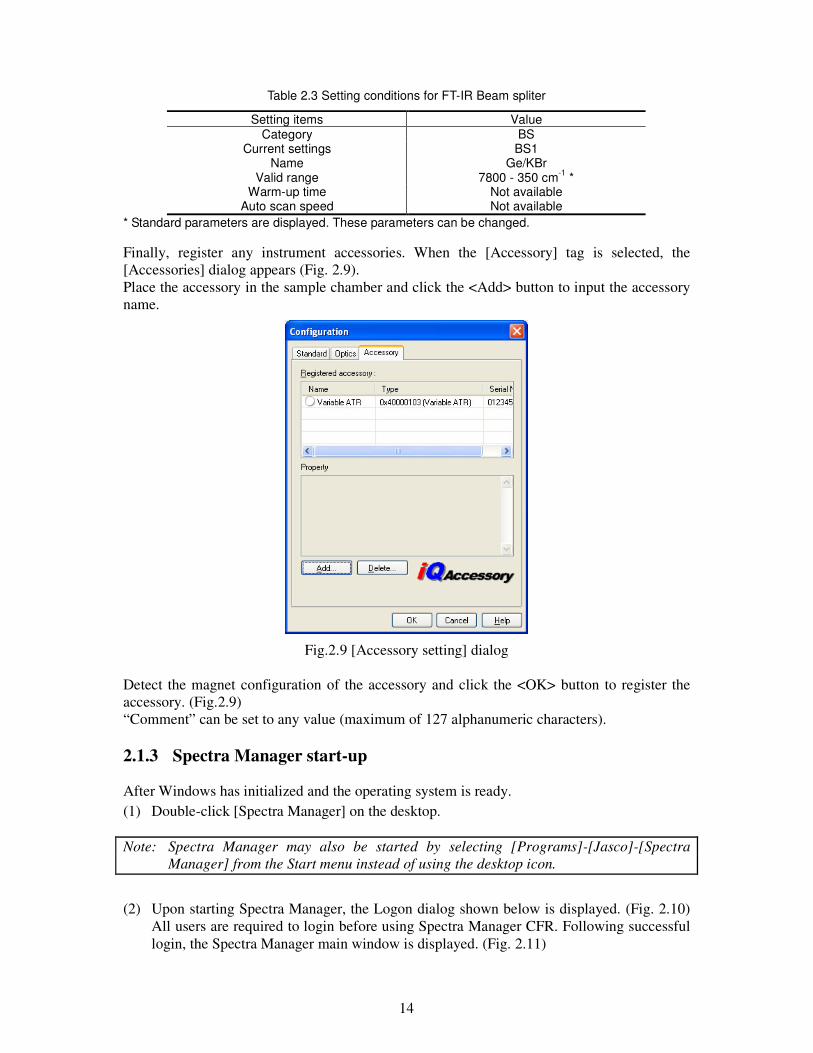
Auto scan speed Not available * Standard parameters are displayed. These parameters can be changed. Finally, register any instrument accessories. When the [Accessory] tag is selected, the [Accessories] dialog appears (Fig. 2.9). Place the accessory in the sample chamber and click the <Add> button to input the accessory name.
Fig.2.9 [Accessory setting] dialog
Detect the magnet configuration of the accessory and click the <OK> button to register the accessory. (Fig.2.9) “Comment” can be set to any value (maximum of 127 alphanumeric characters). 2.1.3 Spectra Manager start-up After Windows has initialized and the operating system is ready. (1) Double-click [Spectra Manager] on the desktop. Note: Spectra Manager may also be started by selecting [Programs]-[Jasco]-[Spectra
Manager] from the Start menu instead of using the desktop icon.
(2) Upon starting Spectra Manager, the Logon dialog shown below is displayed. (Fig. 2.10) All users are required to login before using Spectra Manager CFR. Following successful login, the Spectra Manager main window is displayed. (Fig. 2.11)
15
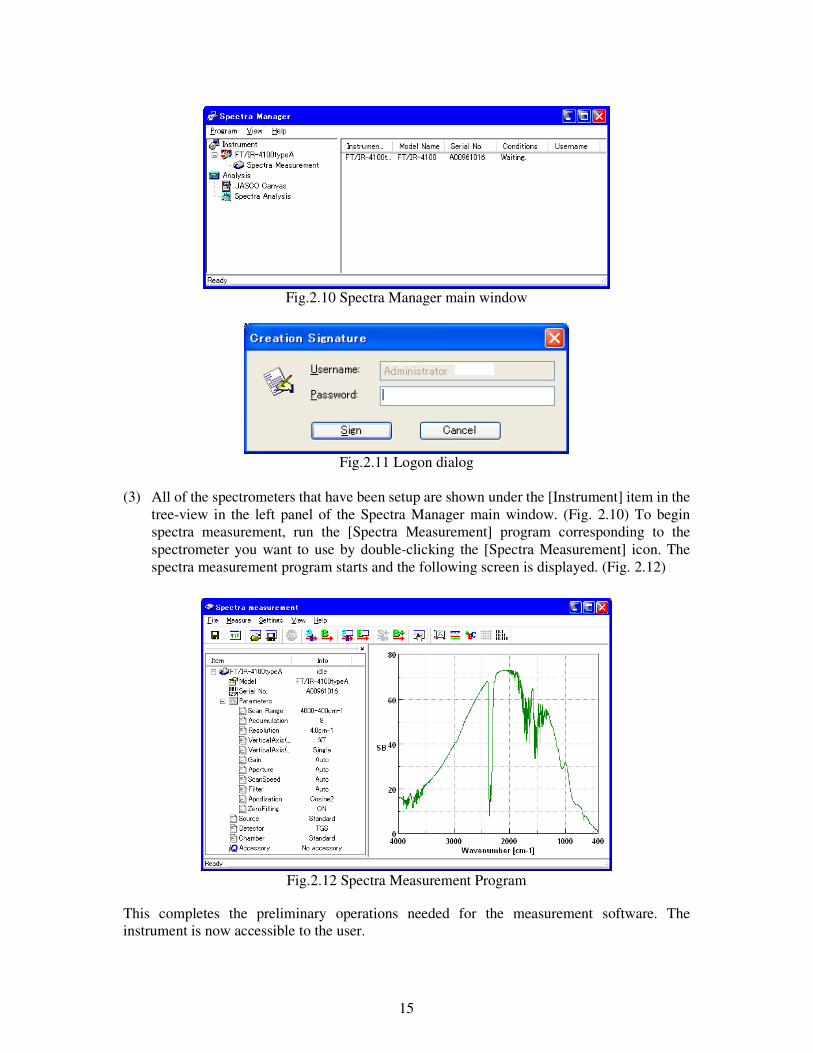
Fig.2.10 Spectra Manager main window
Fig.2.11 Logon dialog
(3) All of the spectrometers that have been setup are shown under the [Instrument] item in the tree-view in the left panel of the Spectra Manager main window. (Fig. 2.10) To begin spectra measurement, run the [Spectra Measurement] program corresponding to the spectrometer you want to use by double-clicking the [Spectra Measurement] icon. The spectra measurement program starts and the following screen is displayed. (Fig. 2.12)
Fig.2.12 Spectra Measurement Program
This completes the preliminary operations needed for the measurement software. The instrument is now accessible to the user.
16
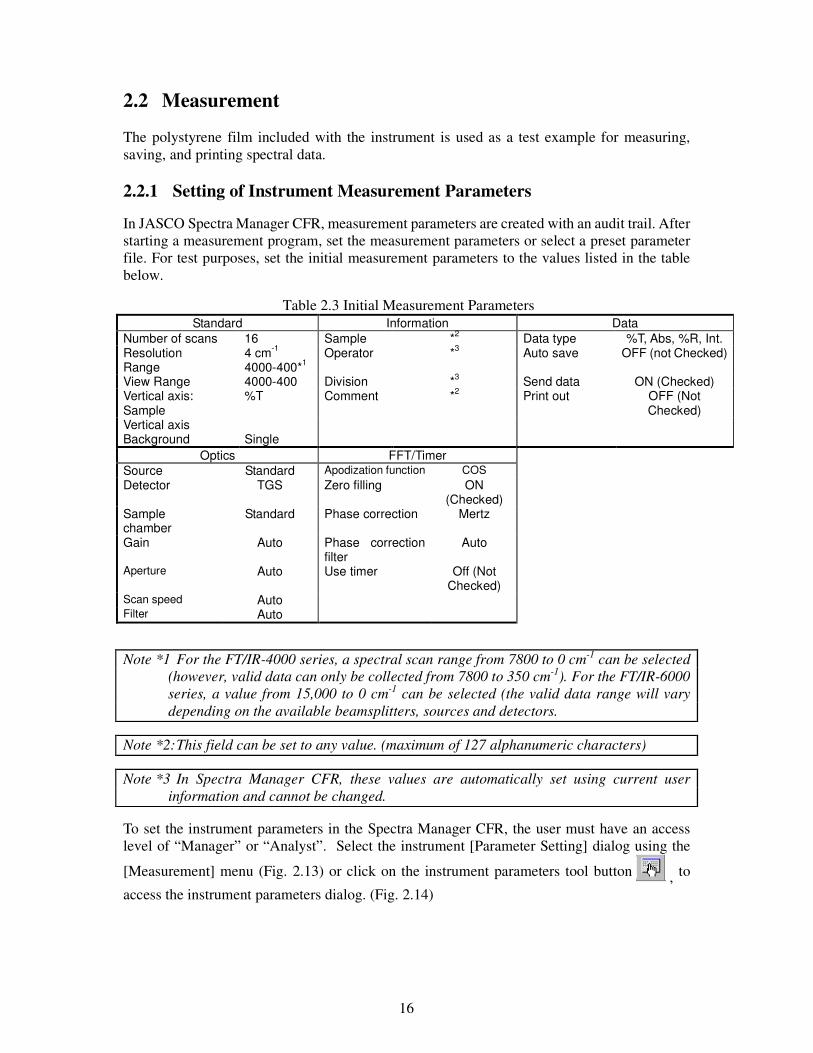
2.2 Measurement The polystyrene film included with the instrument is used as a test example for measuring, saving, and printing spectral data. 2.2.1 Setting of Instrument Measurement Parameters
In JASCO Spectra Manager CFR, measurement parameters are created with an audit trail. After starting a measurement program, set the measurement parameters or select a preset parameter file. For test purposes, set the initial measurement parameters to the values listed in the table below.
Table 2.3 Initial Measurement Parameters
Standard Information Data Number of scans 16 Sample *2 Data type %T, Abs, %R, Int. Resolution 4 cm-1 Operator *3 Auto save OFF (not Checked) Range 4000-400*1 View Range 4000-400 Division *3 Send data ON (Checked) Vertical axis: Sample
%T Comment *2 Print out OFF (Not Checked)
Vertical axis Background
Single
Optics FFT/Timer Source Standard Apodization function COS Detector TGS Zero filling ON
(Checked) Sample chamber
Standard Phase correction Mertz
Gain Auto Phase correction filter
Auto
Aperture Auto Use timer Off (Not Checked)
Scan speed Auto Filter Auto
Note *1 For the FT/IR-4000 series, a spectral scan range from 7800 to 0 cm-1 can be selected (however, valid data can only be collected from 7800 to 350 cm-1). For the FT/IR-6000 series, a value from 15,000 to 0 cm-1 can be selected (the valid data range will vary depending on the available beamsplitters, sources and detectors.
Note *2: This field can be set to any value. (maximum of 127 alphanumeric characters)
Note *3 In Spectra Manager CFR, these values are automatically set using current user information and cannot be changed.
To set the instrument parameters in the Spectra Manager CFR, the user must have an access level of “Manager” or “Analyst”. Select the instrument [Parameter Setting] dialog using the
[Measurement] menu (Fig. 2.13) or click on the instrument parameters tool button , to
access the instrument parameters dialog. (Fig. 2.14)
17
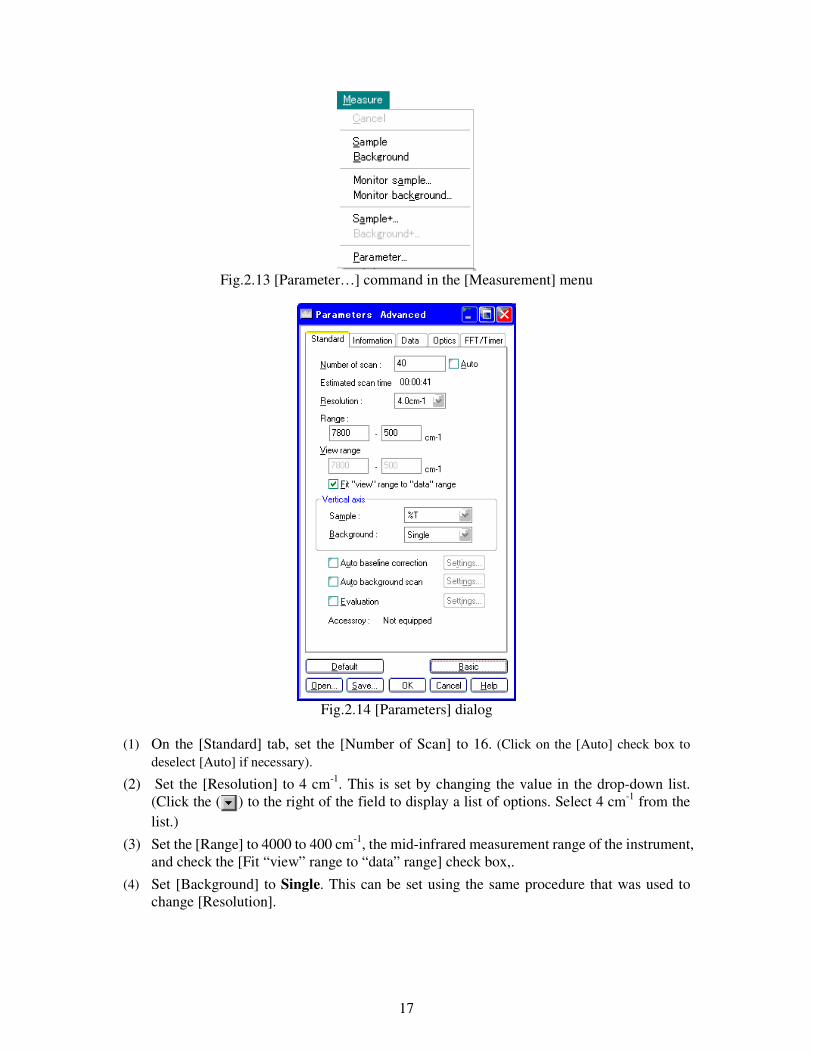
Fig.2.13 [Parameter…] command in the [Measurement] menu
Fig.2.14 [Parameters] dialog
(1) On the [Standard] tab, set the [Number of Scan] to 16. (Click on the [Auto] check box to
deselect [Auto] if necessary).
(2) Set the [Resolution] to 4 cm-1. This is set by changing the value in the drop-down list. (Click the ( ) to the right of the field to display a list of options. Select 4 cm-1 from the list.)
(3) Set the [Range] to 4000 to 400 cm-1, the mid-infrared measurement range of the instrument, and check the [Fit “view” range to “data” range] check box,.
(4) Set [Background] to Single. This can be set using the same procedure that was used to change [Resolution].
18
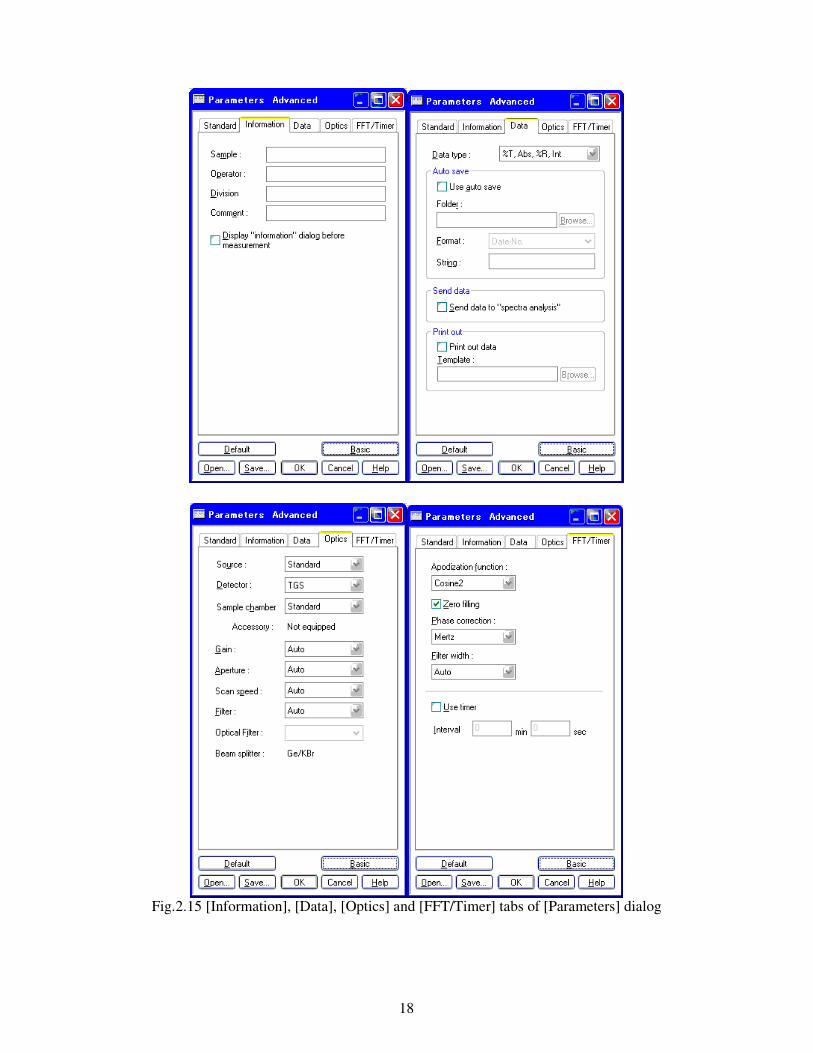
Fig.2.15 [Information], [Data], [Optics] and [FFT/Timer] tabs of [Parameters] dialog
19
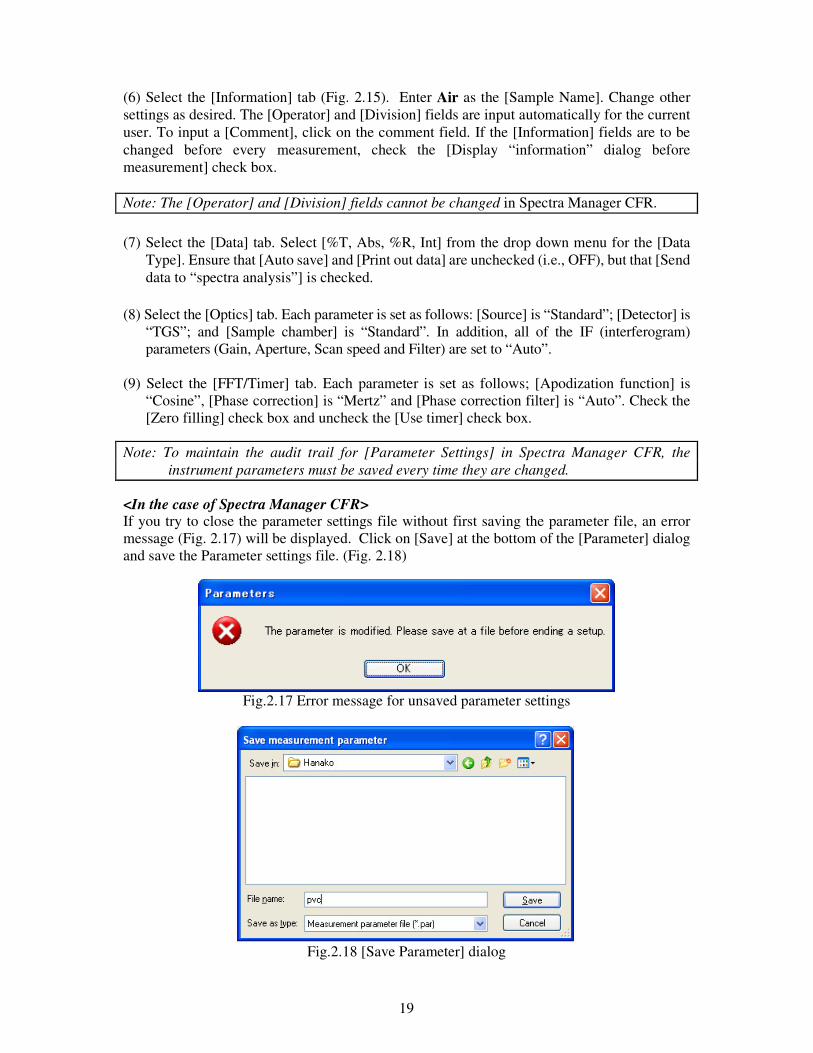
(6) Select the [Information] tab (Fig. 2.15). Enter Air as the [Sample Name]. Change other settings as desired. The [Operator] and [Division] fields are input automatically for the current user. To input a [Comment], click on the comment field. If the [Information] fields are to be changed before every measurement, check the [Display “information” dialog before measurement] check box.
Note: The [Operator] and [Division] fields cannot be changed in Spectra Manager CFR. (7) Select the [Data] tab. Select [%T, Abs, %R, Int] from the drop down menu for the [Data
Type]. Ensure that [Auto save] and [Print out data] are unchecked (i.e., OFF), but that [Send data to “spectra analysis”] is checked.
(8) Select the [Optics] tab. Each parameter is set as follows: [Source] is “Standard”; [Detector] is
“TGS”; and [Sample chamber] is “Standard”. In addition, all of the IF (interferogram) parameters (Gain, Aperture, Scan speed and Filter) are set to “Auto”.
(9) Select the [FFT/Timer] tab. Each parameter is set as follows; [Apodization function] is
“Cosine”, [Phase correction] is “Mertz” and [Phase correction filter] is “Auto”. Check the [Zero filling] check box and uncheck the [Use timer] check box.
Note: To maintain the audit trail for [Parameter Settings] in Spectra Manager CFR, the
instrument parameters must be saved every time they are changed. <In the case of Spectra Manager CFR> If you try to close the parameter settings file without first saving the parameter file, an error message (Fig. 2.17) will be displayed. Click on [Save] at the bottom of the [Parameter] dialog and save the Parameter settings file. (Fig. 2.18)
Fig.2.17 Error message for unsaved parameter settings
Fig.2.18 [Save Parameter] dialog
20
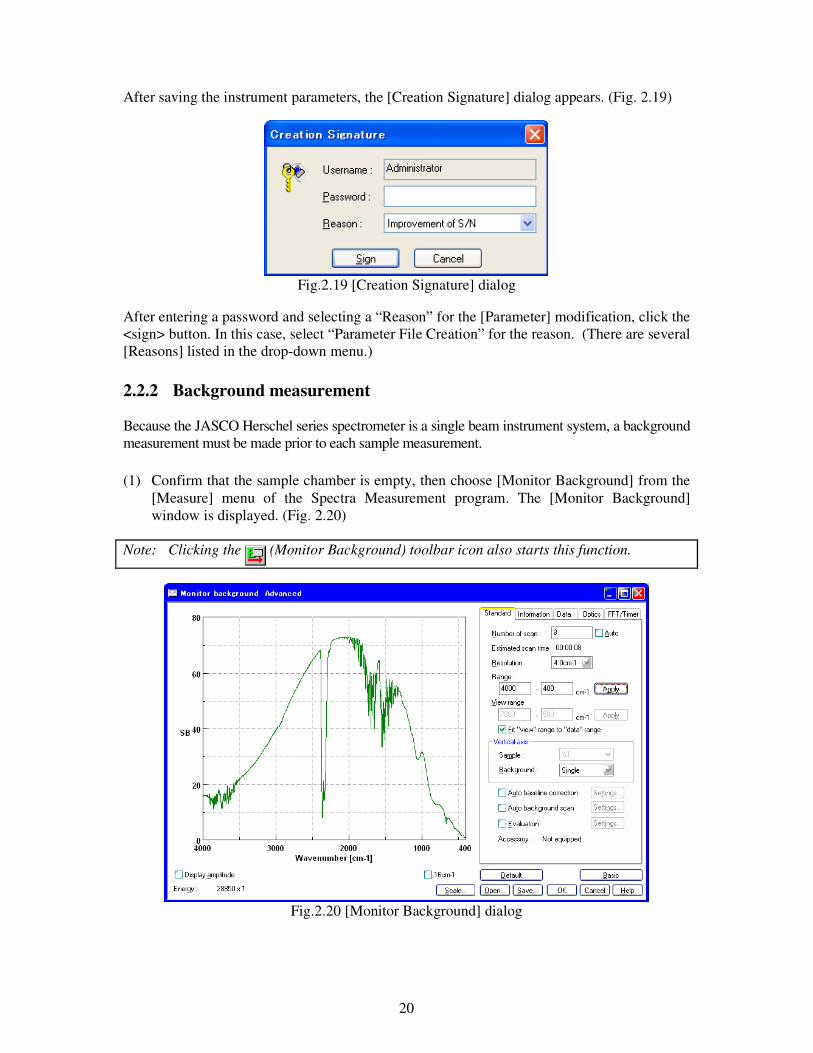
After saving the instrument parameters, the [Creation Signature] dialog appears. (Fig. 2.19)
Fig.2.19 [Creation Signature] dialog
After entering a password and selecting a “Reason” for the [Parameter] modification, click the <sign> button. In this case, select “Parameter File Creation” for the reason. (There are several [Reasons] listed in the drop-down menu.) 2.2.2 Background measurement Because the JASCO Herschel series spectrometer is a single beam instrument system, a background measurement must be made prior to each sample measurement. (1) Confirm that the sample chamber is empty, then choose [Monitor Background] from the
[Measure] menu of the Spectra Measurement program. The [Monitor Background] window is displayed. (Fig. 2.20)
Note: Clicking the (Monitor Background) toolbar icon also starts this function.
Fig.2.20 [Monitor Background] dialog
21
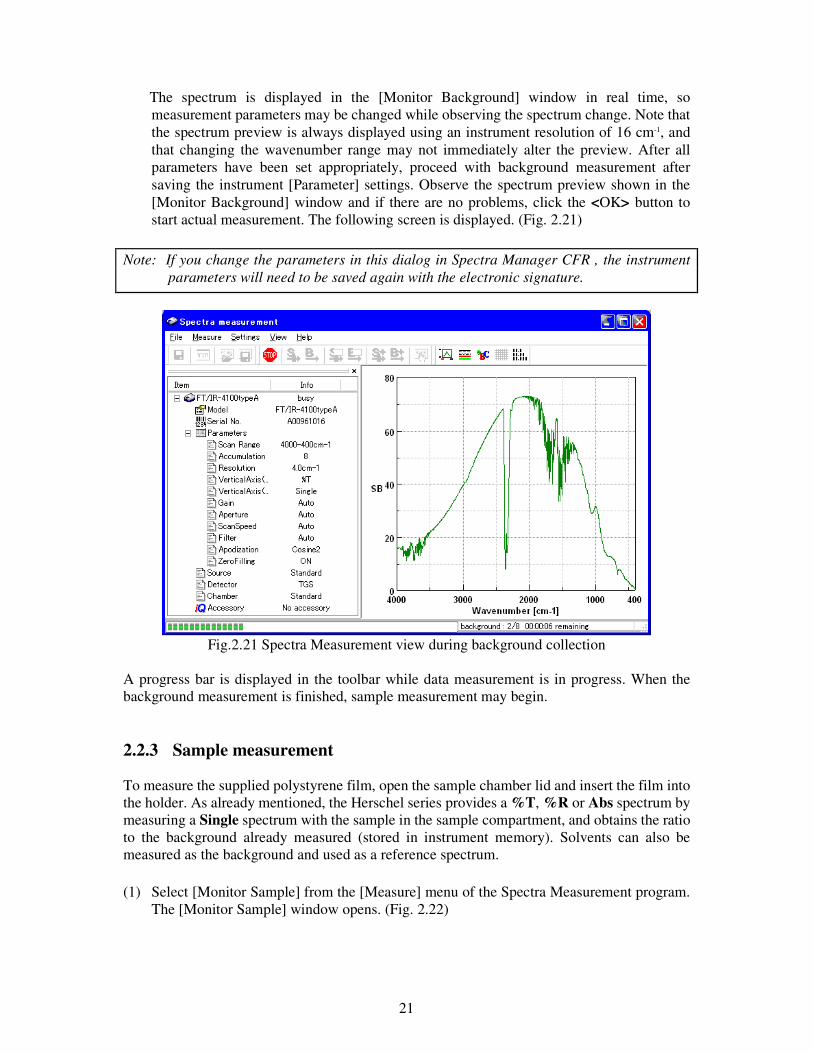
The spectrum is displayed in the [Monitor Background] window in real time, so measurement parameters may be changed while observing the spectrum change. Note that the spectrum preview is always displayed using an instrument resolution of 16 cm-1, and that changing the wavenumber range may not immediately alter the preview. After all parameters have been set appropriately, proceed with background measurement after saving the instrument [Parameter] settings. Observe the spectrum preview shown in the [Monitor Background] window and if there are no problems, click the <OK> button to start actual measurement. The following screen is displayed. (Fig. 2.21)
Note: If you change the parameters in this dialog in Spectra Manager CFR , the instrument
parameters will need to be saved again with the electronic signature.
Fig.2.21 Spectra Measurement view during background collection
A progress bar is displayed in the toolbar while data measurement is in progress. When the background measurement is finished, sample measurement may begin. 2.2.3 Sample measurement To measure the supplied polystyrene film, open the sample chamber lid and insert the film into the holder. As already mentioned, the Herschel series provides a %T, %R or Abs spectrum by measuring a Single spectrum with the sample in the sample compartment, and obtains the ratio to the background already measured (stored in instrument memory). Solvents can also be measured as the background and used as a reference spectrum. (1) Select [Monitor Sample] from the [Measure] menu of the Spectra Measurement program.
The [Monitor Sample] window opens. (Fig. 2.22)
22
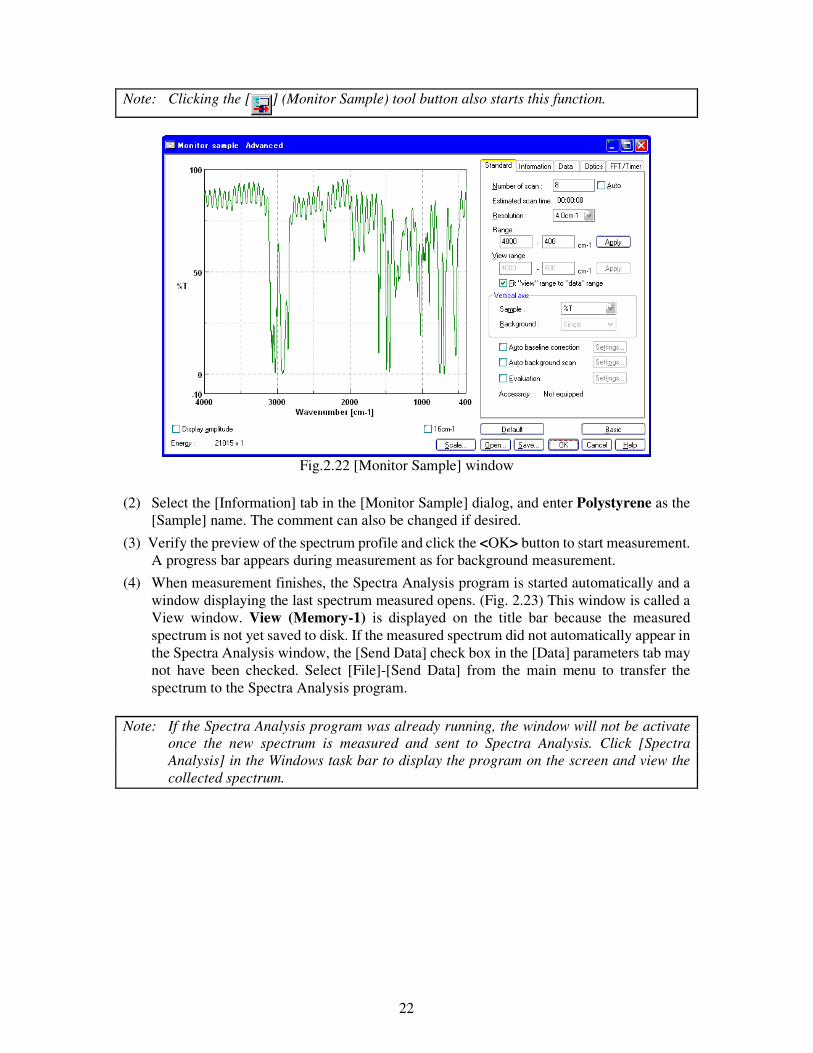
Note: Clicking the [ ] (Monitor Sample) tool button also starts this function.
Fig.2.22 [Monitor Sample] window
(2) Select the [Information] tab in the [Monitor Sample] dialog, and enter Polystyrene as the
[Sample] name. The comment can also be changed if desired.
(3) Verify the preview of the spectrum profile and click the <OK> button to start measurement. A progress bar appears during measurement as for background measurement.
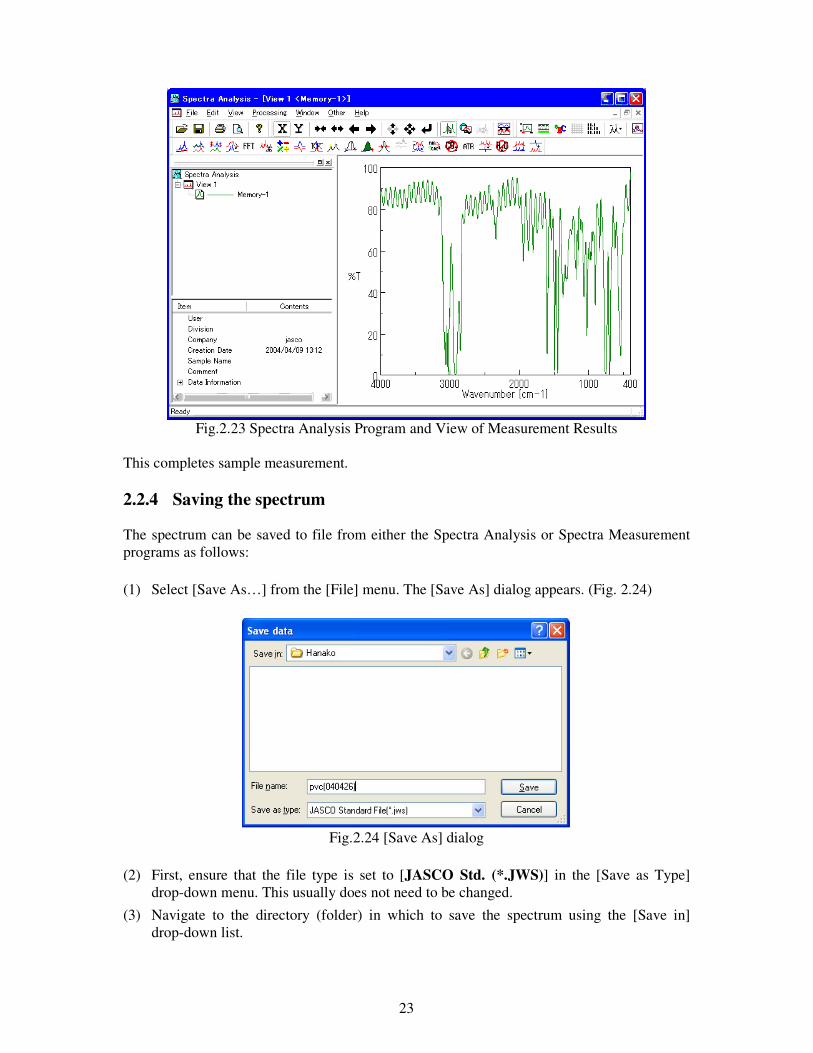
(4) When measurement finishes, the Spectra Analysis program is started automatically and a window displaying the last spectrum measured opens. (Fig. 2.23) This window is called a View window. View (Memory-1) is displayed on the title bar because the measured spectrum is not yet saved to disk. If the measured spectrum did not automatically appear in the Spectra Analysis window, the [Send Data] check box in the [Data] parameters tab may not have been checked. Select [File]-[Send Data] from the main menu to transfer the spectrum to the Spectra Analysis program.
Note: If the Spectra Analysis program was already running, the window will not be activate
once the new spectrum is measured and sent to Spectra Analysis. Click [Spectra Analysis] in the Windows task bar to display the program on the screen and view the collected spectrum.
23
Fig.2.23 Spectra Analysis Program and View of Measurement Results
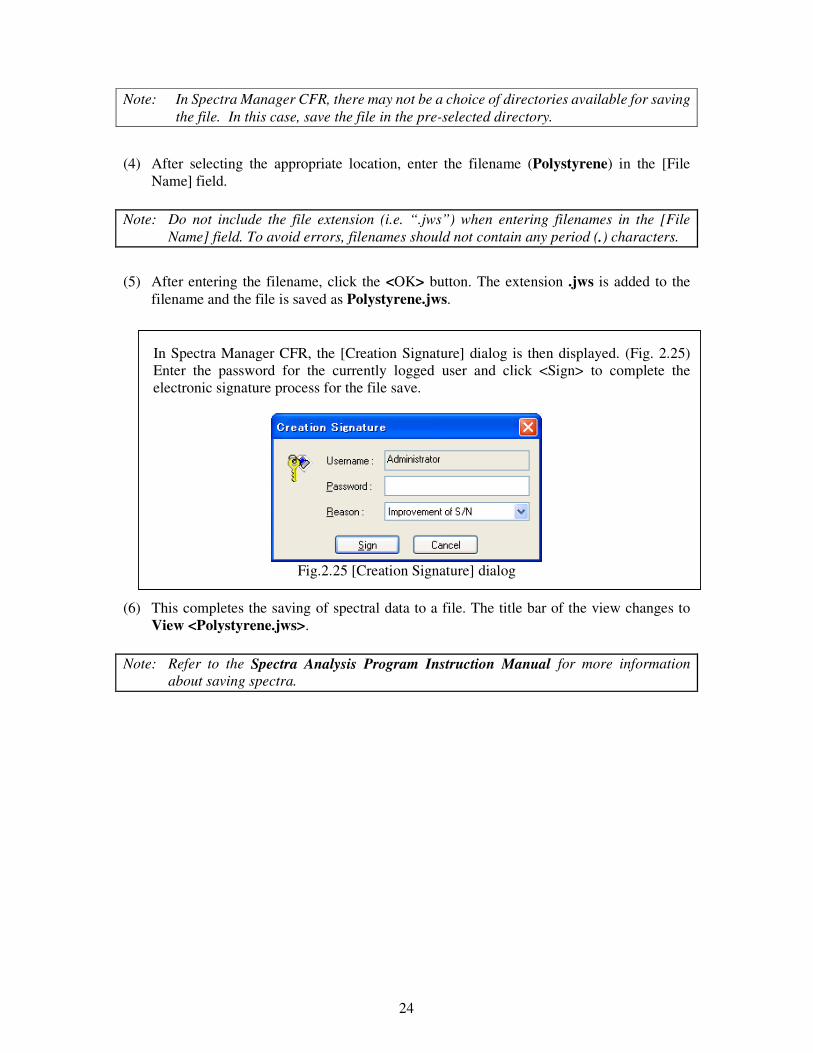
This completes sample measurement. 2.2.4 Saving the spectrum The spectrum can be saved to file from either the Spectra Analysis or Spectra Measurement programs as follows: (1) Select [Save As…] from the [File] menu. The [Save As] dialog appears. (Fig. 2.24)
Fig.2.24 [Save As] dialog
(2) First, ensure that the file type is set to [JASCO Std. (*.JWS)] in the [Save as Type]
drop-down menu. This usually does not need to be changed.
(3) Navigate to the directory (folder) in which to save the spectrum using the [Save in] drop-down list.
24
Note: In Spectra Manager CFR, there may not be a choice of directories available for saving the file. In this case, save the file in the pre-selected directory.
(4) After selecting the appropriate location, enter the filename (Polystyrene) in the [File
Name] field. Note: Do not include the file extension (i.e. “.jws”) when entering filenames in the [File
Name] field. To avoid errors, filenames should not contain any period (.) characters. (5) After entering the filename, click the <OK> button. The extension .jws is added to the
filename and the file is saved as Polystyrene.jws. In Spectra Manager CFR, the [Creation Signature] dialog is then displayed. (Fig. 2.25)
Enter the password for the currently logged user and click <Sign> to complete the electronic signature process for the file save.
Fig.2.25 [Creation Signature] dialog
(6) This completes the saving of spectral data to a file. The title bar of the view changes to
View <Polystyrene.jws>. Note: Refer to the Spectra Analysis Program Instruction Manual for more information
about saving spectra.
25
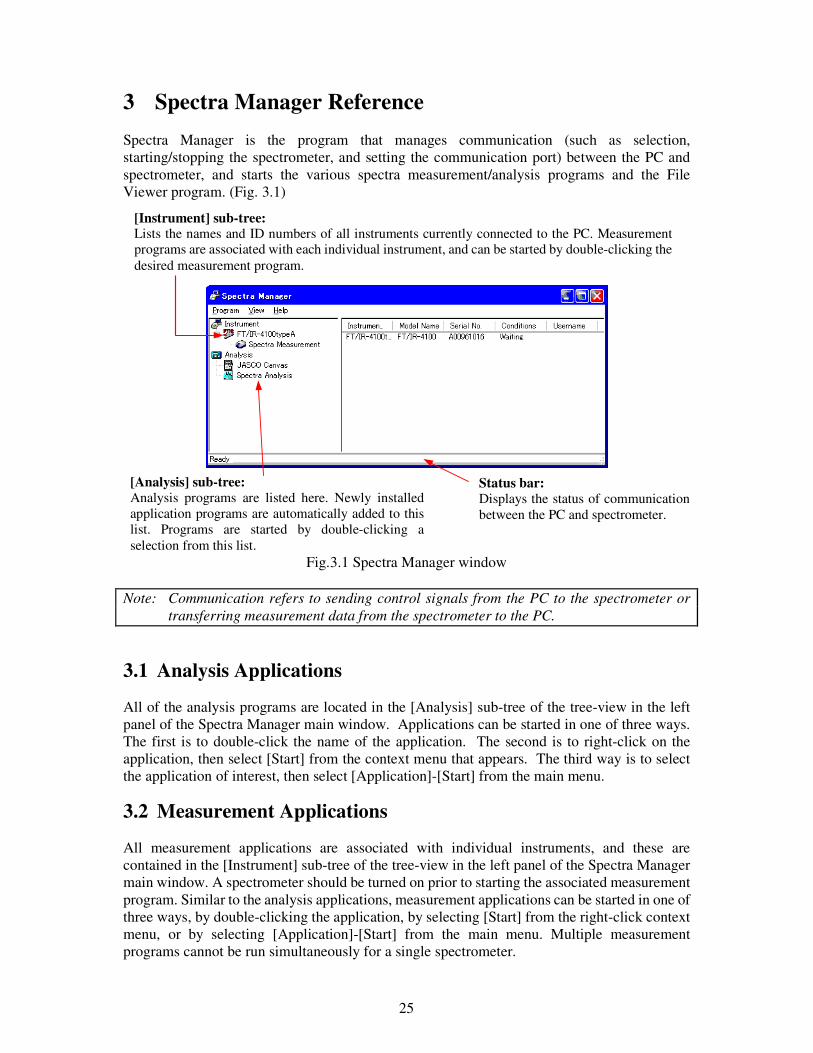
3 Spectra Manager Reference Spectra Manager is the program that manages communication (such as selection, starting/stopping the spectrometer, and setting the communication port) between the PC and spectrometer, and starts the various spectra measurement/analysis programs and the File Viewer program. (Fig. 3.1)
Fig.3.1 Spectra Manager window Note: Communication refers to sending control signals from the PC to the spectrometer or
transferring measurement data from the spectrometer to the PC.
3.1 Analysis Applications All of the analysis programs are located in the [Analysis] sub-tree of the tree-view in the left panel of the Spectra Manager main window. Applications can be started in one of three ways. The first is to double-click the name of the application. The second is to right-click on the application, then select [Start] from the context menu that appears. The third way is to select the application of interest, then select [Application]-[Start] from the main menu.
3.2 Measurement Applications All measurement applications are associated with individual instruments, and these are contained in the [Instrument] sub-tree of the tree-view in the left panel of the Spectra Manager main window. A spectrometer should be turned on prior to starting the associated measurement program. Similar to the analysis applications, measurement applications can be started in one of three ways, by double-clicking the application, by selecting [Start] from the right-click context menu, or by selecting [Application]-[Start] from the main menu. Multiple measurement programs cannot be run simultaneously for a single spectrometer.
[Instrument] sub-tree: Lists the names and ID numbers of all instruments currently connected to the PC. Measurement programs are associated with each individual instrument, and can be started by double-clicking the desired measurement program.
[Analysis] sub-tree: Analysis programs are listed here. Newly installedapplication programs are automatically added to this list. Programs are started by double-clicking a selection from this list.
Status bar: Displays the status of communicationbetween the PC and spectrometer.
26
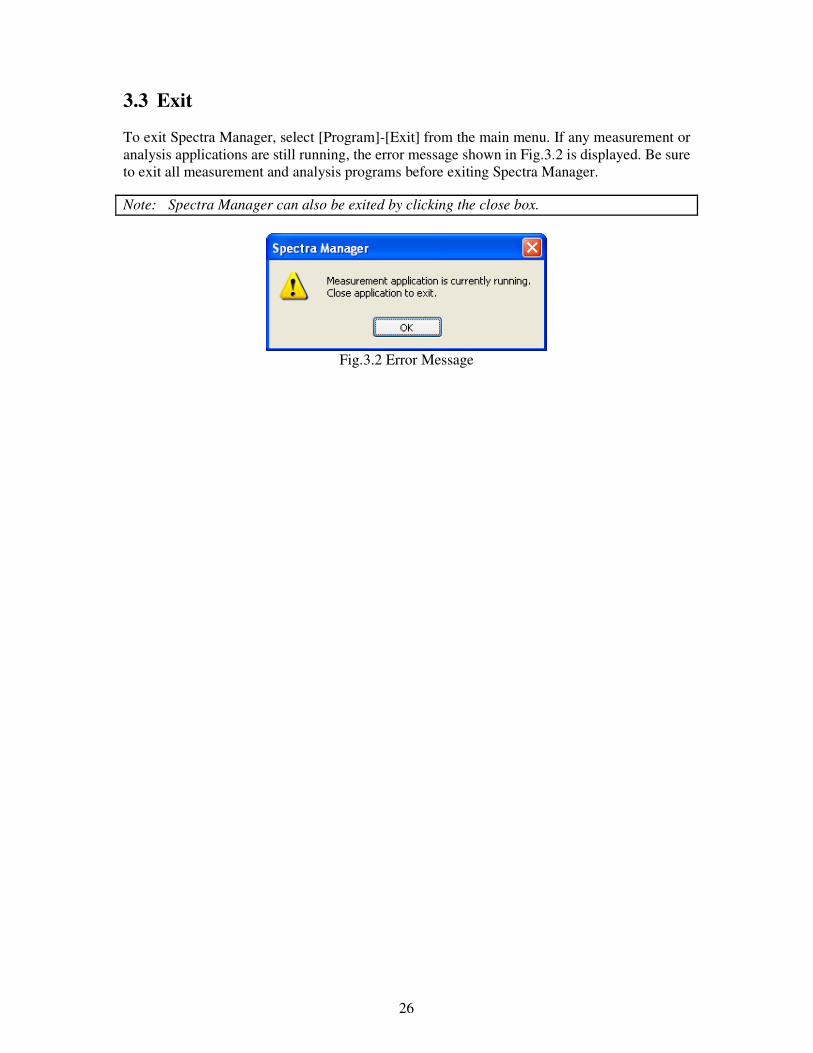
3.3 Exit To exit Spectra Manager, select [Program]-[Exit] from the main menu. If any measurement or analysis applications are still running, the error message shown in Fig.3.2 is displayed. Be sure to exit all measurement and analysis programs before exiting Spectra Manager. Note: Spectra Manager can also be exited by clicking the close box.
Fig.3.2 Error Message
27
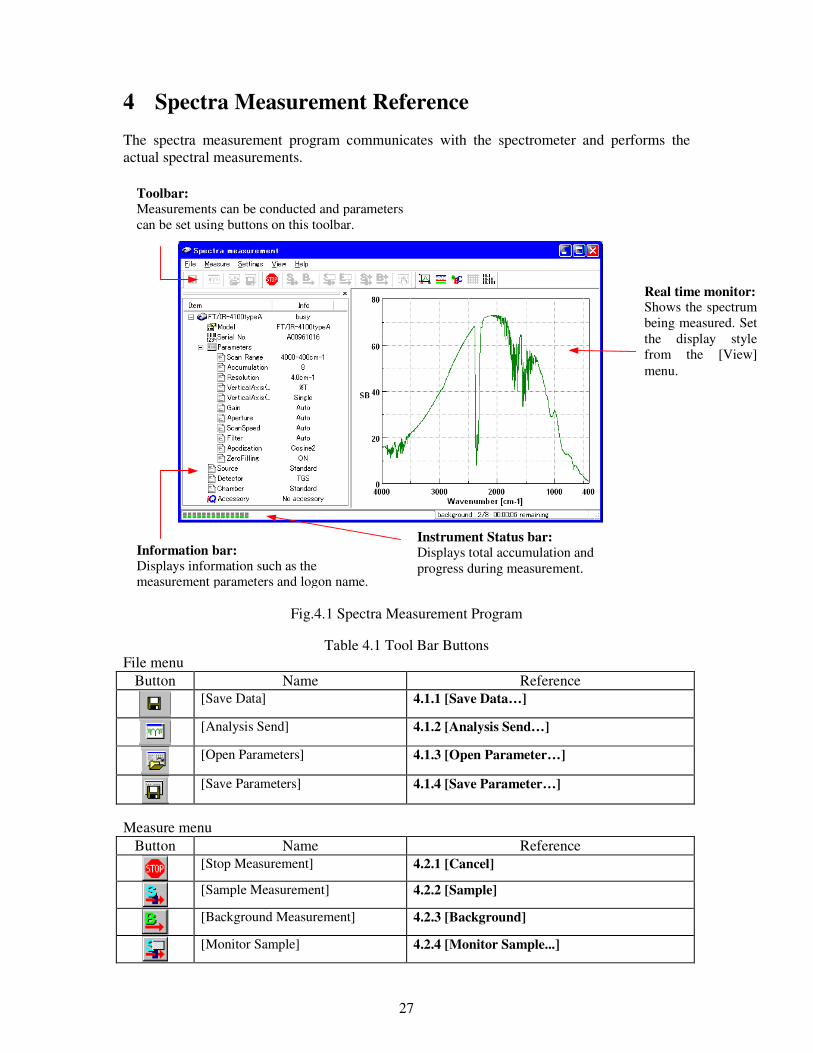
4 Spectra Measurement Reference The spectra measurement program communicates with the spectrometer and performs the actual spectral measurements.
Fig.4.1 Spectra Measurement Program
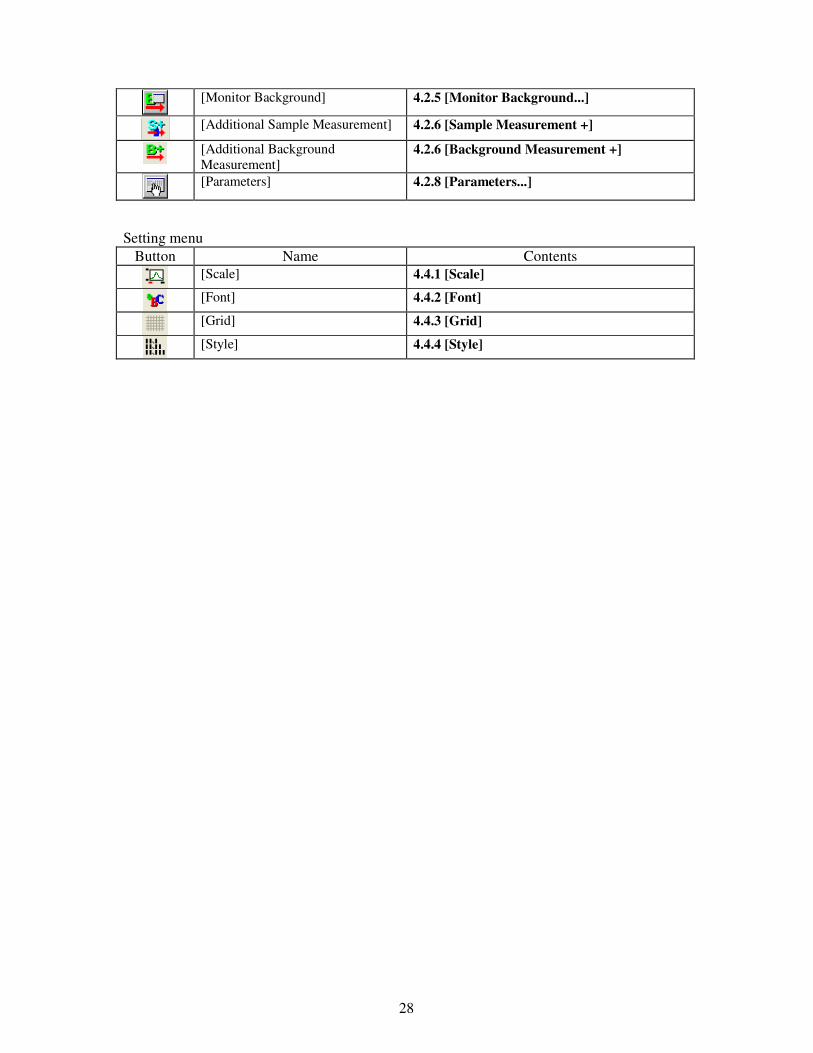
Table 4.1 Tool Bar Buttons File menu
Button Name Reference
[Save Data] 4.1.1 [Save Data…]
[Analysis Send] 4.1.2 [Analysis Send…]
[Open Parameters] 4.1.3 [Open Parameter…]
[Save Parameters] 4.1.4 [Save Parameter…]
Measure menu
Button Name Reference
[Stop Measurement] 4.2.1 [Cancel]
[Sample Measurement] 4.2.2 [Sample]
[Background Measurement] 4.2.3 [Background]
[Monitor Sample] 4.2.4 [Monitor Sample...]
Toolbar: Measurements can be conducted and parameters can be set using buttons on this toolbar.
Real time monitor: Shows the spectrum being measured. Set the display style from the [View]menu.
Information bar: Displays information such as the measurement parameters and logon name.
Instrument Status bar: Displays total accumulation and progress during measurement.
28
[Monitor Background] 4.2.5 [Monitor Background...]
[Additional Sample Measurement] 4.2.6 [Sample Measurement +]
[Additional Background Measurement]
4.2.6 [Background Measurement +]
[Parameters] 4.2.8 [Parameters...]
Setting menu
Button Name Contents
[Scale] 4.4.1 [Scale]
[Font] 4.4.2 [Font]
[Grid] 4.4.3 [Grid]
[Style] 4.4.4 [Style]
29
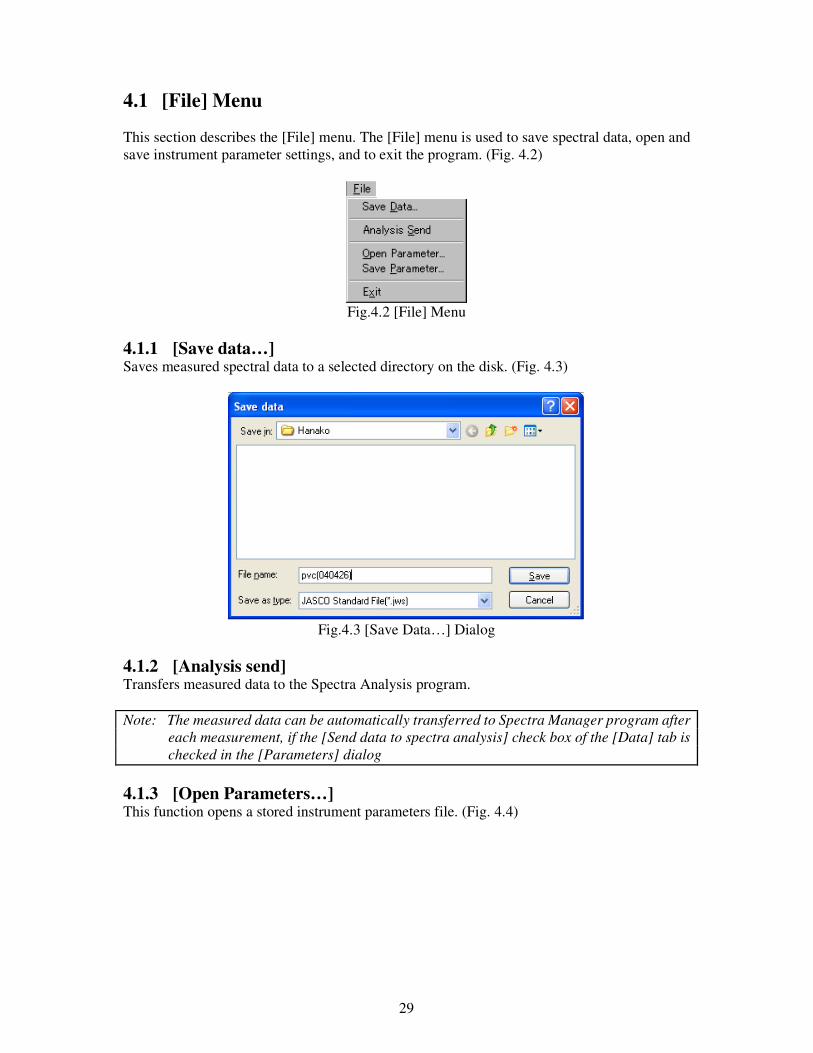
4.1 [File] Menu This section describes the [File] menu. The [File] menu is used to save spectral data, open and save instrument parameter settings, and to exit the program. (Fig. 4.2)
Fig.4.2 [File] Menu
4.1.1 [Save data…] Saves measured spectral data to a selected directory on the disk. (Fig. 4.3)
Fig.4.3 [Save Data…] Dialog
4.1.2 [Analysis send] Transfers measured data to the Spectra Analysis program. Note: The measured data can be automatically transferred to Spectra Manager program after
each measurement, if the [Send data to spectra analysis] check box of the [Data] tab is checked in the [Parameters] dialog
4.1.3 [Open Parameters…] This function opens a stored instrument parameters file. (Fig. 4.4)
30
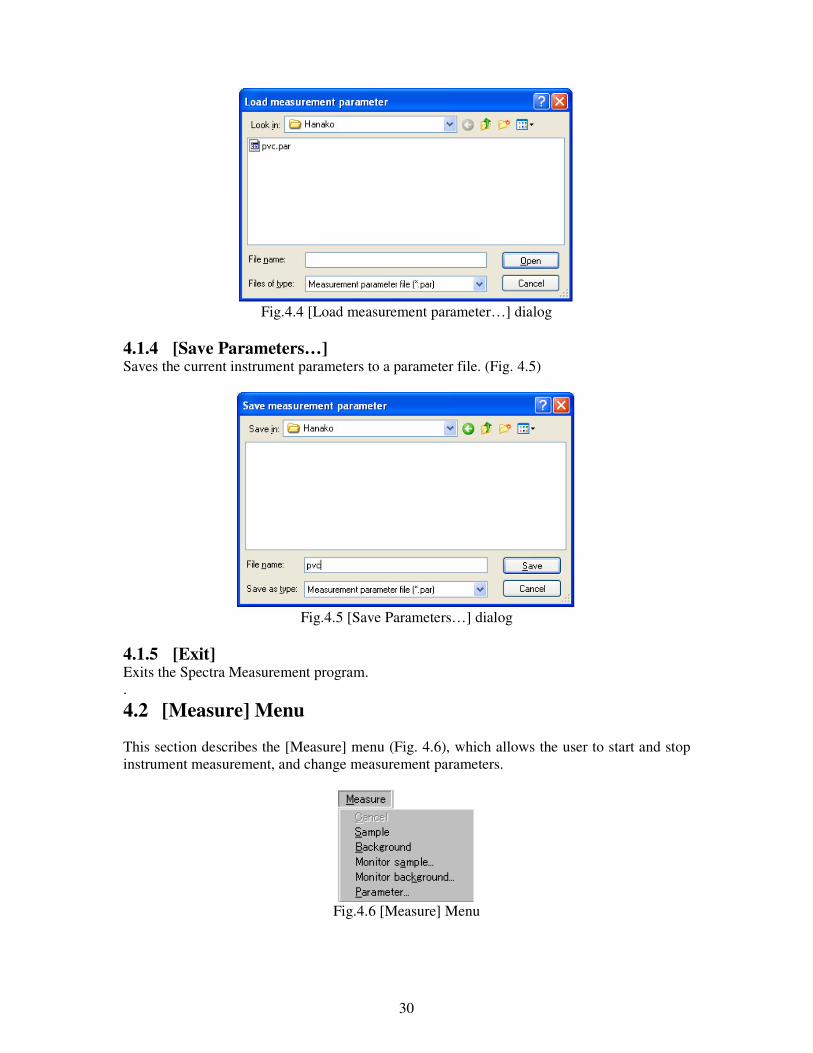
Fig.4.4 [Load measurement parameter…] dialog
4.1.4 [Save Parameters…] Saves the current instrument parameters to a parameter file. (Fig. 4.5)
Fig.4.5 [Save Parameters…] dialog
4.1.5 [Exit] Exits the Spectra Measurement program. . 4.2 [Measure] Menu This section describes the [Measure] menu (Fig. 4.6), which allows the user to start and stop instrument measurement, and change measurement parameters.
Fig.4.6 [Measure] Menu
31
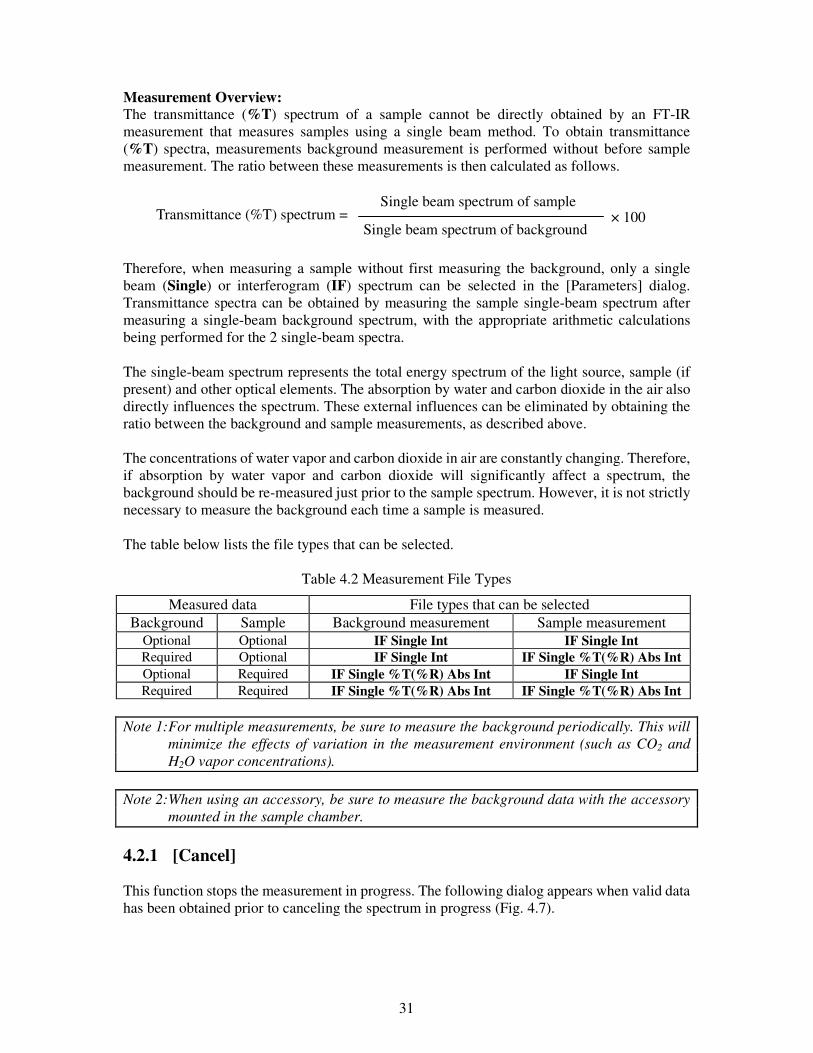
Measurement Overview: The transmittance (%T) spectrum of a sample cannot be directly obtained by an FT-IR measurement that measures samples using a single beam method. To obtain transmittance (%T) spectra, measurements background measurement is performed without before sample measurement. The ratio between these measurements is then calculated as follows.
Transmittance (%T) spectrum =Single beam spectrum of background
Single beam spectrum of sample× 100
Therefore, when measuring a sample without first measuring the background, only a single beam (Single) or interferogram (IF) spectrum can be selected in the [Parameters] dialog. Transmittance spectra can be obtained by measuring the sample single-beam spectrum after measuring a single-beam background spectrum, with the appropriate arithmetic calculations being performed for the 2 single-beam spectra. The single-beam spectrum represents the total energy spectrum of the light source, sample (if present) and other optical elements. The absorption by water and carbon dioxide in the air also directly influences the spectrum. These external influences can be eliminated by obtaining the ratio between the background and sample measurements, as described above. The concentrations of water vapor and carbon dioxide in air are constantly changing. Therefore, if absorption by water vapor and carbon dioxide will significantly affect a spectrum, the background should be re-measured just prior to the sample spectrum. However, it is not strictly necessary to measure the background each time a sample is measured. The table below lists the file types that can be selected.
Table 4.2 Measurement File Types
Measured data File types that can be selected Background Sample Background measurement Sample measurement
Optional Optional IF Single Int IF Single Int Required Optional IF Single Int IF Single %T(%R) Abs Int Optional Required IF Single %T(%R) Abs Int IF Single Int Required Required IF Single %T(%R) Abs Int IF Single %T(%R) Abs Int
Note 1: For multiple measurements, be sure to measure the background periodically. This will
minimize the effects of variation in the measurement environment (such as CO2 and H2O vapor concentrations).
Note 2: When using an accessory, be sure to measure the background data with the accessory
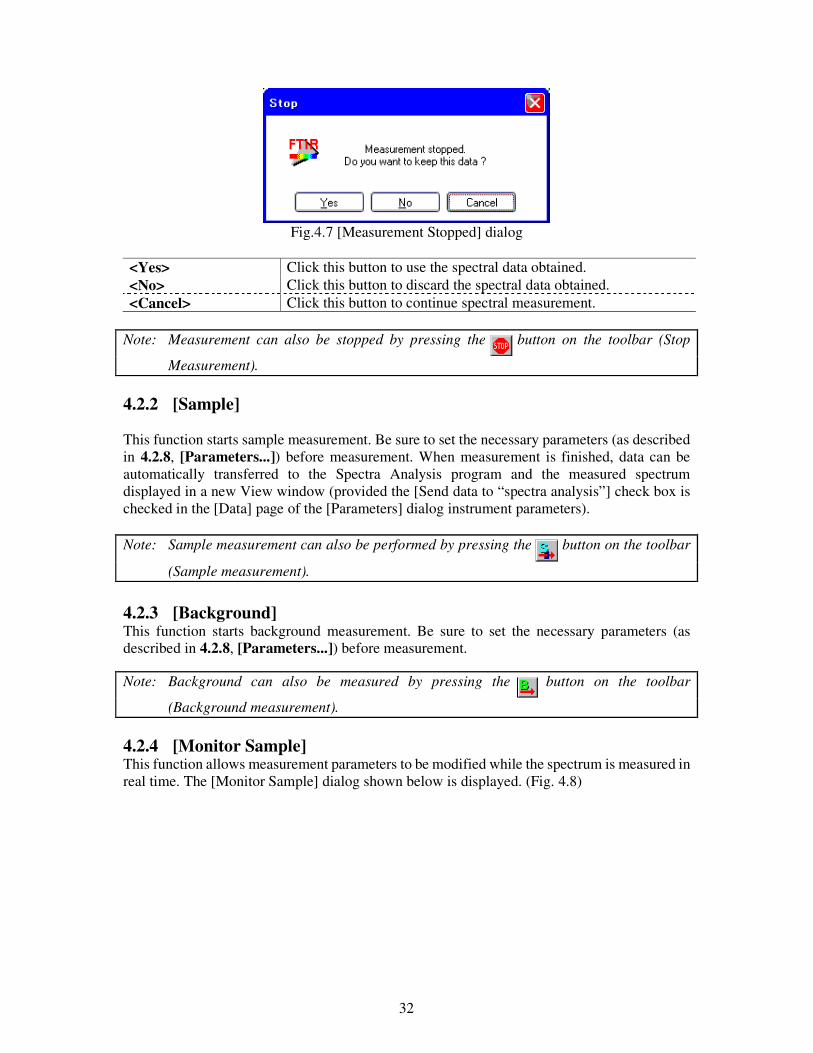
mounted in the sample chamber. 4.2.1 [Cancel] This function stops the measurement in progress. The following dialog appears when valid data has been obtained prior to canceling the spectrum in progress (Fig. 4.7).
32
Fig.4.7 [Measurement Stopped] dialog
<Yes> Click this button to use the spectral data obtained. <No> Click this button to discard the spectral data obtained. <Cancel> Click this button to continue spectral measurement.
Note: Measurement can also be stopped by pressing the button on the toolbar (Stop
Measurement). 4.2.2 [Sample] This function starts sample measurement. Be sure to set the necessary parameters (as described in 4.2.8, [Parameters...]) before measurement. When measurement is finished, data can be automatically transferred to the Spectra Analysis program and the measured spectrum displayed in a new View window (provided the [Send data to “spectra analysis”] check box is checked in the [Data] page of the [Parameters] dialog instrument parameters). Note: Sample measurement can also be performed by pressing the button on the toolbar
(Sample measurement). 4.2.3 [Background] This function starts background measurement. Be sure to set the necessary parameters (as described in 4.2.8, [Parameters...]) before measurement. Note: Background can also be measured by pressing the button on the toolbar
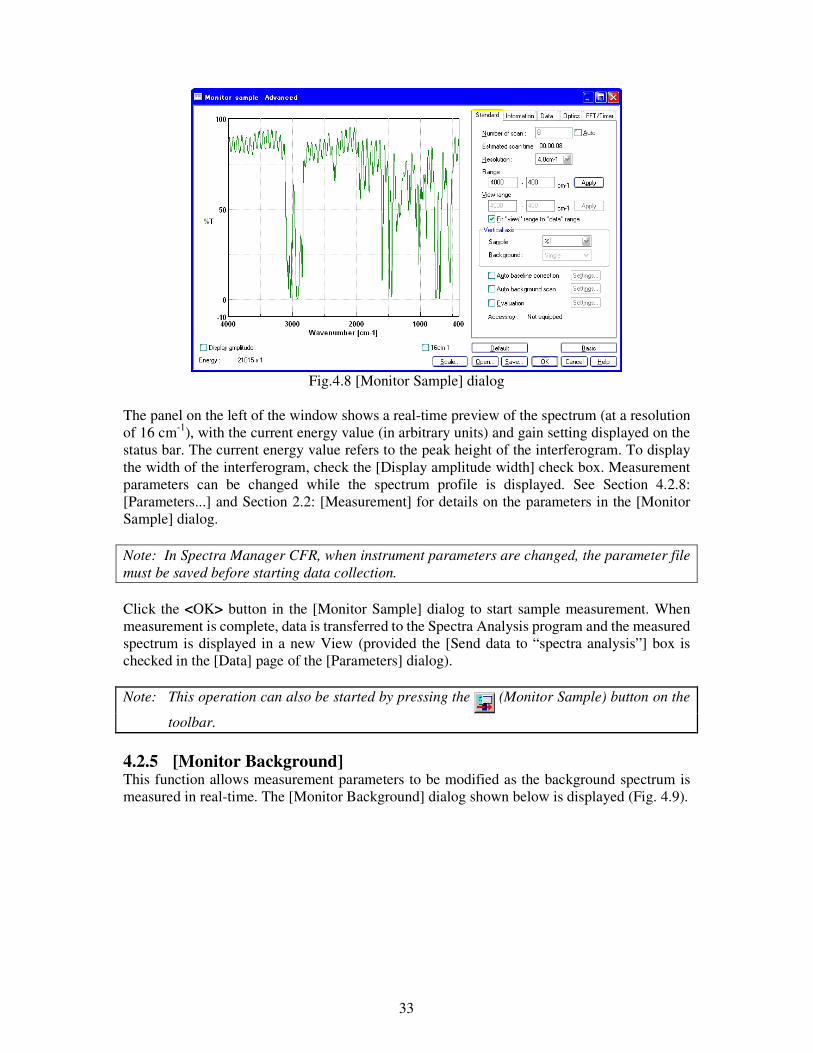
(Background measurement). 4.2.4 [Monitor Sample] This function allows measurement parameters to be modified while the spectrum is measured in real time. The [Monitor Sample] dialog shown below is displayed. (Fig. 4.8)
33
Fig.4.8 [Monitor Sample] dialog
The panel on the left of the window shows a real-time preview of the spectrum (at a resolution of 16 cm-1), with the current energy value (in arbitrary units) and gain setting displayed on the status bar. The current energy value refers to the peak height of the interferogram. To display the width of the interferogram, check the [Display amplitude width] check box. Measurement parameters can be changed while the spectrum profile is displayed. See Section 4.2.8: [Parameters...] and Section 2.2: [Measurement] for details on the parameters in the [Monitor Sample] dialog. Note: In Spectra Manager CFR, when instrument parameters are changed, the parameter file must be saved before starting data collection. Click the <OK> button in the [Monitor Sample] dialog to start sample measurement. When measurement is complete, data is transferred to the Spectra Analysis program and the measured spectrum is displayed in a new View (provided the [Send data to “spectra analysis”] box is checked in the [Data] page of the [Parameters] dialog). Note: This operation can also be started by pressing the (Monitor Sample) button on the
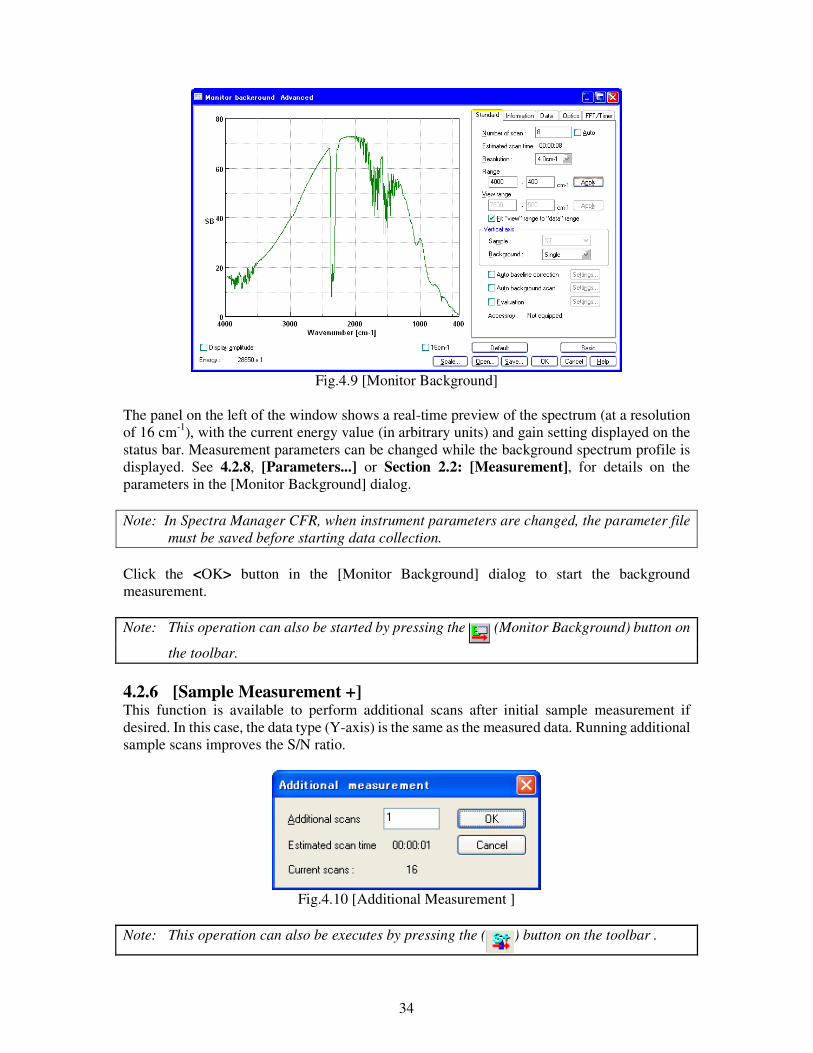
toolbar. 4.2.5 [Monitor Background] This function allows measurement parameters to be modified as the background spectrum is measured in real-time. The [Monitor Background] dialog shown below is displayed (Fig. 4.9).
34
Fig.4.9 [Monitor Background]
The panel on the left of the window shows a real-time preview of the spectrum (at a resolution of 16 cm-1), with the current energy value (in arbitrary units) and gain setting displayed on the status bar. Measurement parameters can be changed while the background spectrum profile is displayed. See 4.2.8, [Parameters...] or Section 2.2: [Measurement], for details on the parameters in the [Monitor Background] dialog. Note: In Spectra Manager CFR, when instrument parameters are changed, the parameter file
must be saved before starting data collection. Click the <OK> button in the [Monitor Background] dialog to start the background measurement. Note: This operation can also be started by pressing the (Monitor Background) button on
the toolbar. 4.2.6 [Sample Measurement +] This function is available to perform additional scans after initial sample measurement if desired. In this case, the data type (Y-axis) is the same as the measured data. Running additional sample scans improves the S/N ratio.
Fig.4.10 [Additional Measurement ]
Note: This operation can also be executes by pressing the ( ) button on the toolbar .
35
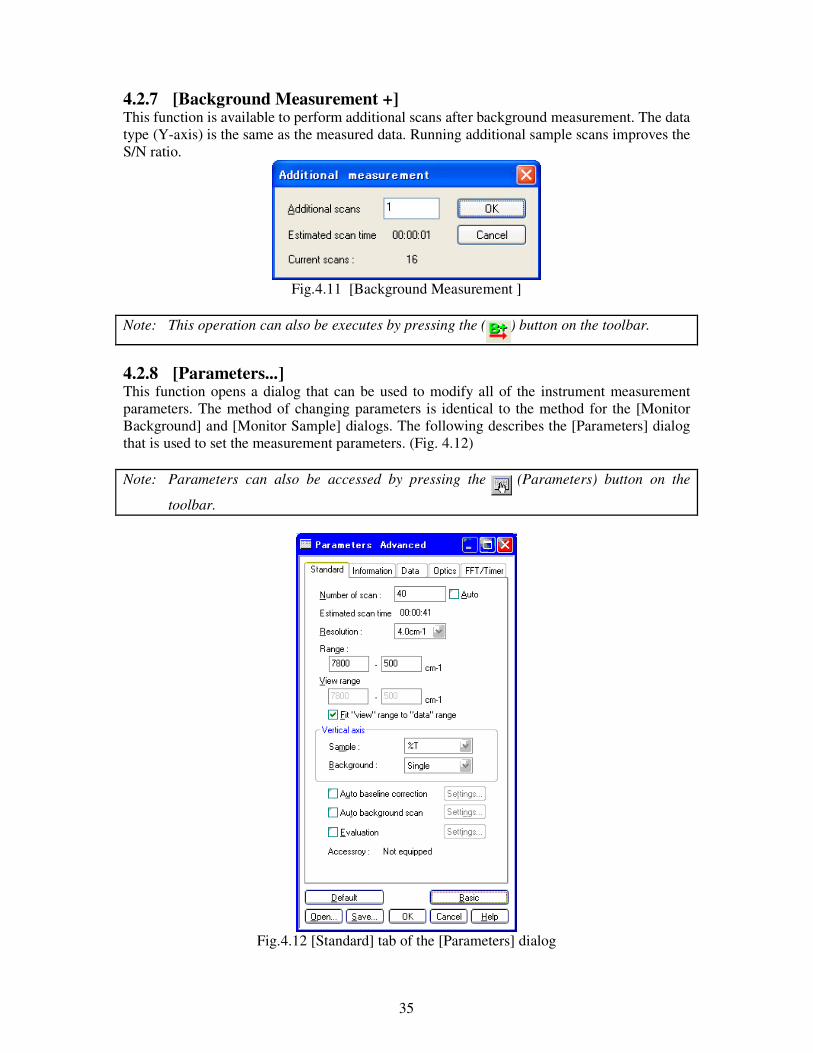
4.2.7 [Background Measurement +] This function is available to perform additional scans after background measurement. The data type (Y-axis) is the same as the measured data. Running additional sample scans improves the S/N ratio.
Fig.4.11 [Background Measurement ]
Note: This operation can also be executes by pressing the ( ) button on the toolbar.
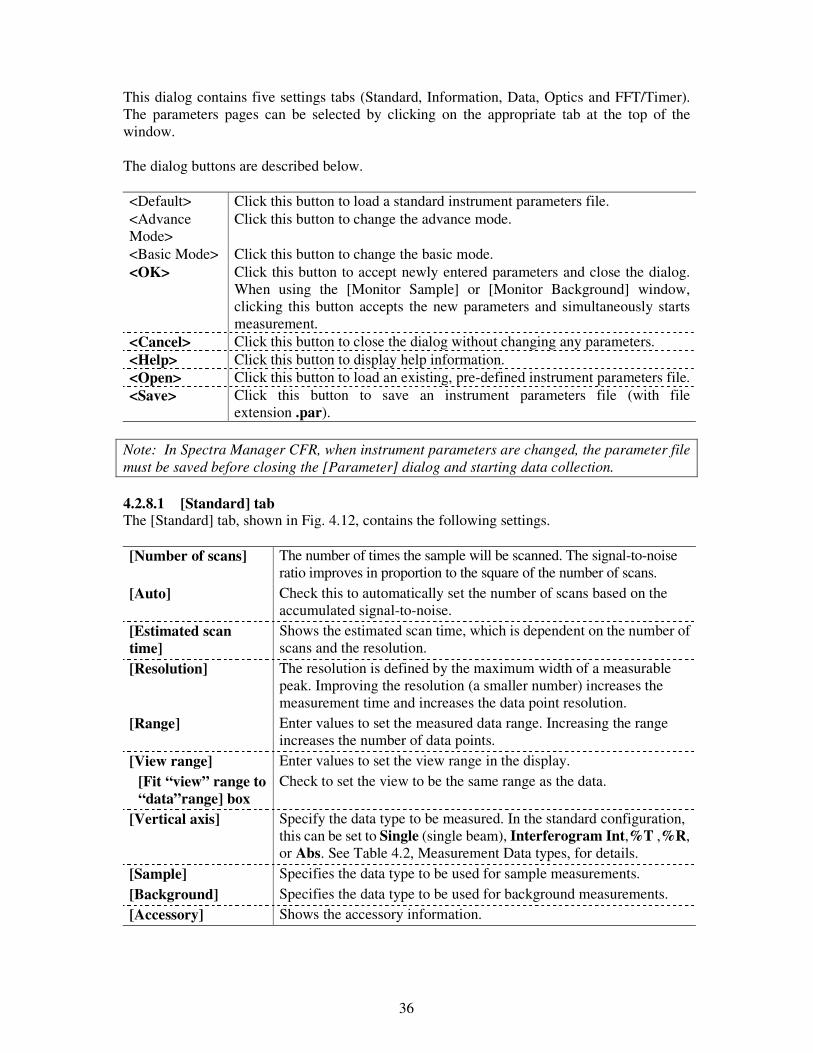
4.2.8 [Parameters...] This function opens a dialog that can be used to modify all of the instrument measurement parameters. The method of changing parameters is identical to the method for the [Monitor Background] and [Monitor Sample] dialogs. The following describes the [Parameters] dialog that is used to set the measurement parameters. (Fig. 4.12) Note: Parameters can also be accessed by pressing the (Parameters) button on the
toolbar.
Fig.4.12 [Standard] tab of the [Parameters] dialog
36
This dialog contains five settings tabs (Standard, Information, Data, Optics and FFT/Timer). The parameters pages can be selected by clicking on the appropriate tab at the top of the window. The dialog buttons are described below. <Default> Click this button to load a standard instrument parameters file. <Advance Mode>
Click this button to change the advance mode.
<Basic Mode> Click this button to change the basic mode. <OK> Click this button to accept newly entered parameters and close the dialog.
When using the [Monitor Sample] or [Monitor Background] window, clicking this button accepts the new parameters and simultaneously starts measurement.
<Cancel> Click this button to close the dialog without changing any parameters. <Help> Click this button to display help information. <Open> Click this button to load an existing, pre-defined instrument parameters file. <Save> Click this button to save an instrument parameters file (with file
extension .par). Note: In Spectra Manager CFR, when instrument parameters are changed, the parameter file must be saved before closing the [Parameter] dialog and starting data collection. 4.2.8.1 [Standard] tab The [Standard] tab, shown in Fig. 4.12, contains the following settings.
[Number of scans] The number of times the sample will be scanned. The signal-to-noise
ratio improves in proportion to the square of the number of scans. [Auto] Check this to automatically set the number of scans based on the
accumulated signal-to-noise. [Estimated scan time]
Shows the estimated scan time, which is dependent on the number of scans and the resolution.
[Resolution] The resolution is defined by the maximum width of a measurable peak. Improving the resolution (a smaller number) increases the measurement time and increases the data point resolution.
[Range] Enter values to set the measured data range. Increasing the range increases the number of data points.
[View range] Enter values to set the view range in the display. [Fit “view” range to “data”range] box
Check to set the view to be the same range as the data.
[Vertical axis] Specify the data type to be measured. In the standard configuration, this can be set to Single (single beam), Interferogram Int,%T ,%R, or Abs. See Table 4.2, Measurement Data types, for details.
[Sample] Specifies the data type to be used for sample measurements. [Background] Specifies the data type to be used for background measurements. [Accessory] Shows the accessory information.
37
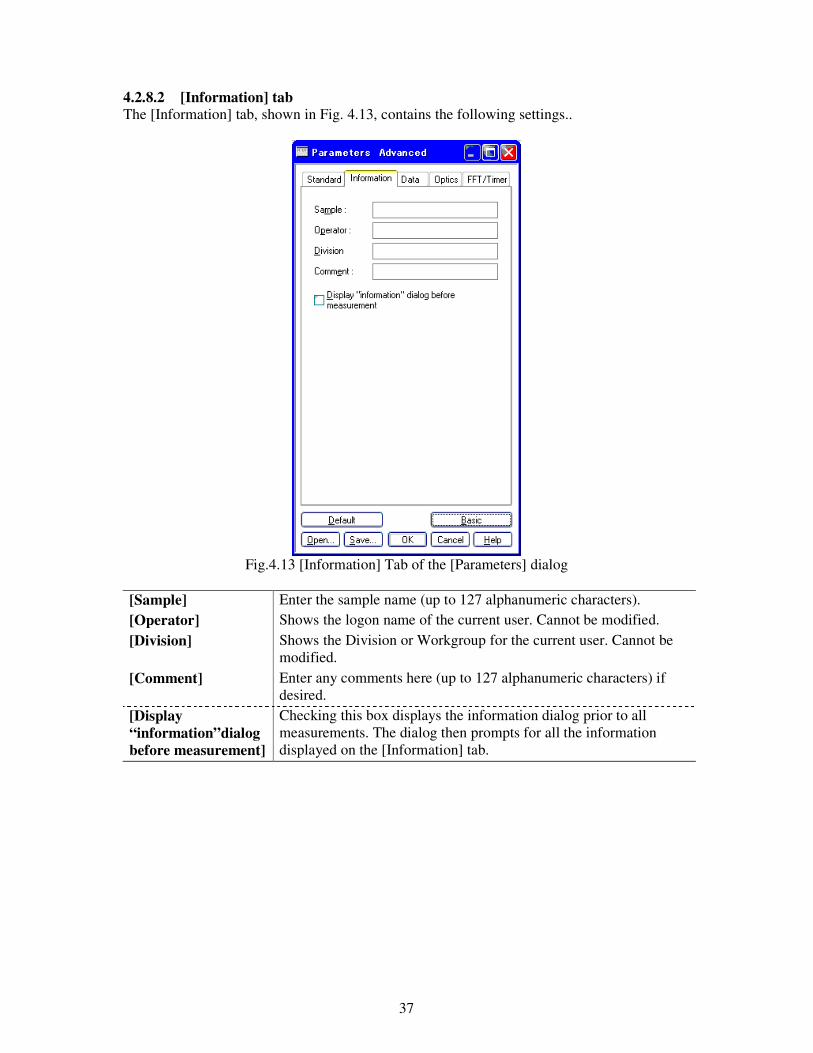
4.2.8.2 [Information] tab The [Information] tab, shown in Fig. 4.13, contains the following settings..
Fig.4.13 [Information] Tab of the [Parameters] dialog
[Sample] Enter the sample name (up to 127 alphanumeric characters). [Operator] Shows the logon name of the current user. Cannot be modified. [Division] Shows the Division or Workgroup for the current user. Cannot be
modified. [Comment] Enter any comments here (up to 127 alphanumeric characters) if
desired. [Display “information”dialog before measurement]
Checking this box displays the information dialog prior to all measurements. The dialog then prompts for all the information displayed on the [Information] tab.
38
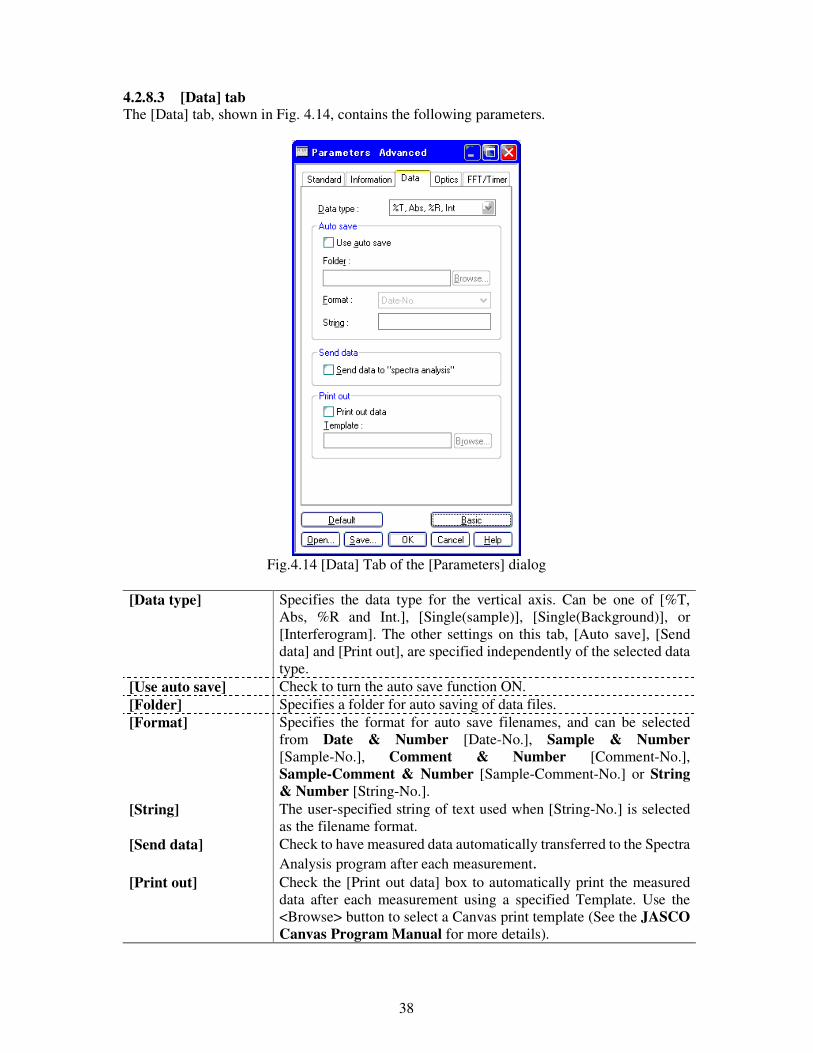
4.2.8.3 [Data] tab The [Data] tab, shown in Fig. 4.14, contains the following parameters.
Fig.4.14 [Data] Tab of the [Parameters] dialog
[Data type] Specifies the data type for the vertical axis. Can be one of [%T,
Abs, %R and Int.], [Single(sample)], [Single(Background)], or [Interferogram]. The other settings on this tab, [Auto save], [Send data] and [Print out], are specified independently of the selected data type.
[Use auto save] Check to turn the auto save function ON. [Folder] Specifies a folder for auto saving of data files. [Format] Specifies the format for auto save filenames, and can be selected
from Date & Number [Date-No.], Sample & Number [Sample-No.], Comment & Number [Comment-No.], Sample-Comment & Number [Sample-Comment-No.] or String & Number [String-No.].
[String] The user-specified string of text used when [String-No.] is selected as the filename format.
[Send data] Check to have measured data automatically transferred to the Spectra Analysis program after each measurement.
[Print out] Check the [Print out data] box to automatically print the measured data after each measurement using a specified Template. Use the <Browse> button to select a Canvas print template (See the JASCO Canvas Program Manual for more details).
39
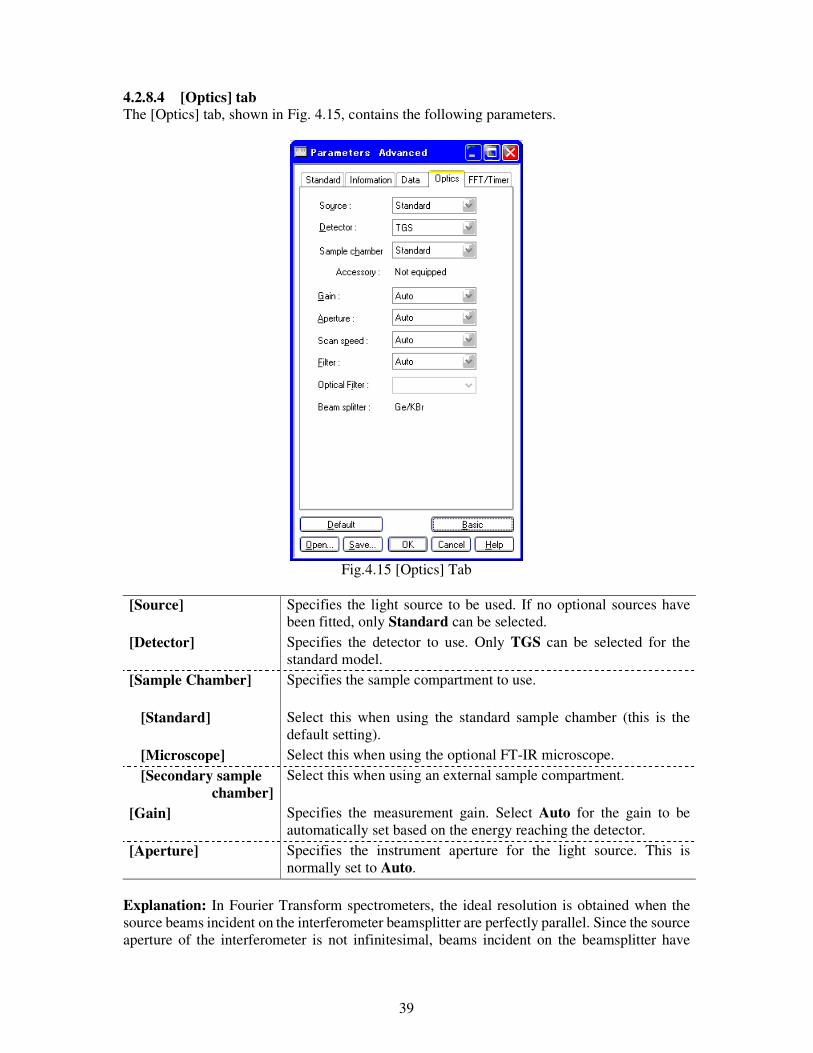
4.2.8.4 [Optics] tab The [Optics] tab, shown in Fig. 4.15, contains the following parameters.
Fig.4.15 [Optics] Tab
[Source] Specifies the light source to be used. If no optional sources have
been fitted, only Standard can be selected. [Detector] Specifies the detector to use. Only TGS can be selected for the
standard model. [Sample Chamber]
Specifies the sample compartment to use.
[Standard] Select this when using the standard sample chamber (this is the default setting).
[Microscope] Select this when using the optional FT-IR microscope. [Secondary sample
chamber] Select this when using an external sample compartment.
[Gain] Specifies the measurement gain. Select Auto for the gain to be automatically set based on the energy reaching the detector.
[Aperture] Specifies the instrument aperture for the light source. This is normally set to Auto.
Explanation: In Fourier Transform spectrometers, the ideal resolution is obtained when the source beams incident on the interferometer beamsplitter are perfectly parallel. Since the source aperture of the interferometer is not infinitesimal, beams incident on the beamsplitter have
40
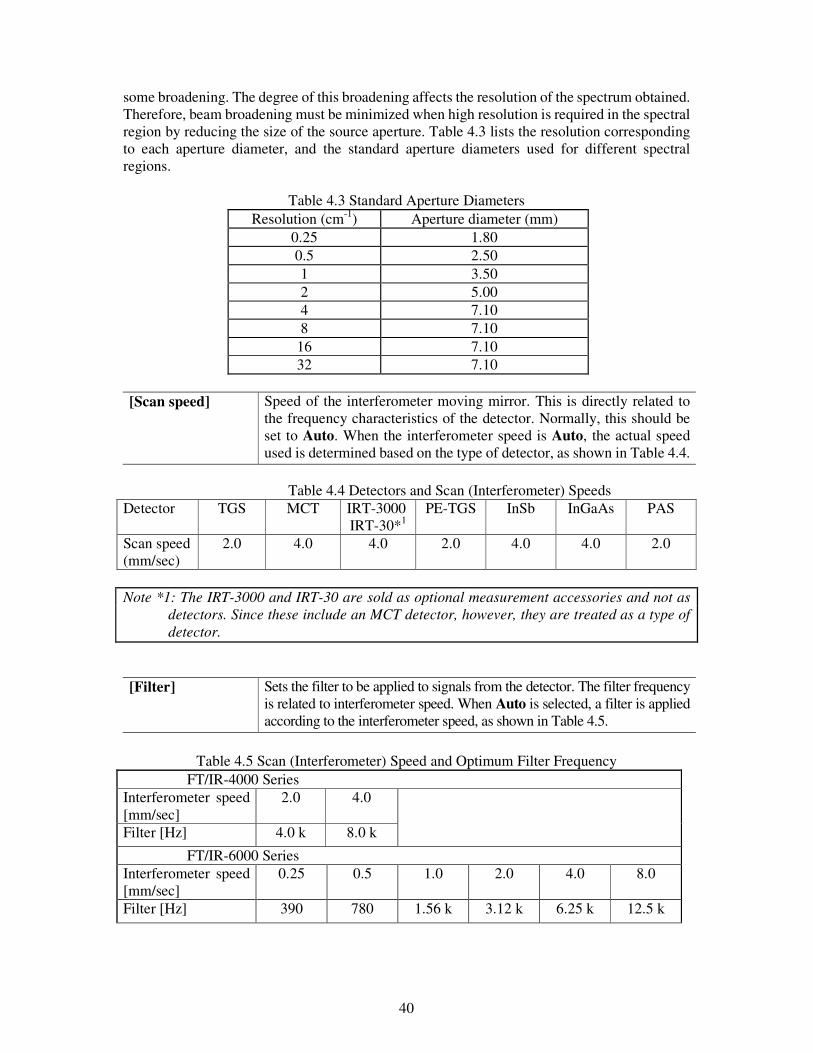
some broadening. The degree of this broadening affects the resolution of the spectrum obtained. Therefore, beam broadening must be minimized when high resolution is required in the spectral region by reducing the size of the source aperture. Table 4.3 lists the resolution corresponding to each aperture diameter, and the standard aperture diameters used for different spectral regions.
Table 4.3 Standard Aperture Diameters Resolution (cm-1) Aperture diameter (mm)
0.25 1.80 0.5 2.50 1 3.50 2 5.00 4 7.10 8 7.10
16 7.10 32 7.10
[Scan speed] Speed of the interferometer moving mirror. This is directly related to
the frequency characteristics of the detector. Normally, this should be set to Auto. When the interferometer speed is Auto, the actual speed used is determined based on the type of detector, as shown in Table 4.4.
Table 4.4 Detectors and Scan (Interferometer) Speeds
Detector TGS MCT IRT-3000 IRT-30*1
PE-TGS InSb InGaAs PAS
Scan speed (mm/sec)
2.0 4.0 4.0 2.0 4.0 4.0 2.0
Note *1: The IRT-3000 and IRT-30 are sold as optional measurement accessories and not as
detectors. Since these include an MCT detector, however, they are treated as a type of detector.
[Filter] Sets the filter to be applied to signals from the detector. The filter frequency
is related to interferometer speed. When Auto is selected, a filter is applied according to the interferometer speed, as shown in Table 4.5.
Table 4.5 Scan (Interferometer) Speed and Optimum Filter Frequency
FT/IR-4000 Series Interferometer speed [mm/sec]
2.0 4.0
Filter [Hz] 4.0 k 8.0 k
FT/IR-6000 Series Interferometer speed [mm/sec]
0.25 0.5 1.0 2.0 4.0 8.0
Filter [Hz] 390 780 1.56 k 3.12 k 6.25 k 12.5 k
41
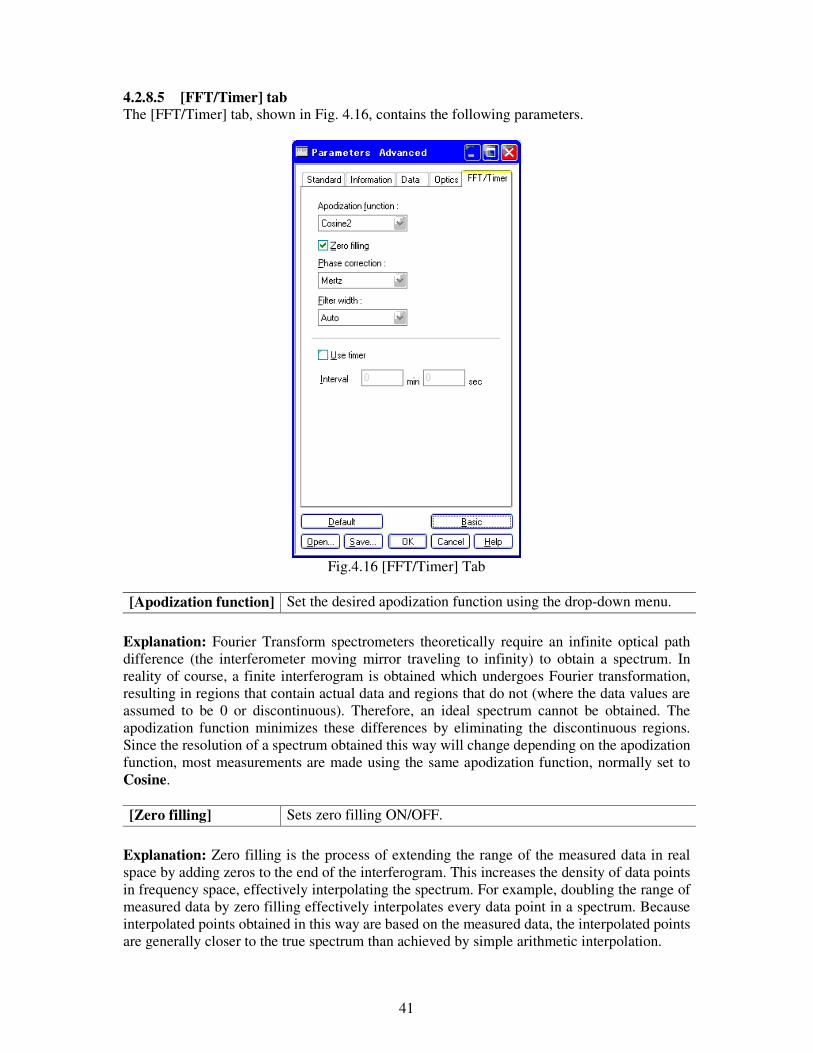
4.2.8.5 [FFT/Timer] tab The [FFT/Timer] tab, shown in Fig. 4.16, contains the following parameters.
Fig.4.16 [FFT/Timer] Tab
[Apodization function] Set the desired apodization function using the drop-down menu.
Explanation: Fourier Transform spectrometers theoretically require an infinite optical path difference (the interferometer moving mirror traveling to infinity) to obtain a spectrum. In reality of course, a finite interferogram is obtained which undergoes Fourier transformation, resulting in regions that contain actual data and regions that do not (where the data values are assumed to be 0 or discontinuous). Therefore, an ideal spectrum cannot be obtained. The apodization function minimizes these differences by eliminating the discontinuous regions. Since the resolution of a spectrum obtained this way will change depending on the apodization function, most measurements are made using the same apodization function, normally set to Cosine. [Zero filling] Sets zero filling ON/OFF.
Explanation: Zero filling is the process of extending the range of the measured data in real space by adding zeros to the end of the interferogram. This increases the density of data points in frequency space, effectively interpolating the spectrum. For example, doubling the range of measured data by zero filling effectively interpolates every data point in a spectrum. Because interpolated points obtained in this way are based on the measured data, the interpolated points are generally closer to the true spectrum than achieved by simple arithmetic interpolation.

42
[Phase correction] Sets the desired phase correction here. Explanation: Theoretically, FTIR interferograms are symmetric about the zero point of the optical path difference. However, an interferogram measured by an actual FT-IR is asymmetric due to minor errors in optical alignments and/or electrical circuit characteristics. Phase correction is performed, in which asymmetric results are transformed to a symmetric interferogram using phase information at the zero point of the optical path difference. Corrected interferograms are converted to IR spectra using cosign conversion (FFT). Normally, this should be set to the Mertz method of phase correction. In the case of Far-Infrared measurement (<100cm-1) in which phase correction is unable to be performed, use the Power method. [Filter width] Specified the calculation range of the phase correction. Normally,
this should be set to Auto. [Use timer] Specifies whether the timer is used (ON/OFF). When the [Use
timer] box is checked, wait time can be set as follows. [Interval] Wait time is the time from when the <OK> button is clicked to
when the actual measurement begins. This can be used as required to obtain spectra of samples that change over a specified period of time, i.e., when using an instrument purge or following the initiation of a kinetics experiment.
4.3 [Settings] Menu This section describes the [Settings] menu, shown below (Fig. 4.17).
Fig.4.17 [Settings] Menu
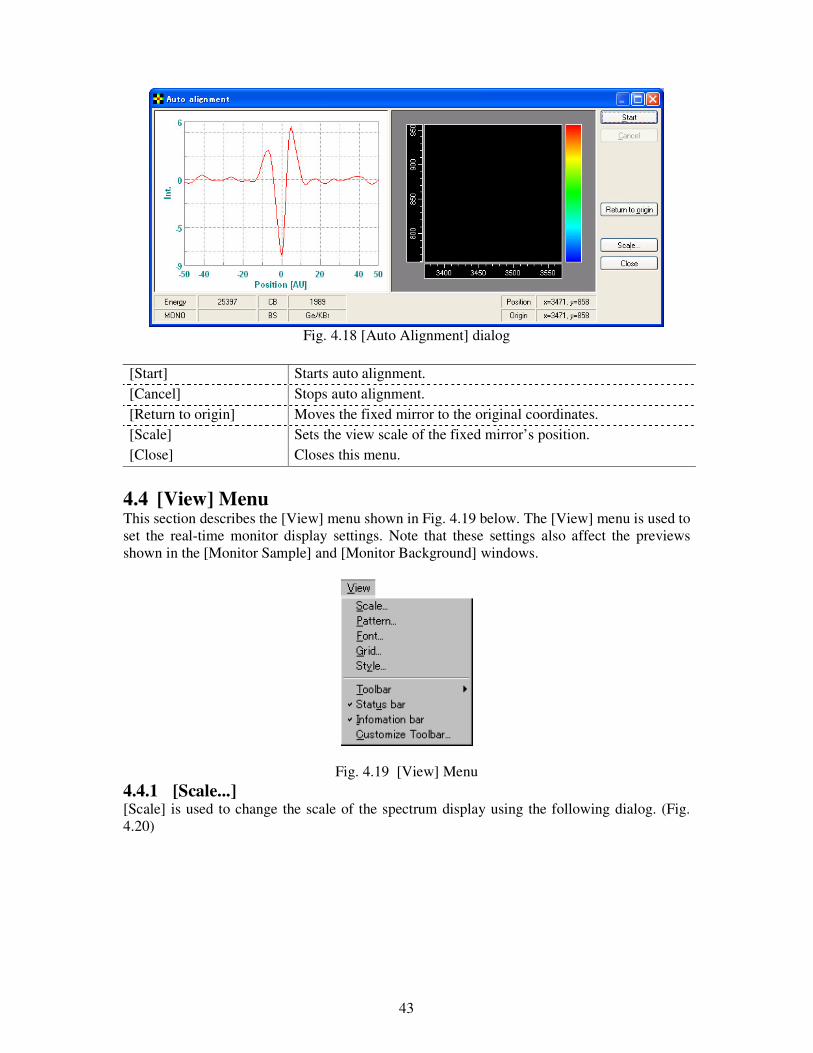
4.3.1 [Auto Align…] The [Auto Align…] function automatically aligns the fixed mirror to the optimum position where maximum energy is obtained with the interferometer (Fig. 4.18). This function should be used when the energy from the interferometer has decreased for any reason, such as when the spectrometer is moved, has not been used for an extended period of time, or when the beam splitter (BS) of the interferometer has been changed to access another spectral region. Refer to the FT/IR-6000 hardware manual for details on changing the instrument beam splitter.
43
Fig. 4.18 [Auto Alignment] dialog
[Start] Starts auto alignment. [Cancel] Stops auto alignment. [Return to origin] Moves the fixed mirror to the original coordinates. [Scale] Sets the view scale of the fixed mirror’s position. [Close] Closes this menu.
4.4 [View] Menu This section describes the [View] menu shown in Fig. 4.19 below. The [View] menu is used to set the real-time monitor display settings. Note that these settings also affect the previews shown in the [Monitor Sample] and [Monitor Background] windows.
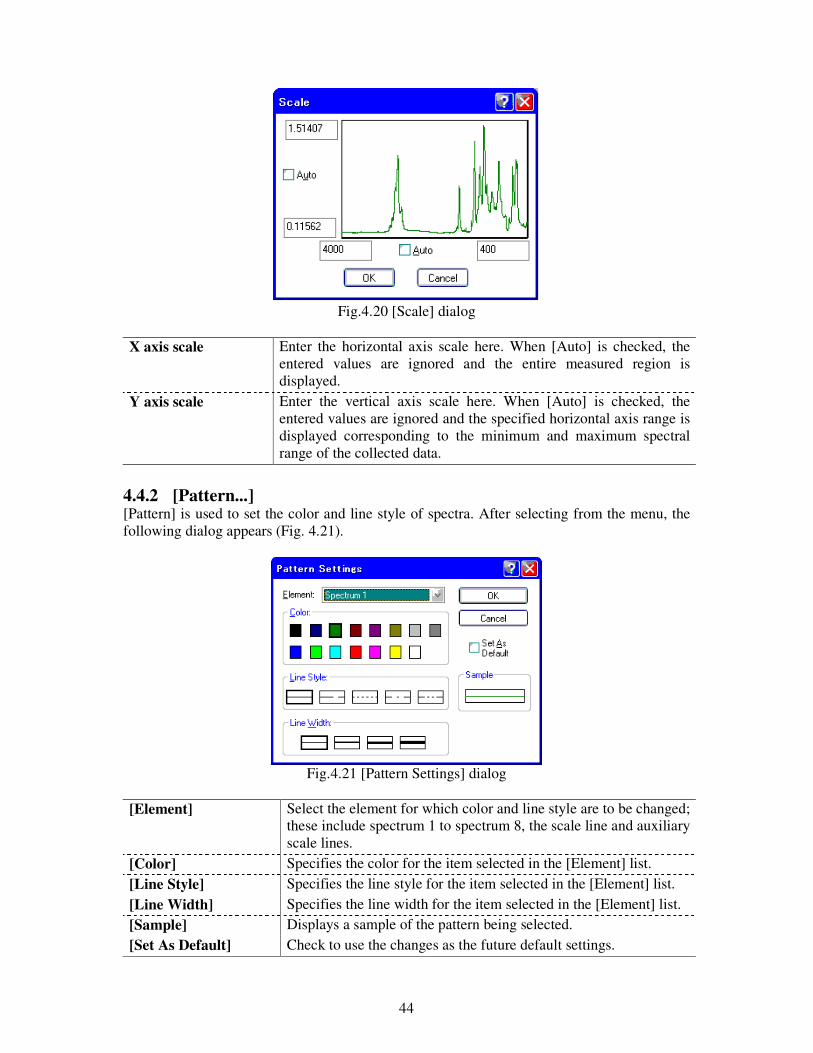
Fig. 4.19 [View] Menu 4.4.1 [Scale...] [Scale] is used to change the scale of the spectrum display using the following dialog. (Fig. 4.20)
44
Fig.4.20 [Scale] dialog
X axis scale Enter the horizontal axis scale here. When [Auto] is checked, the
entered values are ignored and the entire measured region is displayed.
Y axis scale Enter the vertical axis scale here. When [Auto] is checked, the entered values are ignored and the specified horizontal axis range is displayed corresponding to the minimum and maximum spectral range of the collected data.
4.4.2 [Pattern...] [Pattern] is used to set the color and line style of spectra. After selecting from the menu, the following dialog appears (Fig. 4.21).
Fig.4.21 [Pattern Settings] dialog
[Element] Select the element for which color and line style are to be changed;
these include spectrum 1 to spectrum 8, the scale line and auxiliary scale lines.
[Color] Specifies the color for the item selected in the [Element] list. [Line Style] Specifies the line style for the item selected in the [Element] list. [Line Width] Specifies the line width for the item selected in the [Element] list. [Sample] Displays a sample of the pattern being selected. [Set As Default] Check to use the changes as the future default settings.
45
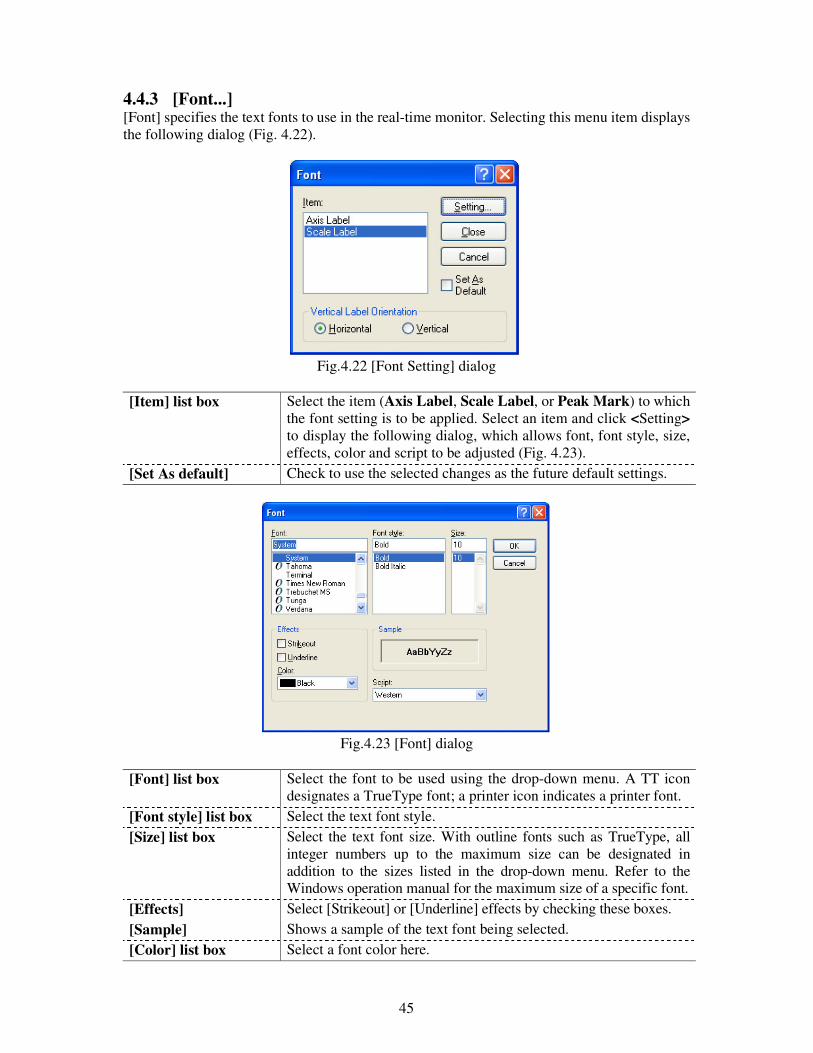
4.4.3 [Font...] [Font] specifies the text fonts to use in the real-time monitor. Selecting this menu item displays the following dialog (Fig. 4.22).
Fig.4.22 [Font Setting] dialog
[Item] list box Select the item (Axis Label, Scale Label, or Peak Mark) to which
the font setting is to be applied. Select an item and click <Setting> to display the following dialog, which allows font, font style, size, effects, color and script to be adjusted (Fig. 4.23).
[Set As default] Check to use the selected changes as the future default settings.
Fig.4.23 [Font] dialog
[Font] list box Select the font to be used using the drop-down menu. A TT icon
designates a TrueType font; a printer icon indicates a printer font. [Font style] list box Select the text font style. [Size] list box Select the text font size. With outline fonts such as TrueType, all
integer numbers up to the maximum size can be designated in addition to the sizes listed in the drop-down menu. Refer to the Windows operation manual for the maximum size of a specific font.
[Effects] Select [Strikeout] or [Underline] effects by checking these boxes. [Sample] Shows a sample of the text font being selected. [Color] list box Select a font color here.
46
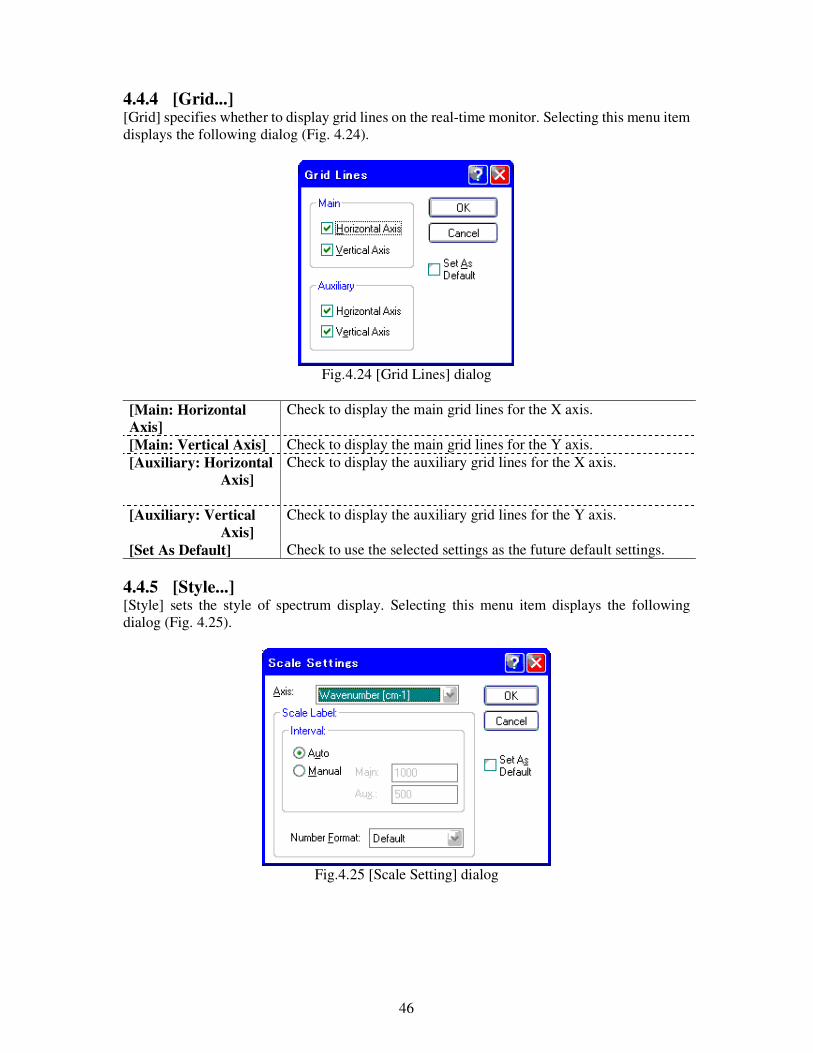
4.4.4 [Grid...] [Grid] specifies whether to display grid lines on the real-time monitor. Selecting this menu item displays the following dialog (Fig. 4.24).
Fig.4.24 [Grid Lines] dialog
[Main: Horizontal Axis]
Check to display the main grid lines for the X axis.
[Main: Vertical Axis] Check to display the main grid lines for the Y axis. [Auxiliary: Horizontal
Axis]
Check to display the auxiliary grid lines for the X axis.
[Auxiliary: Vertical Axis]
Check to display the auxiliary grid lines for the Y axis.
[Set As Default] Check to use the selected settings as the future default settings. 4.4.5 [Style...] [Style] sets the style of spectrum display. Selecting this menu item displays the following dialog (Fig. 4.25).
Fig.4.25 [Scale Setting] dialog
47
[Axis] Select the horizontal or vertical axis setting style using the drop-down menu.
[Scale Label] panel [Scale: Auto] Check to set the scale display style to Auto. [Scale: Manual] Check to set a user-specified scale display style. When Manual is
checked, be sure to also set the scale interval of the main scale or auxiliary scale.
[Number Format]
Set the number of digits displayed after the decimal point for the horizontal or vertical axis.
[Set As Default] Check to use the selected settings as the default settings on restart. 4.4.6 [Toolbar…] The toolbar submenu is used to turn toolbars on and off. [File] Display tool buttons related to file functions. [Measure] Display tool buttons related to measurement functions. [View] Display tool buttons related to view menu functions.
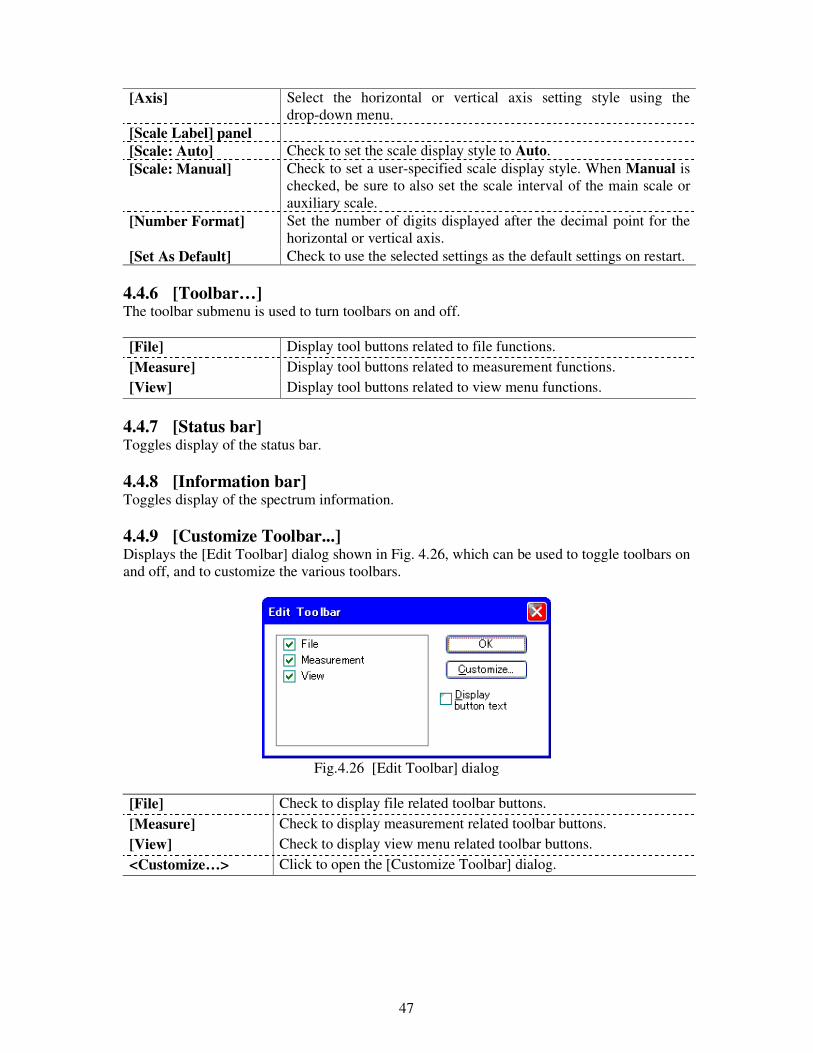
4.4.7 [Status bar] Toggles display of the status bar. 4.4.8 [Information bar] Toggles display of the spectrum information. 4.4.9 [Customize Toolbar...] Displays the [Edit Toolbar] dialog shown in Fig. 4.26, which can be used to toggle toolbars on and off, and to customize the various toolbars.
Fig.4.26 [Edit Toolbar] dialog
[File] Check to display file related toolbar buttons. [Measure] Check to display measurement related toolbar buttons. [View] Check to display view menu related toolbar buttons. <Customize…> Click to open the [Customize Toolbar] dialog.
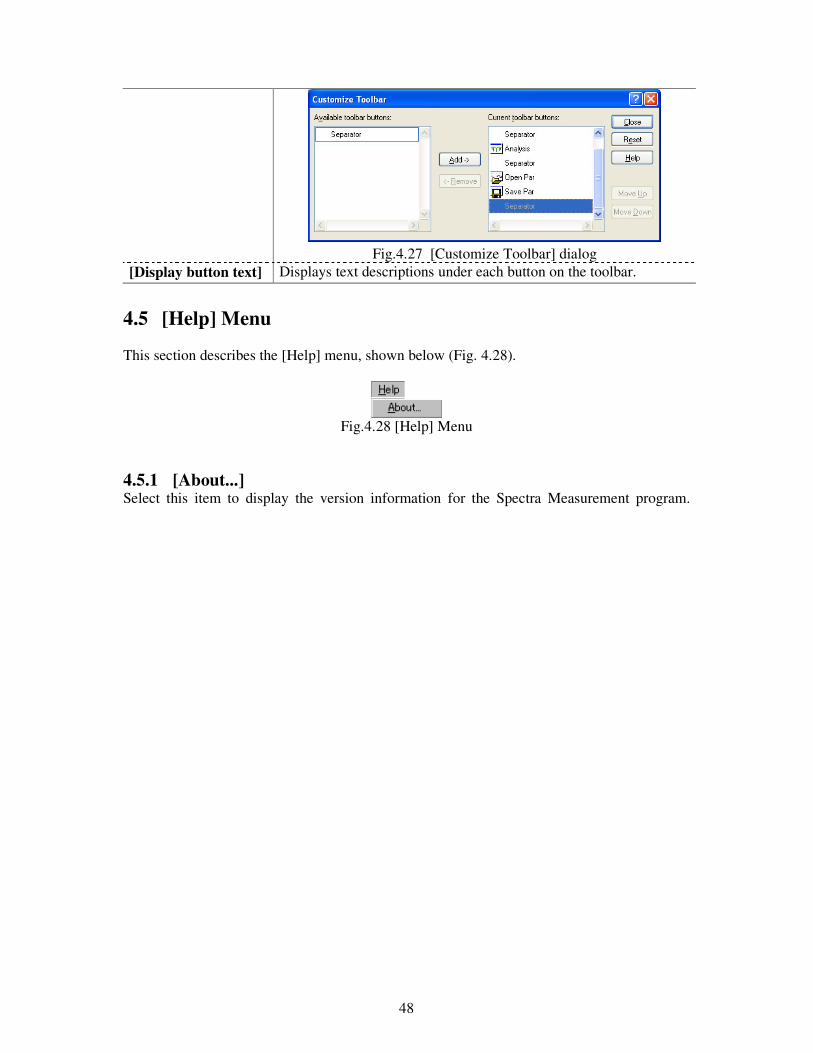
48
Fig.4.27 [Customize Toolbar] dialog
[Display button text] Displays text descriptions under each button on the toolbar.
4.5 [Help] Menu This section describes the [Help] menu, shown below (Fig. 4.28).
Fig.4.28 [Help] Menu
4.5.1 [About...] Select this item to display the version information for the Spectra Measurement program.

JASCO Corporation 2967-5 Ishikawa-cho, Hachioji
TOKYO, JAPAN
Printed in Japan