Embed Size (px)
DESCRIPTION
http ://jaslibrary.sourceforge.net. JAS 1.0: New features. Michele Sonnessa ([email protected]) Department of Computer Science University of Torino, Italy SwarmFest 2004, May 9-11 Ann Arbor. Main new features. A new GUI: the simulation environment A brand new statistical package - PowerPoint PPT Presentation
Citation preview

JAS 1.0: New features
Michele Sonnessa([email protected])Department of Computer ScienceUniversity of Torino, Italy
SwarmFest 2004, May 9-11 Ann Arbor
http://jaslibrary.sourceforge.net

Main new features
A new GUI: the simulation environment A brand new statistical package HSQLDB database support Graph package with Social Network
Analysis functions
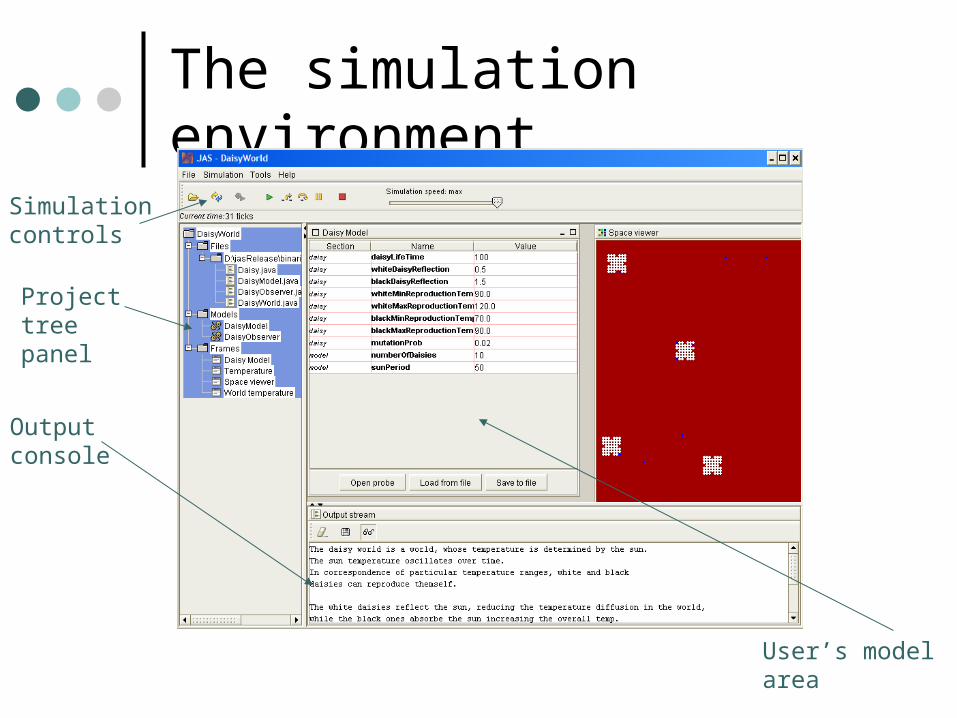
The simulation environment
Project tree panel
Output console
Simulation controls
User’s model area

Statistics: the encapsulation
I*Source I*Source I*Source I*Source
CrossSection.*
I*ArraySource
I*Source
Series.*
I*ArraySource
*TraceFunction
I*Source
*ArrayFunction
Array
Value
jas.statistics.*

Statistics: the moving average example
myAgent 1 myAgent 2 myAgent n
IntInvoker IntInvoker IntInvoker
CrossSection
MeanArrayFunction
Series MovingAverageFunction
Single value
Array of values
jas.statistics.*

Statistics: a code example
CrossSection.Integer crossSection = new CrossSection.Integer(agentList, “income”, false);
Series.Double series = new Series.Double(new MeanFunction(crossSection));
MovingAverageArrayFunction ma = new MovingAverageArrayFunction(series, 3);
…
eventList.scheduleSimple(0, 1, ma, Sim.EVENT_UPDATE);
jas.statistics.*

Hypersonic SQL Database
Automatically collects simulation data Supports multi-run indexing Automatically creates primary keys
Data can be later read with Standard jdbc consumers OpenOffice The JAS database manager (taken from the
HSQL tools)
jas.statistics.db.*

Database: an example
private void buildDatabase(String databaseName){
database = new Database(path + "dbout/", databaseName, true);
CollectionTable agentIncomeTable = database.addCollectionTable("AgentIncome",
Table.PK_SIMULATION_TIME, agents);agentIncomeTable.addDoubleColumn("CurrentIncome", DataAgent.INCOME);
Table averageTable = database.addTable("Wealth", Table.PK_SIMULATION_TIME);averageTable.addDoubleColumn("Average", new MeanArrayFunction(agentsWealth));averageTable.addDoubleColumn("Min", new MinArrayFunction.Double(agentsWealth));averageTable.addDoubleColumn("Max", new MaxArrayFunction.Double(agentsWealth));
database.openDatabase();}
jas.statistics.db.*

Database: output
RUNS table
AgentIncometable
jas.statistics.db.*

Graphs
Graphs are based on the JGraphT library We introduced the RelationalAgent template JAS provides:
A graph drawer A graph visual editor Layout managers (by R.Boero) Social Network Analysis statistics (by R.Boero) Support for GraphML I/O format
jas.graph.*

Graph based models
Topological models: the agents are in relation with other agents and move in the space
Abstract relational models: the agent localization is managed by the layer managers
jas.graph.*
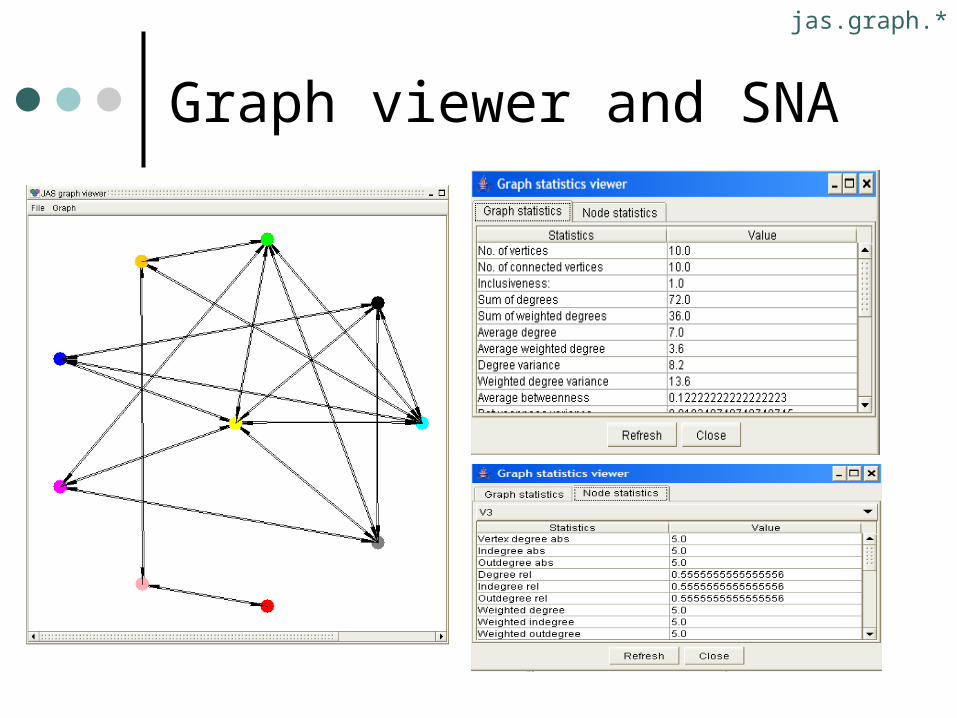
Graph viewer and SNA
jas.graph.*

Some other new features
Artificial neural networks can now save and load data (weights, network structure and data sets) using the XML format
The AgentList object is able to add or remove objects during list iteration

Under construction
A discrete-event library to easily design workflow simulations
How-tos and examples on GA, ANN, …