Embed Size (px)
Citation preview
Japfa LtdInvestor Presentation
3Q2017 Financial Results
1
Agenda
Other Financial Highlights3
3Q2017 Financial and Operational Analysis2
1 Key Highlights
Looking Ahead4
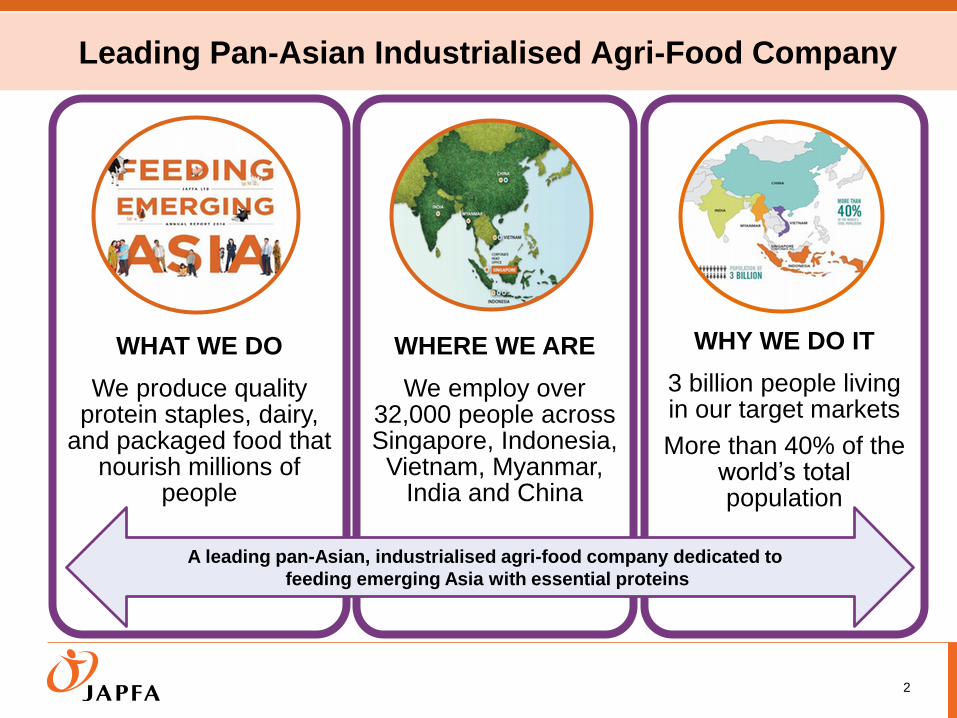
Leading Pan-Asian Industrialised Agri-Food Company
2
WHAT WE DO
We produce quality protein staples, dairy,
and packaged food that nourish millions of
people
WHERE WE ARE
We employ over 32,000 people across Singapore, Indonesia,
Vietnam, Myanmar, India and China
WHY WE DO IT
3 billion people living in our target markets
More than 40% of the world’s total population
A leading pan-Asian, industrialised agri-food company dedicated to
feeding emerging Asia with essential proteins
UPSTREAM
ANIMAL FEED
PRODUCTION
BREEDING
FARMS
Poultry Feed Cattle Feed Aquaculture Feed Poultry Feed Swine Feed Cattle Feed
Poultry Breeding Beef Cattle Breeding Aquaculture Breeding Poultry Breeding Swine Breeding Dairy Cattle Breeding
MIDSTREAM
MILKING &
FATTENING
FARMSPoultry Commercial
Farming
Beef Feedlots Aquaculture Commercial
Farming
Poultry Commercial
Farming
Swine
Fattening
Dairy Milking
DOWNSTREAM
PROCESSING &
DISTRIBUTION
Branded Consumer Foods Branded Dairy Products
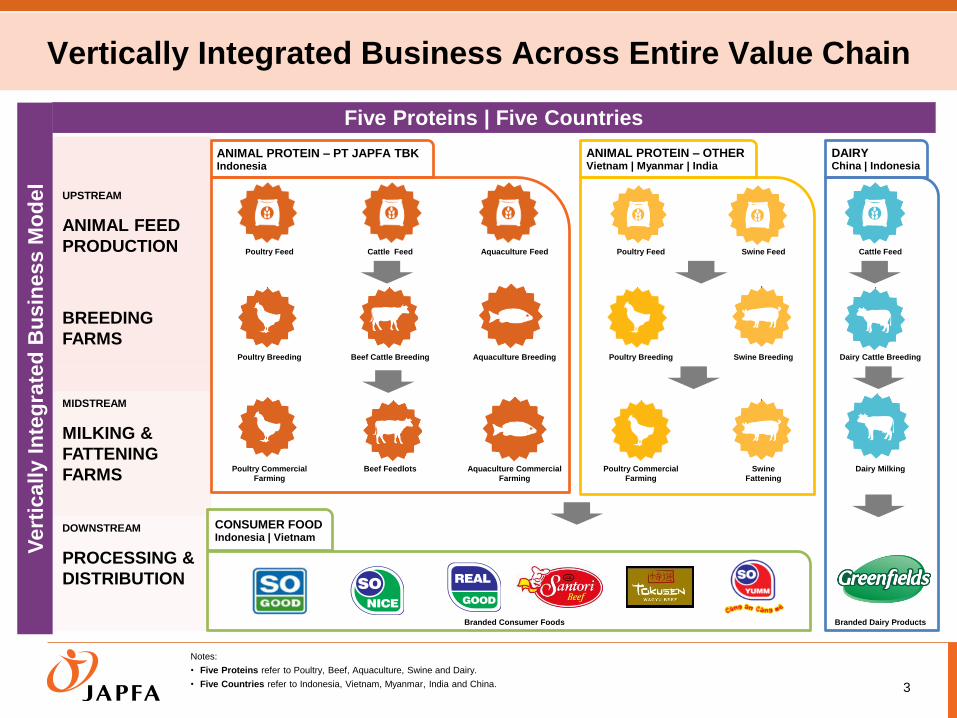
Five Proteins | Five Countries
Vertically Integrated Business Across Entire Value Chain
3
Vert
ically I
nte
gra
ted
Bu
sin
ess M
od
el
ANIMAL PROTEIN – PT JAPFA TBKIndonesia
ANIMAL PROTEIN – OTHERVietnam | Myanmar | India
DAIRYChina | Indonesia
CONSUMER FOODIndonesia | Vietnam
Notes:
• Five Proteins refer to Poultry, Beef, Aquaculture, Swine and Dairy.
• Five Countries refer to Indonesia, Vietnam, Myanmar, India and China.
UPSTREAM
ANIMAL FEED
PRODUCTION
BREEDING
FARMS
FEED
Enjoys economies
of scale and an
established network
LIVESTOCK
FARMING
Strong livestock
farming experience
and expertise
MIDSTREAM
MILKING &
FATTENING
FARMS
DOWNSTREAM
PROCESSING &
DISTRIBUTION
BRANDED
CONSUMER FOODS
Future growth
driver
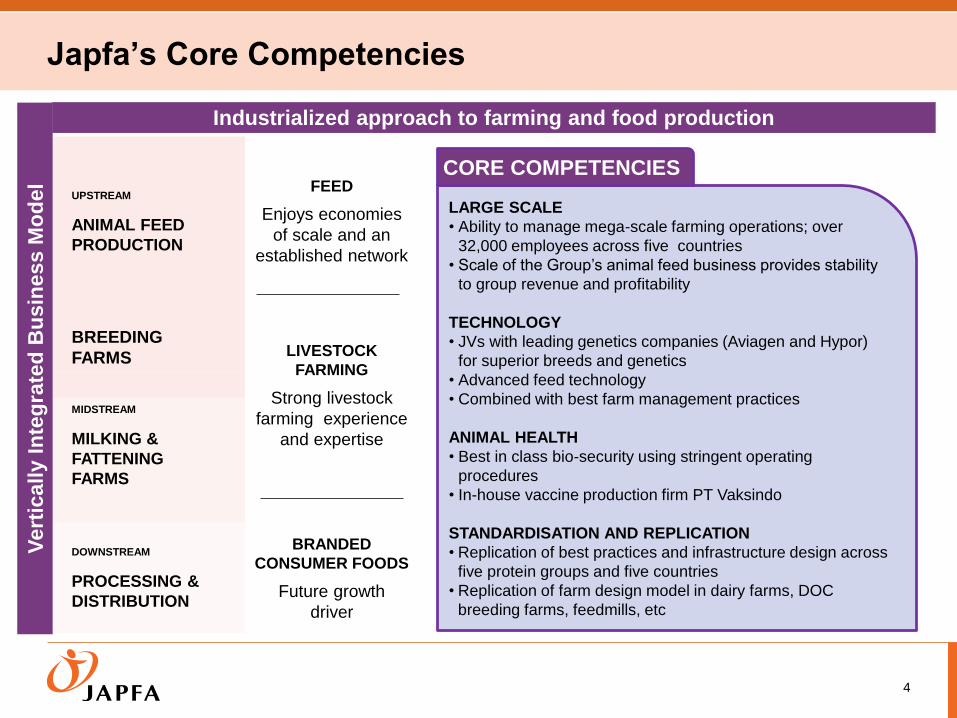
Industrialized approach to farming and food production
Vert
ically I
nte
gra
ted
Bu
sin
ess M
od
el
Japfa’s Core Competencies
4
LARGE SCALE
• Ability to manage mega-scale farming operations; over
32,000 employees across five countries
• Scale of the Group’s animal feed business provides stability
to group revenue and profitability
TECHNOLOGY
• JVs with leading genetics companies (Aviagen and Hypor)
for superior breeds and genetics
• Advanced feed technology
• Combined with best farm management practices
ANIMAL HEALTH
• Best in class bio-security using stringent operating
procedures
• In-house vaccine production firm PT Vaksindo
STANDARDISATION AND REPLICATION
• Replication of best practices and infrastructure design across
five protein groups and five countries
• Replication of farm design model in dairy farms, DOC
breeding farms, feedmills, etc
CORE COMPETENCIES
Key Highlights
Key Highlights for 3Q2017
6* We derived “Core PATMI” from “Profit Attributable to Owners of the Parent, Net of Tax” by excluding changes in fair value of biological assets (net of tax) and derivatives and by excluding extraordinary
items (namely the gain/loss from the buyback of USD bonds in PT Japfa Tbk), attributable to owners of the parent.
“Core PATMI w/o Forex” is an estimate derived from Core PATMI by excluding foreign exchange gains/losses (before tax) attributable to the owners o f the parent. As the majority of the foreign exchange
gains/losses are unrealised and arises from the translation of USD bonds in PT Japfa Tbk, which has no tax implication, we have not made an estimate of the tax impact on foreign exchange gains/losses.
* We define “EBITDA” as profit before tax from continuing operations, excluding interest income, changes in fair value of biological assets and marketable securities, foreign exchange adjustments
gains/(losses), finance costs, depreciation of property, plant and equipment, depreciation of investment properties and amort isation of intangible assets.
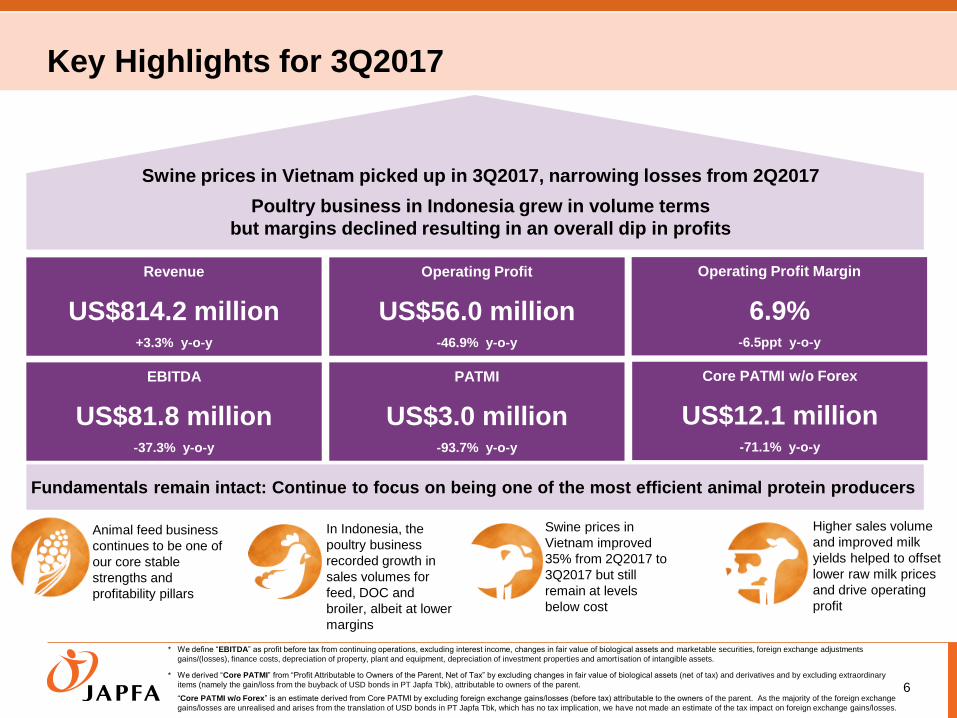
Swine prices in Vietnam picked up in 3Q2017, narrowing losses from 2Q2017
Poultry business in Indonesia grew in volume terms
but margins declined resulting in an overall dip in profits
In Indonesia, the
poultry business
recorded growth in
sales volumes for
feed, DOC and
broiler, albeit at lower
margins
Animal feed business
continues to be one of
our core stable
strengths and
profitability pillars
Fundamentals remain intact: Continue to focus on being one of the most efficient animal protein producers
Swine prices in
Vietnam improved
35% from 2Q2017 to
3Q2017 but still
remain at levels
below cost
Higher sales volume
and improved milk
yields helped to offset
lower raw milk prices
and drive operating
profit
Operating Profit
US$56.0 million-46.9% y-o-y
PATMI
US$3.0 million-93.7% y-o-y
Revenue
US$814.2 million+3.3% y-o-y
Operating Profit Margin
6.9%-6.5ppt y-o-y
Core PATMI w/o Forex
US$12.1 million-71.1% y-o-y
EBITDA
US$81.8 million-37.3% y-o-y
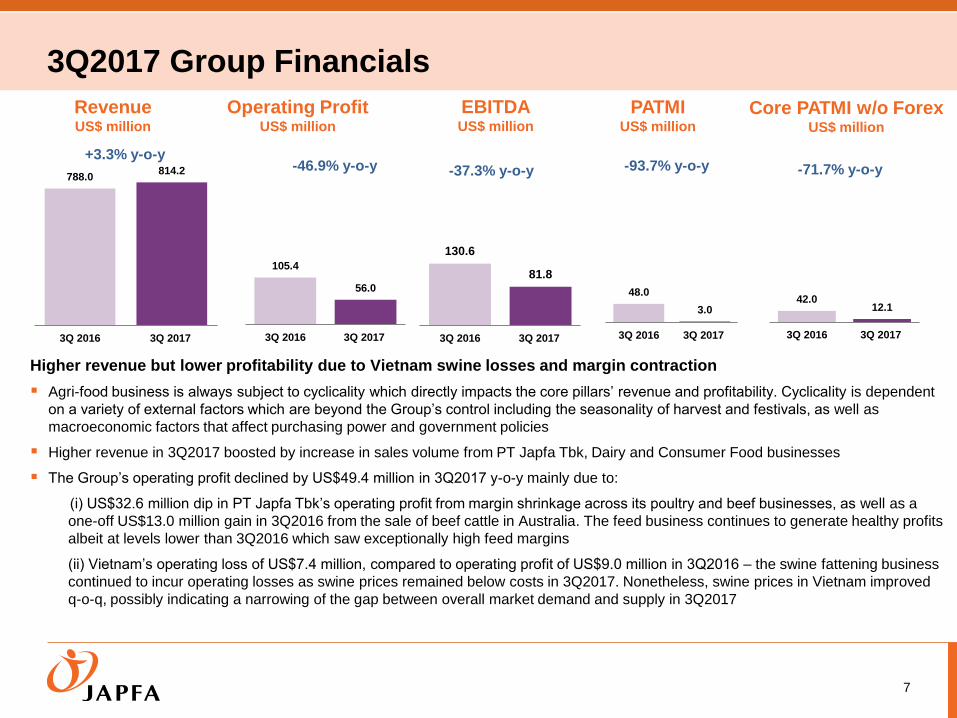
3Q2017 Group Financials
7
RevenueUS$ million
Operating ProfitUS$ million
PATMIUS$ million
Core PATMI w/o ForexUS$ million
EBITDAUS$ million
788.0814.2
3Q 2016 3Q 2017
105.4
56.0
3Q 2016 3Q 2017
-46.9% y-o-y
48.0
3.0
3Q 2016 3Q 2017
-93.7% y-o-y
42.012.1
3Q 2016 3Q 2017
-71.7% y-o-y+3.3% y-o-y
Higher revenue but lower profitability due to Vietnam swine losses and margin contraction
Agri-food business is always subject to cyclicality which directly impacts the core pillars’ revenue and profitability. Cyclicality is dependent
on a variety of external factors which are beyond the Group’s control including the seasonality of harvest and festivals, as well as
macroeconomic factors that affect purchasing power and government policies
Higher revenue in 3Q2017 boosted by increase in sales volume from PT Japfa Tbk, Dairy and Consumer Food businesses
The Group’s operating profit declined by US$49.4 million in 3Q2017 y-o-y mainly due to:
(i) US$32.6 million dip in PT Japfa Tbk’s operating profit from margin shrinkage across its poultry and beef businesses, as well as a
one-off US$13.0 million gain in 3Q2016 from the sale of beef cattle in Australia. The feed business continues to generate healthy profits
albeit at levels lower than 3Q2016 which saw exceptionally high feed margins
(ii) Vietnam’s operating loss of US$7.4 million, compared to operating profit of US$9.0 million in 3Q2016 – the swine fattening business
continued to incur operating losses as swine prices remained below costs in 3Q2017. Nonetheless, swine prices in Vietnam improved
q-o-q, possibly indicating a narrowing of the gap between overall market demand and supply in 3Q2017
130.6
81.8
3Q 2016 3Q 2017
-37.3% y-o-y
Core PATMI w/o Forex Rolling basis
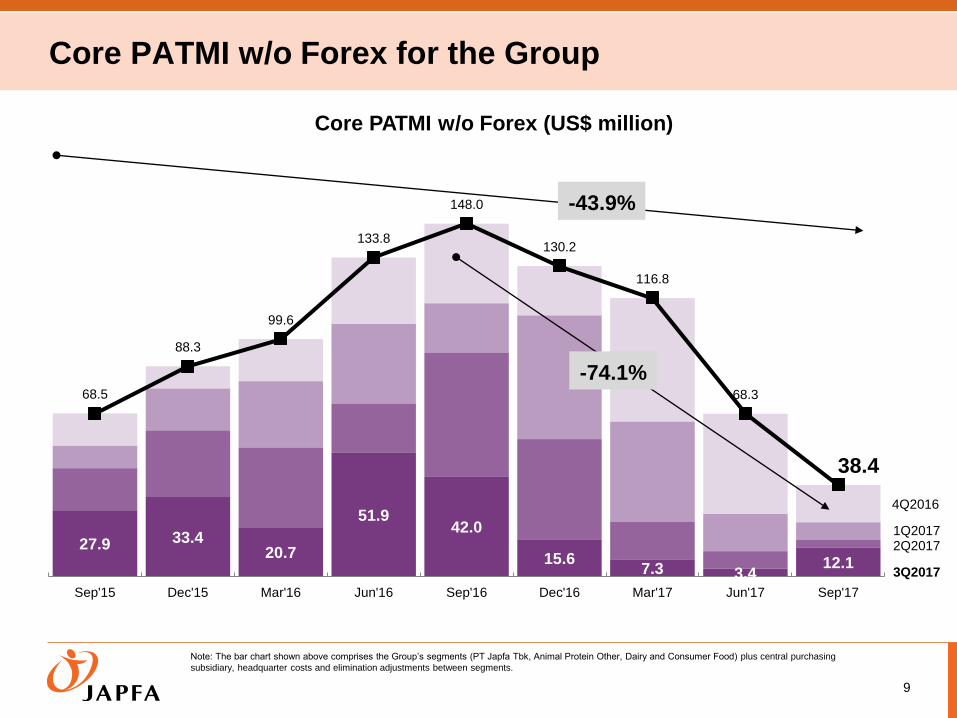
27.9 33.420.7
51.942.0
15.67.3 3.4
12.1
68.5
88.3
99.6
133.8
148.0
130.2
116.8
68.3
38.4
Sep'15 Dec'15 Mar'16 Jun'16 Sep'16 Dec'16 Mar'17 Jun'17 Sep'17
9
-43.9%
Core PATMI w/o Forex (US$ million)
Note: The bar chart shown above comprises the Group’s segments (PT Japfa Tbk, Animal Protein Other, Dairy and Consumer Food) plus central purchasing
subsidiary, headquarter costs and elimination adjustments between segments.
3Q2017
2Q20171Q2017
4Q2016
-74.1%
Core PATMI w/o Forex for the Group
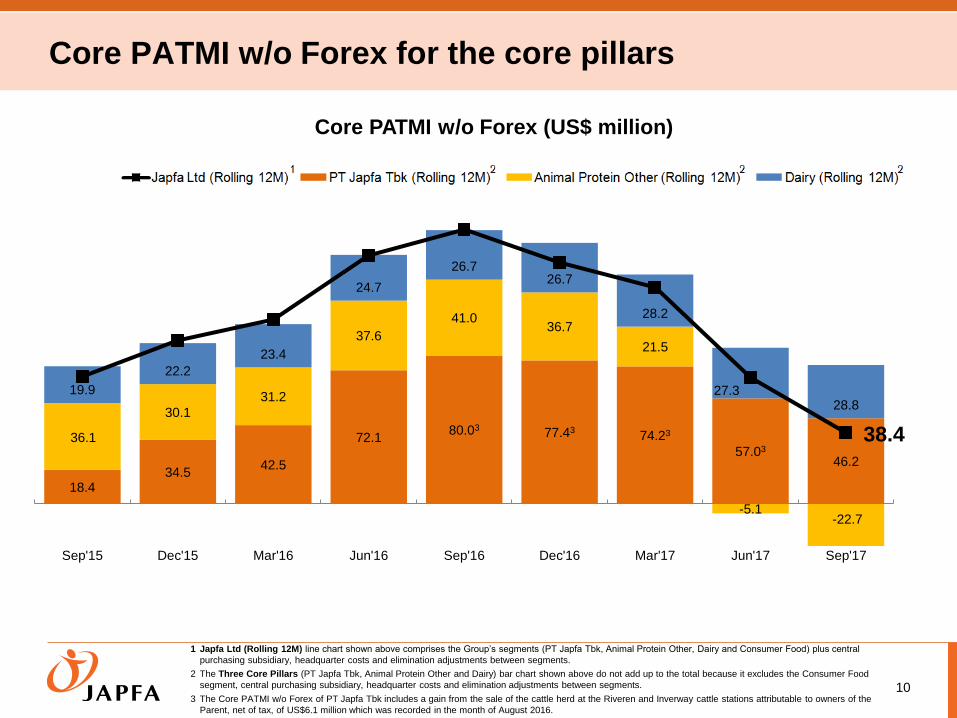
1 Japfa Ltd (Rolling 12M) line chart shown above comprises the Group’s segments (PT Japfa Tbk, Animal Protein Other, Dairy and Consumer Food) plus central
purchasing subsidiary, headquarter costs and elimination adjustments between segments.
2 The Three Core Pillars (PT Japfa Tbk, Animal Protein Other and Dairy) bar chart shown above do not add up to the total because it excludes the Consumer Food
segment, central purchasing subsidiary, headquarter costs and elimination adjustments between segments.
3 The Core PATMI w/o Forex of PT Japfa Tbk includes a gain from the sale of the cattle herd at the Riveren and Inverway cattle stations attributable to owners of the
Parent, net of tax, of US$6.1 million which was recorded in the month of August 2016.
10
Core PATMI w/o Forex (US$ million)
Core PATMI w/o Forex for the core pillars
18.434.5
42.5
72.180.03
77.4374.23
57.03
46.2
36.1
30.1
31.2
37.6
41.036.7
21.5
-5.1-22.7
19.9
22.2
23.4
24.7
26.726.7
28.2
27.328.8
38.4
Sep'15 Dec'15 Mar'16 Jun'16 Sep'16 Dec'16 Mar'17 Jun'17 Sep'17
3Q2017Financial and Operational Analysis
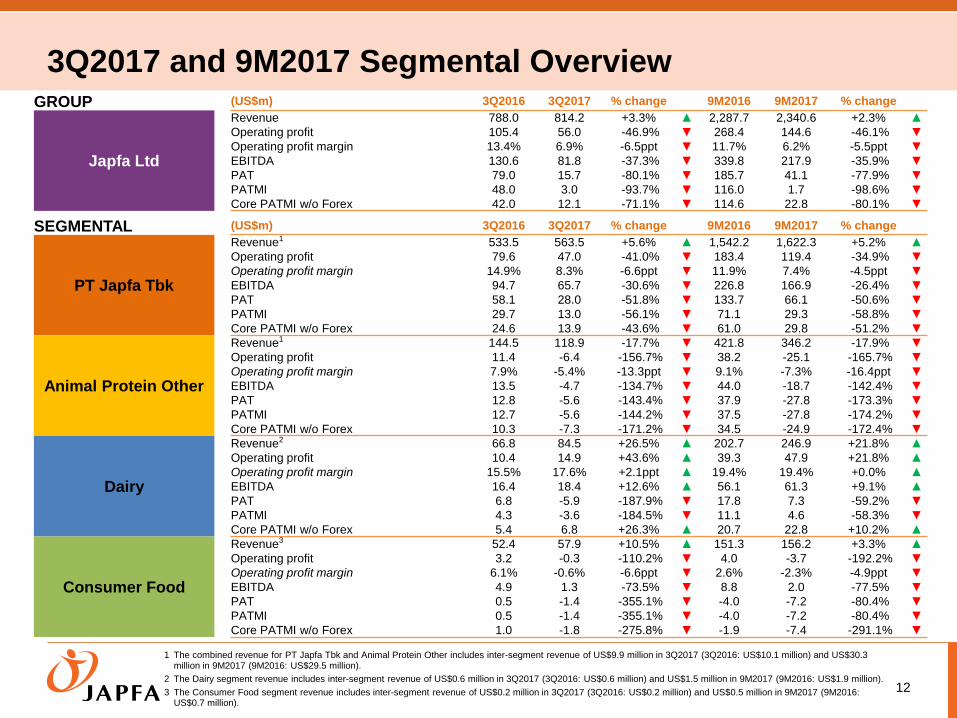
3Q2017 and 9M2017 Segmental Overview
12
1 The combined revenue for PT Japfa Tbk and Animal Protein Other includes inter-segment revenue of US$9.9 million in 3Q2017 (3Q2016: US$10.1 million) and US$30.3 million in 9M2017 (9M2016: US$29.5 million).
2 The Dairy segment revenue includes inter-segment revenue of US$0.6 million in 3Q2017 (3Q2016: US$0.6 million) and US$1.5 million in 9M2017 (9M2016: US$1.9 million).
3 The Consumer Food segment revenue includes inter-segment revenue of US$0.2 million in 3Q2017 (3Q2016: US$0.2 million) and US$0.5 million in 9M2017 (9M2016: US$0.7 million).
GROUP (US$m) 3Q2016 3Q2017 % change 9M2016 9M2017 % change
Japfa Ltd
Revenue 788.0 814.2 +3.3% ▲ 2,287.7 2,340.6 +2.3% ▲
Operating profit 105.4 56.0 -46.9% ▼ 268.4 144.6 -46.1% ▼
Operating profit margin 13.4% 6.9% -6.5ppt ▼ 11.7% 6.2% -5.5ppt ▼
EBITDA 130.6 81.8 -37.3% ▼ 339.8 217.9 -35.9% ▼
PAT 79.0 15.7 -80.1% ▼ 185.7 41.1 -77.9% ▼
PATMI 48.0 3.0 -93.7% ▼ 116.0 1.7 -98.6% ▼
Core PATMI w/o Forex 42.0 12.1 -71.1% ▼ 114.6 22.8 -80.1% ▼
SEGMENTAL (US$m) 3Q2016 3Q2017 % change 9M2016 9M2017 % change
PT Japfa Tbk
Revenue1 533.5 563.5 +5.6% ▲ 1,542.2 1,622.3 +5.2% ▲
Operating profit 79.6 47.0 -41.0% ▼ 183.4 119.4 -34.9% ▼
Operating profit margin 14.9% 8.3% -6.6ppt ▼ 11.9% 7.4% -4.5ppt ▼
EBITDA 94.7 65.7 -30.6% ▼ 226.8 166.9 -26.4% ▼
PAT 58.1 28.0 -51.8% ▼ 133.7 66.1 -50.6% ▼
PATMI 29.7 13.0 -56.1% ▼ 71.1 29.3 -58.8% ▼
Core PATMI w/o Forex 24.6 13.9 -43.6% ▼ 61.0 29.8 -51.2% ▼
Animal Protein Other
Revenue1 144.5 118.9 -17.7% ▼ 421.8 346.2 -17.9% ▼
Operating profit 11.4 -6.4 -156.7% ▼ 38.2 -25.1 -165.7% ▼
Operating profit margin 7.9% -5.4% -13.3ppt ▼ 9.1% -7.3% -16.4ppt ▼
EBITDA 13.5 -4.7 -134.7% ▼ 44.0 -18.7 -142.4% ▼
PAT 12.8 -5.6 -143.4% ▼ 37.9 -27.8 -173.3% ▼
PATMI 12.7 -5.6 -144.2% ▼ 37.5 -27.8 -174.2% ▼
Core PATMI w/o Forex 10.3 -7.3 -171.2% ▼ 34.5 -24.9 -172.4% ▼
Dairy
Revenue2 66.8 84.5 +26.5% ▲ 202.7 246.9 +21.8% ▲
Operating profit 10.4 14.9 +43.6% ▲ 39.3 47.9 +21.8% ▲
Operating profit margin 15.5% 17.6% +2.1ppt ▲ 19.4% 19.4% +0.0% ▲
EBITDA 16.4 18.4 +12.6% ▲ 56.1 61.3 +9.1% ▲
PAT 6.8 -5.9 -187.9% ▼ 17.8 7.3 -59.2% ▼
PATMI 4.3 -3.6 -184.5% ▼ 11.1 4.6 -58.3% ▼
Core PATMI w/o Forex 5.4 6.8 +26.3% ▲ 20.7 22.8 +10.2% ▲
Consumer Food
Revenue3 52.4 57.9 +10.5% ▲ 151.3 156.2 +3.3% ▲
Operating profit 3.2 -0.3 -110.2% ▼ 4.0 -3.7 -192.2% ▼
Operating profit margin 6.1% -0.6% -6.6ppt ▼ 2.6% -2.3% -4.9ppt ▼
EBITDA 4.9 1.3 -73.5% ▼ 8.8 2.0 -77.5% ▼
PAT 0.5 -1.4 -355.1% ▼ -4.0 -7.2 -80.4% ▼
PATMI 0.5 -1.4 -355.1% ▼ -4.0 -7.2 -80.4% ▼
Core PATMI w/o Forex 1.0 -1.8 -275.8% ▼ -1.9 -7.4 -291.1% ▼
24.6
13.910.3
-7.3
5.4 6.8
1.0
-1.8
3Q2016 3Q2017
PT Japfa Tbk Animal Protein Other Dairy Consumer Food
US$42.0 million US$12.1 million
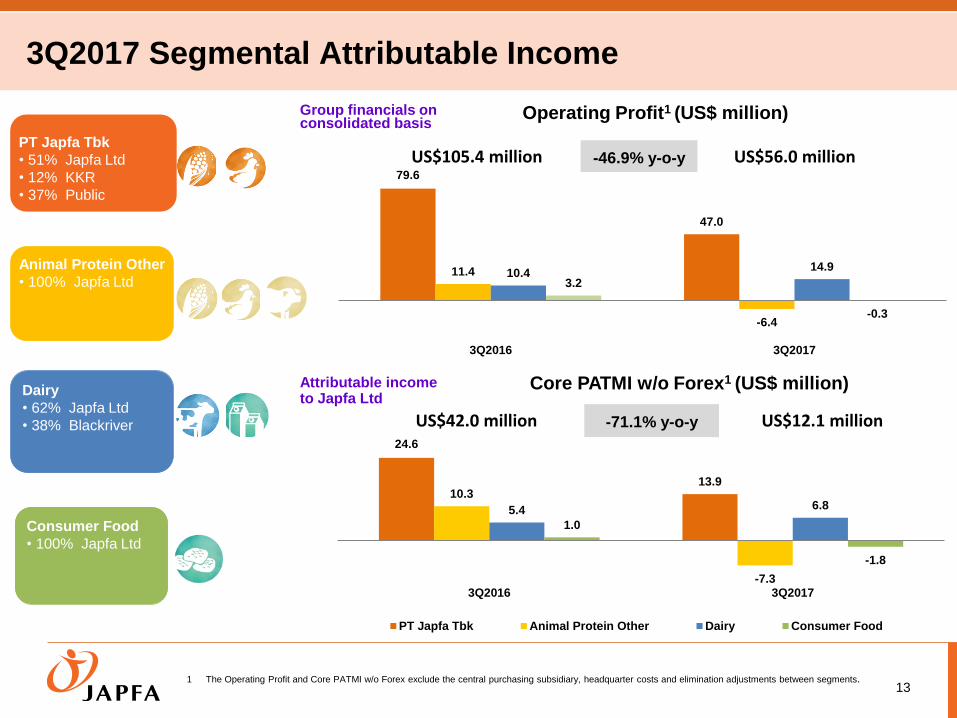
3Q2017 Segmental Attributable Income
131 The Operating Profit and Core PATMI w/o Forex exclude the central purchasing subsidiary, headquarter costs and elimination adjustments between segments.
PT Japfa Tbk
• 51% Japfa Ltd
• 12% KKR
• 37% Public
Animal Protein Other
• 100% Japfa Ltd
Dairy
• 62% Japfa Ltd
• 38% Blackriver
Consumer Food
• 100% Japfa Ltd
Group financials on consolidated basis
Operating Profit1 (US$ million)
Attributable income to Japfa Ltd
Core PATMI w/o Forex1 (US$ million)
-71.1% y-o-y
-46.9% y-o-y79.6
47.0
11.4
-6.4
10.414.9
3.2
-0.3
3Q2016 3Q2017
US$105.4 million US$56.0 million
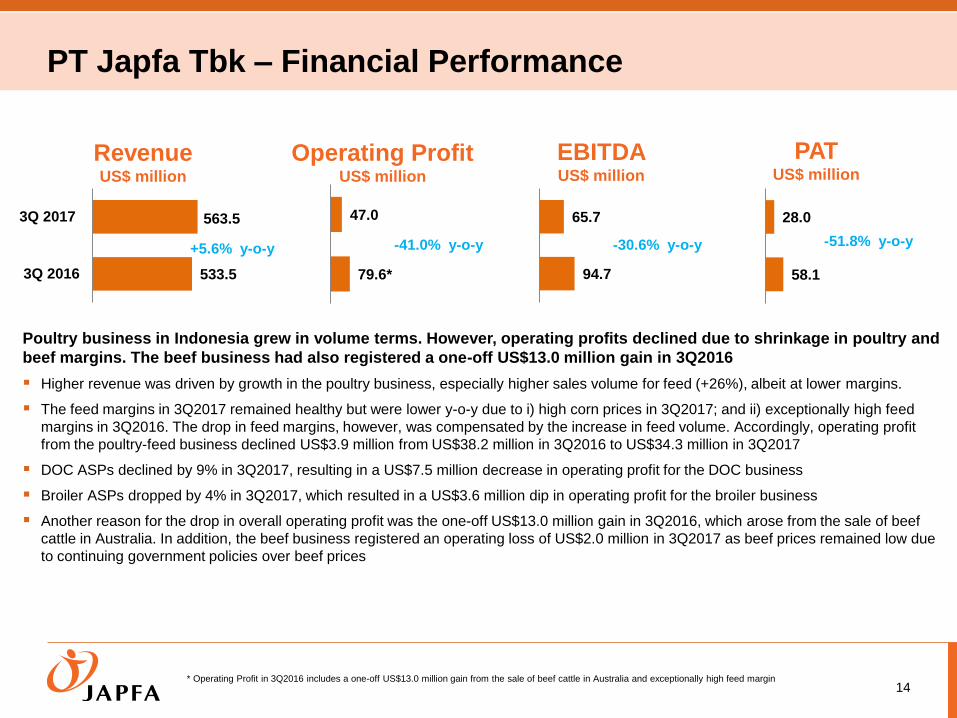
PT Japfa Tbk – Financial Performance
14
RevenueUS$ million
PATUS$ million
Operating ProfitUS$ million
EBITDAUS$ million
533.5
563.5
3Q 2016
3Q 2017
+5.6% y-o-y
58.1
28.0
-51.8% y-o-y
Poultry business in Indonesia grew in volume terms. However, operating profits declined due to shrinkage in poultry and
beef margins. The beef business had also registered a one-off US$13.0 million gain in 3Q2016
Higher revenue was driven by growth in the poultry business, especially higher sales volume for feed (+26%), albeit at lower margins.
The feed margins in 3Q2017 remained healthy but were lower y-o-y due to i) high corn prices in 3Q2017; and ii) exceptionally high feed
margins in 3Q2016. The drop in feed margins, however, was compensated by the increase in feed volume. Accordingly, operating profit
from the poultry-feed business declined US$3.9 million from US$38.2 million in 3Q2016 to US$34.3 million in 3Q2017
DOC ASPs declined by 9% in 3Q2017, resulting in a US$7.5 million decrease in operating profit for the DOC business
Broiler ASPs dropped by 4% in 3Q2017, which resulted in a US$3.6 million dip in operating profit for the broiler business
Another reason for the drop in overall operating profit was the one-off US$13.0 million gain in 3Q2016, which arose from the sale of beef
cattle in Australia. In addition, the beef business registered an operating loss of US$2.0 million in 3Q2017 as beef prices remained low due
to continuing government policies over beef prices
94.7
65.7
-30.6% y-o-y
79.6*
47.0
-41.0% y-o-y
* Operating Profit in 3Q2016 includes a one-off US$13.0 million gain from the sale of beef cattle in Australia and exceptionally high feed margin
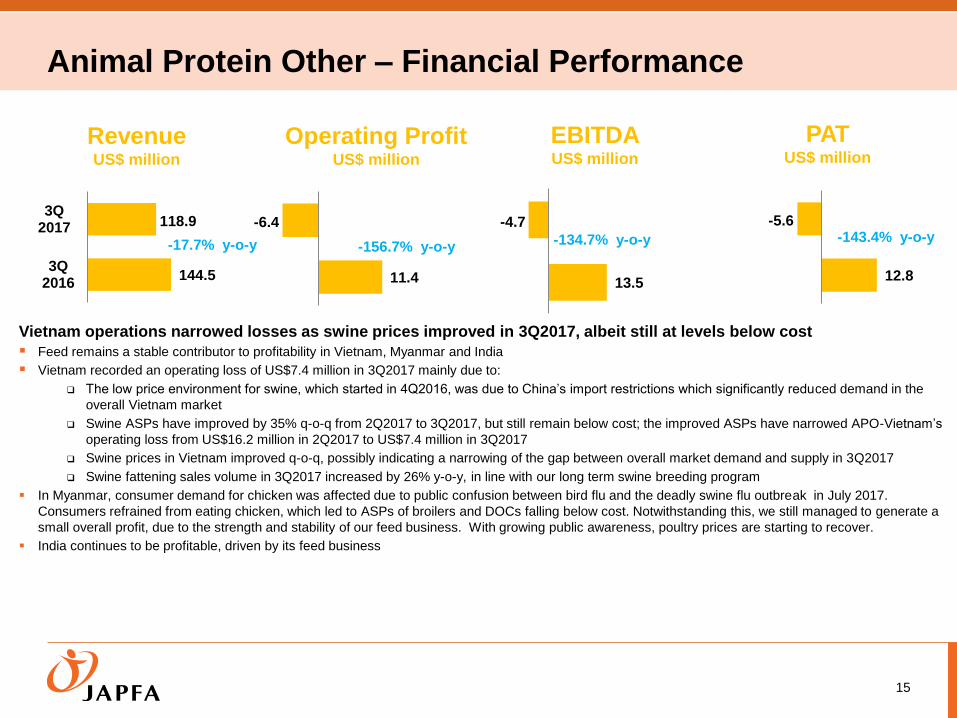
Animal Protein Other – Financial Performance
15
RevenueUS$ million
PATUS$ million
Operating ProfitUS$ million
EBITDAUS$ million
144.5
118.9
3Q2016
3Q2017
-17.7% y-o-y
11.4
-6.4
-156.7% y-o-y
12.8
-5.6-143.4% y-o-y
Vietnam operations narrowed losses as swine prices improved in 3Q2017, albeit still at levels below cost
Feed remains a stable contributor to profitability in Vietnam, Myanmar and India
Vietnam recorded an operating loss of US$7.4 million in 3Q2017 mainly due to:
The low price environment for swine, which started in 4Q2016, was due to China’s import restrictions which significantly reduced demand in the
overall Vietnam market
Swine ASPs have improved by 35% q-o-q from 2Q2017 to 3Q2017, but still remain below cost; the improved ASPs have narrowed APO-Vietnam’s
operating loss from US$16.2 million in 2Q2017 to US$7.4 million in 3Q2017
Swine prices in Vietnam improved q-o-q, possibly indicating a narrowing of the gap between overall market demand and supply in 3Q2017
Swine fattening sales volume in 3Q2017 increased by 26% y-o-y, in line with our long term swine breeding program
In Myanmar, consumer demand for chicken was affected due to public confusion between bird flu and the deadly swine flu outbreak in July 2017.
Consumers refrained from eating chicken, which led to ASPs of broilers and DOCs falling below cost. Notwithstanding this, we still managed to generate a
small overall profit, due to the strength and stability of our feed business. With growing public awareness, poultry prices are starting to recover.
India continues to be profitable, driven by its feed business
13.5
-4.7
-134.7% y-o-y
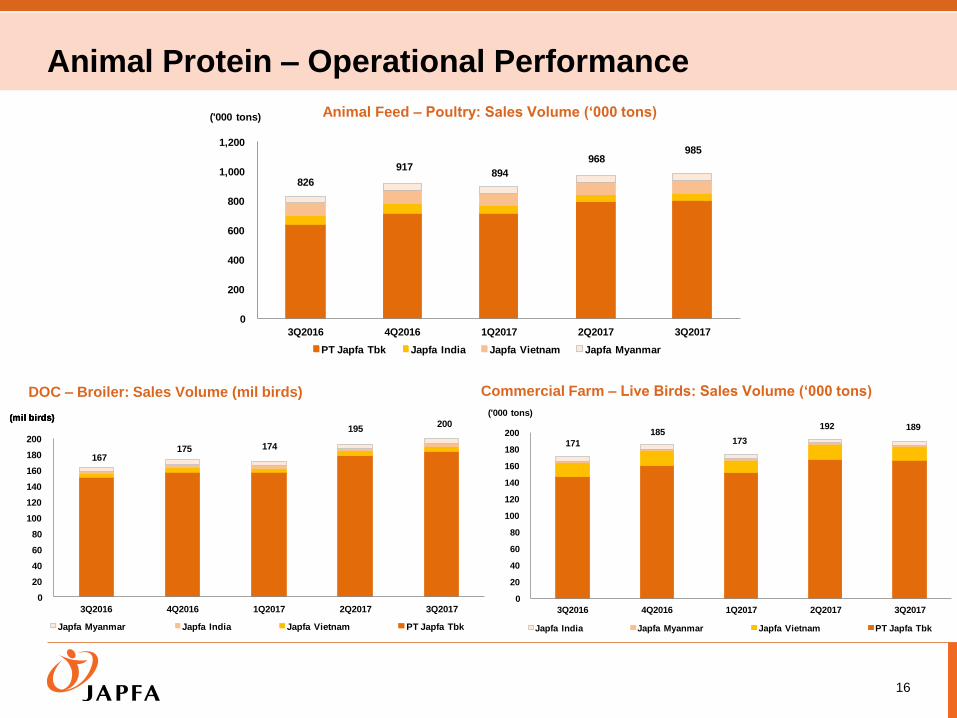
Animal Protein – Operational Performance
16
Animal Feed – Poultry: Sales Volume (‘000 tons)
DOC – Broiler: Sales Volume (mil birds) Commercial Farm – Live Birds: Sales Volume (‘000 tons)
0
200
400
600
800
1,000
1,200
3Q2016 4Q2016 1Q2017 2Q2017 3Q2017
PT Japfa Tbk Japfa India Japfa Vietnam Japfa Myanmar
('000 tons)
917968
826894
985
0
20
40
60
80
100
120
140
160
180
200
3Q2016 4Q2016 1Q2017 2Q2017 3Q2017
Japfa Myanmar Japfa India Japfa Vietnam PT Japfa Tbk
(mil birds)(mil birds)(mil birds)
167175
195
174
200
0
20
40
60
80
100
120
140
160
180
200
3Q2016 4Q2016 1Q2017 2Q2017 3Q2017
Japfa India Japfa Myanmar Japfa Vietnam PT Japfa Tbk
('000 tons)
171
185192
173
189
95.4103.6 98.2 92.9 95.8
0
20
40
60
80
100
120
3Q2016 4Q2016 1Q2017 2Q2017 3Q2017
Japfa Vietnam
('000 tons)
11.5 12.3 11.5
16.214.5
0
2
4
6
8
10
12
14
16
18
3Q2016 4Q2016 1Q2017 2Q2017 3Q2017
Japfa Vietnam
('000 tons)
50.447.3
42.6
55.0 52.2
0
10
20
30
40
50
60
3Q2016 4Q2016 1Q2017 2Q2017 3Q2017PT Japfa Tbk
('000 tons)
8.41
7.06.3
7.79.0
0
1
2
3
4
5
6
7
8
9
10
3Q2016 4Q2016 1Q2017 2Q2017 3Q2017
PT Japfa Tbk
('000 tons)
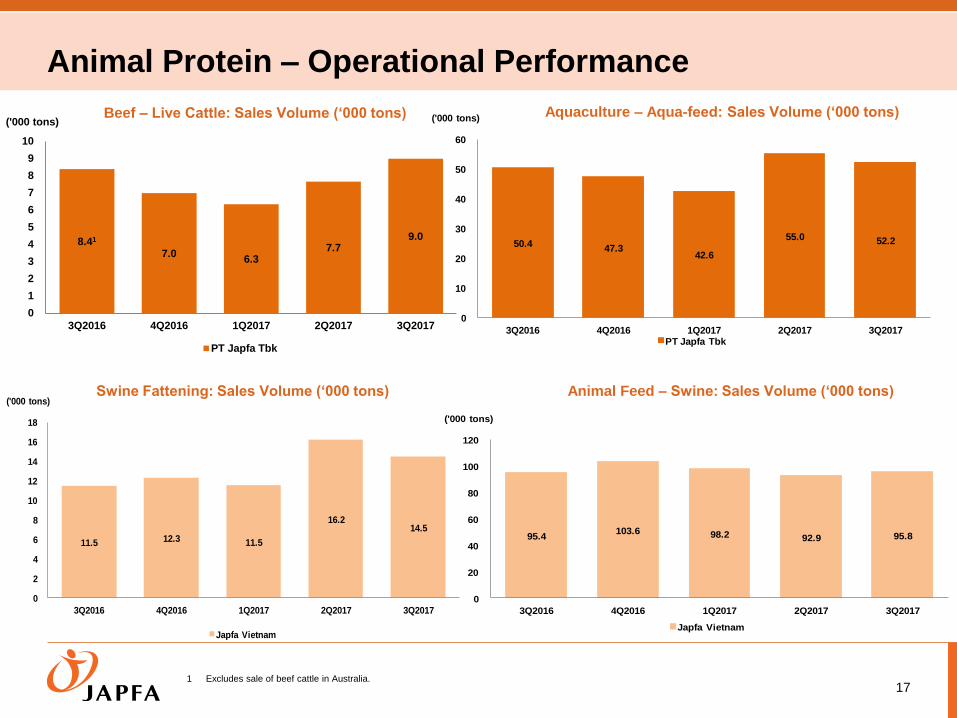
Animal Protein – Operational Performance
17
Beef – Live Cattle: Sales Volume (‘000 tons) Aquaculture – Aqua-feed: Sales Volume (‘000 tons)
Swine Fattening: Sales Volume (‘000 tons) Animal Feed – Swine: Sales Volume (‘000 tons)
1 Excludes sale of beef cattle in Australia.
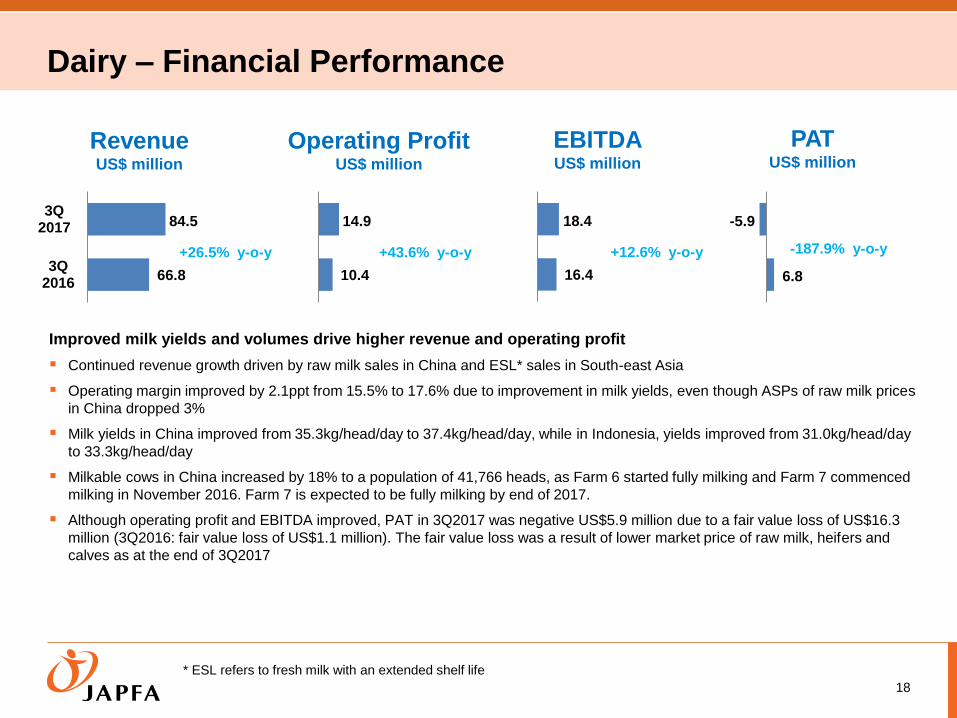
Dairy – Financial Performance
18
RevenueUS$ million
PATUS$ million
Operating ProfitUS$ million
EBITDAUS$ million
66.8
84.5
3Q2016
3Q2017
+26.5% y-o-y
10.4
14.9
+43.6% y-o-y
6.8
-5.9
-187.9% y-o-y
Improved milk yields and volumes drive higher revenue and operating profit
Continued revenue growth driven by raw milk sales in China and ESL* sales in South-east Asia
Operating margin improved by 2.1ppt from 15.5% to 17.6% due to improvement in milk yields, even though ASPs of raw milk prices
in China dropped 3%
Milk yields in China improved from 35.3kg/head/day to 37.4kg/head/day, while in Indonesia, yields improved from 31.0kg/head/day
to 33.3kg/head/day
Milkable cows in China increased by 18% to a population of 41,766 heads, as Farm 6 started fully milking and Farm 7 commenced
milking in November 2016. Farm 7 is expected to be fully milking by end of 2017.
Although operating profit and EBITDA improved, PAT in 3Q2017 was negative US$5.9 million due to a fair value loss of US$16.3
million (3Q2016: fair value loss of US$1.1 million). The fair value loss was a result of lower market price of raw milk, heifers and
calves as at the end of 3Q2017
* ESL refers to fresh milk with an extended shelf life
16.4
18.4
+12.6% y-o-y
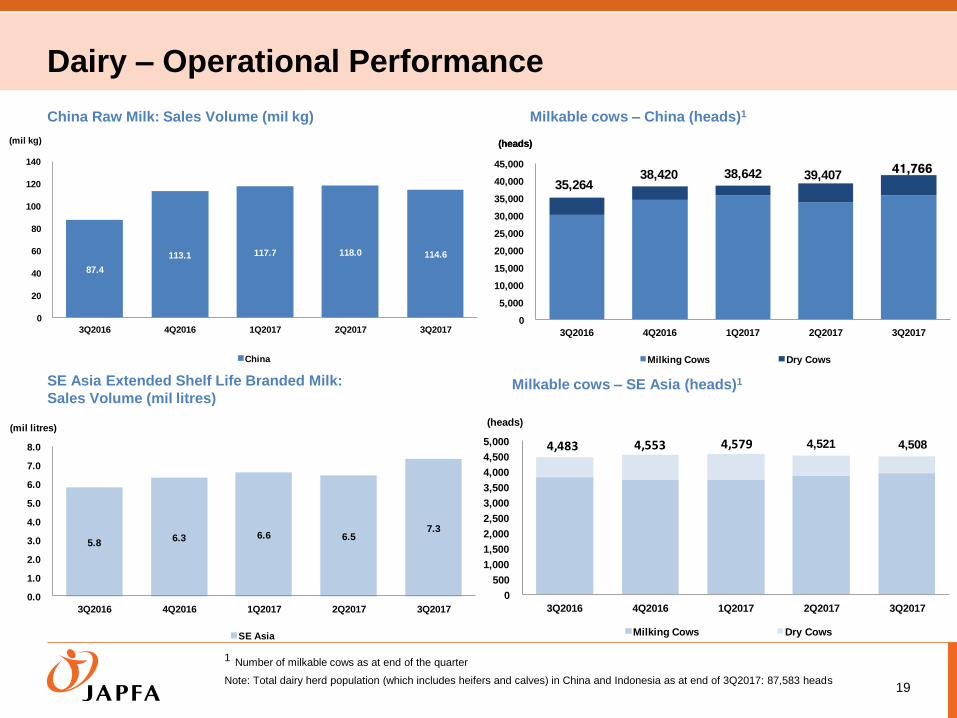
Dairy – Operational Performance
19
1 Number of milkable cows as at end of the quarter
Note: Total dairy herd population (which includes heifers and calves) in China and Indonesia as at end of 3Q2017: 87,583 heads
SE Asia Extended Shelf Life Branded Milk:
Sales Volume (mil litres)Milkable cows – SE Asia (heads)1
China Raw Milk: Sales Volume (mil kg) Milkable cows – China (heads)1
87.4
113.1 117.7 118.0 114.6
0
20
40
60
80
100
120
140
3Q2016 4Q2016 1Q2017 2Q2017 3Q2017
China
(mil kg)
0
500
1,000
1,500
2,000
2,500
3,000
3,500
4,000
4,500
5,000
3Q2016 4Q2016 1Q2017 2Q2017 3Q2017
Milking Cows Dry Cows
(heads)
4,483 4,553 4,5214,579 4,508
5.8 6.3 6.6 6.5
7.3
0.0
1.0
2.0
3.0
4.0
5.0
6.0
7.0
8.0
3Q2016 4Q2016 1Q2017 2Q2017 3Q2017
SE Asia
(mil litres)
35,26438,420 39,40738,642
0
5,000
10,000
15,000
20,000
25,000
30,000
35,000
40,000
45,000
3Q2016 4Q2016 1Q2017 2Q2017 3Q2017
Milking Cows Dry Cows
(heads)(heads)
41,766
20
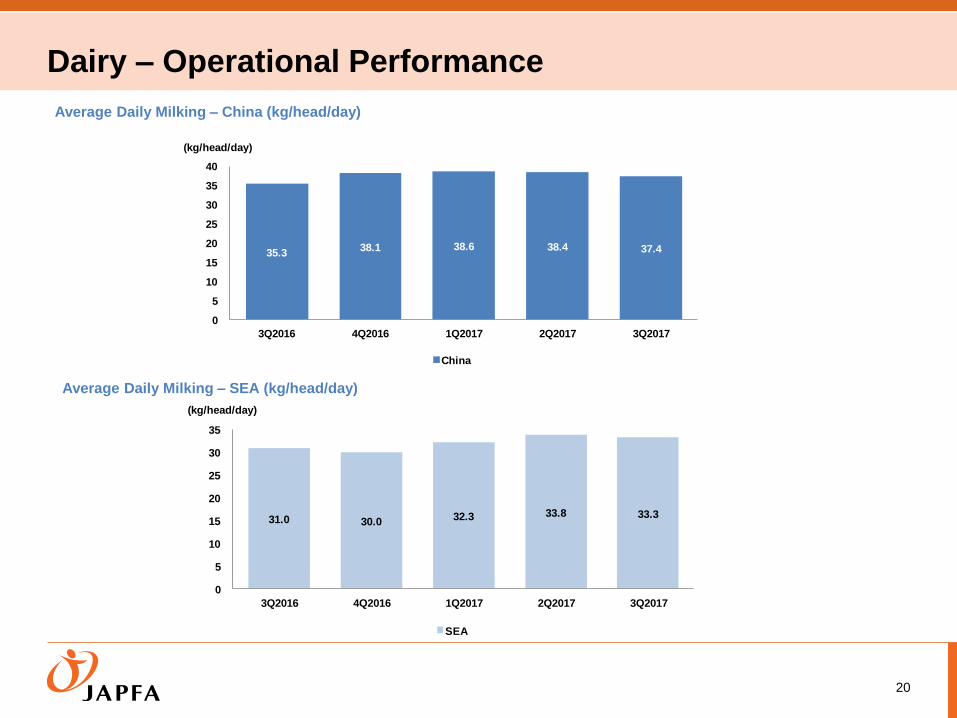
Dairy – Operational Performance
Average Daily Milking – SEA (kg/head/day)
Average Daily Milking – China (kg/head/day)
35.3 38.1 38.6 38.4 37.4
0
5
10
15
20
25
30
35
40
3Q2016 4Q2016 1Q2017 2Q2017 3Q2017
China
(kg/head/day)
31.0 30.0 32.3 33.8 33.3
0
5
10
15
20
25
30
35
3Q2016 4Q2016 1Q2017 2Q2017 3Q2017
SEA
(kg/head/day)
Consumer Food – Financial Performance
21
RevenueUS$ million
PATUS$ million
Operating ProfitUS$ million
EBITDAUS$ million
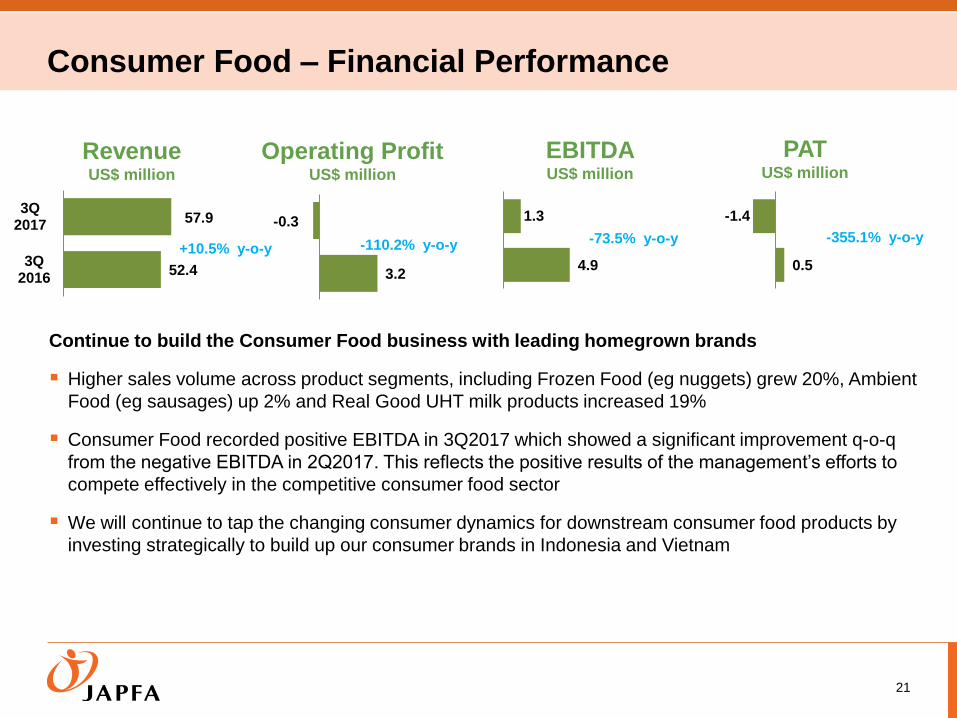
3.2
-0.3
-110.2% y-o-y
Continue to build the Consumer Food business with leading homegrown brands
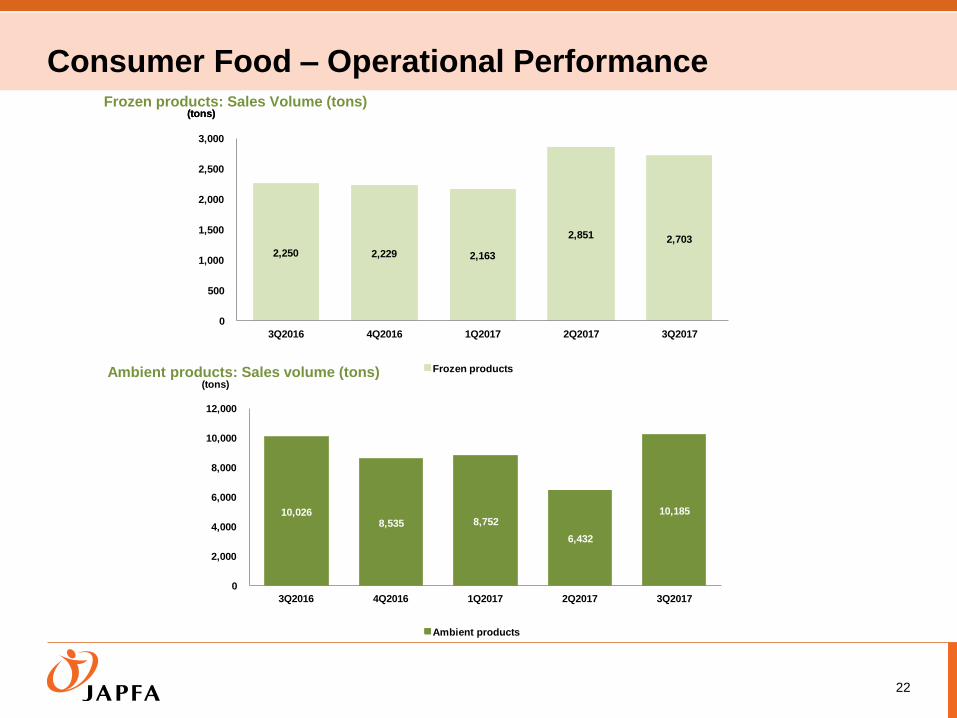
Higher sales volume across product segments, including Frozen Food (eg nuggets) grew 20%, Ambient
Food (eg sausages) up 2% and Real Good UHT milk products increased 19%
Consumer Food recorded positive EBITDA in 3Q2017 which showed a significant improvement q-o-q
from the negative EBITDA in 2Q2017. This reflects the positive results of the management’s efforts to
compete effectively in the competitive consumer food sector
We will continue to tap the changing consumer dynamics for downstream consumer food products by
investing strategically to build up our consumer brands in Indonesia and Vietnam
52.4
57.9
3Q2016
3Q2017
+10.5% y-o-y4.9
1.3
-73.5% y-o-y
0.5
-1.4
-355.1% y-o-y
Consumer Food – Operational Performance
22
Frozen products: Sales Volume (tons)
Ambient products: Sales volume (tons)
2,250 2,229 2,163
2,851 2,703
0
500
1,000
1,500
2,000
2,500
3,000
3Q2016 4Q2016 1Q2017 2Q2017 3Q2017
Frozen products
(tons)(tons)
10,026 8,535 8,752
6,432
10,185
0
2,000
4,000
6,000
8,000
10,000
12,000
3Q2016 4Q2016 1Q2017 2Q2017 3Q2017
Ambient products
(tons)
Other Financial Highlights
Other Financial Highlights
24
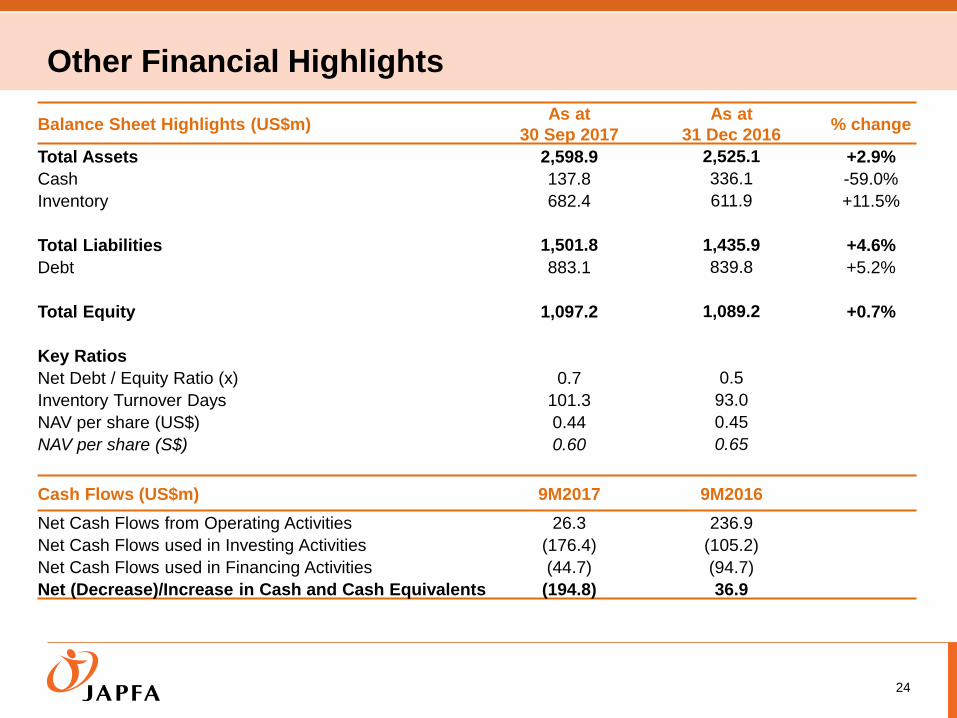
Balance Sheet Highlights (US$m)As at
30 Sep 2017
As at
31 Dec 2016% change
Total Assets 2,598.9 2,525.1 +2.9%
Cash 137.8 336.1 -59.0%
Inventory 682.4 611.9 +11.5%
Total Liabilities 1,501.8 1,435.9 +4.6%
Debt 883.1 839.8 +5.2%
Total Equity 1,097.2 1,089.2 +0.7%
Key Ratios
Net Debt / Equity Ratio (x) 0.7 0.5
Inventory Turnover Days 101.3 93.0
NAV per share (US$) 0.44 0.45
NAV per share (S$) 0.60 0.65
Cash Flows (US$m) 9M2017 9M2016
Net Cash Flows from Operating Activities 26.3 236.9
Net Cash Flows used in Investing Activities (176.4) (105.2)
Net Cash Flows used in Financing Activities (44.7) (94.7)
Net (Decrease)/Increase in Cash and Cash Equivalents (194.8) 36.9
Segmental Debt & Cash Profile
25
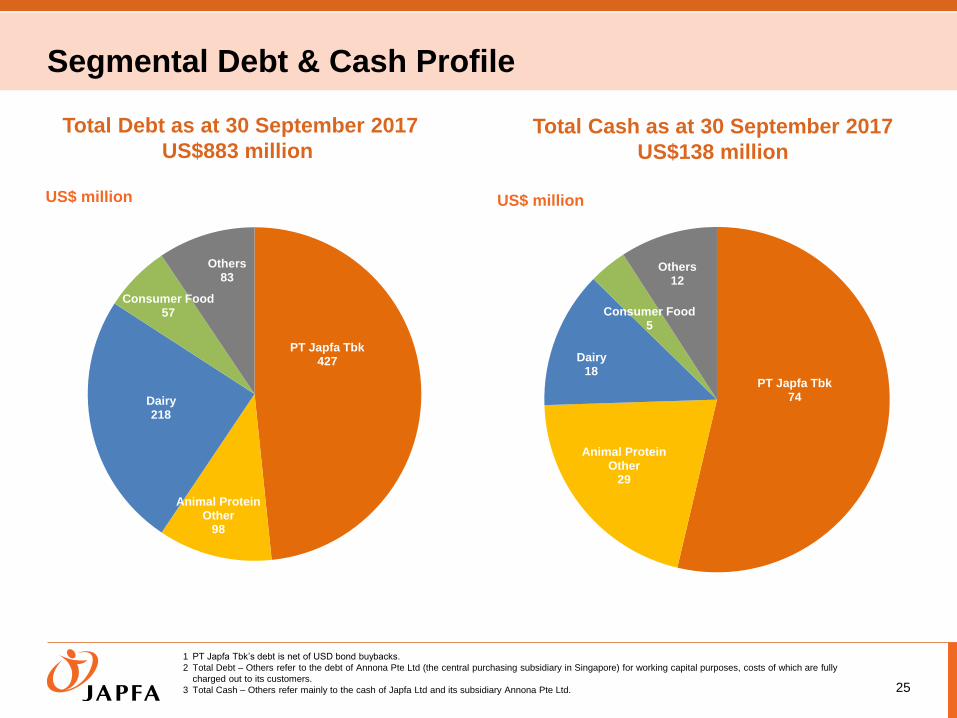
Total Debt as at 30 September 2017
US$883 millionTotal Cash as at 30 September 2017
US$138 million
1 PT Japfa Tbk’s debt is net of USD bond buybacks.
2 Total Debt – Others refer to the debt of Annona Pte Ltd (the central purchasing subsidiary in Singapore) for working capital purposes, costs of which are fully
charged out to its customers.
3 Total Cash – Others refer mainly to the cash of Japfa Ltd and its subsidiary Annona Pte Ltd.
PT Japfa Tbk427
Animal Protein Other
98
Dairy218
Consumer Food57
Others83
US$ million
PT Japfa Tbk74
Animal Protein Other
29
Dairy18
Consumer Food5
Others12
US$ million
PT Japfa Tbk New IDR 3 Trillion Bank Term Loan
Key Terms of new loan signed in 3Q2017
Committed loan facility
On an unsecured basis
3 years with option to extend another 2 years
For working capital and general corporate use
Club deal with 3 of PT Japfa Tbk’s existing major banks (BCA, Bank Mandiri and Maybank)
Key Highlights
This loan consolidates the previous secured facilities into an unsecured facility under one
agreement1
This is a landmark loan as committed and unsecured bank term loans of this quantum are
not common in Indonesia
This attests to the creditworthiness of PT Japfa Tbk and the strong relationships built up
over the years with its major banks
This loan will be in line with the existing USD and IDR bonds on an unsecured basis
26
1 The borrowers comprise PT Japfa Tbk and its four major subsidiaries
US$250 million USD Bond
PT Japfa Tbk issued a total of US$250 million 5-Year USD bond in 1H2017
Coupon is 5.50% p.a. due March 2022 and Reg S issue
P&I are hedged for the full duration of the bond up to the all time high of USD/IDR
exchange rate
IDR 3.0 trillion Re-tap Bond Programme
This programme allows PT Japfa Tbk to tap the IDR bond market over a 2-year period
PT Japfa Tbk Unsecured USD Bond and IDR Bond
27
Amount Term / Pricing
1st Tap
(Launched in Nov 2016)
I. IDR 0.85 trillion due Dec 2019
II. IDR 0.15 trillion due Dec 2021
Total: IDR 1.0 trillion
I. 3-Year: Coupon 9.25% p.a.
II. 5-Year: Coupon 9.75% p.a.
2nd Tap
(Launched in Mar 2017)
IDR 1.0 trillion due April 2022 5-Year: Coupon 9.60% p.a.
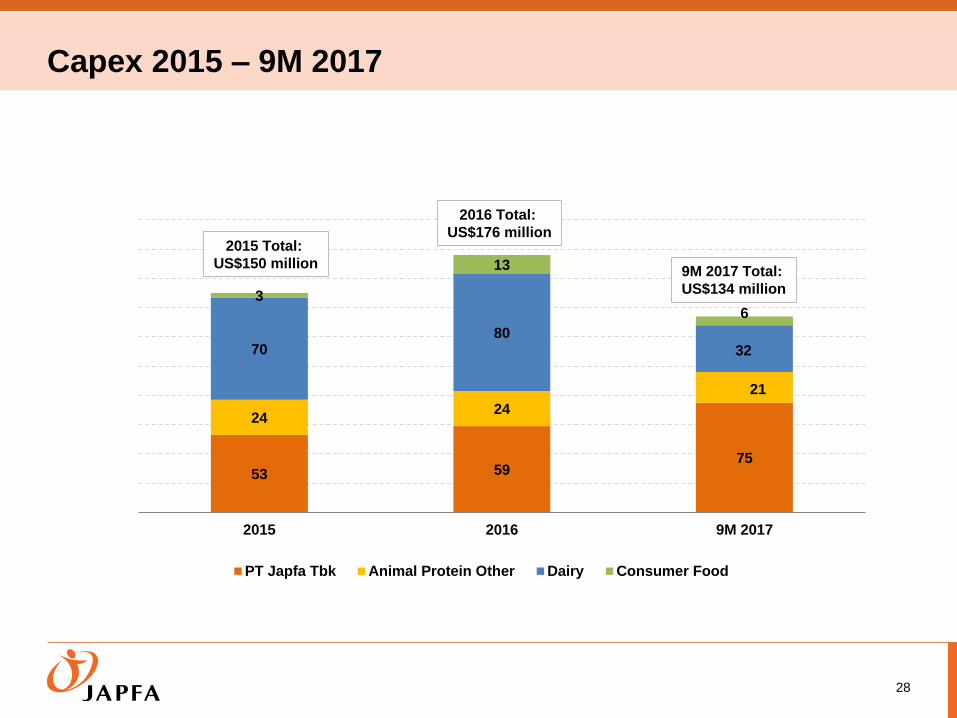
Capex 2015 – 9M 2017
28
53 59 75
24 24
21
70 80
32
3
13
6
2015 2016 9M 2017
PT Japfa Tbk Animal Protein Other Dairy Consumer Food
2015 Total:
US$150 million
2016 Total:
US$176 million
9M 2017 Total:
US$134 million
Looking Ahead
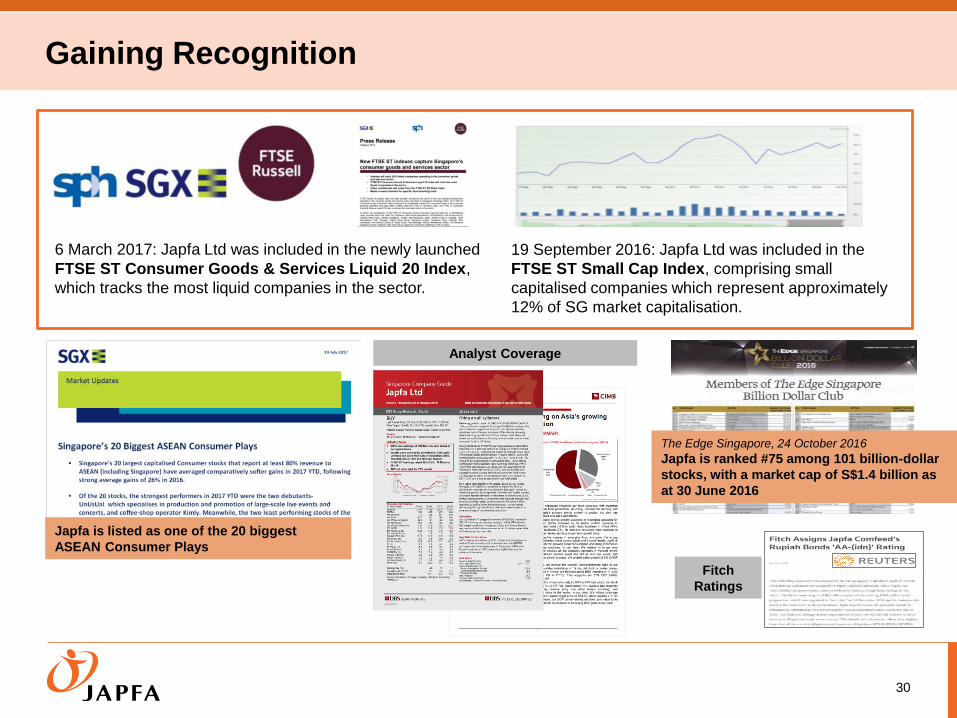
Gaining Recognition
30
Analyst Coverage
6 March 2017: Japfa Ltd was included in the newly launched
FTSE ST Consumer Goods & Services Liquid 20 Index,
which tracks the most liquid companies in the sector.
The Edge Singapore, 24 October 2016
Japfa is ranked #75 among 101 billion-dollar
stocks, with a market cap of S$1.4 billion as
at 30 June 2016
19 September 2016: Japfa Ltd was included in the
FTSE ST Small Cap Index, comprising small
capitalised companies which represent approximately
12% of SG market capitalisation.
Japfa is listed as one of the 20 biggest
ASEAN Consumer Plays
Fitch
Ratings
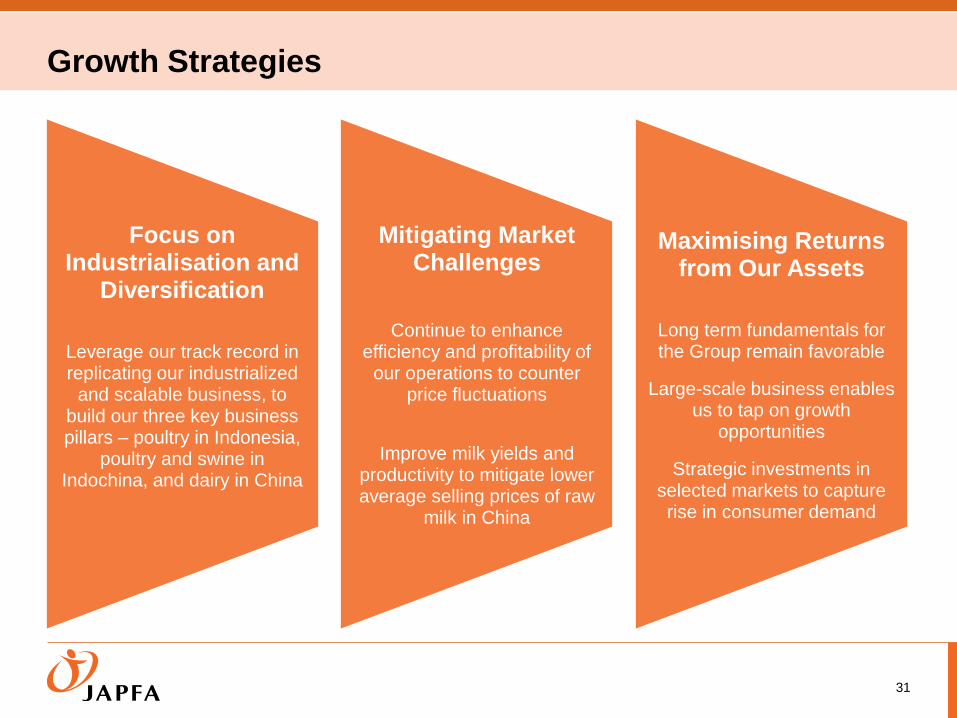
Growth Strategies
31
Focus on Industrialisation and
Diversification
Leverage our track record in replicating our industrialized
and scalable business, to build our three key business pillars – poultry in Indonesia,
poultry and swine in Indochina, and dairy in China
Mitigating Market Challenges
Continue to enhance efficiency and profitability of
our operations to counter price fluctuations
Improve milk yields and productivity to mitigate lower average selling prices of raw
milk in China
Maximising Returns from Our Assets
Long term fundamentals for the Group remain favorable
Large-scale business enables us to tap on growth
opportunities
Strategic investments in selected markets to capture rise in consumer demand
Appendix
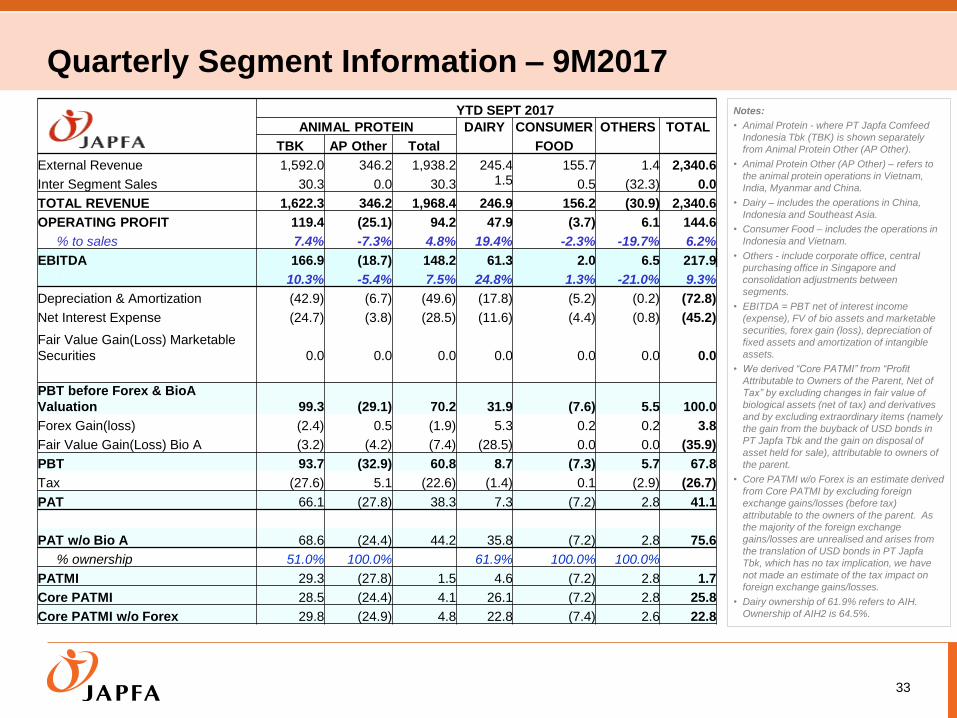
YTD SEPT 2017
ANIMAL PROTEIN DAIRY CONSUMER OTHERS TOTAL
TBK AP Other Total FOOD
External Revenue 1,592.0 346.2 1,938.2 245.4 155.7 1.4 2,340.6
Inter Segment Sales 30.3 0.0 30.3 1.5 0.5 (32.3) 0.0
TOTAL REVENUE 1,622.3 346.2 1,968.4 246.9 156.2 (30.9) 2,340.6
OPERATING PROFIT 119.4 (25.1) 94.2 47.9 (3.7) 6.1 144.6
% to sales 7.4% -7.3% 4.8% 19.4% -2.3% -19.7% 6.2%
EBITDA 166.9 (18.7) 148.2 61.3 2.0 6.5 217.9
10.3% -5.4% 7.5% 24.8% 1.3% -21.0% 9.3%
Depreciation & Amortization (42.9) (6.7) (49.6) (17.8) (5.2) (0.2) (72.8)
Net Interest Expense (24.7) (3.8) (28.5) (11.6) (4.4) (0.8) (45.2)
Fair Value Gain(Loss) Marketable
Securities 0.0 0.0 0.0 0.0 0.0 0.0 0.0
PBT before Forex & BioA
Valuation 99.3 (29.1) 70.2 31.9 (7.6) 5.5 100.0
Forex Gain(loss) (2.4) 0.5 (1.9) 5.3 0.2 0.2 3.8
Fair Value Gain(Loss) Bio A (3.2) (4.2) (7.4) (28.5) 0.0 0.0 (35.9)
PBT 93.7 (32.9) 60.8 8.7 (7.3) 5.7 67.8
Tax (27.6) 5.1 (22.6) (1.4) 0.1 (2.9) (26.7)
PAT 66.1 (27.8) 38.3 7.3 (7.2) 2.8 41.1
PAT w/o Bio A 68.6 (24.4) 44.2 35.8 (7.2) 2.8 75.6
% ownership 51.0% 100.0% 61.9% 100.0% 100.0%
PATMI 29.3 (27.8) 1.5 4.6 (7.2) 2.8 1.7
Core PATMI 28.5 (24.4) 4.1 26.1 (7.2) 2.8 25.8
Core PATMI w/o Forex 29.8 (24.9) 4.8 22.8 (7.4) 2.6 22.8
Quarterly Segment Information – 9M2017
33
Notes:
• Animal Protein - where PT Japfa Comfeed
Indonesia Tbk (TBK) is shown separately
from Animal Protein Other (AP Other).
• Animal Protein Other (AP Other) – refers to
the animal protein operations in Vietnam,
India, Myanmar and China.
• Dairy – includes the operations in China,
Indonesia and Southeast Asia.
• Consumer Food – includes the operations in
Indonesia and Vietnam.
• Others - include corporate office, central
purchasing office in Singapore and
consolidation adjustments between
segments.
• EBITDA = PBT net of interest income
(expense), FV of bio assets and marketable
securities, forex gain (loss), depreciation of
fixed assets and amortization of intangible
assets.
• We derived “Core PATMI” from “Profit
Attributable to Owners of the Parent, Net of
Tax” by excluding changes in fair value of
biological assets (net of tax) and derivatives
and by excluding extraordinary items (namely
the gain from the buyback of USD bonds in
PT Japfa Tbk and the gain on disposal of
asset held for sale), attributable to owners of
the parent.
• Core PATMI w/o Forex is an estimate derived
from Core PATMI by excluding foreign
exchange gains/losses (before tax)
attributable to the owners of the parent. As
the majority of the foreign exchange
gains/losses are unrealised and arises from
the translation of USD bonds in PT Japfa
Tbk, which has no tax implication, we have
not made an estimate of the tax impact on
foreign exchange gains/losses.
• Dairy ownership of 61.9% refers to AIH.
Ownership of AIH2 is 64.5%.
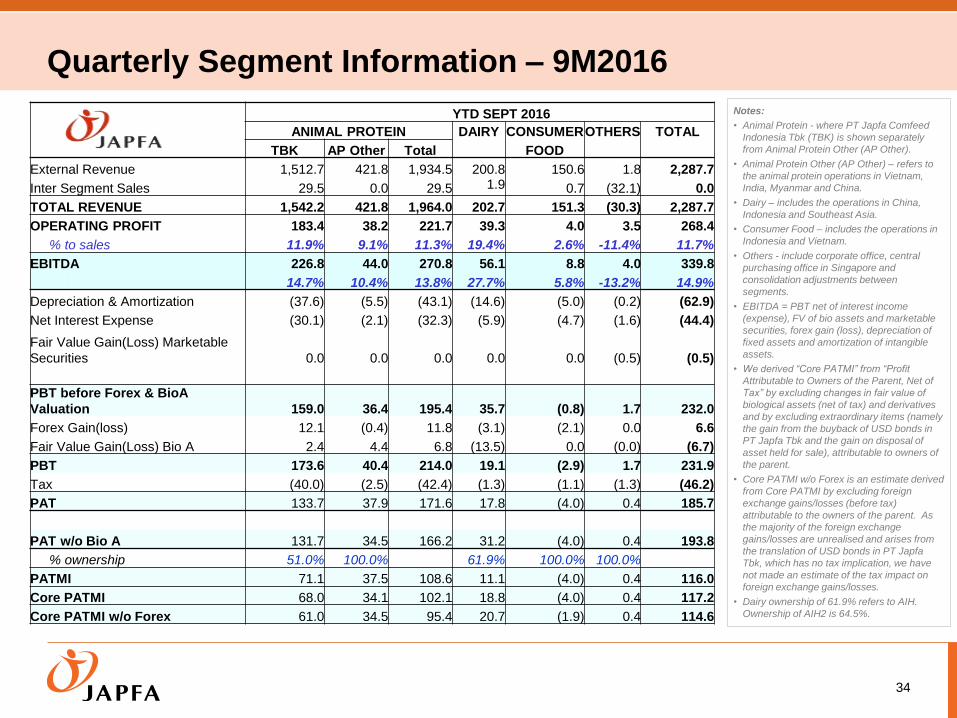
YTD SEPT 2016
ANIMAL PROTEIN DAIRY CONSUMEROTHERS TOTAL
TBK AP Other Total FOOD
External Revenue 1,512.7 421.8 1,934.5 200.8 150.6 1.8 2,287.7
Inter Segment Sales 29.5 0.0 29.5 1.9 0.7 (32.1) 0.0
TOTAL REVENUE 1,542.2 421.8 1,964.0 202.7 151.3 (30.3) 2,287.7
OPERATING PROFIT 183.4 38.2 221.7 39.3 4.0 3.5 268.4
% to sales 11.9% 9.1% 11.3% 19.4% 2.6% -11.4% 11.7%
EBITDA 226.8 44.0 270.8 56.1 8.8 4.0 339.8
14.7% 10.4% 13.8% 27.7% 5.8% -13.2% 14.9%
Depreciation & Amortization (37.6) (5.5) (43.1) (14.6) (5.0) (0.2) (62.9)
Net Interest Expense (30.1) (2.1) (32.3) (5.9) (4.7) (1.6) (44.4)
Fair Value Gain(Loss) Marketable
Securities 0.0 0.0 0.0 0.0 0.0 (0.5) (0.5)
PBT before Forex & BioA
Valuation 159.0 36.4 195.4 35.7 (0.8) 1.7 232.0
Forex Gain(loss) 12.1 (0.4) 11.8 (3.1) (2.1) 0.0 6.6
Fair Value Gain(Loss) Bio A 2.4 4.4 6.8 (13.5) 0.0 (0.0) (6.7)
PBT 173.6 40.4 214.0 19.1 (2.9) 1.7 231.9
Tax (40.0) (2.5) (42.4) (1.3) (1.1) (1.3) (46.2)
PAT 133.7 37.9 171.6 17.8 (4.0) 0.4 185.7
PAT w/o Bio A 131.7 34.5 166.2 31.2 (4.0) 0.4 193.8
% ownership 51.0% 100.0% 61.9% 100.0% 100.0%
PATMI 71.1 37.5 108.6 11.1 (4.0) 0.4 116.0
Core PATMI 68.0 34.1 102.1 18.8 (4.0) 0.4 117.2
Core PATMI w/o Forex 61.0 34.5 95.4 20.7 (1.9) 0.4 114.6
Quarterly Segment Information – 9M2016
34
Notes:
• Animal Protein - where PT Japfa Comfeed
Indonesia Tbk (TBK) is shown separately
from Animal Protein Other (AP Other).
• Animal Protein Other (AP Other) – refers to
the animal protein operations in Vietnam,
India, Myanmar and China.
• Dairy – includes the operations in China,
Indonesia and Southeast Asia.
• Consumer Food – includes the operations in
Indonesia and Vietnam.
• Others - include corporate office, central
purchasing office in Singapore and
consolidation adjustments between
segments.
• EBITDA = PBT net of interest income
(expense), FV of bio assets and marketable
securities, forex gain (loss), depreciation of
fixed assets and amortization of intangible
assets.
• We derived “Core PATMI” from “Profit
Attributable to Owners of the Parent, Net of
Tax” by excluding changes in fair value of
biological assets (net of tax) and derivatives
and by excluding extraordinary items (namely
the gain from the buyback of USD bonds in
PT Japfa Tbk and the gain on disposal of
asset held for sale), attributable to owners of
the parent.
• Core PATMI w/o Forex is an estimate derived
from Core PATMI by excluding foreign
exchange gains/losses (before tax)
attributable to the owners of the parent. As
the majority of the foreign exchange
gains/losses are unrealised and arises from
the translation of USD bonds in PT Japfa
Tbk, which has no tax implication, we have
not made an estimate of the tax impact on
foreign exchange gains/losses.
• Dairy ownership of 61.9% refers to AIH.
Ownership of AIH2 is 64.5%.
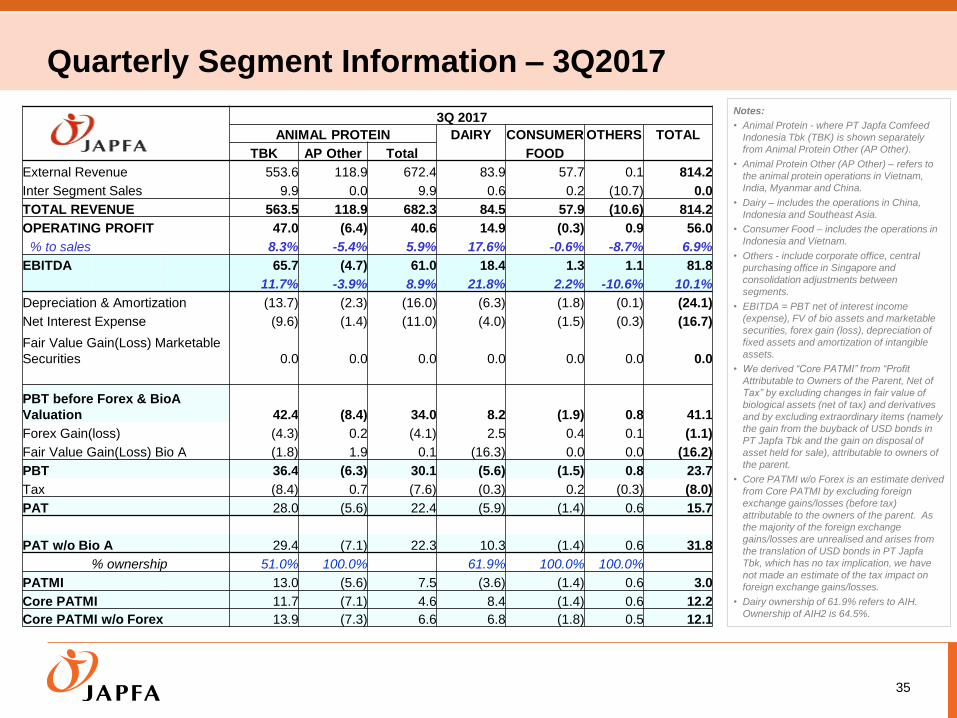
3Q 2017
ANIMAL PROTEIN DAIRY CONSUMER OTHERS TOTAL
TBK AP Other Total FOOD
External Revenue 553.6 118.9 672.4 83.9 57.7 0.1 814.2
Inter Segment Sales 9.9 0.0 9.9 0.6 0.2 (10.7) 0.0
TOTAL REVENUE 563.5 118.9 682.3 84.5 57.9 (10.6) 814.2
OPERATING PROFIT 47.0 (6.4) 40.6 14.9 (0.3) 0.9 56.0
% to sales 8.3% -5.4% 5.9% 17.6% -0.6% -8.7% 6.9%
EBITDA 65.7 (4.7) 61.0 18.4 1.3 1.1 81.8
11.7% -3.9% 8.9% 21.8% 2.2% -10.6% 10.1%
Depreciation & Amortization (13.7) (2.3) (16.0) (6.3) (1.8) (0.1) (24.1)
Net Interest Expense (9.6) (1.4) (11.0) (4.0) (1.5) (0.3) (16.7)
Fair Value Gain(Loss) Marketable
Securities 0.0 0.0 0.0 0.0 0.0 0.0 0.0
PBT before Forex & BioA
Valuation 42.4 (8.4) 34.0 8.2 (1.9) 0.8 41.1
Forex Gain(loss) (4.3) 0.2 (4.1) 2.5 0.4 0.1 (1.1)
Fair Value Gain(Loss) Bio A (1.8) 1.9 0.1 (16.3) 0.0 0.0 (16.2)
PBT 36.4 (6.3) 30.1 (5.6) (1.5) 0.8 23.7
Tax (8.4) 0.7 (7.6) (0.3) 0.2 (0.3) (8.0)
PAT 28.0 (5.6) 22.4 (5.9) (1.4) 0.6 15.7
PAT w/o Bio A 29.4 (7.1) 22.3 10.3 (1.4) 0.6 31.8
% ownership 51.0% 100.0% 61.9% 100.0% 100.0%
PATMI 13.0 (5.6) 7.5 (3.6) (1.4) 0.6 3.0
Core PATMI 11.7 (7.1) 4.6 8.4 (1.4) 0.6 12.2
Core PATMI w/o Forex 13.9 (7.3) 6.6 6.8 (1.8) 0.5 12.1
Quarterly Segment Information – 3Q2017
35
Notes:
• Animal Protein - where PT Japfa Comfeed
Indonesia Tbk (TBK) is shown separately
from Animal Protein Other (AP Other).
• Animal Protein Other (AP Other) – refers to
the animal protein operations in Vietnam,
India, Myanmar and China.
• Dairy – includes the operations in China,
Indonesia and Southeast Asia.
• Consumer Food – includes the operations in
Indonesia and Vietnam.
• Others - include corporate office, central
purchasing office in Singapore and
consolidation adjustments between
segments.
• EBITDA = PBT net of interest income
(expense), FV of bio assets and marketable
securities, forex gain (loss), depreciation of
fixed assets and amortization of intangible
assets.
• We derived “Core PATMI” from “Profit
Attributable to Owners of the Parent, Net of
Tax” by excluding changes in fair value of
biological assets (net of tax) and derivatives
and by excluding extraordinary items (namely
the gain from the buyback of USD bonds in
PT Japfa Tbk and the gain on disposal of
asset held for sale), attributable to owners of
the parent.
• Core PATMI w/o Forex is an estimate derived
from Core PATMI by excluding foreign
exchange gains/losses (before tax)
attributable to the owners of the parent. As
the majority of the foreign exchange
gains/losses are unrealised and arises from
the translation of USD bonds in PT Japfa
Tbk, which has no tax implication, we have
not made an estimate of the tax impact on
foreign exchange gains/losses.
• Dairy ownership of 61.9% refers to AIH.
Ownership of AIH2 is 64.5%.
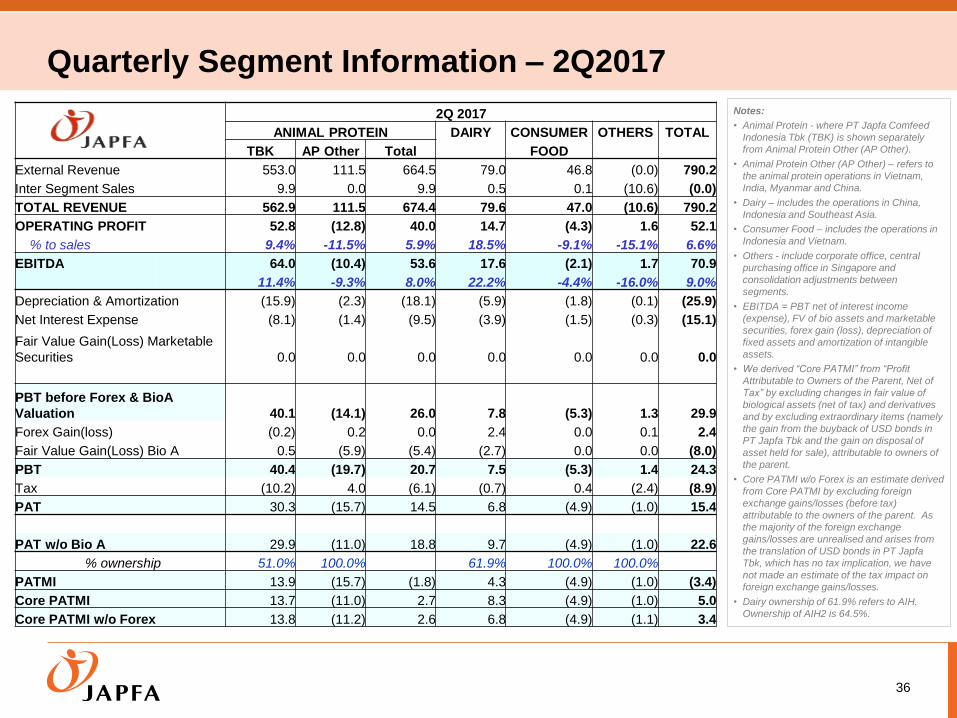
2Q 2017
ANIMAL PROTEIN DAIRY CONSUMER OTHERS TOTAL
TBK AP Other Total FOOD
External Revenue 553.0 111.5 664.5 79.0 46.8 (0.0) 790.2
Inter Segment Sales 9.9 0.0 9.9 0.5 0.1 (10.6) (0.0)
TOTAL REVENUE 562.9 111.5 674.4 79.6 47.0 (10.6) 790.2
OPERATING PROFIT 52.8 (12.8) 40.0 14.7 (4.3) 1.6 52.1
% to sales 9.4% -11.5% 5.9% 18.5% -9.1% -15.1% 6.6%
EBITDA 64.0 (10.4) 53.6 17.6 (2.1) 1.7 70.9
11.4% -9.3% 8.0% 22.2% -4.4% -16.0% 9.0%
Depreciation & Amortization (15.9) (2.3) (18.1) (5.9) (1.8) (0.1) (25.9)
Net Interest Expense (8.1) (1.4) (9.5) (3.9) (1.5) (0.3) (15.1)
Fair Value Gain(Loss) Marketable
Securities 0.0 0.0 0.0 0.0 0.0 0.0 0.0
PBT before Forex & BioA
Valuation 40.1 (14.1) 26.0 7.8 (5.3) 1.3 29.9
Forex Gain(loss) (0.2) 0.2 0.0 2.4 0.0 0.1 2.4
Fair Value Gain(Loss) Bio A 0.5 (5.9) (5.4) (2.7) 0.0 0.0 (8.0)
PBT 40.4 (19.7) 20.7 7.5 (5.3) 1.4 24.3
Tax (10.2) 4.0 (6.1) (0.7) 0.4 (2.4) (8.9)
PAT 30.3 (15.7) 14.5 6.8 (4.9) (1.0) 15.4
PAT w/o Bio A 29.9 (11.0) 18.8 9.7 (4.9) (1.0) 22.6
% ownership 51.0% 100.0% 61.9% 100.0% 100.0%
PATMI 13.9 (15.7) (1.8) 4.3 (4.9) (1.0) (3.4)
Core PATMI 13.7 (11.0) 2.7 8.3 (4.9) (1.0) 5.0
Core PATMI w/o Forex 13.8 (11.2) 2.6 6.8 (4.9) (1.1) 3.4
Quarterly Segment Information – 2Q2017
36
Notes:
• Animal Protein - where PT Japfa Comfeed
Indonesia Tbk (TBK) is shown separately
from Animal Protein Other (AP Other).
• Animal Protein Other (AP Other) – refers to
the animal protein operations in Vietnam,
India, Myanmar and China.
• Dairy – includes the operations in China,
Indonesia and Southeast Asia.
• Consumer Food – includes the operations in
Indonesia and Vietnam.
• Others - include corporate office, central
purchasing office in Singapore and
consolidation adjustments between
segments.
• EBITDA = PBT net of interest income
(expense), FV of bio assets and marketable
securities, forex gain (loss), depreciation of
fixed assets and amortization of intangible
assets.
• We derived “Core PATMI” from “Profit
Attributable to Owners of the Parent, Net of
Tax” by excluding changes in fair value of
biological assets (net of tax) and derivatives
and by excluding extraordinary items (namely
the gain from the buyback of USD bonds in
PT Japfa Tbk and the gain on disposal of
asset held for sale), attributable to owners of
the parent.
• Core PATMI w/o Forex is an estimate derived
from Core PATMI by excluding foreign
exchange gains/losses (before tax)
attributable to the owners of the parent. As
the majority of the foreign exchange
gains/losses are unrealised and arises from
the translation of USD bonds in PT Japfa
Tbk, which has no tax implication, we have
not made an estimate of the tax impact on
foreign exchange gains/losses.
• Dairy ownership of 61.9% refers to AIH.
Ownership of AIH2 is 64.5%.
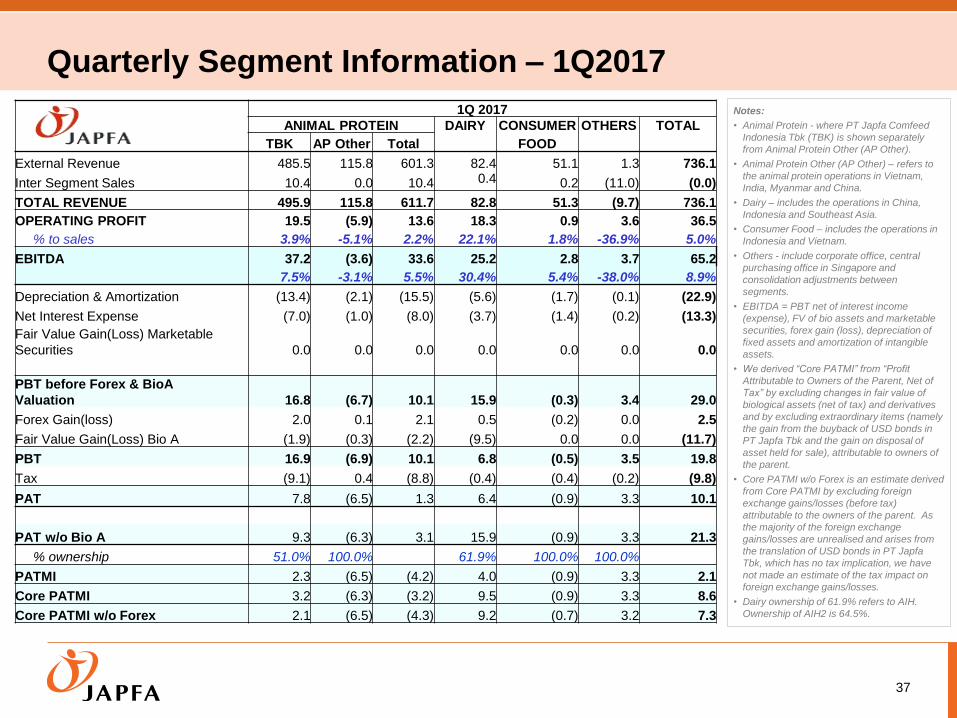
Quarterly Segment Information – 1Q2017
37
Notes:
• Animal Protein - where PT Japfa Comfeed
Indonesia Tbk (TBK) is shown separately
from Animal Protein Other (AP Other).
• Animal Protein Other (AP Other) – refers to
the animal protein operations in Vietnam,
India, Myanmar and China.
• Dairy – includes the operations in China,
Indonesia and Southeast Asia.
• Consumer Food – includes the operations in
Indonesia and Vietnam.
• Others - include corporate office, central
purchasing office in Singapore and
consolidation adjustments between
segments.
• EBITDA = PBT net of interest income
(expense), FV of bio assets and marketable
securities, forex gain (loss), depreciation of
fixed assets and amortization of intangible
assets.
• We derived “Core PATMI” from “Profit
Attributable to Owners of the Parent, Net of
Tax” by excluding changes in fair value of
biological assets (net of tax) and derivatives
and by excluding extraordinary items (namely
the gain from the buyback of USD bonds in
PT Japfa Tbk and the gain on disposal of
asset held for sale), attributable to owners of
the parent.
• Core PATMI w/o Forex is an estimate derived
from Core PATMI by excluding foreign
exchange gains/losses (before tax)
attributable to the owners of the parent. As
the majority of the foreign exchange
gains/losses are unrealised and arises from
the translation of USD bonds in PT Japfa
Tbk, which has no tax implication, we have
not made an estimate of the tax impact on
foreign exchange gains/losses.
• Dairy ownership of 61.9% refers to AIH.
Ownership of AIH2 is 64.5%.
1Q 2017
ANIMAL PROTEIN DAIRY CONSUMER OTHERS TOTAL
TBK AP Other Total FOOD
External Revenue 485.5 115.8 601.3 82.4 51.1 1.3 736.1
Inter Segment Sales 10.4 0.0 10.4 0.4 0.2 (11.0) (0.0)
TOTAL REVENUE 495.9 115.8 611.7 82.8 51.3 (9.7) 736.1
OPERATING PROFIT 19.5 (5.9) 13.6 18.3 0.9 3.6 36.5
% to sales 3.9% -5.1% 2.2% 22.1% 1.8% -36.9% 5.0%
EBITDA 37.2 (3.6) 33.6 25.2 2.8 3.7 65.2
7.5% -3.1% 5.5% 30.4% 5.4% -38.0% 8.9%
Depreciation & Amortization (13.4) (2.1) (15.5) (5.6) (1.7) (0.1) (22.9)
Net Interest Expense (7.0) (1.0) (8.0) (3.7) (1.4) (0.2) (13.3)
Fair Value Gain(Loss) Marketable
Securities 0.0 0.0 0.0 0.0 0.0 0.0 0.0
PBT before Forex & BioA
Valuation 16.8 (6.7) 10.1 15.9 (0.3) 3.4 29.0
Forex Gain(loss) 2.0 0.1 2.1 0.5 (0.2) 0.0 2.5
Fair Value Gain(Loss) Bio A (1.9) (0.3) (2.2) (9.5) 0.0 0.0 (11.7)
PBT 16.9 (6.9) 10.1 6.8 (0.5) 3.5 19.8
Tax (9.1) 0.4 (8.8) (0.4) (0.4) (0.2) (9.8)
PAT 7.8 (6.5) 1.3 6.4 (0.9) 3.3 10.1
PAT w/o Bio A 9.3 (6.3) 3.1 15.9 (0.9) 3.3 21.3
% ownership 51.0% 100.0% 61.9% 100.0% 100.0%
PATMI 2.3 (6.5) (4.2) 4.0 (0.9) 3.3 2.1
Core PATMI 3.2 (6.3) (3.2) 9.5 (0.9) 3.3 8.6
Core PATMI w/o Forex 2.1 (6.5) (4.3) 9.2 (0.7) 3.2 7.3
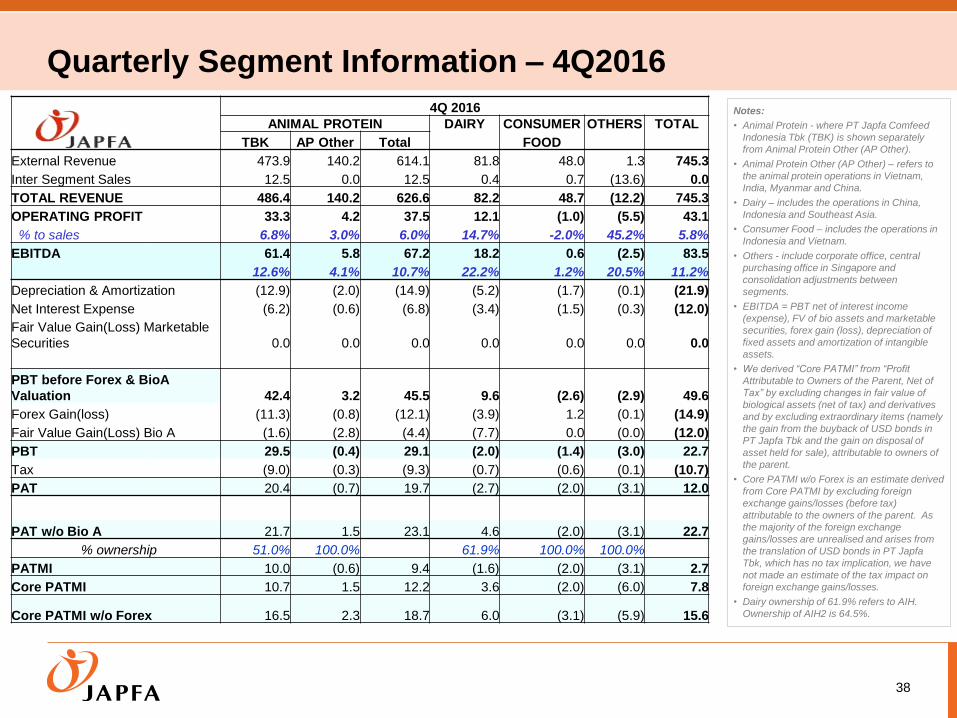
Quarterly Segment Information – 4Q2016
38
4Q 2016
ANIMAL PROTEIN DAIRY CONSUMER OTHERS TOTAL
TBK AP Other Total FOOD
External Revenue 473.9 140.2 614.1 81.8 48.0 1.3 745.3
Inter Segment Sales 12.5 0.0 12.5 0.4 0.7 (13.6) 0.0
TOTAL REVENUE 486.4 140.2 626.6 82.2 48.7 (12.2) 745.3
OPERATING PROFIT 33.3 4.2 37.5 12.1 (1.0) (5.5) 43.1
% to sales 6.8% 3.0% 6.0% 14.7% -2.0% 45.2% 5.8%
EBITDA 61.4 5.8 67.2 18.2 0.6 (2.5) 83.5
12.6% 4.1% 10.7% 22.2% 1.2% 20.5% 11.2%
Depreciation & Amortization (12.9) (2.0) (14.9) (5.2) (1.7) (0.1) (21.9)
Net Interest Expense (6.2) (0.6) (6.8) (3.4) (1.5) (0.3) (12.0)
Fair Value Gain(Loss) Marketable
Securities 0.0 0.0 0.0 0.0 0.0 0.0 0.0
PBT before Forex & BioA
Valuation 42.4 3.2 45.5 9.6 (2.6) (2.9) 49.6
Forex Gain(loss) (11.3) (0.8) (12.1) (3.9) 1.2 (0.1) (14.9)
Fair Value Gain(Loss) Bio A (1.6) (2.8) (4.4) (7.7) 0.0 (0.0) (12.0)
PBT 29.5 (0.4) 29.1 (2.0) (1.4) (3.0) 22.7
Tax (9.0) (0.3) (9.3) (0.7) (0.6) (0.1) (10.7)
PAT 20.4 (0.7) 19.7 (2.7) (2.0) (3.1) 12.0
PAT w/o Bio A 21.7 1.5 23.1 4.6 (2.0) (3.1) 22.7
% ownership 51.0% 100.0% 61.9% 100.0% 100.0%
PATMI 10.0 (0.6) 9.4 (1.6) (2.0) (3.1) 2.7
Core PATMI 10.7 1.5 12.2 3.6 (2.0) (6.0) 7.8
Core PATMI w/o Forex 16.5 2.3 18.7 6.0 (3.1) (5.9) 15.6
Notes:
• Animal Protein - where PT Japfa Comfeed
Indonesia Tbk (TBK) is shown separately
from Animal Protein Other (AP Other).
• Animal Protein Other (AP Other) – refers to
the animal protein operations in Vietnam,
India, Myanmar and China.
• Dairy – includes the operations in China,
Indonesia and Southeast Asia.
• Consumer Food – includes the operations in
Indonesia and Vietnam.
• Others - include corporate office, central
purchasing office in Singapore and
consolidation adjustments between
segments.
• EBITDA = PBT net of interest income
(expense), FV of bio assets and marketable
securities, forex gain (loss), depreciation of
fixed assets and amortization of intangible
assets.
• We derived “Core PATMI” from “Profit
Attributable to Owners of the Parent, Net of
Tax” by excluding changes in fair value of
biological assets (net of tax) and derivatives
and by excluding extraordinary items (namely
the gain from the buyback of USD bonds in
PT Japfa Tbk and the gain on disposal of
asset held for sale), attributable to owners of
the parent.
• Core PATMI w/o Forex is an estimate derived
from Core PATMI by excluding foreign
exchange gains/losses (before tax)
attributable to the owners of the parent. As
the majority of the foreign exchange
gains/losses are unrealised and arises from
the translation of USD bonds in PT Japfa
Tbk, which has no tax implication, we have
not made an estimate of the tax impact on
foreign exchange gains/losses.
• Dairy ownership of 61.9% refers to AIH.
Ownership of AIH2 is 64.5%.
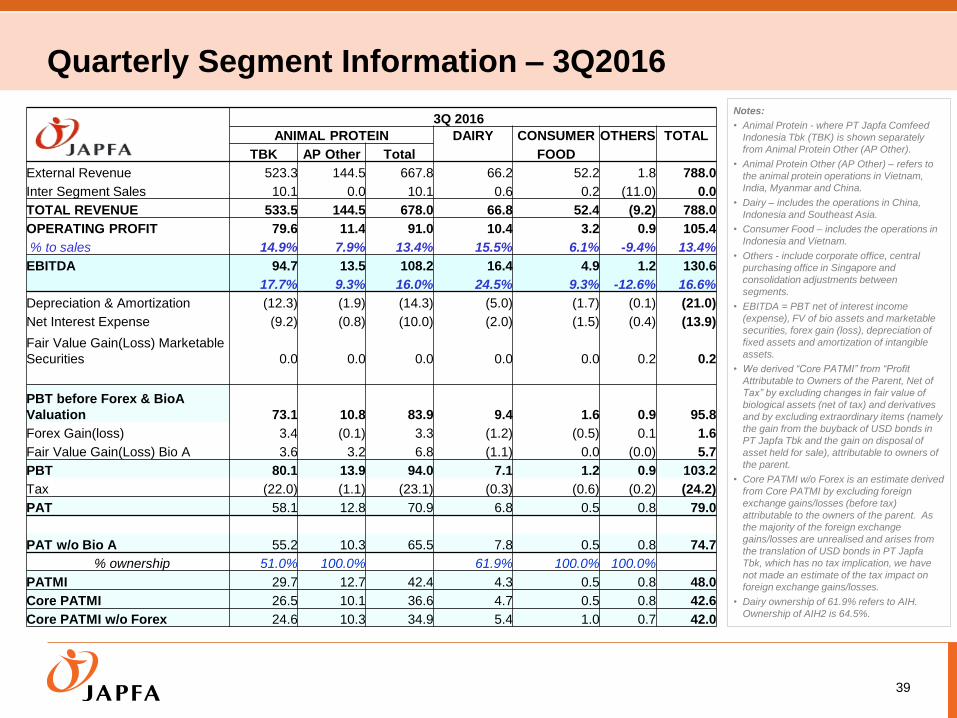
3Q 2016
ANIMAL PROTEIN DAIRY CONSUMER OTHERS TOTAL
TBK AP Other Total FOOD
External Revenue 523.3 144.5 667.8 66.2 52.2 1.8 788.0
Inter Segment Sales 10.1 0.0 10.1 0.6 0.2 (11.0) 0.0
TOTAL REVENUE 533.5 144.5 678.0 66.8 52.4 (9.2) 788.0
OPERATING PROFIT 79.6 11.4 91.0 10.4 3.2 0.9 105.4
% to sales 14.9% 7.9% 13.4% 15.5% 6.1% -9.4% 13.4%
EBITDA 94.7 13.5 108.2 16.4 4.9 1.2 130.6
17.7% 9.3% 16.0% 24.5% 9.3% -12.6% 16.6%
Depreciation & Amortization (12.3) (1.9) (14.3) (5.0) (1.7) (0.1) (21.0)
Net Interest Expense (9.2) (0.8) (10.0) (2.0) (1.5) (0.4) (13.9)
Fair Value Gain(Loss) Marketable
Securities 0.0 0.0 0.0 0.0 0.0 0.2 0.2
PBT before Forex & BioA
Valuation 73.1 10.8 83.9 9.4 1.6 0.9 95.8
Forex Gain(loss) 3.4 (0.1) 3.3 (1.2) (0.5) 0.1 1.6
Fair Value Gain(Loss) Bio A 3.6 3.2 6.8 (1.1) 0.0 (0.0) 5.7
PBT 80.1 13.9 94.0 7.1 1.2 0.9 103.2
Tax (22.0) (1.1) (23.1) (0.3) (0.6) (0.2) (24.2)
PAT 58.1 12.8 70.9 6.8 0.5 0.8 79.0
PAT w/o Bio A 55.2 10.3 65.5 7.8 0.5 0.8 74.7
% ownership 51.0% 100.0% 61.9% 100.0% 100.0%
PATMI 29.7 12.7 42.4 4.3 0.5 0.8 48.0
Core PATMI 26.5 10.1 36.6 4.7 0.5 0.8 42.6
Core PATMI w/o Forex 24.6 10.3 34.9 5.4 1.0 0.7 42.0
Quarterly Segment Information – 3Q2016
39
Notes:
• Animal Protein - where PT Japfa Comfeed
Indonesia Tbk (TBK) is shown separately
from Animal Protein Other (AP Other).
• Animal Protein Other (AP Other) – refers to
the animal protein operations in Vietnam,
India, Myanmar and China.
• Dairy – includes the operations in China,
Indonesia and Southeast Asia.
• Consumer Food – includes the operations in
Indonesia and Vietnam.
• Others - include corporate office, central
purchasing office in Singapore and
consolidation adjustments between
segments.
• EBITDA = PBT net of interest income
(expense), FV of bio assets and marketable
securities, forex gain (loss), depreciation of
fixed assets and amortization of intangible
assets.
• We derived “Core PATMI” from “Profit
Attributable to Owners of the Parent, Net of
Tax” by excluding changes in fair value of
biological assets (net of tax) and derivatives
and by excluding extraordinary items (namely
the gain from the buyback of USD bonds in
PT Japfa Tbk and the gain on disposal of
asset held for sale), attributable to owners of
the parent.
• Core PATMI w/o Forex is an estimate derived
from Core PATMI by excluding foreign
exchange gains/losses (before tax)
attributable to the owners of the parent. As
the majority of the foreign exchange
gains/losses are unrealised and arises from
the translation of USD bonds in PT Japfa
Tbk, which has no tax implication, we have
not made an estimate of the tax impact on
foreign exchange gains/losses.
• Dairy ownership of 61.9% refers to AIH.
Ownership of AIH2 is 64.5%.
Thank You