Embed Size (px)
Citation preview

Grindwell Norton Ltd.Investor Meet
31st May 2019
2
Key Indicators
and Trends
GNO-Key Indicators
and Trends
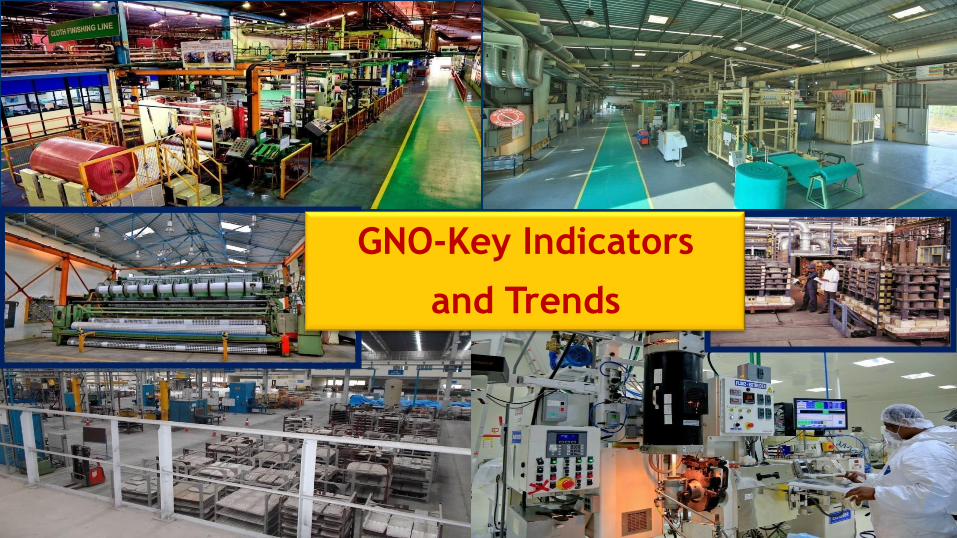
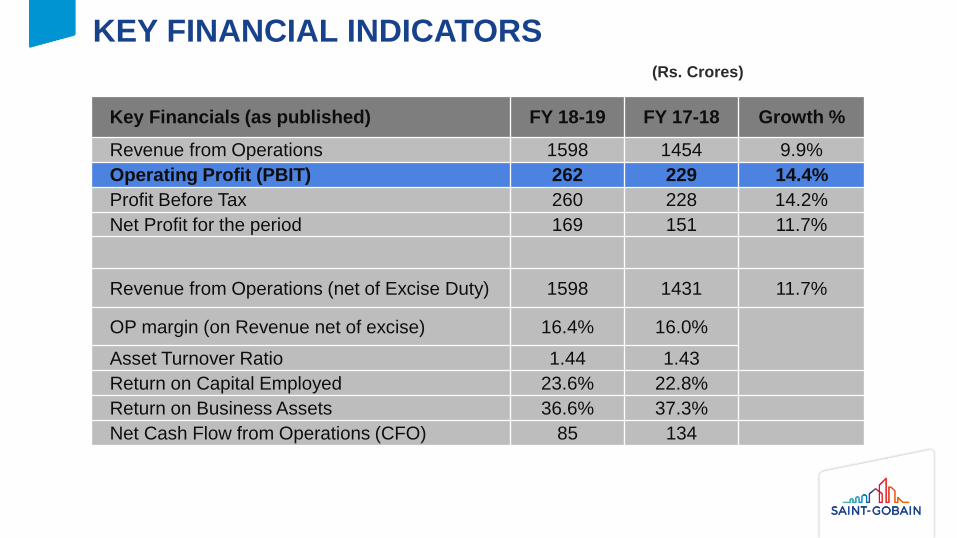
KEY FINANCIAL INDICATORS(Rs. Crores)
Key Financials (as published) FY 18-19 FY 17-18 Growth %
Revenue from Operations 1598 1454 9.9%
Operating Profit (PBIT) 262 229 14.4%
Profit Before Tax 260 228 14.2%
Net Profit for the period 169 151 11.7%
Revenue from Operations (net of Excise Duty) 1598 1431 11.7%
OP margin (on Revenue net of excise) 16.4% 16.0%
Asset Turnover Ratio 1.44 1.43
Return on Capital Employed 23.6% 22.8%
Return on Business Assets 36.6% 37.3%
Net Cash Flow from Operations (CFO) 85 134
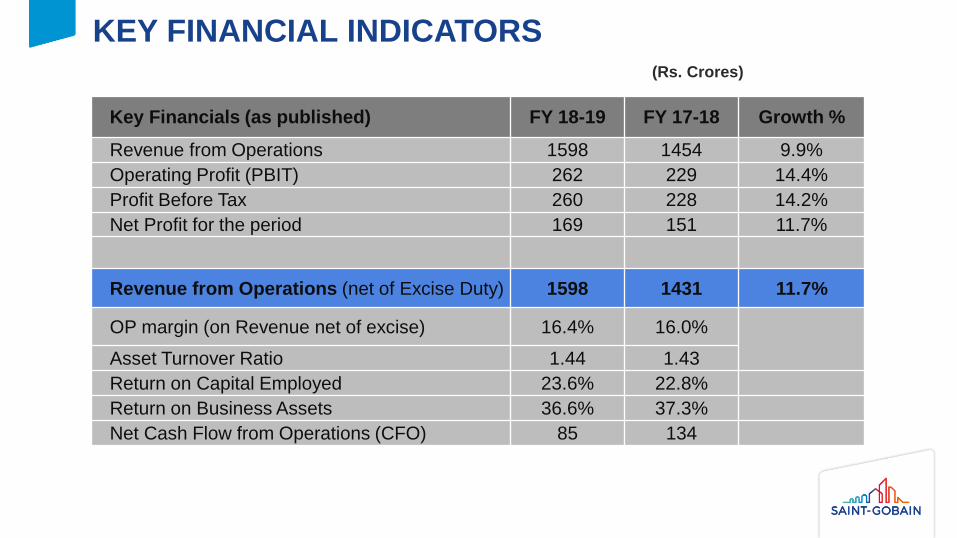
Revenue from Operations bridge
5.9% 5.3% 0.6%
(Rs. Crores)
Apr-Mar 18*
Rs. 1431
Apr-Mar 19
Rs. 1598Increase Rs.167 crores (+11.7%)
*FY 2017-18 numbers are net of excise duty
PCR 29.3%
PPL 14.5%
Abrasives 9.2%
5
FY 2017-18*
Rs. 1431
Abrasives ~ 4%
(Rs. Crores)
FY 2018-19
Rs. 1598(+11.7%)
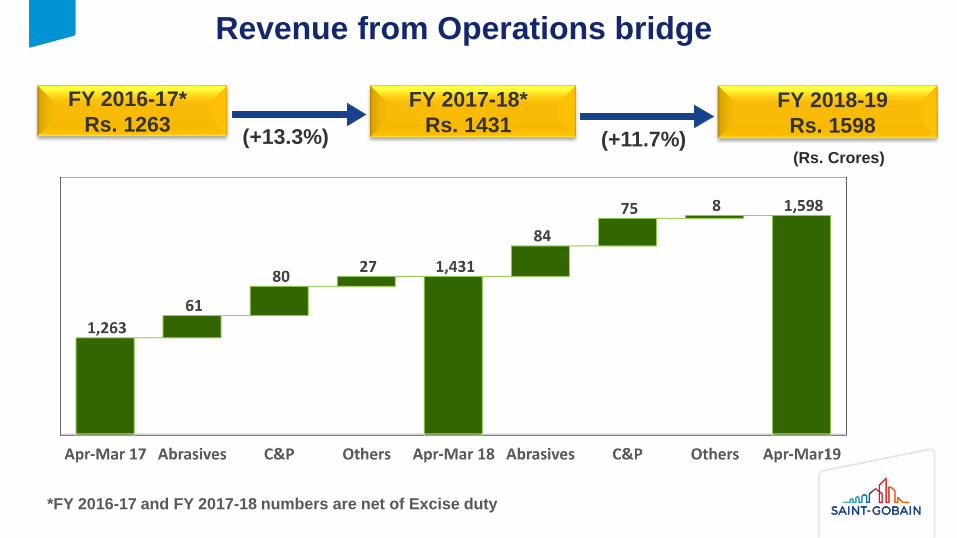
FY 2016-17*
Rs. 1263(+13.3%)
Revenue from Operations bridge
*FY 2016-17 and FY 2017-18 numbers are net of Excise duty
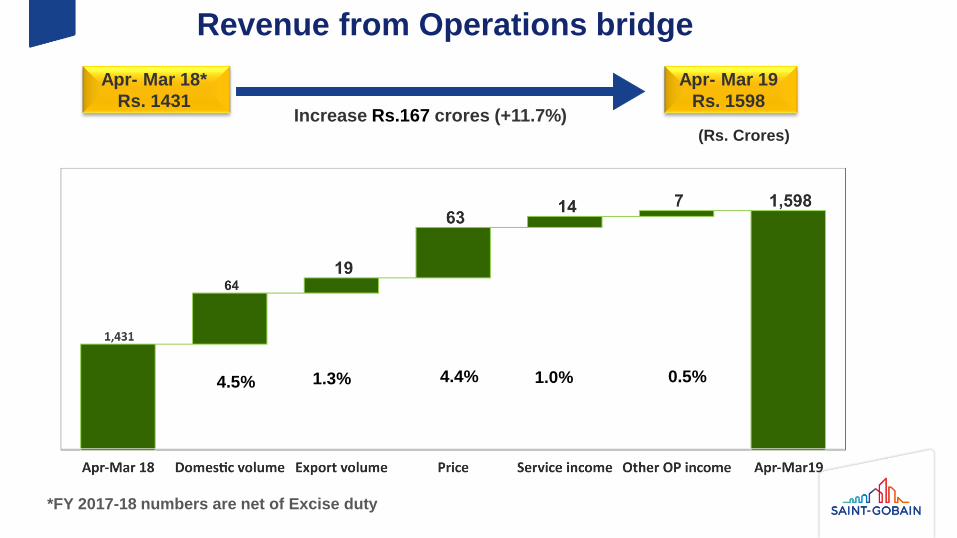
Revenue from Operations bridge
Apr- Mar 18*
Rs. 1431Increase Rs.167 crores (+11.7%)
Apr- Mar 19
Rs. 1598
(Rs. Crores)
1.3% 4.4%4.5% 1.0% 0.5%
*FY 2017-18 numbers are net of Excise duty
7
FY 2017-18*
Rs. 1431
Abrasives ~ 4%
(Rs. Crores)
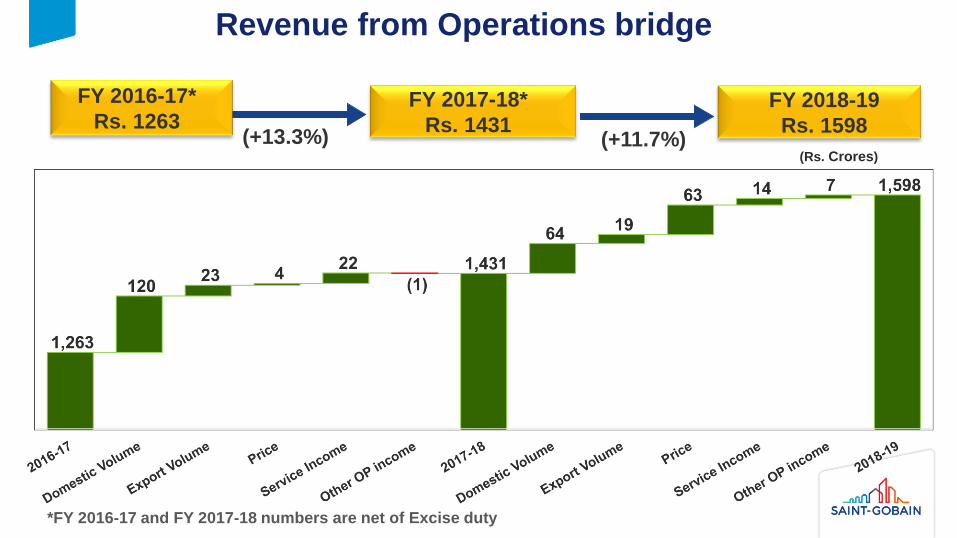
FY 2018-19
Rs. 1598(+11.7%)
FY 2016-17*
Rs. 1263(+13.3%)
Revenue from Operations bridge
*FY 2016-17 and FY 2017-18 numbers are net of Excise duty
8
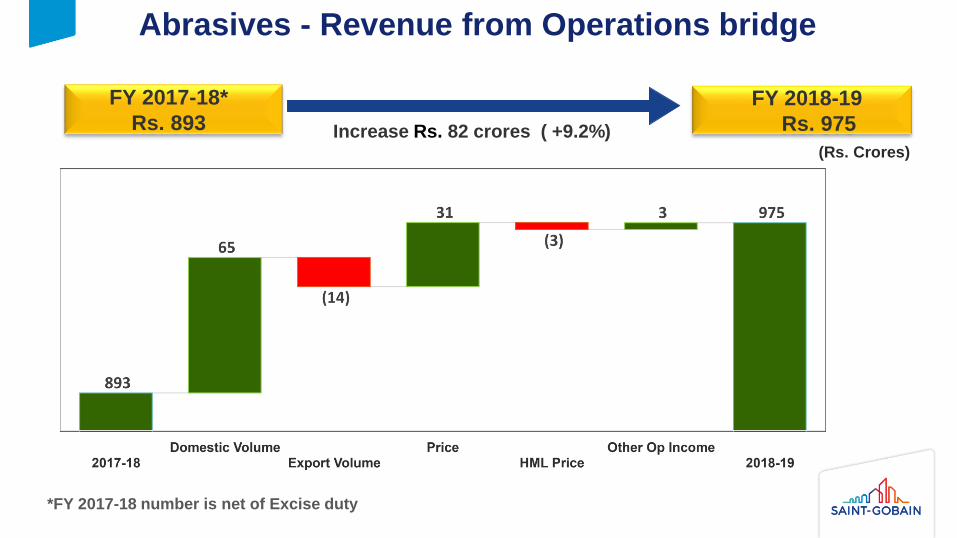
FY 2017-18*
Rs. 893
Abrasives ~ 4%
(Rs. Crores)
FY 2018-19
Rs. 975Increase Rs. 82 crores ( +9.2%)
Abrasives - Revenue from Operations bridge
*FY 2017-18 number is net of Excise duty
318 373
441 502
562
781 884
915 923
1084 10881186
1333
1,479
285 333
397 434
500
710
813 790 820
946 957
1,062
1,184
1,300
33 40 44 68 62 71 71 125 103
138 131 124 149 179
10
260
510
760
1,010
1,260
1,510
2005 2006 2007 2008 09/10 10/11 11/12 12/13 13/14 14/15 15/16 16/17 17/18 18/19
GNO (Total) Domestic
Exports
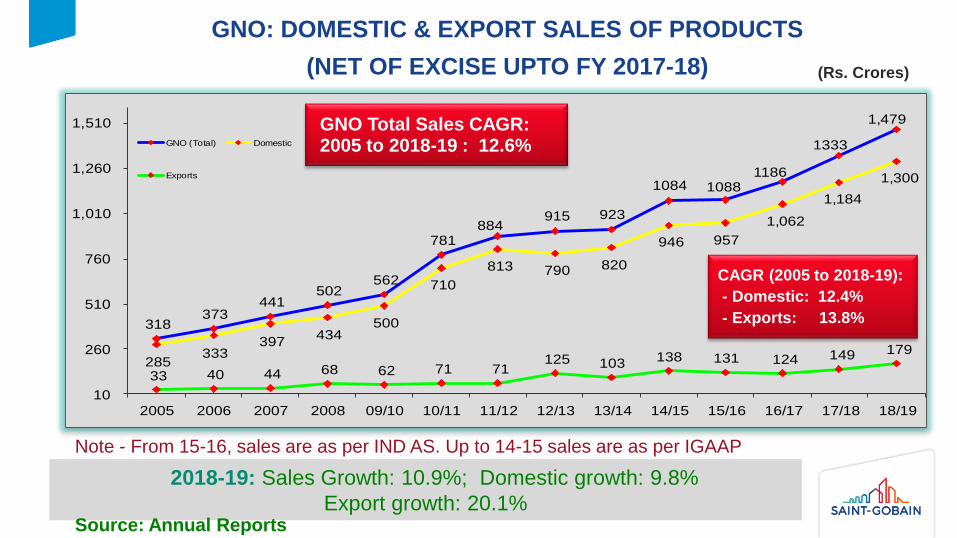
GNO: DOMESTIC & EXPORT SALES OF PRODUCTS
(NET OF EXCISE UPTO FY 2017-18)
9
(Rs. Crores)
GNO Total Sales CAGR:2005 to 2018-19 : 12.6%
2018-19: Sales Growth: 10.9%; Domestic growth: 9.8%
Export growth: 20.1%
CAGR (2005 to 2018-19):
- Domestic: 12.4%
- Exports: 13.8%
Source: Annual Reports
Note - From 15-16, sales are as per IND AS. Up to 14-15 sales are as per IGAAP
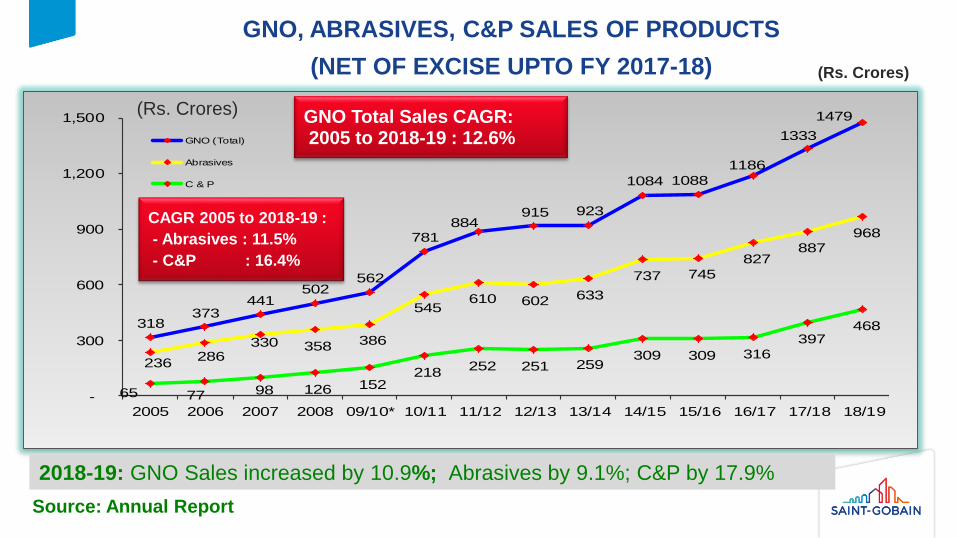
GNO, ABRASIVES, C&P SALES OF PRODUCTS
(NET OF EXCISE UPTO FY 2017-18)
10
(Rs. Crores)
2018-19: GNO Sales increased by 10.9%; Abrasives by 9.1%; C&P by 17.9%
318373
441502
562
781884
915 923
1084 1088
1186
1333
1479
236 286
330 358 386
545 610 602 633
737 745
827 887
968
65 77 98 126 152 218
252 251 259309 309 316
397 468
-
300
600
900
1,200
1,500
2005 2006 2007 2008 09/10* 10/11 11/12 12/13 13/14 14/15 15/16 16/17 17/18 18/19
GNO (Total)
Abrasives
C & P
CAGR 2005 to 2018-19 :
- Abrasives : 11.5%
- C&P : 16.4%
Source: Annual Report
GNO Total Sales CAGR:2005 to 2018-19 : 12.6%
(Rs. Crores)
KEY FINANCIAL INDICATORS(Rs. Crores)
Key Financials (as published) FY 18-19 FY 17-18 Growth %
Revenue from Operations 1598 1454 9.9%
Operating Profit (PBIT) 262 229 14.4%
Profit Before Tax 260 228 14.2%
Net Profit for the period 169 151 11.7%
Revenue from Operations (net of Excise Duty) 1598 1431 11.7%
OP margin (on Revenue net of excise) 16.4% 16.0%
Asset Turnover Ratio 1.44 1.43
Return on Capital Employed 23.6% 22.8%
Return on Business Assets 36.6% 37.3%
Net Cash Flow from Operations (CFO) 85 134
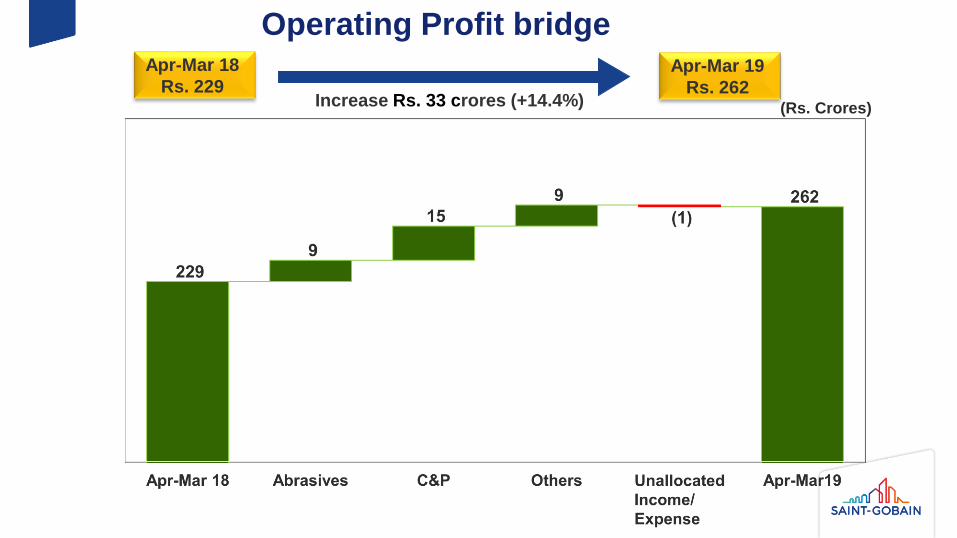
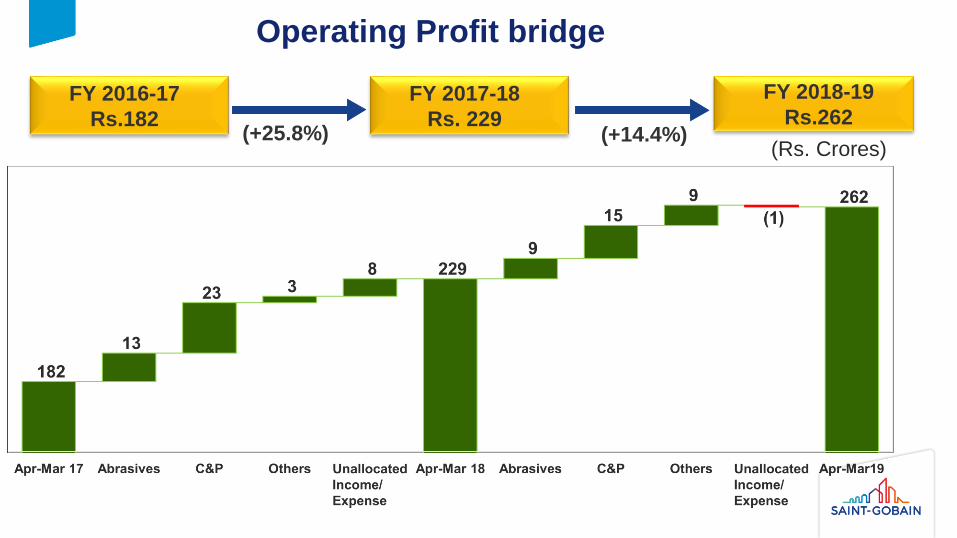
Operating Profit bridgeApr-Mar 18
Rs. 229Apr-Mar 19
Rs. 262Increase Rs. 33 crores (+14.4%) (Rs. Crores)
13
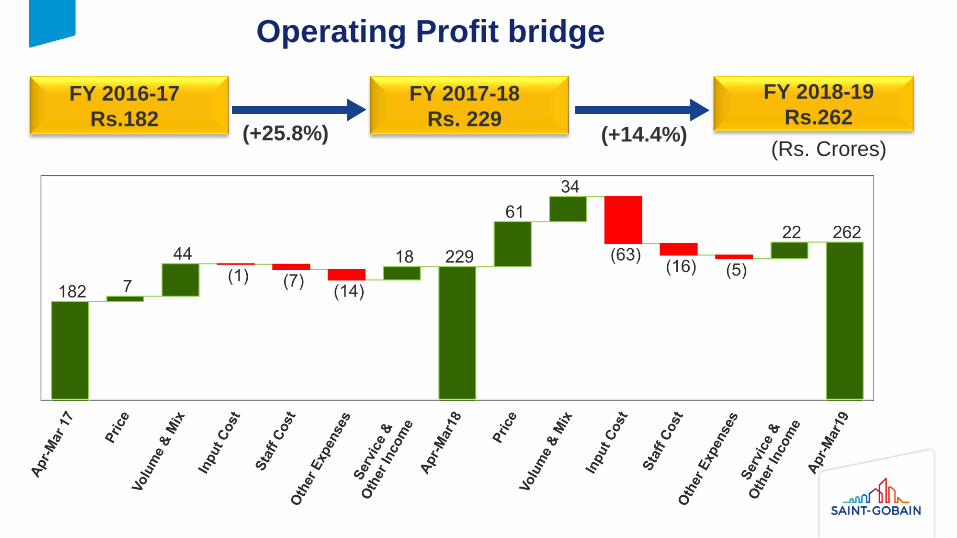
FY 2017-18
Rs. 229
Abrasives ~ 4%
(Rs. Crores)
FY 2018-19
Rs.262(+14.4%)
FY 2016-17
Rs.182 (+25.8%)
Operating Profit bridge
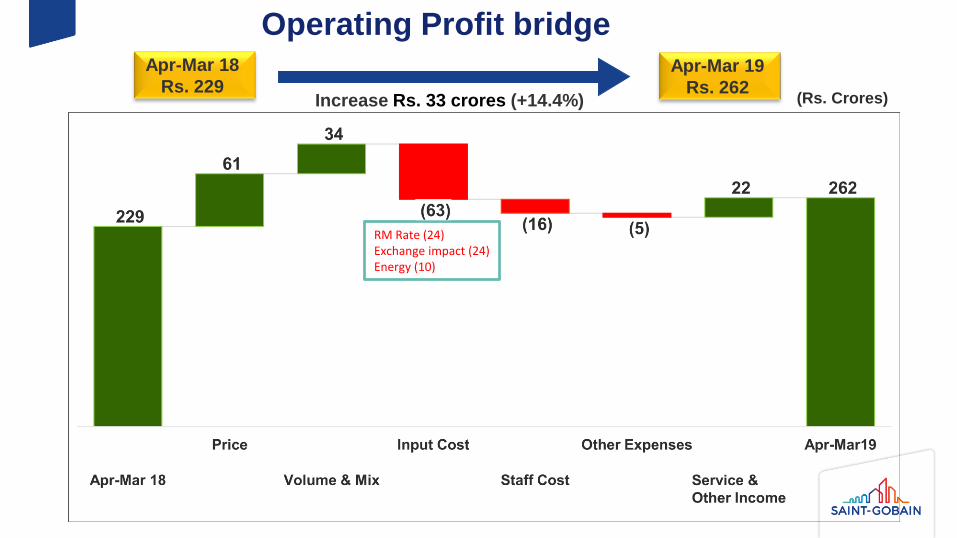
Operating Profit bridgeApr-Mar 18
Rs. 229Apr-Mar 19
Rs. 262Increase Rs. 33 crores (+14.4%) (Rs. Crores)
RM Rate (24)Exchange impact (24)Energy (10)
15
FY 2017-18
Rs. 229
Abrasives ~ 4%
(Rs. Crores)
FY 2018-19
Rs.262(+14.4%)
FY 2016-17
Rs.182 (+25.8%)
Operating Profit bridge
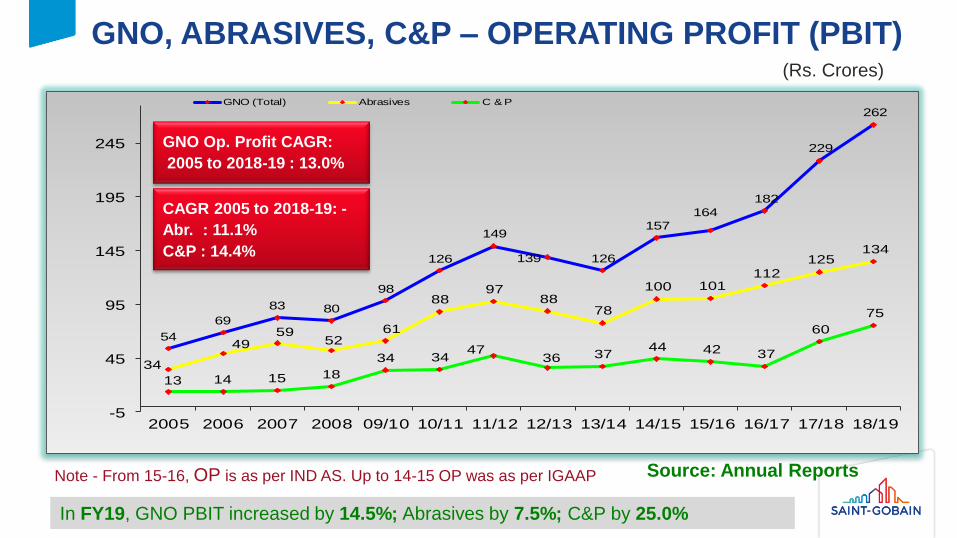
GNO, ABRASIVES, C&P – OPERATING PROFIT (PBIT)
16
(Rs. Crores)
54
69
83 80
98
126
149
139 126
157
164
182
229
262
34
4959
5261
8897
8878
100 101112
125134
13 14 15 18
34 3447
36 3744 42 37
60
75
-5
45
95
145
195
245
2005 2006 2007 2008 09/10 10/11 11/12 12/13 13/14 14/15 15/16 16/17 17/18 18/19
GNO (Total) Abrasives C & P
In FY19, GNO PBIT increased by 14.5%; Abrasives by 7.5%; C&P by 25.0%
GNO Op. Profit CAGR:
2005 to 2018-19 : 13.0%
CAGR 2005 to 2018-19: -
Abr. : 11.1%
C&P : 14.4%
Source: Annual ReportsNote - From 15-16, OP is as per IND AS. Up to 14-15 OP was as per IGAAP
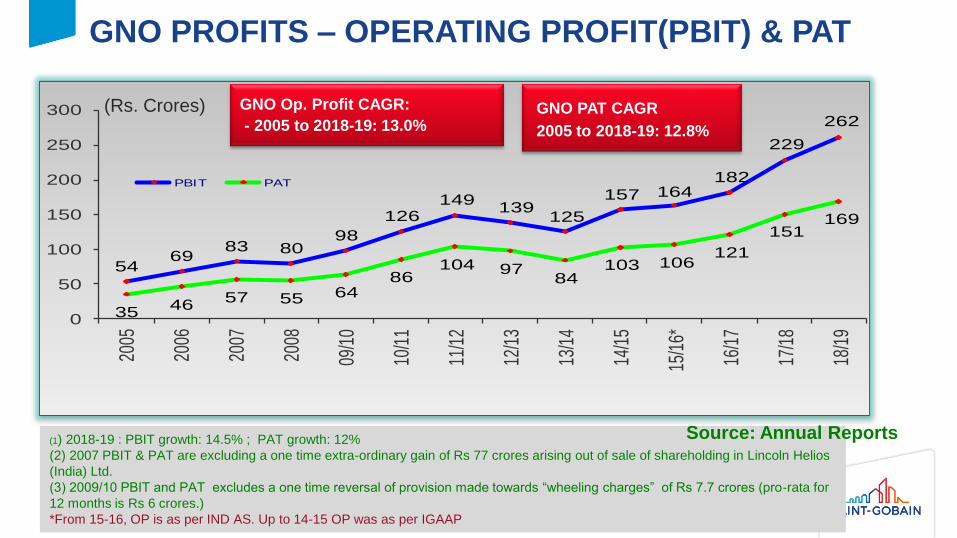
GNO PROFITS – OPERATING PROFIT(PBIT) & PAT
17
(Rs. Crores)
5469
83 8098
126149
139125
157 164182
229
262
3546
57 55 6486
104 9784
103 106121
151169
0
50
100
150
200
250
300
2005
2006
2007
2008
09/1
0
10/1
1
11/1
2
12/1
3
13/1
4
14/1
5
15/1
6*
16/1
7
17/1
8
18/1
9
PBIT PAT
(1) 2018-19 : PBIT growth: 14.5% ; PAT growth: 12%
(2) 2007 PBIT & PAT are excluding a one time extra-ordinary gain of Rs 77 crores arising out of sale of shareholding in Lincoln Helios
(India) Ltd.
(3) 2009/10 PBIT and PAT excludes a one time reversal of provision made towards “wheeling charges” of Rs 7.7 crores (pro-rata for
12 months is Rs 6 crores.)
*From 15-16, OP is as per IND AS. Up to 14-15 OP was as per IGAAP
GNO PAT CAGR
2005 to 2018-19: 12.8%
Source: Annual Reports
GNO Op. Profit CAGR:
- 2005 to 2018-19: 13.0%
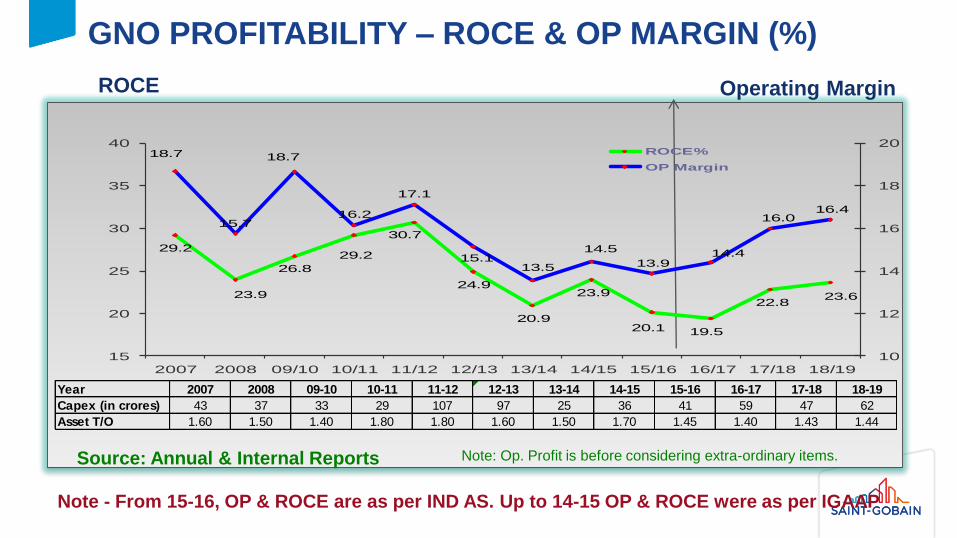
GNO PROFITABILITY – ROCE & OP MARGIN (%)
18
Note: Op. Profit is before considering extra-ordinary items.
Operating MarginROCE
Source: Annual & Internal Reports
Note - From 15-16, OP & ROCE are as per IND AS. Up to 14-15 OP & ROCE were as per IGAAP
29.2
23.9
26.8
29.2
30.7
24.9
20.9
23.9
20.1 19.5
22.823.6
18.7
15.7
18.7
16.2
17.1
15.113.5
14.5
13.914.4
16.016.4
10
12
14
16
18
20
15
20
25
30
35
40
2007 2008 09/10 10/11 11/12 12/13 13/14 14/15 15/16 16/17 17/18 18/19
ROCE%
OP Margin
2007 2008 09-10 10-11 11-12 12-13 13-14 14-15 15-16 16-17 17-18 18-19
43 37 33 29 107 97 25 36 41 59 47 62
1.60 1.50 1.40 1.80 1.80 1.60 1.50 1.70 1.45 1.40 1.43 1.44
Year
Capex (in crores)
Asset T/O
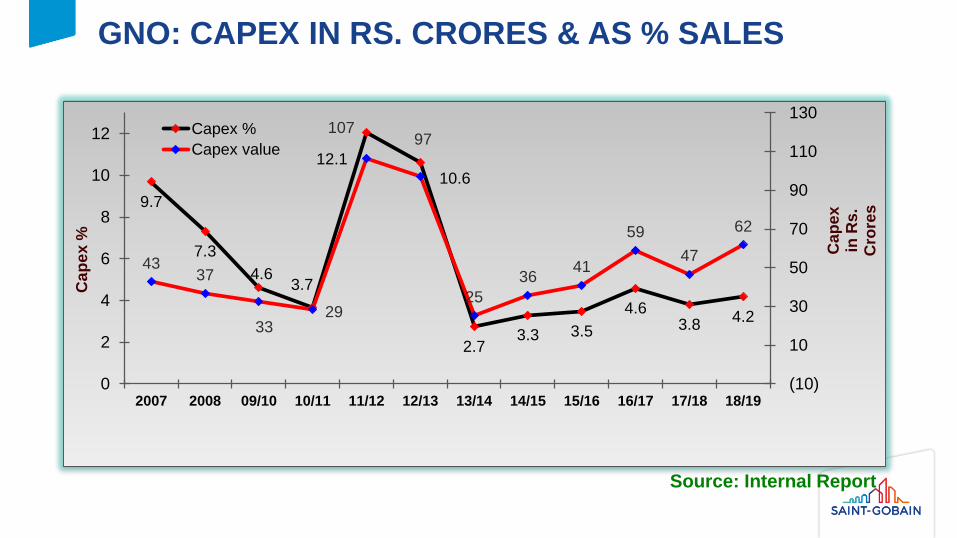
GNO: CAPEX IN RS. CRORES & AS % SALES
19
Source: Internal Report
9.7
7.3
4.63.7
12.1
10.6
2.73.3 3.5
4.63.8
4.2
4337
3329
10797
25
3641
59
47
62
(10)
10
30
50
70
90
110
130
0
2
4
6
8
10
12
2007 2008 09/10 10/11 11/12 12/13 13/14 14/15 15/16 16/17 17/18 18/19
Cap
ex
in
Rs
. C
rore
s
Ca
pe
x%
Capex %
Capex value
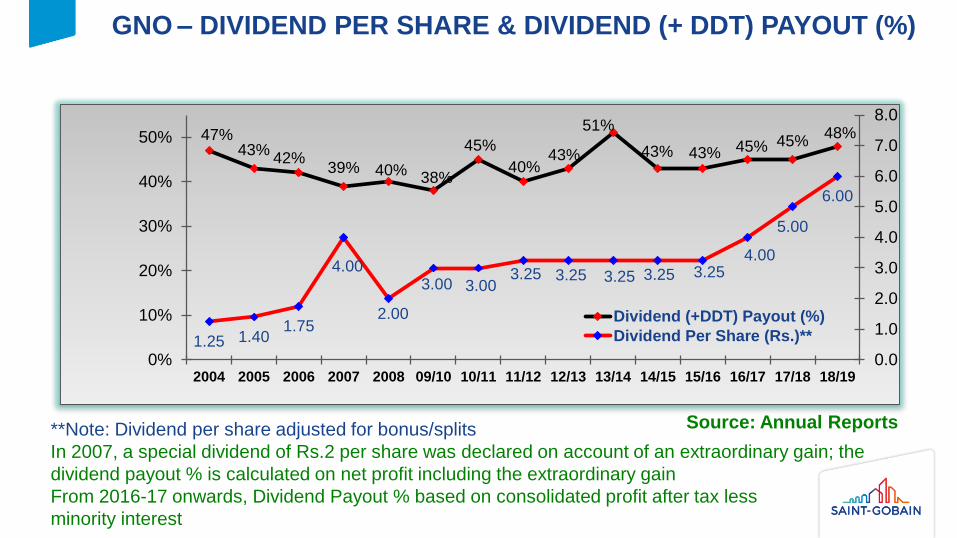
GNO – DIVIDEND PER SHARE & DIVIDEND (+ DDT) PAYOUT (%)
20
**Note: Dividend per share adjusted for bonus/splits
In 2007, a special dividend of Rs.2 per share was declared on account of an extraordinary gain; the
dividend payout % is calculated on net profit including the extraordinary gain
From 2016-17 onwards, Dividend Payout % based on consolidated profit after tax less
minority interest
47%43%
42%39% 40%
38%
45%
40%43%
51%
43% 43% 45% 45%48%
1.25 1.401.75
4.00
2.00
3.00 3.003.25 3.25 3.25 3.25 3.25
4.00
5.00
6.00
0.0
1.0
2.0
3.0
4.0
5.0
6.0
7.0
8.0
0%
10%
20%
30%
40%
50%
2004 2005 2006 2007 2008 09/10 10/11 11/12 12/13 13/14 14/15 15/16 16/17 17/18 18/19
Dividend (+DDT) Payout (%)
Dividend Per Share (Rs.)**
Source: Annual Reports
Thank You


![David Hume [David Fate Norton, Mary J. Norton]](https://img.pdfslide.us/doc/110x75/5695d4c71a28ab9b02a2baa7/david-hume-david-fate-norton-mary-j-norton.jpg)