Embed Size (px)
Citation preview

Japan Transcity Corporation
Audited Consolidated Financial Statements
March 31, 2005 and 2004
ChuoAoyama PricewaterhouseCoopers
Report of Independent Auditors To the Board of Directors and Shareholders of Japan Transcity Corporation
We have audited the accompanying consolidated balance sheets of Japan Transcity Corporation and its consolidated subsidiaries as of March 31, 2005 and 2004, and the related consolidated statements of income, shareholders' equity, and cash flows for the years then ended, all expressed in Japanese Yen. These consolidated financial statements are the responsibility of the Company's management. Our responsibility is to express an opinion on these consolidated financial statements based on our audits.
We conducted our audits in accordance with auditing standards generally accepted in Japan. Those standards require that we plan and perform the audit to obtain reasonable assurance about whether the consolidated financial statements are free of material misstatement. An audit includes examining, on a test basis, evidence supporting the amounts and disclosures in the consolidated financial statements. An audit also includes assessing the accounting principles used and significant estimates made by management, as well as evaluating the overall consolidated financial statement presentation. We believe that our audits provide a reasonable basis for our opinion.
In our opinion, the consolidated financial statements referred to above present fairly, in all material respects, the consolidated financial position of Japan Transcity Corporation and its consolidated subsidiaries as of March 31, 2005 and 2004, and the consolidated results of their operations and their cash flows for the years then ended in conformity with accounting principles generally accepted in Japan.
The amounts expressed in U.S. dollars, which are provided solely for the convenience of the reader, have been translated on the basis set forth in Note 1 to the accompanying consolidated financial statements.
ChuoAoyama PricewaterhouseCoopers Nagoya, Japan June 29, 2005
- 2 -
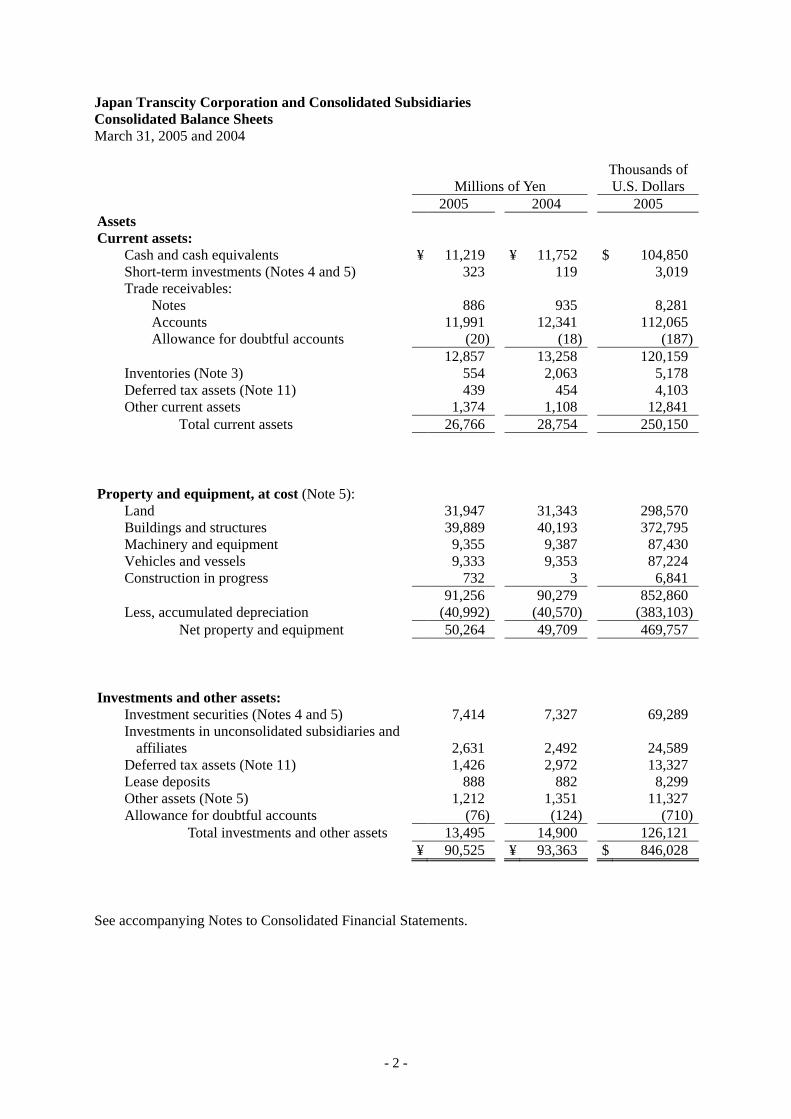
Japan Transcity Corporation and Consolidated Subsidiaries Consolidated Balance Sheets March 31, 2005 and 2004
Millions of Yen Thousands of
U.S. Dollars 2005 2004 2005 Assets Current assets: Cash and cash equivalents ¥ 11,219 ¥ 11,752 $ 104,850 Short-term investments (Notes 4 and 5) 323 119 3,019 Trade receivables: Notes 886 935 8,281 Accounts 11,991 12,341 112,065 Allowance for doubtful accounts (20) (18) (187) 12,857 13,258 120,159 Inventories (Note 3) 554 2,063 5,178 Deferred tax assets (Note 11) 439 454 4,103 Other current assets 1,374 1,108 12,841 Total current assets 26,766 28,754 250,150 Property and equipment, at cost (Note 5): Land 31,947 31,343 298,570 Buildings and structures 39,889 40,193 372,795 Machinery and equipment 9,355 9,387 87,430 Vehicles and vessels 9,333 9,353 87,224 Construction in progress 732 3 6,841 91,256 90,279 852,860 Less, accumulated depreciation (40,992) (40,570) (383,103) Net property and equipment 50,264 49,709 469,757 Investments and other assets: Investment securities (Notes 4 and 5) 7,414 7,327 69,289 Investments in unconsolidated subsidiaries and
affiliates 2,631
2,492
24,589 Deferred tax assets (Note 11) 1,426 2,972 13,327 Lease deposits 888 882 8,299 Other assets (Note 5) 1,212 1,351 11,327 Allowance for doubtful accounts (76) (124) (710) Total investments and other assets 13,495 14,900 126,121 ¥ 90,525 ¥ 93,363 $ 846,028 See accompanying Notes to Consolidated Financial Statements.

- 3 -
Millions of Yen Thousands of
U.S. Dollars 2005 2004 2005 Liabilities, Minority Interests and Shareholders' Equity Current liabilities: Short-term borrowings (Note 5) ¥ 4,151 ¥ 8,300 $ 38,794 Current maturities of long-term debt (Note 5) 8,076 2,057 75,477 Trade payables: Notes 1,856 1,377 17,346 Accounts 6,009 5,418 56,159 7,865 6,795 73,505 Accrued expenses 1,628 1,639 15,215 Income taxes payable 296 615 2,766 Other current liabilities 1,622 1,424 15,159 Total current liabilities 23,638 20,830 220,916 Long-term debt (Note 5) 18,957 25,206 177,168Employee retirement benefit liability (Note 6) 5,372 9,114 50,206Guarantee deposits received 4,608 4,501 43,066Deferred tax liabilities for revaluation 1,819 1,903 17,000Accrued severance indemnities for officers 403 397 3,766Other non-current liabilities (Note 11) 47 218 439 Commitments and contingent liabilities
(Notes 7 and 8)
Minority interests in consolidated subsidiaries 1,039 832 9,710 Shareholders' equity (Note 10): Common stock, no par value- 7,884 7,792 73,682 Authorized: 240,000,000 shares, Issued: 64,262,367 shares in 2005 and
63,613,246 shares in 2004
Capital surplus 6,193 5,908 57,879 Retained earnings 15,731 12,292 147,019 Land revaluation increment 2,717 2,842 25,393 Net unrealized gains on available-for-sale
securities 2,188 2,164
20,448 Foreign currency translation adjustment (58) (35) (542) Less, treasury stock, at cost – 52,261 shares in
2005 and 2,807,251 shares in 2004 (13) (601)
(122) 34,642 30,362 323,757 ¥ 90,525 ¥ 93,363 $ 846,028

- 4 -
Japan Transcity Corporation and Consolidated Subsidiaries Consolidated Statements of Income For the Years Ended March 31, 2005 and 2004
Millions of Yen Thousands of U.S. Dollars
2005 2004 2005 Operating revenues (Note 12) ¥ 78,393 ¥ 73,230 $ 732,645 Operating expenses (Notes 6, 8 and 12) 75,045 70,871 701,355 Operating income 3,348 2,359 31,290 Other income (expenses) : Interest and dividend income 98 74 916 Interest expenses (424) (455) (3,963)
Equity in net earnings of unconsolidated
subsidiaries and affiliates 274 224 2,561
Loss on sale or disposal of property and
equipment (510) (33) (4,767)
Gain on return of substituted portion of the
employee welfare pension fund 3,673 - 34,327 Other, net (466) 17 (4,355) 2,645 (173) 24,719
Income before income taxes and
minority interests 5,993 2,186 56,009 Income tax expenses (Note 11) 2,203 944 20,588Less, minority interests in net income of
consolidated subsidiaries 72 36 673 Net income ¥ 3,718 ¥ 1,206 $ 34,748 Yen U.S. Dollars Per share: Net income: -Basic ¥ 59.54 ¥ 19.14 $ 0.56 -Diluted 45.32 16.02 0.42 Cash dividends 7.50 7.00 0.07
See accompanying Notes to Consolidated Financial Statements.

- 5 -
Japan Transcity Corporation and Consolidated Subsidiaries Consolidated Statements of Shareholders' Equity For the Years Ended March 31, 2005 and 2004
Number of common
shares issued
Common stock Capital surplus
Retained earnings
Land revaluation increment
Net unrealized gains on
available-for-sale securities
Foreign currency translation adjustment
Treasury stock
Millions of Yen Balance at March 31, 2003 63,613,246 ¥ 7,792 ¥ 5,908 ¥ 11,514 ¥ 2,885 ¥ 522 ¥ (11) ¥ (174) Net income for the year - - - 1,206 - - - - Cash dividends - - - (433) - - - - Bonuses to directors and statutory auditors - - - (37) - - - -
Reversal of land revaluation increment Adjustment for applicable income taxes Net change in unrealized gains on available-for-
sale securities, net of applicable income taxes
- -
-
- -
-
--
-
42 -
-
(42) (1)
-
- -
1,642
- -
-
- -
- Translation adjustment - - - - - - (24) - Purchase of treasury stock and fractional shares
acquired, net - - - - - - - (427) Balance at March 31, 2004 63,613,246 7,792 5,908 12,292 2,842 2,164 (35) (601) Net income for the year - - - 3,718 - - - - Cash dividends - - - (428) - - - - Bonuses to directors and statutory auditors - - - (39) - - - -
Increase in retained earnings through inclusion of
additional subsidiary on consolidation - - - 63 - - - - Reversal of land revaluation increment - - - 125 (125) - - -
Net change in unrealized gains on available-for-
sale securities, net of applicable income taxes - - - - - 24 - - Translation adjustment - - - - - - (23) -
Conversion of convertible bonds, including
delivery of treasury stock held 649,121 92 285 - - - - 608
Purchase of treasury stock and fractional shares
acquired, net - - - - - - - (20) Balance at March 31, 2005 64,262,367 ¥ 7,884 ¥ 6,193 ¥ 15,731 ¥ 2,717 ¥ 2,188 ¥ (58) ¥ (13) Thousands of U.S. Dollars Balance at March 31, 2004 $ 72,822 $ 55,215 $ 114,879 $ 26,561 $ 20,224 $ (327) $ (5,617) Net income for the year - - 34,748 - - - - Cash dividends - - (4,000) - - - - Bonuses to directors and statutory auditors - - (364) - - - -
Increase in retained earnings through inclusion of
additional subsidiary on consolidation - - 588 - - - - Reversal of land revaluation increment - - 1,168 (1,168) - - -
Net change in unrealized gains on available-for-
sale securities, net of applicable income taxes - - - - 224 - - Translation adjustment - - - - - (215) -
Conversion of convertible bonds, including
delivery of treasury stock held 860 2,664 - - - - 5,682
Purchase of treasury stock and fractional shares
acquired, net - - - - - - (187) Balance at March 31, 2005 $ 73,682 $ 57,879 $ 147,019 $ 25,393 $ 20,448 $ (542) $ (122) See accompanying Notes to Consolidated Financial Statements.

- 6 -
Japan Transcity Corporation and Consolidated Subsidiaries Consolidated Statements of Cash Flows For the Years Ended March 31, 2005 and 2004
Millions of Yen Thousands of U.S. Dollars
2005 2004 2005 Cash flows from operating activities: Income before income taxes and minority interests ¥ 5,993 ¥ 2,186 $ 56,009 Adjustments for: Depreciation 2,533 2,676 23,673 Net (reversal) provision for employee retirement benefit liability (73) 264 (682) Gain on return of substituted portion of the employee welfare pension
fund
(3,673)
-
(34,327) Decrease (increase) in trade receivables 554 (498) 5,178 Decrease in inventories 194 186 1,813 Increase (decrease) in trade payables 796 (120) 7,439 Other, net 713 (551) 6,663 Sub-total 7,037 4,143 65,766 Interest and dividend received 132 109 1,234 Interest paid (416) (462) (3,888) Income taxes paid (1,032) (1,294) (9,645) Net cash provided by operating activities 5,721 2,496 53,467 Cash flows from investing activities: Increase in property and equipment and intangible assets (2,496) (1,732) (23,327) Acquisition, net of cash acquired (117) (29) (1,094) (Increase) decrease in short-term investments (79) 793 (738) Other, net 136 212 1,271 Net cash used in investing activities (2,556) (756) (23,888) Cash flows from financing activities: Increase in long-term debt 2,953 3,897 27,598 Repayment of long-term debt (2,197) (3,652) (20,533) (Decrease) increase in short-term borrowings (4,149) 201 (38,775) Dividends paid (428) (434) (4,000) Other, net (24) (429) (224) Net cash used in financing activities (3,845) (417) (35,934) Effect of exchange rate changes on cash and cash equivalents (3) (7) (28) Net (decrease) increase in cash and cash equivalents (683) 1,316 (6,383) Cash and cash equivalents at beginning of year 11,752 10,408 109,831 Increase in cash and cash equivalents upon inclusion of additional
subsidiaries on consolidation
150 28
1,402 Cash and cash equivalents at end of year ¥ 11,219 ¥ 11,752 $ 104,850
See accompanying Notes to Consolidated Financial Statements.
- 7 -
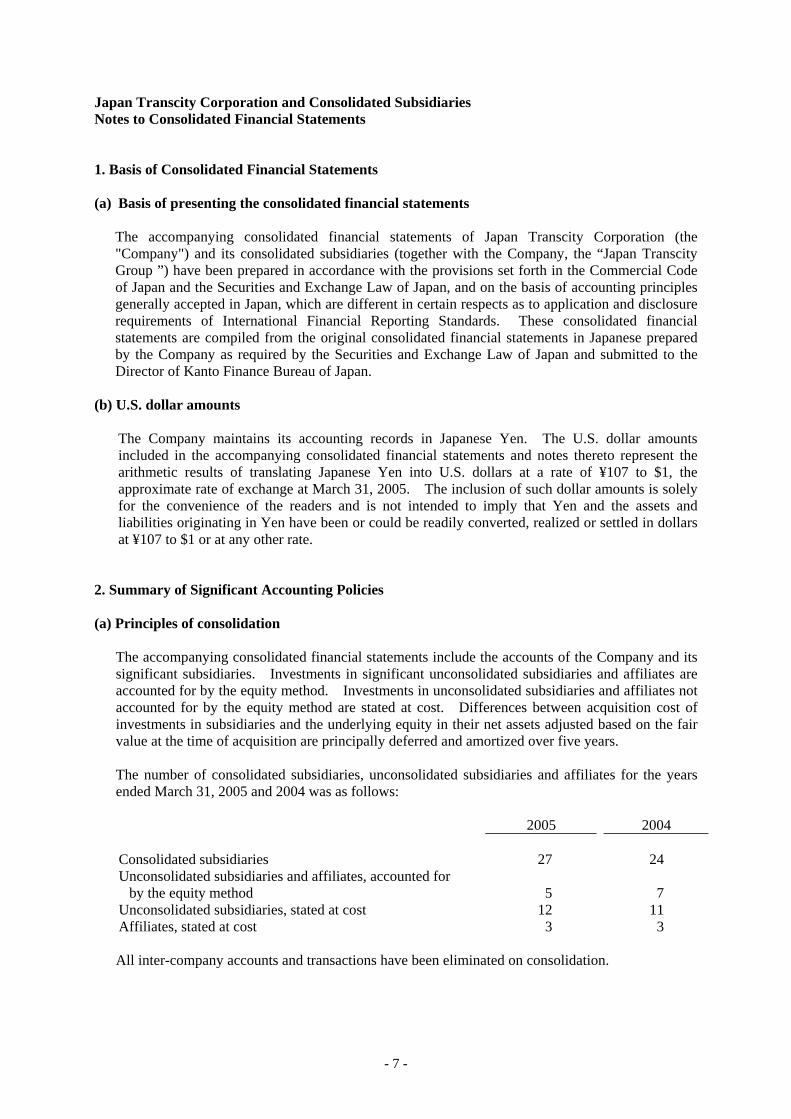
Japan Transcity Corporation and Consolidated Subsidiaries Notes to Consolidated Financial Statements 1. Basis of Consolidated Financial Statements
(a) Basis of presenting the consolidated financial statements
The accompanying consolidated financial statements of Japan Transcity Corporation (the "Company") and its consolidated subsidiaries (together with the Company, the “Japan Transcity Group ”) have been prepared in accordance with the provisions set forth in the Commercial Code of Japan and the Securities and Exchange Law of Japan, and on the basis of accounting principles generally accepted in Japan, which are different in certain respects as to application and disclosure requirements of International Financial Reporting Standards. These consolidated financial statements are compiled from the original consolidated financial statements in Japanese prepared by the Company as required by the Securities and Exchange Law of Japan and submitted to the Director of Kanto Finance Bureau of Japan.
(b) U.S. dollar amounts The Company maintains its accounting records in Japanese Yen. The U.S. dollar amounts included in the accompanying consolidated financial statements and notes thereto represent the arithmetic results of translating Japanese Yen into U.S. dollars at a rate of ¥107 to $1, the approximate rate of exchange at March 31, 2005. The inclusion of such dollar amounts is solely for the convenience of the readers and is not intended to imply that Yen and the assets and liabilities originating in Yen have been or could be readily converted, realized or settled in dollars at ¥107 to $1 or at any other rate.
2. Summary of Significant Accounting Policies
(a) Principles of consolidation The accompanying consolidated financial statements include the accounts of the Company and its significant subsidiaries. Investments in significant unconsolidated subsidiaries and affiliates are accounted for by the equity method. Investments in unconsolidated subsidiaries and affiliates not accounted for by the equity method are stated at cost. Differences between acquisition cost of investments in subsidiaries and the underlying equity in their net assets adjusted based on the fair value at the time of acquisition are principally deferred and amortized over five years. The number of consolidated subsidiaries, unconsolidated subsidiaries and affiliates for the years ended March 31, 2005 and 2004 was as follows: 2005 2004 Consolidated subsidiaries 27 24 Unconsolidated subsidiaries and affiliates, accounted for
by the equity method 5
7
Unconsolidated subsidiaries, stated at cost 12 11 Affiliates, stated at cost 3 3 All inter-company accounts and transactions have been eliminated on consolidation.

- 8 -
The accompanying consolidated financial statements included the accounts of overseas consolidated subsidiaries (three subsidiaries in 2005 and two subsidiaries in 2004). Such overseas consolidated subsidiaries close their books at December 31 every year, three months earlier than the Company and other domestic consolidated subsidiaries. The Company consolidated such subsidiaries’ financial statements as of their year-end. Significant transactions for the period between subsidiaries’ year-end and the Company’s year-end are adjusted on consolidation. Overseas consolidated subsidiaries adopt accounting principles generally accepted in their countries, and no adjustments to conform to accounting principles generally accepted in Japan have been made to their financial statements on consolidation as allowed under accounting principles generally accepted in Japan.
(b) Cash equivalents The Japan Transcity Group considers cash equivalents to be highly liquid debt instruments purchased with an original maturity of three months or less.
(c) Investments and marketable securities
The Japan Transcity Group classifies certain investments in debt and equity securities as “held-to-maturity”, “trading” or “available-for-sale”, whose classification determines the respective accounting method as stipulated by the accounting standard for financial instruments. Marketable securities with available market quotations for available-for-sale securities are stated at fair value and net unrealized gains or losses on these securities are reported as a separate component of shareholders’ equity, net of applicable income taxes. Gains and losses on disposition of available-for-sale securities are computed based on the moving-average method. Non-marketable securities without available market quotations for available-for-sale securities are carried at cost determined by the moving-average method. Adjustments in carrying values of individual securities are charged to income through write-downs, when a decline in value is deemed other than temporary.
(d) Accounting for derivatives
Derivatives are valued at fair value, if hedge accounting is not appropriate or where there is no hedging designation, and the gains or losses on derivatives are recognized in the current earnings. According to the special treatment as permitted by the accounting standard for financial instruments, the hedging interest rate swap is accounted for on an accrual basis, and recorded net of interest expenses generated from borrowings, a hedged item, if certain conditions are met.
(e) Inventories
Real estate held for sale is stated at cost determined by the specific identification method. Other inventories are stated at moving-average cost.
(f) Allowance for doubtful accounts
Allowance for doubtful accounts has been provided for at the aggregate amount of estimated credit loss based on the individual financial review approach for doubtful or troubled receivables and a general reserve for other receivables calculated based on the historical loss experience for a certain past period.

- 9 -
(g) Property and equipment, and depreciation Property and equipment, including significant renewals and additions, are stated at cost, and have been depreciated principally by the declining-balance method at rates based on the estimated useful lives of the assets, except that the buildings acquired on and after April 1, 1998 have been depreciated by the straight-line method. Property of the cost of not less than ¥100,000 and below ¥200,000 each is capitalized and depreciated over three years on a straight-line basis. Expenditures on maintenance and repairs are charged to operating income as incurred.
(h) Leases Where financing leases do not transfer ownership of the leased property to the lessee during the term of the lease, the leased property of the Company and its domestic consolidated subsidiaries is not capitalized and relating rental and lease expenses are charged to income as incurred.
(i) Employee retirement benefits Employees who terminate their service with the Japan Transcity Group are entitled to retirement benefits generally determined by the reference of current basic rates of pay, length of service and conditions under which the termination occurs. The Company has established a defined benefit pension plan, which covers 100 % of retirement benefits for employees of the Company who terminate at the compulsory retirement age and 70 % of other retirement benefits of the Company. Some of consolidated subsidiaries have similar pension plans. In accordance with the accounting standard for employee retirement benefits, the Japan Transcity Group has recognized the retirement benefits for employees including pension cost and related liability based on actuarial present value of projected benefit obligation using actuarial appraisal approach and the pension plan assets available for benefits at the fiscal year-ends. Unrecognized actuarial differences as changes in the projected benefit obligation or pension plan assets resulting from the experience different from that assumed and from changes in assumptions are amortized on a straight-line basis over ten years as a certain period within remaining service lives of employees from the next year in which they arise. Unrecognized prior service cost is amortized using the straight-line method over ten years from the year in which it occurs. In conjunction with enforcement of the Defined Benefit Enterprise Pension Plan Law, the Company received an approval from the Minister of Health, Labor and Welfare of Japan, for exemption from payment of future benefit regarding the substituted portion of the employee pension fund on January 1, 2004. As of March 31, 2004, pension plan assets equivalent to the amount to be returned to the Japanese Government amounted to ¥7,341 million. As the Company had not elected to apply for the transitional accounting treatment specified in paragraph 47-2 of the “Practical Guidelines of Accounting for Retirement Benefits (Interim Report)” (Accounting Committee Report No.13 issued by the Japanese Institute of Certified Public Accountants), the Company had not recognized an extinguishment of retirement benefit obligation with respect to such substituted portion as of the date of the approval. If the Company had applied for the transitional treatment as of the current fiscal year ended March 31, 2004, an other income of ¥3,299 million would have been recognized on the accompanying consolidated statements of income. On January 1, 2005, the Company received additional approval for the exemption from the payment of past benefit and established a new benefit pension plan for its employees. The Company recorded “Gain on return of substituted portion of the employee welfare pension plan” in the amount of ¥3,673 million ($34,327 thousand) in the accompanying consolidated statement of income for the year ended March 31, 2005.

- 10 -
(j) Accrued severance indemnities for officers The Japan Transcity Group may pay severance indemnities to directors and statutory auditors, which are subject to the approval of the shareholders. The Japan Transcity Group has provided for at the full amount of the liabilities of directors' and statutory auditors' severance indemnities at the respective balance sheet dates.
(k) Bond issue expenses
Bond issue expenses are charged to income as incurred. (l) Interest expenses
Interest expenses are charged to income as incurred, except that interest incurred in connection with the development of the real estate held for sale is capitalized as a part of the cost of the related real estate held for sale.
(m) Income taxes
Income taxes are accounted for under the asset and liability method. Deferred tax assets and liabilities are recognized for the future tax consequences attributable to differences between the carrying amounts of existing assets and liabilities and their respective tax bases and operating loss carryforward. Deferred tax assets and liabilities are measured using the enacted tax rates expected to apply to taxable income in the years in which those temporary differences are expected to be recovered or settled. The effect on deferred tax assets and liabilities of a change in tax rates is recognized in the period that includes the enactment date.
(n) Enterprise taxes With the implementation of the “Revision of Local Tax Law”(Legislation No.9, 2003)on March 31,2003,size-based corporate taxes for local government enterprise taxes have been newly levied from the fiscal year beginning on and after April 1, 2004. As a result, the Japan Transcity Group has recorded enterprise taxes calculates based on the “added value” and “capital” amounts in the amount of ¥70 million ($654 thousand) as selling, general and administrative expenses for the year ended March 31, 2005 in accordance with practical guidance issued by Accounting Standards Board of Japan.
(o) Translation of foreign currency accounts
Receivables, payables and securities, other than stocks of subsidiaries and certain other securities, are translated into Japanese Yen at the exchange rates at the respective fiscal year-ends. Transactions in foreign currencies are recorded based on the prevailing exchange rates on the transaction dates. Resulting translation gains or losses are included in the current earnings. In respect of the financial statement items of overseas consolidated subsidiary, all asset and liability accounts are translated into Japanese Yen by applying the exchange rates in effect at the fiscal year-ends. All income and expense accounts are translated at the average rates of exchange prevailing during the respective fiscal years. Translation differences are reported as foreign currency translation adjustment in a separate component of shareholders’ equity in the accompanying consolidated balance sheets.

- 11 -
(p) Appropriation of retained earnings Cash dividends and bonuses to directors and corporate auditors are recorded in the fiscal year when a proposed appropriation of retained earnings is approved by the Board of Directors and/or shareholders. Bonuses to directors and corporate auditors are recorded as a part of the appropriation of retained earnings, instead of charging to income, as permitted by the Japanese accounting standards.
(q) Revaluation of land In accordance with the Law Concerning Revaluation of Land (“Law”), the Company elected the one-time revaluation to restate the cost of land used for the Company’s business at values rationally reassessed effective on March 31, 2002, reflecting appropriate adjustments for land shape and other factors, based on the values of the municipal property tax bases. According to the Law, the amount equivalent to the tax effect on the excess of the sound reassessed values over original book values is recorded as deferred tax liabilities for revaluation account, and the rest of such excess, net of the tax effect, is recorded in the shareholders’ equity as land revaluation increment account in the accompanying consolidated balance sheets. At March 31, 2005 and 2004, the difference of the carrying values of land used for the Company’s business after reassessment over the current market value at the fiscal year-ends amounted to ¥5,795 million ($54,159 thousand) and ¥4,349 million, respectively.
(r) Per share data Basic net income per share is computed by dividing income available to common shareholders by the weighted-average number of shares of common stock outstanding during the fiscal year. Diluted net income per share is computed assuming convertible bonds were converted at the time of issue unless having anti-dilutive effects. Cash dividends per share for each fiscal year in the accompanying consolidated statements of income represent dividends declared by the Company as applicable to the respective years.
(s) Adoption of new accounting standards
On August 9, 2002, the Business Accounting Council of Japan issued “Accounting Standard for Impairment of Fixed Assets”. The standard requires that fixed assets be reviewed for impairment whenever events or changes in circumstances indicate that the carrying amount of an asset may not be recoverable. An impairment loss shall be recognized in the income statement by reducing the carrying amount of impaired assets or a group of assets to the recoverable amount to be measured as the higher of the asset’s net selling price and value in use. The standard shall be effective for fiscal years beginning April 1, 2005, with earlier adoption permitted. The Japan Transcity Group has not adopted this new standard nor has determined the effect of applying it on its consolidated financial statements.
3. Inventories
At March 31, 2005 and 2004, inventories consisted of the following:
Thousands of Millions of Yen U.S. Dollars 2005 2004 2005 Real estate held for sale ¥ 501 ¥ 2,006 $ 4,682Supplies and other 53 57 496 ¥ 554 ¥ 2,063 $ 5,178

- 12 -
4. Investments
At March 31, 2005 and 2004, short-term investments consisted of the following:
Millions of Yen Thousands of
U.S. Dollars 2005 2004 2005 Marketable securities Time deposits with an original maturity of
more than three months
¥ 40
283
¥ -
119
$ 374
2,645 ¥ 323 ¥ 119
$ 3,019
At March 31, 2005 and 2004, investment securities consisted of the following:
Millions of Yen Thousands of
U.S. Dollars 2005 2004 2005 Marketable securities: Equity securities ¥ 6,570 ¥ 6,462 $ 61,402 Other - 41 - 6,570 6,503 61,402Other non-marketable securities 844 824 7,887 ¥ 7,414 ¥ 7,327 $ 69,289
Marketable investment securities classified as available-for-sale, including short-term investments, are stated at fair value with unrealized gains and losses excluded from the current earnings and reported as a net amount within the shareholders’ equity account until realized. At March 31, 2005 and 2004, gross unrealized gains and losses for marketable securities classified as available-for-sale are summarized as follows:
Cost
Gross unrealized
gains
Gross unrealized
losses
Fair and carrying
value Millions of Yen Available-for-sale securities at March 31, 2005: Equity securities ¥ 2,824 ¥ 3,768 ¥ (22) ¥ 6,570 Other 40 - - 40 ¥ 2,864 ¥ 3,768 ¥ (22) ¥ 6,610 Available-for-sale securities at March 31, 2004: Equity securities ¥ 2,759 ¥ 3,729 ¥ (26) ¥ 6,462 Other 40 1 - 41 ¥ 2,799 ¥ 3,730 ¥ (26) ¥ 6,503 Thousands of U.S. Dollars Available-for-sale securities at March 31, 2005: Equity securities $ 26,393 $ 35,215 $ (206) $ 61,402 $ 26,393 $ 35,215 $ (206) $ 61,402

- 13 -
For the year ended March 31, 2005 and 2004, the Japan Transcity Group recorded no loss on devaluation of marketable investment securities.
5. Short-term Borrowings and Long-term Debt
At March 31, 2005 and 2004, short-term borrowings consisted of the following: Thousands of Millions of Yen U.S. Dollars 2005 2004 2005 Short-term bank loans or bank overdrafts with
interest rates ranging from 0.54 % to 3.79 % per annum at March 31, 2005:
Collateralized ¥ 2,517 ¥ 3,451 $ 23,523 Unsecured 1,634 4,849 15,271 ¥ 4,151 ¥ 8,300 $ 38,794
At March 31, 2005 and 2004, long-term debt consisted of the following:
Millions of Yen Thousands of U.S. Dollars
2005 2004 2005 0.85 % convertible bonds due September 2005 ¥ 7,459 ¥ 7,459 $ 69,710Zero coupon convertible bonds due March 2008 515 1,500 4,8131.47 % unsecured bonds due July 2008 2,500 2,500 23,3641.41 % unsecured bonds due July 2008 1,500 1,500 14,0191.76 % unsecured bonds due September 2008 4,000 4,000 37,383Zero coupon convertible bonds due September
2009 1,500 - 14,019Long-term loans from banks and other financial
institutions due through 2022 with interest rates ranging from 0.05 % to 6.30 % per annum at March 31, 2005:
Collateralized 3,536 3,672 33,047 Unsecured 6,023 6,632 56,290 27,033 27,263 252,645Less, current maturities (8,076) (2,057) (75,477) ¥ 18,957 ¥ 25,206 $ 177,168
At March 31, 2005, the current conversion price per share of 0.85 % convertible bonds due September 2005, zero coupon convertible bonds due March 2008 and zero coupon convertible bonds due September 2009 are ¥534, ¥285 and ¥410, respectively,all of which are subject to adjustment under certain circumstances, including stock splits. At March 31, 2005, the number of shares of common stock necessary for conversion of all convertible bonds outstanding was approximately 19 million.

- 14 -
The aggregate annual maturities of long-term debt at March 31, 2005 was as follows:
Years ending March 31, Millions of
Yen Thousands of
U.S. Dollars 2006 ¥ 8,076 $ 75,477 2007 1,133 10,589 2008 1,168 10,916 2009 9,875 92,289 2010 2,620 24,486 2011 and thereafter 4,161 38,888 ¥ 27,033 $ 252,645
At March 31, 2005, the following assets were pledged as collateral for short-term borrowing and long-term debt:
Millions of Yen
Thousands of U.S. Dollars
Time deposits included in short-term investments ¥ 38 $ 355Land 11,388 106,430Buildings and structures 2,015 18,832Machinery and equipment, and other property 137 1,280Investment securities and other assets 3 28
As is customary in Japan, substantially all loans from banks (including short-term loans) are made under general agreements which provide that, at the request of the relevant bank, the Japan Transcity Group is required to provide collateral or guarantors (or additional collateral or guarantors, as appropriate) with respect to the loans, and that all assets pledged as collateral under such agreements will be applicable to all present and future indebtedness to the bank concerned. The Japan Transcity Group has not received such requests. The general agreements further provide that the banks have the right, as indebtedness matures or becomes due prematurely by reason of default thereon, to offset deposits at the banks against indebtedness due to the banks.
6. Employee Retirement Benefits
The Japan Transcity Group has defined benefit retirement plans covering substantially all employees. Certain portions of the benefits under the plans are covered by a pension plan, which is governed by the regulations of the Japanese Welfare Pension Insurance Law. Some of the consolidated subsidiaries have similar retirement benefit plans.
The following table reconciles the benefit liability and net periodic retirement benefit expense as at or for the years ended March 31, 2005 and 2004:
Millions of Yen Thousands of U.S Dollars
2005 2004 2005 Reconciliation of benefit liability:
Projected benefit obligation ¥ 21,959 ¥ 27,495 $ 205,224Less, fair value of pension plan assets at end of
year (15,709) (15,230) (146,813) 6,250 12,265 58,411
Less, unrecognized actuarial differences (loss) (1,289) (4,218) (12,046)Unrecognized prior service cost of retroactive
benefits granted by the pension plan amendment 411 1,067 3,841Net amount of employee retirement benefit
liability recognized on the consolidated balance sheets ¥ 5,372 ¥ 9,114
$ 50,206

- 15 -
Note: 1. The table above includes the amounts related to the portion subject to the Japanese
Welfare Pension Insurance Law for the year ended March 31, 2004 . 2. Projected benefit obligation of consolidated subsidiaries was calculated using the
simplified calculation method as permitted by the accounting standard for employee retirement benefits.
3. The above table excluded the amounts for the assets not separately allocatable to some of the domestic consolidated subsidiaries in certain pension funds organized by others together with the consolidated subsidiaries or effectively restricted so that they cannot be used by the employees for other purpose, which amounted to ¥198 million ($1,850 thousand) and ¥197 million at March 31, 2005 and 2004, respectively
Millions of Yen Thousands of U.S Dollars
2005 2004 2005 Components of net periodic retirement benefit expense:
Service cost ¥ 574 ¥ 750 $ 5,365Interest cost 559 655 5,224Expected return on pension plan assets (317) (291) (2,963)Amortization of actuarial differences 473 791 4,421Amortization of prior service cost (96) (44) (897) Net periodic retirement benefit expense ¥ 1,193 ¥ 1,861 $ 11,150
Major assumptions used in the calculation of the above information for the years ended March 31, 2005 and 2004 were as follows:
2005 2004 Method attributing the projected benefits to
periods of services Straight-line method
Straight-line methodDiscount rate 2.0% 2.5% Expected rate of return on pension plan assets 2.0% 2.5% Amortization of actuarial differences 10 years 10 years Amortization of prior service cost 10 years 10 years
7. Contingent Liabilities
At March 31, 2005 and 2004, the Japan Transcity Group was contingently liable for guarantees of indebtedness principally of affiliates in amounts of ¥2,035 million ($19,019 thousand) and ¥2,416 million, respectively.
8. Lease Commitments
The Japan Transcity Group leases land and buildings to be used for office spaces and warehouses principally under long-term cancelable or non-cancelable operating lease agreements, and also computer equipment, other equipment and vehicles which are not generally cancelable for mainly four-to-ten year contract terms as lessee. Total rental and lease expenses including cancelable and non-cancelable leases for the years ended March 31, 2005 and 2004 were ¥6,195 million ($57,897 thousand) and ¥6,062 million, respectively. For the years ended March 31, 2005 and 2004, the lease expenses for non-cancelable lease agreements which were categorized as financing leases amounted to ¥301 million ($2,813 thousand) and ¥275 million, respectively.
- 16 -
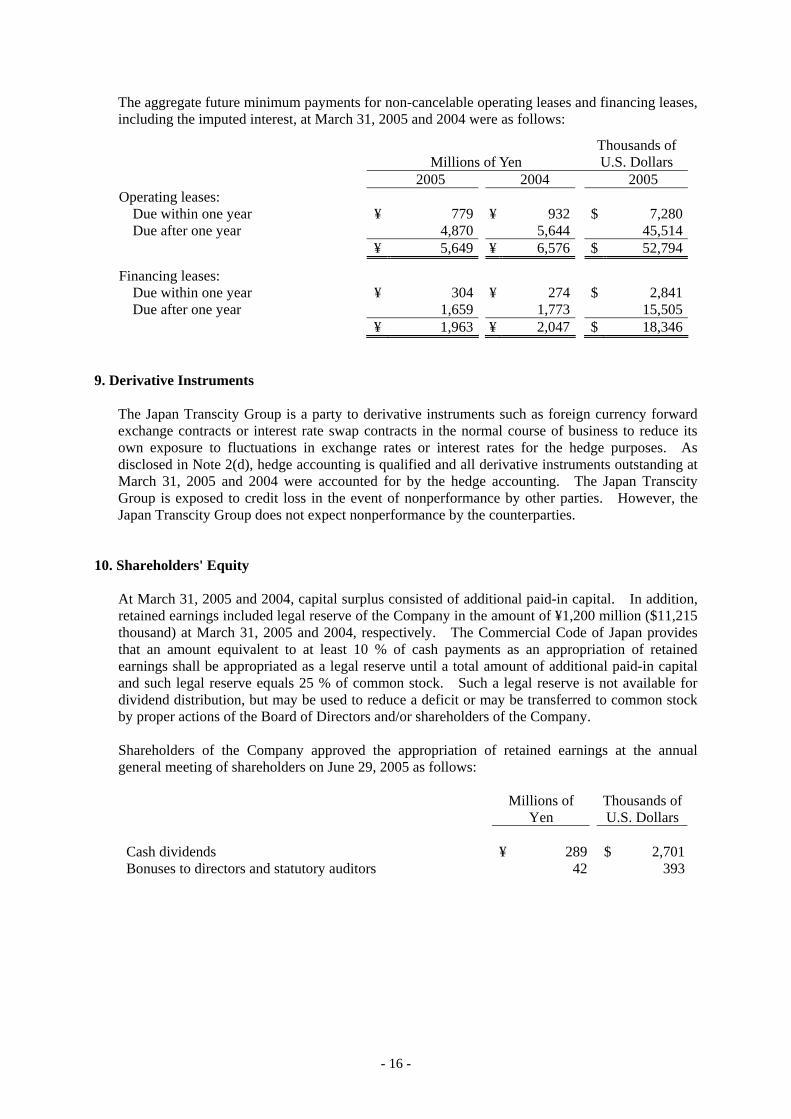
The aggregate future minimum payments for non-cancelable operating leases and financing leases, including the imputed interest, at March 31, 2005 and 2004 were as follows:
Millions of Yen Thousands of U.S. Dollars
2005 2004 2005 Operating leases:
Due within one year ¥ 779 ¥ 932 $ 7,280Due after one year 4,870 5,644 45,514
¥ 5,649 ¥ 6,576 $ 52,794 Financing leases:
Due within one year ¥ 304 ¥ 274 $ 2,841Due after one year 1,659 1,773 15,505
¥ 1,963 ¥ 2,047 $ 18,346 9. Derivative Instruments
The Japan Transcity Group is a party to derivative instruments such as foreign currency forward exchange contracts or interest rate swap contracts in the normal course of business to reduce its own exposure to fluctuations in exchange rates or interest rates for the hedge purposes. As disclosed in Note 2(d), hedge accounting is qualified and all derivative instruments outstanding at March 31, 2005 and 2004 were accounted for by the hedge accounting. The Japan Transcity Group is exposed to credit loss in the event of nonperformance by other parties. However, the Japan Transcity Group does not expect nonperformance by the counterparties.
10. Shareholders' Equity
At March 31, 2005 and 2004, capital surplus consisted of additional paid-in capital. In addition, retained earnings included legal reserve of the Company in the amount of ¥1,200 million ($11,215 thousand) at March 31, 2005 and 2004, respectively. The Commercial Code of Japan provides that an amount equivalent to at least 10 % of cash payments as an appropriation of retained earnings shall be appropriated as a legal reserve until a total amount of additional paid-in capital and such legal reserve equals 25 % of common stock. Such a legal reserve is not available for dividend distribution, but may be used to reduce a deficit or may be transferred to common stock by proper actions of the Board of Directors and/or shareholders of the Company. Shareholders of the Company approved the appropriation of retained earnings at the annual general meeting of shareholders on June 29, 2005 as follows:
Millions of Yen
Thousands of U.S. Dollars
Cash dividends ¥ 289 $ 2,701Bonuses to directors and statutory auditors 42 393

- 17 -
11. Income Taxes
Income tax expenses for the years ended March 31, 2005 and 2004 consisted of the following:
Millions of Yen Thousands of U.S. Dollars
2005 2004 2005 Income tax expenses: Current ¥ 719 ¥ 1,180 $ 6,719 Deferred 1,484 (236) 13,869 ¥ 2,203 ¥ 944 $ 20,588 The tax effects on temporary differences that give rise to a significant portion of deferred tax assets and liabilities at March 31, 2005 and 2004 were as follows:
Millions of Yen Thousands of
U.S. Dollars 2005 2004 2005 Deferred tax assets: Enterprise tax accruals ¥ 25 ¥ 54 $ 234 Accrued bonuses to employees 442 445 4,131 Loss on devaluation of inventories 65 234 608 Employee retirement benefit liability 2,985 4,491 27,897 Accrued severance indemnities for officers 162 159 1,514 Inter-company capital gains 478 490 4,467 Net operating loss carryforward 243 285 2,271 Other 391 341 3,654 4,791 6,499 44,776 Less, valuation allowance (474) (603) (4,430) Deferred tax assets 4,317 5,896 40,346 Deferred tax liabilities: Deferred capital gain 541 560 5,056 Accelerated depreciation 36 51 336 Unrealized gains on available-for-sale
securities 1,506 1,489
14,075 Other 378 382 3,533 Deferred tax liabilities 2,461 2,482 23,000 Net deferred tax assets ¥ 1,856 ¥ 3,414 $ 17,346
At March 31, 2005 and 2004, deferred tax assets and liabilities were as follows:
Millions of Yen
Thousands of U.S. Dollars
2005 2004 2005 Deferred tax assets: Current ¥ 439 ¥ 454 $ 4,103 Non-current 1,426 2,972 13,327Deferred tax liabilities: Non-current 9 12 84
Non-current deferred tax liabilities were included in “Other non-current liabilities” in the accompanying consolidated balance sheets.

- 18 -
With the implementation of the “Revision of Local Tax Law”(Legislation No.9, 2003)on March 31,2003,size-based corporate taxes for local government enterprise taxes have been newly levied from the fiscal year beginning on and after April 1,2004. As a result, the Group has recorded enterprise taxes calculates based on the “added value” and “capital” amounts in the amount of ¥70 million ($654 thousand) as selling, general and administrative expenses for the year ended March 31, 2005 in accordance with practical guidance issued by Accounting Standards Board of Japan. In assessing the realizability of deferred tax assets, management of the Japan Transcity Group considers whether it is more likely than not that some portion or all of the deferred tax assets will not be realized. The ultimate realization of deferred tax assets is dependent upon the generation of the future taxable income during the periods in which those temporary differences become deductible. At March 31, 2005 and 2004, a valuation allowance was provided to reduce the deferred tax assets to the extent that the management believes that the amount of the deferred tax assets is expected to be realizable. A reconciliation of the difference between the Japanese statutory effective tax rate and the actual effective income tax rate on pre-tax income reflected in the accompanying consolidated statements of income for the year ended March 31, 2005 was as follows:
Percentage of
pre-tax income Japanese statutory effective tax rate 40.1% Increase (decrease) due to: Permanently non-deductible expenses 1.1 Tax exempt income (0.6) Local minimum taxes per capita levy 0.6 Equity in net earnings of unconsolidated
subsidiaries and affiliates
(1.8) Change in valuation allowance (2.2) Other (0.4) Actual effective income tax rate 36.8%
The reconciliation for the year ended March 31, 2004 was not disclosed, as such difference was not material.

- 19 -
12. Segment Information
The Japan Transcity Group's operations are classified into two major segments: Integrated logistics services and other services. Information by industry segment for the years ended March 31, 2005 and 2004 was summarized as follows: Integrated logistics
services
Others
Total
Elimination
Consolidated Millions of Yen For the year 2005: Operating revenues: Outside customers ¥ 76,016 ¥ 2,377 ¥ 78,393 ¥ - ¥ 78,393 Inter-segment sales 27 2,932 2,959 (2,959) - Total operating revenues 76,043 5,309 81,352 (2,959) 78,393 Operating expenses 72,888 5,028 77,916 (2,871) 75,045 Operating income ¥ 3,155 ¥ 281 ¥ 3,436 ¥ (88) ¥ 3,348 Identifiable assets ¥ 88,218 ¥ 6,277 ¥ 94,495 ¥ (3,970) ¥ 90,525 Depreciation 2,211 322 2,533 - 2,533 Capital expenditures 3,105 52 3,157 - 3,157 For the year 2004: Operating revenues: Outside customers ¥ 70,834 ¥ 2,396 ¥ 73,230 ¥ - ¥ 73,230 Inter-segment sales 4 2,307 2,311 (2,311) - Total operating revenues 70,838 4
,703
4,703 75,
541
75,541 (2,
311)
(2,311) 73,230
Operating expenses 68,627 4,521 73,148 (2,277) 70,871 Operating income ¥ 2,211 ¥ 182 ¥ 2,393 ¥ (34) ¥ 2,359 Identifiable assets ¥ 87,642 ¥ 9,056 ¥ 96,698 ¥ (3,335) (
3,335)
¥ 93,363
Depreciation 2,287 389 2,676 - - 2,676 Capital expenditures 1,087 117 1,204 - - 1,204 Thousands of U.S. Dollars For the year 2005: Operating revenues: Outside customers $ 710,430 $ 22,215 $ 732,645 $ - $ 732,645 Inter-segment sales 252 27,402 27,654 (27,654) - Total operating revenues 710,682 49,617 760,299 (27,654) 732,645 Operating expenses 681,196 46,991 728,187 (26,832) 701,355 Operating income $ 29,486 $ 2,626 $ 32,112 $ (822) $ 31,290 Identifiable assets $ 824,467 $ 58,664 $ 883,131 $ (37,103) $ 846,028

- 20 -
Depreciation 20,664 3,009 23,673 - 23,673 Capital expenditures 29,019 486 29,505 - 29,505 Geographic segment information is not shown, as the operating revenues of overseas subsidiaries are not material. Information for overseas sales is not disclosed, as such sales are not material.

- 21 -
13. Financial Information of Japan Transcity Corporation (Parent)
Presented below are the non-consolidated balance sheets, non-consolidated statements of income and shareholders’ equity of Japan Transcity Corporation, the parent company, for the years ended March 31, 2005 and 2004.
Non-Consolidated Balance Sheets Japan Transcity Corporation (Parent) March 31, 2005 and 2004
Millions of Yen Thousands of U.S. Dollars
2005 2004 2005 Assets Current assets: Cash and cash equivalents ¥ 8,512 ¥ 8,224 $ 79,551 Short-term investments 79 38 738 Trade receivables, net of allowance for doubtful
accounts 12,343 12,574
115,355 Inventories 12 18 112 Deferred tax assets 227 260 2,122 Other current assets 2,032 1,073 18,991 Total current assets 23,205 22,187 216,869 Property and equipment, at cost 65,026 64,372 6
4,372
607,720
Less, accumulated depreciation (27,224) (27,129) 7,129)
(254,430)
Net property and equipment 37,802 37,243 353,290 Investments and other assets: Investment securities 6,886 6,823 64,355 Investments in and long-term loans to subsidiaries and
affiliates 4,003 3,008
37,411 Deferred tax assets 664 2,257 6,206 Lease deposits 851 849 7,953 Other assets 1,189 1,331 11,112 Allowance for doubtful accounts (75) (122) (701) Total investments and other assets 13,518 1
4,146
14,146 126,336
¥ 74,525 ¥ 73,576 $ 696,495
Liabilities and Shareholders' Equity Current liabilities: Short-term borrowings ¥ 5,453 ¥ 4,196 $ 50,962 Current maturities of long-term debt 7,812 1,353 73,009 Trade payables 7,835 7,153 73,224 Accrued expenses 835 851 7,804 Income taxes payable 16 428 150 Other current liabilities 1,408 1,194 13,159

- 22 -
Total current liabilities 23,359 15,175
15,175 218,308
Long-term debt 14,408 20,354 20,354
134,654
Employee retirement benefit liability 4,195 7,950 7,950
39,205
Deferred tax liabilities for revaluation 1,819 1,903 1,903
17,000
Accrued severance indemnities for officers 364 350 350
3,402
Other non-current liabilities 225 175 175
2,103
Shareholders' equity: Common stock 7,884 7,792 73,682 Capital surplus 6,193 5,908 57,879 Retained earnings 11,332 9,699 105,907 Land revaluation increment 2,717 2,842 25,393 Net unrealized gains on available-for-sale securities 2,042 2,029 19,084 Less, treasury stock, at cost (13) (601) (122) Total shareholders' equity 30,155 2
7,669
27,669 281,823
¥ 74,525 ¥ 73,576 $ 696,495 Non-Consolidated Statements of Income Japan Transcity Corporation (Parent) For the Years Ended March 31, 2005 and 2004
Millions of Yen Thousands of U.S. Dollars
2005 2004 2005 Operating revenues ¥ 72,814 ¥ 67,900 $ 680,505 Operating expenses 70,820 66,582 661,869 Operating income 1,994 1
,318
1,318 18,636

- 23 -
Other income (expenses): Interest and dividend income 171 1
45
145 1,598
Interest expenses (287) (295)
(295) (2,682)
Loss on liquidation of a subsidiary (970) - (9,066) Gain on return of substituted portion of the employee
welfare pension fund 3,673 -
34,327 Miscellaneous, net (842) (
44)
(12) (7,869)
1,745 (162)
(162) 16,308
Income before income taxes 3,739 1,156
1,156 34,944
Income tax expenses: Current 232 8
48
848 2,168
Deferred 1,532 (288)
(288) 14,318
Total income tax expenses 1,764 560
560 16,486
Net income ¥ 1,975 596
¥ 596 $ 18,458
Yen U.S. Dollars Per share: Net income: - Basic ¥ 31.31 ¥ 9.14 $ 0.29 - Diluted 24.06 7.91 0.22 Cash dividends 7.50 7.00 0.07

- 24 -

- 25 -
Non-Consolidated Statements of Shareholders' Equity Japan Transcity Corporation (Parent) For the Years Ended March 31, 2005 and 2004
Common stock
Capital surplus
Retained earnings
Land
revaluation increment
Net unrealized gains on
available-for- sale securities
Treasury stock
Millions of Yen Balance at March 31, 2003 ¥ 7,792 ¥ 5,908 ¥ 9,531 ¥ 2,885 ¥ 452 ¥ (174)
Net income for the year - -
596 596 - - - - -
- -
Cash dividends - -
(433) (433) - - - -
- -
Bonuses to directors and statutory
auditors - -
(37) (37)
- - - - - -
Reversal of land revaluation
increment - - 42 42
(42) (42) - - - -
Adjustment for applicable income
taxes - - - -
(1) (1) - - - -
Net change in unrealized gains on available-for-sale securities, net of applicable income taxes - - - -
- - - 1,577 - -
Purchase of treasury stock and
fractional shares acquired, net - - - - - -
1,577 -
(427) (427)
Balance at March 31, 2004 7,792 5,908 9,699 2,842 2,029 (601) Net income for the year - - 1,975 - - - Cash dividends - - (428) - - -
Bonuses to directors and statutory
auditors
- - (39) - - -
Reversal of land revaluation
increment - - 125 (125) - -
Net change in unrealized gains on available-for-sale securities, net of applicable income taxes
- - - - 13 -
Conversion of convertible bonds, including delivery of treasury stock held 92 285 - - -
608
Purchase of treasury stock and
fractional shares acquired, net - - - - -
(20) Balance at March 31, 2005 ¥ 7,884 ¥ 6,193 ¥ 11,332 ¥ 2,717 ¥ 2,042 ¥ (13) Thousand of U.S. Dollars Balance at March 31, 2004 $ 72,822 $ 55,215 $ 90,645 $ 26,561 $ 18,963 $ (5,617) Net income for the year - - 18,458 - - - Cash dividends - - (4,000) - - -

- 26 -
Bonuses to directors and statutory
auditors - - (364) - - -
Reversal of land revaluation
increment - - 1,168 (1,168) - -
Net change in unrealized gains on available-for-sale securities, net of applicable income taxes - - - - 121 -
Conversion of convertible bonds, including delivery of treasury stock held 860 2,664 - - -
5,682
Purchase of treasury stock and
fractional shares acquired, net - - - - -
(187) Balance at March 31, 2005 $ 73,682 $ 57,879 $ 105,907 $ 25,393 $ 19,084 $ (122)