Embed Size (px)
Citation preview
2020 AUDITED CONSOLIDATED ANNUAL FINANCIAL STATEMENTS
for the year ended 31 December 2020
MASTER DRILLING CONSOLIDATED ANNUAL FINANCIAL STATEMENTS 2020
TABLE OF CONTENTS
Directors’ responsibilities and approval 1
Secretary’s certificate 2
Audit committee report 3
Independent auditor’s report 6
Directors’ report 11
Consolidated statement of financial position 16
Consolidated statement of profit or loss and other comprehensive income 17
Consolidated statement of changes in equity 18
Consolidated statement of cash flows 20
Accounting policies 21
Notes to the consolidated annual financial statements 37
Supplementary information 81
Corporate information 82
1MASTER DRILLING CONSOLIDATED ANNUAL FINANCIAL STATEMENTS 2020
DIRECTORS’ RESPONSIBILITIES AND APPROVAL
The directors of Master Drilling Group Limited and its subsidiaries (“the Group”) are required in terms of the Companies Act No. 71 of 2008 (“Companies Act”), to maintain adequate accounting records and are responsible for the preparation, the content and integrity of the Group’s annual financial statements and related financial information included in this report. It is their responsibility to ensure that the Group’s annual financial statements fairly present the state of affairs of the Group as at the end of the financial year and the results of its operations and cash flows for the year then ended, in conformity with International Financial Reporting Standards (“IFRS”), the Companies Act and the Johannesburg Stock Exchange (“JSE”) Listings Requirements. The external auditor is engaged to express an independent opinion on the Group’s financial statements.
The Group’s annual financial statements are prepared in accordance with IFRS, and the South African Institute of Chartered Accountants (“SAICA”) Financial Reporting Guides as issued by the Accounting Practices Committee (“APC”) and Financial Reporting Pronouncements as issued by the Financial Reporting Standards Council and JSE Listing Requirements, and are based upon appropriate accounting policies and the requirements of the Companies Act consistently applied and supported by reasonable and prudent judgements and estimates.
The audited financial statements have been prepared by the corporate reporting staff, headed by Willem Ligthelm CA(SA), the Group’s financial manager. This process was supervised by André Jean van Deventer CA(SA), the Group’s chief financial officer.
The directors acknowledge that they are ultimately responsible for the system of internal financial control established by the Group and place considerable importance on maintaining a strong control environment. To enable the directors to meet these responsibilities, the directors set standards for internal control aimed at reducing the risk of error or loss in a cost-effective manner. The standards include the proper delegation of responsibilities within a clearly-defined framework, effective accounting procedures and adequate segregation of duties to ensure an acceptable level of risk. These controls are monitored throughout the Group and all employees are required to maintain the highest ethical standards in ensuring the Group’s business is conducted in a manner that in all reasonable circumstances, is above reproach. While operating risk cannot be fully eliminated, the Group endeavours to minimise it by ensuring that appropriate infrastructure, controls, systems and ethical behaviour are applied and managed within predetermined procedures and constraints.
Based on the information and explanations provided by management, the directors are of the opinion that the system of internal control provides reasonable assurance that the financial records may be relied on for the preparation of the financial statements. However, any system of internal financial control can provide only reasonable, and not absolute, assurance against material misstatement or loss.
The directors have reviewed the Group’s cash flow forecast for the year to 31 December 2021 and, in the light of this review and the current financial position, they are satisfied that the Group has access to adequate resources to continue in operational existence for the foreseeable future. The directors are responsible for the financial affairs of the Group.
The external auditor is responsible for independently auditing and reporting on the Group’s financial statements. In accordance with section 29(1)(e)(ii) of the Companies Act, the annual financial statements of the Group, for the year ended 31 December 2020, have been audited by BDO South Africa Incorporated, the Group’s independent external auditor, whose unqualified audit report can be found on pages 6 to 10 of this document.
The CEO and CFO of the Group confirm the following after due, careful and proper consideration:
The directors, whose names are stated below, hereby confirm that:
1. the annual financial statements set out on pages 6 to 80, fairly present in all material respects the financial position, financial performance and cash flows of the issuer in terms of IFRS;
2. no facts have been omitted or untrue statements made that would make the annual financial statements false or misleading;
3. internal financial controls have been put in place to ensure that material information relating to the issuer and its consolidated subsidiaries have been provided to effectively prepare the financial statements of the issuer; and
MASTER DRILLING CONSOLIDATED ANNUAL FINANCIAL STATEMENTS 20202
4. the internal financial controls are adequate and effective and can be relied upon in compiling the annual financial statements, having fulfilled our role and function within the combined assurance model pursuant to principle 15 of the King Code. Where we are not satisfied, we have disclosed to the audit committee and the auditors the deficiencies in design and operational effectiveness of the internal financial controls and any fraud that involves directors, and have taken the necessary remedial action. (*)
The Group’s audited annual financial statements as approved on 22 March 2021, which have been prepared on the going concern basis, were signed by the CEO and CFO on behalf of the board of directors.
Daniël Coenraad Pretorius André Jean van DeventerDirector Director
Johannesburg Johannesburg22 March 2021 22 March 2021
(*) Whilst the directors are aware of their responsibility to communicate fraud incidents to the audit committee and auditor, no incidents of such fraud were identified for communication during the period under review
DIRECTORS’ RESPONSIBILITIES AND APPROVAL (CONTINUED)
SECRETARY’S CERTIFICATE
In my capacity as company secretary, I hereby certify that in terms of section 88(2)(e) of the Companies Act, for the year ended 31 December 2020, the Group has lodged with the Companies and Intellectual Property Commission, all such returns and notices as are required of a public company in terms of the Companies Act, and that all such returns and notices are true, correct and up-to-date.
Andrew Colin BeavenCompany Secretary
6 Dwars StreetKrugersdorp174122 March 2021
3MASTER DRILLING CONSOLIDATED ANNUAL FINANCIAL STATEMENTS 2020
This report is provided by the audit committee in respect of the 2020 financial period of the Group. The Group’s audit committee is established as a statutory committee in terms of section 94(2) of the Companies Act and oversees audit committee matters for all of the South African subsidiaries within the Group, as permitted by section 94(2)(a) of the Companies Act.
The audit committee’s operation is guided by detailed terms of reference, a copy of which can be found on the Group’s website (www.masterdrilling.com). The Audit Committee Terms of Reference was informed by the Companies Act, JSE Listing Requirements as well as the Corporate Governance Principles under King IV and approved by the directors. The Audit Committee Terms of Reference is reviewed on an annual basis.
MEMBERSHIPThe audit committee consisted of four non-executive directors of whom three were independent at all times during the year. The members comprise of AW Brink (Chairman), AA Deshmukh, ST Ferguson and OM Matloa. In addition, the chief executive officer, chief financial officer, risk and assurance manager, as well as the internal and external auditors are permanent invitees to the audit committee meetings. The audit committee meets at least four times a year and details of attendance are disclosed later in this report.
DUTIES AND RESPONSIBILITIESThe audit committee has executed its duties and responsibilities during the period in accordance with its terms of reference as they relate to the Group’s accounting, internal auditing, internal control and financial reporting practices.
During the period under review the committee engaged on the following:In respect of the external auditor and the external audit, the audit committee, amongst other matters:• nominated BDO South Africa Incorporated as the external auditor for both the holding and subsidiary companies
for the financial period ended 31 December 2021; • ensured that the appointment of the external auditor complied with all applicable legal and regulatory requirements
for the appointment of an auditor. The audit committee confirms that the auditor is accredited by the JSE;• approved the external audit engagement letter, the audit plan and the budgeted audit fees payable to the
external auditor for 2020;• obtained an annual written statement from the auditor that its independence was not impaired;• determined the nature and extent of all non-audit services provided by the external auditor and approved
the applicable non-audit services undertaken;• considered whether any reportable irregularities were identified and reported by the external auditor in terms of the
Auditing Profession Act, 2005, and determined that there were none.
In respect of the annual financial statements, the audit committee, amongst other matters:• confirmed the going concern as the basis of preparation of the annual financial statements;• considered whether any complex taxation areas exist that could have a material impact on the financial statements
and determined that matters identified are being addressed by management; • examined and reviewed the annual financial statements, as well as all financial information disclosed to the
public prior to submission and approval by the directors;• ensured that the annual financial statements fairly present the financial position of the Group as at the end of the
period and the results of operations and cash flows for the financial period;• considered the appropriateness of the accounting policies adopted and changes thereto;• reviewed the external auditor’s audit report;• reviewed the representation letter relating to the annual financial statements which was signed by management; • considered any problems identified and reviewed any significant legal and tax matters that could have a
material impact on the annual financial statements; and• considered the 2020 pro-active monitoring report and the various JSE communications with the regard to the
impact of Covid-19 and appropriate action was taken, where applicable.
AUDIT COMMITTEE REPORT for the year ended 31 December 2020
MASTER DRILLING CONSOLIDATED ANNUAL FINANCIAL STATEMENTS 20204
AUDIT COMMITTEE REPORT (CONTINUED)
In respect of internal financial control and internal audit, the audit committee, amongst other matters:• appointed an internal auditor with the necessary international presence and experience and were satisfied that it
effectively provided objective and relevant assurance on the areas covered during the year;• reviewed internal audit reports and deliberated on the audit findings of the internal auditor as part of the internal
audit work programme;• considered the Group’s system of internal financial control, during the year under review, with input and reports
from the independent internal auditors; and • is aware of the limited reviews conducted in the internal financial control environment which was brought about
by a number of factors including the mobility restrictions caused by the Covid-19 pandemic. The committee did however take note of the actions taken by management to address identified control deficiencies and its intention to extend the scope of the internal audit activities in the next financial year to provide additional independent assurance on the existing control review activities maintained by management during the year under review.
In respect of legal and regulatory requirements, to the extent that these may have an impact on the annual financial statements, the audit committee:• reviewed legal matters with management that could have a material effect on the Group; and• considered reports provided by management and the external auditor regarding compliance with legal
and regulatory requirements.
In respect of risk management and governance the audit committee, amongst other matters:
• reviewed the Group’s continued Enterprise Risk Management implementation and improvements initiatives and the combined assurance framework; and
• forms an integral part of the risk management process and oversees the risk committee functions.
In respect of the co-ordination of assurance activities, the audit committee reviewed the plans and outcomes as outlined in the combined assurance framework. Although the Covid-19 pandemic had an impact on the execution of audit plans, assurance activities were focused to address all significant financial risks facing the business.
In respect of the company's integrated report, the audit committee collaborated with the risk, social, ethics and sustainability, remuneration and governance committees to ensure the accuracy and completeness of the report. The integrated report is expected to be released in April 2021.
In addition, the audit committee: • considered the expertise, resources and experience of the finance function and concluded that these
were appropriate; and• considered the experience and expertise of the chief financial officer and concluded that these were appropriate.• considered the key audit matters as determined by BDO South Africa Incorporated and as described in the
independent auditor's report.• reviewed sections 3, 8, 13, 15 and 22 and schedule 8 of the JSE Listings Requirements and confirmed that based on
the amended requirements for the JSE-accreditation of Auditors, effective 15 October 2017, the audit committee was satisfied that: (i) the audit firm has met all the criteria stipulated in the requirements, including that the audit regulator has
completed a firm-wide independent quality control (ISQC 1) inspection on the audit firm during its previous inspection cycle;
(ii) the auditor has provided to the audit committee, the required IRBA inspection decision letters, findings report and the proposed remedial action to address the findings, both at the audit firm and the individual auditor levels; and
(iii) both the audit firm and the individual auditor understand their roles and have the competence, expertise, experience and skills required to discharge their specific audit and financial reporting responsibilities.
5MASTER DRILLING CONSOLIDATED ANNUAL FINANCIAL STATEMENTS 2020
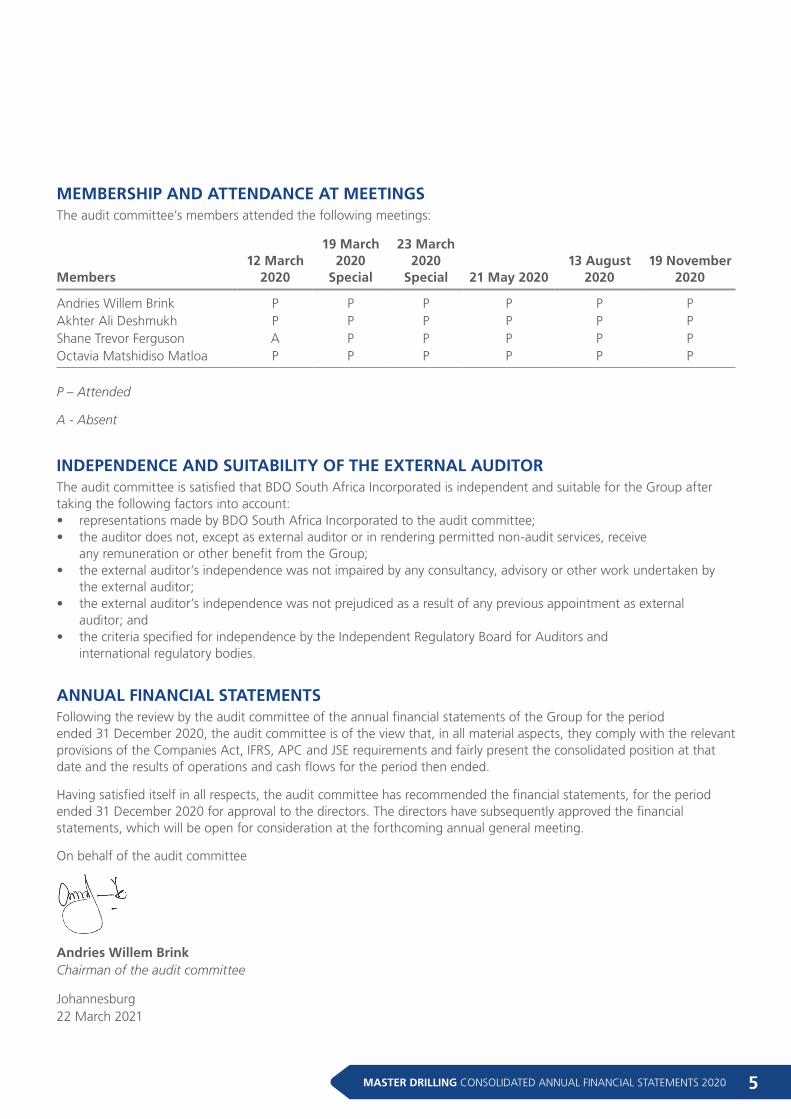
MEMBERSHIP AND ATTENDANCE AT MEETINGS The audit committee’s members attended the following meetings:
Members12 March
2020
19 March 2020
Special
23 March 2020
Special 21 May 202013 August
202019 November
2020
Andries Willem Brink P P P P P PAkhter Ali Deshmukh P P P P P PShane Trevor Ferguson A P P P P POctavia Matshidiso Matloa P P P P P P
P – Attended
A - Absent
INDEPENDENCE AND SUITABILITY OF THE EXTERNAL AUDITORThe audit committee is satisfied that BDO South Africa Incorporated is independent and suitable for the Group after taking the following factors into account: • representations made by BDO South Africa Incorporated to the audit committee;• the auditor does not, except as external auditor or in rendering permitted non-audit services, receive
any remuneration or other benefit from the Group;• the external auditor’s independence was not impaired by any consultancy, advisory or other work undertaken by
the external auditor;• the external auditor’s independence was not prejudiced as a result of any previous appointment as external
auditor; and• the criteria specified for independence by the Independent Regulatory Board for Auditors and
international regulatory bodies.
ANNUAL FINANCIAL STATEMENTS Following the review by the audit committee of the annual financial statements of the Group for the period ended 31 December 2020, the audit committee is of the view that, in all material aspects, they comply with the relevant provisions of the Companies Act, IFRS, APC and JSE requirements and fairly present the consolidated position at that date and the results of operations and cash flows for the period then ended.
Having satisfied itself in all respects, the audit committee has recommended the financial statements, for the period ended 31 December 2020 for approval to the directors. The directors have subsequently approved the financial statements, which will be open for consideration at the forthcoming annual general meeting.
On behalf of the audit committee
Andries Willem BrinkChairman of the audit committee
Johannesburg22 March 2021
MASTER DRILLING CONSOLIDATED ANNUAL FINANCIAL STATEMENTS 20206
INDEPENDENT AUDITOR’S REPORT
TO THE SHAREHOLDERS OF
MASTER DRILLING GROUP LIMITED
REPORT ON THE AUDIT OF THE CONSOLIDATED FINANCIAL STATEMENTS
OPINIONWe have audited the consolidated financial statements of Master Drilling Group Limited and its subsiaries (the group) set out on pages 16 to 80, which comprise the consolidated statement of financial position as at 31 December 2020, and the consolidated statement of profit or loss and other comprehensive income, the consolidated statement of changes in equity and the consolidated statement of cash flows for the year then ended, and notes to the consolidated financial statements, including a summary of significant accounting policies.
In our opinion, the consolidated financial statements present fairly, in all material respects, the consolidated financial position of and its subsidiaries as at 31 December 2020, and its consolidated financial performance and consolidated cash flows for the year then ended in accordance with International Financial Reporting Standards and the requirements of the Companies Act of South Africa.
BASIS FOR OPINIONWe conducted our audit in accordance with International Standards on Auditing (ISAs). Our responsibilities under those standards are further described in the Auditor’s Responsibilities for the Audit of the Consolidated Financial Statements section of our report. We are independent of the group in accordance with the Independent Regulatory Board for Auditors’ Code of Professional Conduct for Registered Auditors (IRBA Code) and other independence requirements applicable to performing audits of financial statements in South Africa. We have fulfilled our other ethical responsibilities in accordance with the IRBA Code and in accordance with other ethical requirements applicable to performing audits in South Africa. The IRBA Code is consistent with the corresponding sections of the International Ethics Standards Board for Accountants’ International Code of Ethics for Professional Accountants (including International Independence Standards). We believe that the audit evidence we have obtained is sufficient and appropriate to provide a basis for our opinion.
KEY AUDIT MATTERSKey audit matters are those matters that, in our professional judgement, were of most significance in our audit of the consolidated financial statements of the current period. These matters were addressed in the context of our audit of the consolidated financial statements as a whole, and in forming our opinion thereon, and we do not provide a separate opinion on these matters.
The following key audit matter relates to the consolidated financial statements.
7MASTER DRILLING CONSOLIDATED ANNUAL FINANCIAL STATEMENTS 2020
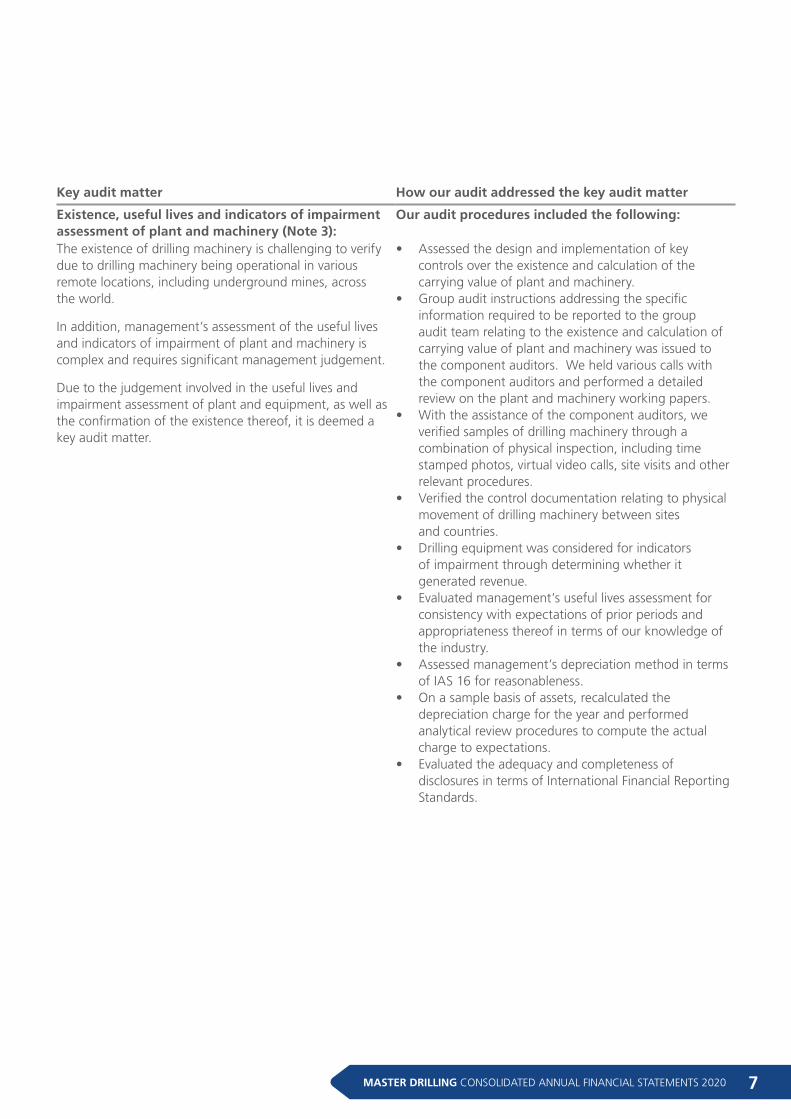
Key audit matter How our audit addressed the key audit matter
Existence, useful lives and indicators of impairment assessment of plant and machinery (Note 3):
Our audit procedures included the following:
The existence of drilling machinery is challenging to verify due to drilling machinery being operational in various remote locations, including underground mines, across the world.
In addition, management’s assessment of the useful lives and indicators of impairment of plant and machinery is complex and requires significant management judgement.
Due to the judgement involved in the useful lives and impairment assessment of plant and equipment, as well as the confirmation of the existence thereof, it is deemed a key audit matter.
• Assessed the design and implementation of key controls over the existence and calculation of the carrying value of plant and machinery.
• Group audit instructions addressing the specific information required to be reported to the group audit team relating to the existence and calculation of carrying value of plant and machinery was issued to the component auditors. We held various calls with the component auditors and performed a detailed review on the plant and machinery working papers.
• With the assistance of the component auditors, we verified samples of drilling machinery through a combination of physical inspection, including time stamped photos, virtual video calls, site visits and other relevant procedures.
• Verified the control documentation relating to physical movement of drilling machinery between sites and countries.
• Drilling equipment was considered for indicators of impairment through determining whether it generated revenue.
• Evaluated management’s useful lives assessment for consistency with expectations of prior periods and appropriateness thereof in terms of our knowledge of the industry.
• Assessed management’s depreciation method in terms of IAS 16 for reasonableness.
• On a sample basis of assets, recalculated the depreciation charge for the year and performed analytical review procedures to compute the actual charge to expectations.
• Evaluated the adequacy and completeness of disclosures in terms of International Financial Reporting Standards.
MASTER DRILLING CONSOLIDATED ANNUAL FINANCIAL STATEMENTS 20208
INDEPENDENT AUDITOR’S REPORT (CONTINUED)
OTHER INFORMATIONThe directors are responsible for the other information. The other information comprises the information included in the document titled “ Consolidated Annual Financial Statements for the year ended 31 December 2020, which includes the Directors’ Report, the Audit Committee’s Report and the Company Secretary’s Certificate as required by the Companies Act of South Africa, which we obtained prior to the date of this report, and the Annual Report, which is expected to be made available to us after that date. The other information does not include the consolidated or the separate financial statements and our auditor’s reports thereon.
Our opinion on the consolidated financial statements does not cover the other information and we do not express an audit opinion or any form of assurance conclusion thereon.
In connection with our audit of the consolidated financial statements, our responsibility is to read the other information and, in doing so, consider whether the other information is materially inconsistent with the consolidated financial statements or our knowledge obtained in the audit, or otherwise appears to be materially misstated. If, based on the work we have performed, we conclude that there is a material misstatement of this other information, we are required to report that fact. We have nothing to report in this regard.
RESPONSIBILITIES OF THE DIRECTORS FOR THE CONSOLIDATED FINANCIAL STATEMENTSThe directors are responsible for the preparation and fair presentation of the consolidated financial statements in accordance with International Financial Reporting Standards and the requirements of the Companies Act of South Africa, and for such internal control as the directors determine is necessary to enable the preparation of consolidated financial statements that are free from material misstatement, whether due to fraud or error.
In preparing the consolidated financial statements, the directors are responsible for assessing the group’s ability to continue as a going concern, disclosing, as applicable, matters related to going concern and using the going concern basis of accounting unless the directors either intend to liquidate the group or to cease operations, or have no realistic alternative but to do so.
AUDITOR’S RESPONSIBILITIES FOR THE AUDIT OF THE CONSOLIDATED FINANCIAL STATEMENTSOur objectives are to obtain reasonable assurance about whether the consolidated financial statements as a whole are free from material misstatement, whether due to fraud or error, and to issue an auditor’s report that includes our opinion. Reasonable assurance is a high level of assurance, but is not a guarantee that an audit conducted in accordance with ISAs will always detect a material misstatement when it exists. Misstatements can arise from fraud or error and are considered material if, individually or in the aggregate, they could reasonably be expected to influence the economic decisions of users taken on the basis of these consolidated financial statements.
As part of an audit in accordance with ISAs, we exercise professional judgement and maintain professional scepticism throughout the audit. We also:
• Identify and assess the risks of material misstatement of the consolidated financial statements, whether due to fraud or error, design and perform audit procedures responsive to those risks, and obtain audit evidence that is sufficient and appropriate to provide a basis for our opinion. The risk of not detecting a material misstatement resulting from fraud is higher than for one resulting from error, as fraud may involve collusion, forgery, intentional omissions, misrepresentations, or the override of internal control.
• Obtain an understanding of internal control relevant to the audit in order to design audit procedures that are appropriate in the circumstances, but not for the purpose of expressing an opinion on the effectiveness of the group's internal control.
9MASTER DRILLING CONSOLIDATED ANNUAL FINANCIAL STATEMENTS 2020
• Evaluate the appropriateness of accounting policies used and the reasonableness of accounting estimates and related disclosures made by the directors.
• Conclude on the appropriateness of the directors' use of the going concern basis of accounting and based on the audit evidence obtained, whether a material uncertainty exists related to events or conditions that may cast significant doubt on the group's ability to continue as a going concern. If we conclude that a material uncertainty exists, we are required to draw attention in our auditor's report to the related disclosures in the consolidated financial statements or, if such disclosures are inadequate, to modify our opinion. Our conclusions are based on the audit evidence obtained up to the date of our auditor's report. However, future events or conditions may cause the group to cease to continue as a going concern.
• Evaluate the overall presentation, structure and content of the consolidated financial statements, including the disclosures, and whether the consolidated financial statements represent the underlying transactions and events in a manner that achieves fair presentation.
• Obtain sufficient appropriate audit evidence regarding the financial information of the entities or business activities within the group to express an opinion on the consolidated financial statements. We are responsible for the direction, supervision and performance of the group audit. We remain solely responsible for our audit opinion.
We communicate with the directors regarding, among other matters, the planned scope and timing of the audit and significant audit findings, including any significant deficiencies in internal control that we identify during our audit.
We also provide the directors with a statement that we have complied with relevant ethical requirements regarding independence, and to communicate with them all relationships and other matters that may reasonably be thought to bear on our independence, and where applicable, actions taken to eliminate threats or safeguards applied.
From the matters communicated with the directors, we determine those matters that were of most significance in the audit of the consolidated financial statements of the current period and are therefore the key audit matters. We describe these matters in our auditor's report unless law or regulation precludes public disclosure about the matter or when, in extremely rare circumstances, we determine that a matter should not be communicated in our report because the adverse consequences of doing so would reasonably be expected to outweigh the public interest benefits of such communication.
MASTER DRILLING CONSOLIDATED ANNUAL FINANCIAL STATEMENTS 202010
INDEPENDENT AUDITOR’S REPORT (CONTINUED)
REPORT ON OTHER LEGAL AND REGULATORY REQUIREMENTSIn terms of the IRBA Rule published in Government Gazette Number 39475 dated 4 December 2015, we report that BDO South Africa Incorporated has been the auditor of Master Drilling Group Limited for three years.
BDO South Africa IncorporatedRegistered Auditors
EFG DreyerDirectorRegistered Auditor
23 March 2021
11MASTER DRILLING CONSOLIDATED ANNUAL FINANCIAL STATEMENTS 2020
DIRECTORS’ REPORT
NATURE OF BUSINESSMaster Drilling Group Limited is an investment holding company, whose subsidiary companies provide specialised drilling services to blue chip major and mid-tier companies in the mining, civil engineering, construction and hydro-electric power sectors, across a number of commodities and geographies.
GOING CONCERN BASIS OF ACCOUNTINGThe annual financial statements have been prepared on the going concern basis. This basis presumes that funds will be available to finance future operations for the next 12-month period and that the realisation of assets and settlement of liabilities, contingent obligations and commitments will occur in the ordinary course of business.
The escalation in the global spread and effects of the Covid-19 pandemic during 2020 is likely to have a continuous impact on our business and that of our customers and suppliers in most, if not all geographies in which the Group operates until the roll-out of the vaccines have been successfully completed. As at the date of signing this report, the Board considered the current cash position of the Group, and did stress tests on the ability of the Group to absorb periods of up to 6 months lower than normal revenue being generated and found that the Group will be able to service its obligations. Management and the Board are and will remain focused on managing this unfortunate situation as best as possible.
BENEFICIAL SHAREHOLDERS HOLDING 5% OR MORE OF MASTER DRILLING’S ISSUED SHARE CAPITALAs at 31 December 2020 %
Barrange (Pty) Ltd 28,9MDG Equity Holdings (Pty) Ltd 25,8Ninety One 5,8
FUND MANAGERS HOLDING 5% OR MORE OF MASTER DRILLING’S ISSUED SHARE CAPITALAs at 31 December 2020 %
Kagiso Asset Management 13,1Abax Investments 6,2Ninety One 5,9
Share capitalAuthorised500 000 000 ordinary shares of no par value.
There was no movement in authorised ordinary share capital during the year. Issued share ordinary share capital increased by 670 000 shares.
MASTER DRILLING CONSOLIDATED ANNUAL FINANCIAL STATEMENTS 202012
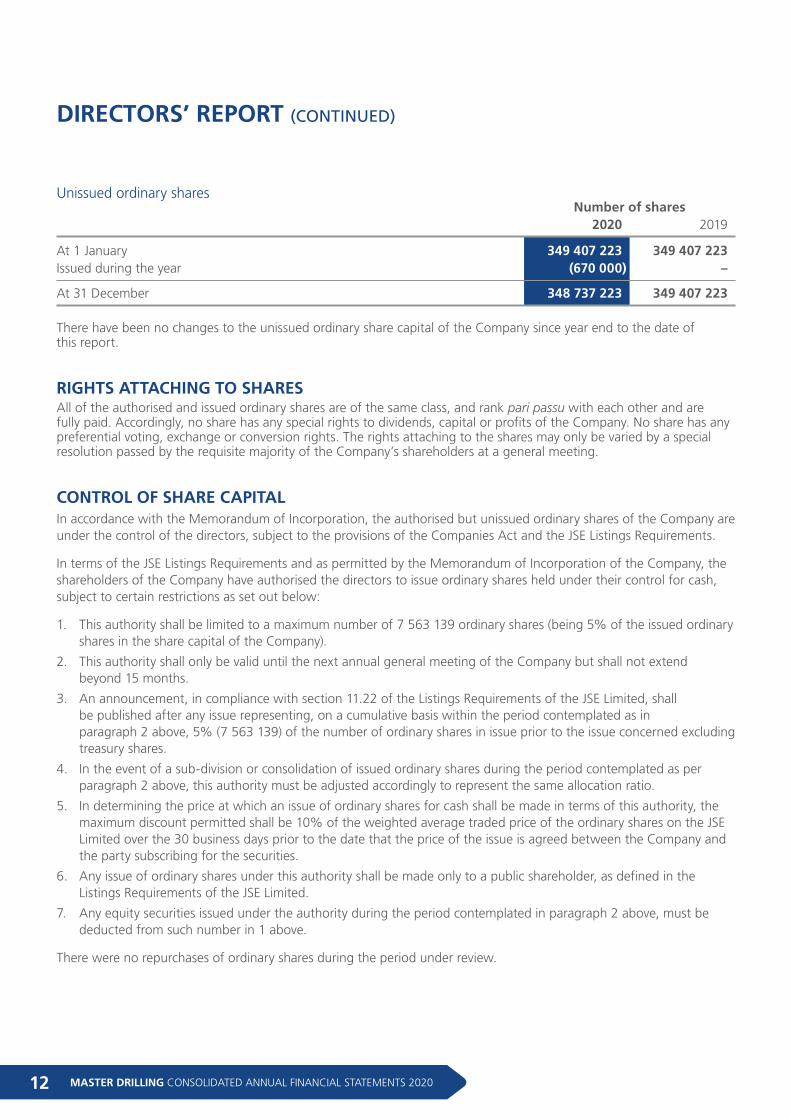
Unissued ordinary shares Number of shares 2020 2019
At 1 January 349 407 223 349 407 223Issued during the year (670 000) –
At 31 December 348 737 223 349 407 223
There have been no changes to the unissued ordinary share capital of the Company since year end to the date of this report.
RIGHTS ATTACHING TO SHARES All of the authorised and issued ordinary shares are of the same class, and rank pari passu with each other and are fully paid. Accordingly, no share has any special rights to dividends, capital or profits of the Company. No share has any preferential voting, exchange or conversion rights. The rights attaching to the shares may only be varied by a special resolution passed by the requisite majority of the Company’s shareholders at a general meeting.
CONTROL OF SHARE CAPITALIn accordance with the Memorandum of Incorporation, the authorised but unissued ordinary shares of the Company are under the control of the directors, subject to the provisions of the Companies Act and the JSE Listings Requirements.
In terms of the JSE Listings Requirements and as permitted by the Memorandum of Incorporation of the Company, the shareholders of the Company have authorised the directors to issue ordinary shares held under their control for cash, subject to certain restrictions as set out below:
1. This authority shall be limited to a maximum number of 7 563 139 ordinary shares (being 5% of the issued ordinary shares in the share capital of the Company).
2. This authority shall only be valid until the next annual general meeting of the Company but shall not extend beyond 15 months.
3. An announcement, in compliance with section 11.22 of the Listings Requirements of the JSE Limited, shall be published after any issue representing, on a cumulative basis within the period contemplated as in paragraph 2 above, 5% (7 563 139) of the number of ordinary shares in issue prior to the issue concerned excluding treasury shares.
4. In the event of a sub-division or consolidation of issued ordinary shares during the period contemplated as per paragraph 2 above, this authority must be adjusted accordingly to represent the same allocation ratio.
5. In determining the price at which an issue of ordinary shares for cash shall be made in terms of this authority, the maximum discount permitted shall be 10% of the weighted average traded price of the ordinary shares on the JSE Limited over the 30 business days prior to the date that the price of the issue is agreed between the Company and the party subscribing for the securities.
6. Any issue of ordinary shares under this authority shall be made only to a public shareholder, as defined in the Listings Requirements of the JSE Limited.
7. Any equity securities issued under the authority during the period contemplated in paragraph 2 above, must be deducted from such number in 1 above.
There were no repurchases of ordinary shares during the period under review.
DIRECTORS’ REPORT (CONTINUED)
13MASTER DRILLING CONSOLIDATED ANNUAL FINANCIAL STATEMENTS 2020
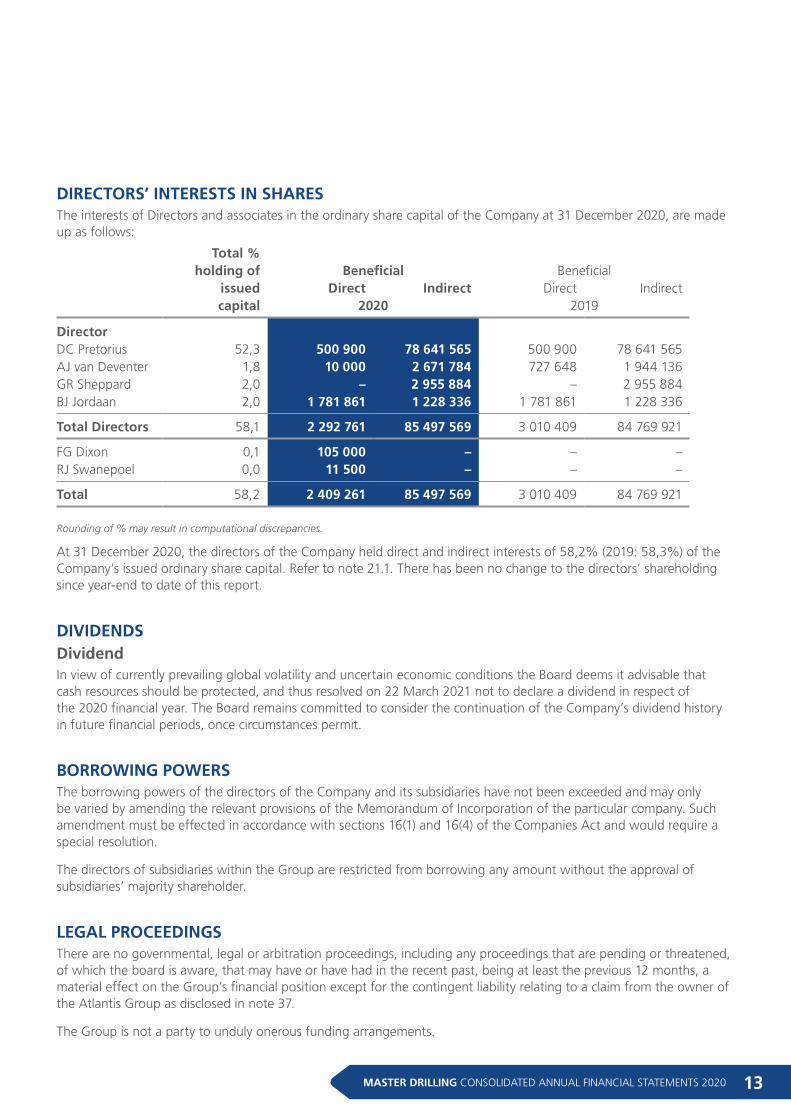
DIRECTORS’ INTERESTS IN SHARESThe interests of Directors and associates in the ordinary share capital of the Company at 31 December 2020, are made up as follows:
Total % holding of Beneficial Beneficial issued Direct Indirect Direct Indirect capital 2020 2019
Director DC Pretorius 52,3 500 900 78 641 565 500 900 78 641 565AJ van Deventer 1,8 10 000 2 671 784 727 648 1 944 136GR Sheppard 2,0 – 2 955 884 – 2 955 884BJ Jordaan 2,0 1 781 861 1 228 336 1 781 861 1 228 336
Total Directors 58,1 2 292 761 85 497 569 3 010 409 84 769 921
FG Dixon 0,1 105 000 – – –RJ Swanepoel 0,0 11 500 – – –
Total 58,2 2 409 261 85 497 569 3 010 409 84 769 921
Rounding of % may result in computational discrepancies.
At 31 December 2020, the directors of the Company held direct and indirect interests of 58,2% (2019: 58,3%) of the Company’s issued ordinary share capital. Refer to note 21.1. There has been no change to the directors’ shareholding since year-end to date of this report.
DIVIDENDS DividendIn view of currently prevailing global volatility and uncertain economic conditions the Board deems it advisable that cash resources should be protected, and thus resolved on 22 March 2021 not to declare a dividend in respect of the 2020 financial year. The Board remains committed to consider the continuation of the Company’s dividend history in future financial periods, once circumstances permit.
BORROWING POWERSThe borrowing powers of the directors of the Company and its subsidiaries have not been exceeded and may only be varied by amending the relevant provisions of the Memorandum of Incorporation of the particular company. Such amendment must be effected in accordance with sections 16(1) and 16(4) of the Companies Act and would require a special resolution.
The directors of subsidiaries within the Group are restricted from borrowing any amount without the approval of subsidiaries’ majority shareholder.
LEGAL PROCEEDINGSThere are no governmental, legal or arbitration proceedings, including any proceedings that are pending or threatened, of which the board is aware, that may have or have had in the recent past, being at least the previous 12 months, a material effect on the Group’s financial position except for the contingent liability relating to a claim from the owner of the Atlantis Group as disclosed in note 37.
The Group is not a party to unduly onerous funding arrangements.
MASTER DRILLING CONSOLIDATED ANNUAL FINANCIAL STATEMENTS 202014
DIRECTORS’ REPORT (CONTINUED)
MATERIAL CHANGEThe financial and trading position of Master Drilling Group Limited has not materially changed for the financial year. The ultimate holding company, Master Drilling Group Limited, is incorporated in South Africa.
CHANGES TO THE BOARDThe only change to the board of directors was the appointment of HJ Faul as an independent non-executive director effective 09 June 2020.
SEPARATE COMPANY FINANCIAL STATEMENTSA copy of the Master Drilling Group Limited company financial statements can be found on the company’s website (www.masterdrilling.com).
ANNUAL GENERAL MEETINGThe annual general meeting of Master Drilling Group Limited will be held virtually, on Monday, 14 June 2021 at 09:00. More details on arrangements around the virtual annual general meeting will be disclosed in the notice and proxy that will be available no later than 30 April 2021.
SUBSIDIARIESThe subsidiaries of Master Drilling are disclosed in Note 29 of this document.
EVENTS SUBSEQUENT TO YEAR-ENDIn January 2021, after the end of the 2020 financial year, the Group fulfilled all the conditions and acquired a 40% interest in Applied Vehicle Analysis (Pty) Ltd. The purchase consideration payable would amount to ZAR8,0 million.
The directors are not aware of any other matters or circumstances arising since the reporting date to the date of this report, not otherwise dealt with in this report.
COVID-19 PANDEMICVarious measures have been announced by governments around the world in response to the Covid-19 pandemic. The Group is mainly operating in the mining industry and sought to comply with the specific government measures in the countries that it operates in as well as with the specific measures implemented by its customers. The Group remained fully committed to doing its part in limiting the spread of the Covid-19 virus, with stringent workplace measures in place and further measures to be implemented as required. Ensuring the safety of our staff, their families and communities, and delivering our service to our clients, businesses and countries that we serve, remain key priorities. As the Group, we will continue our best endeavours to support all our key stakeholders and the countries in which we operate.
15MASTER DRILLING CONSOLIDATED ANNUAL FINANCIAL STATEMENTS 2020
During the year, the Group (or Group’s employees) received the following benefits from government institutions:
South AfricaIn South Africa, the Group’s employees received ZAR14,0 million from the Temporary Employer/Employee Relief Scheme, within the African segment of the Group. Master Drilling has facilitated the payment to the individual employees.
EuropeIn Sweden, the Group received government assistance to the value of SEK1.0 million to sustain the business operations within the country. There were no special conditions linked to the assistance received from the government and the amount was disclosed as part of the Group’s other income in the income statement.
United States of AmericaIn the USA, the Group received government assistance in the form of an interest free loan of USD0.3 million. As at 31 December 2020 clarity is awaited from the US Government as to the repayment requirements. The Group disclosed the loan as part sundry payable in the financial statements.
CanadaIn Canada, the Group received government assistance to the value of CAD0.3 million to sustain the business operations within the country. There were no special conditions linked to the assistance received from the government and the amount was disclosed as part of the Group’s other income in the income statement.
MATERIAL RESOLUTIONSNo material special shareholders resolutions were passed during the year under review, except those passed at the annual general meeting held on 9 June 2020. Copies of all material shareholders resolutions taken by the subsidiaries during the year under review may be obtained from the office of the Company Secretary.
OPERATING SEGMENTS There were no changes made to the reporting segments during the current financial year. See note 27 for more details.
On behalf of the Board
Hendrik Roux van der MerweChairman
Johannesburg22 March 2021
MASTER DRILLING CONSOLIDATED ANNUAL FINANCIAL STATEMENTS 202016
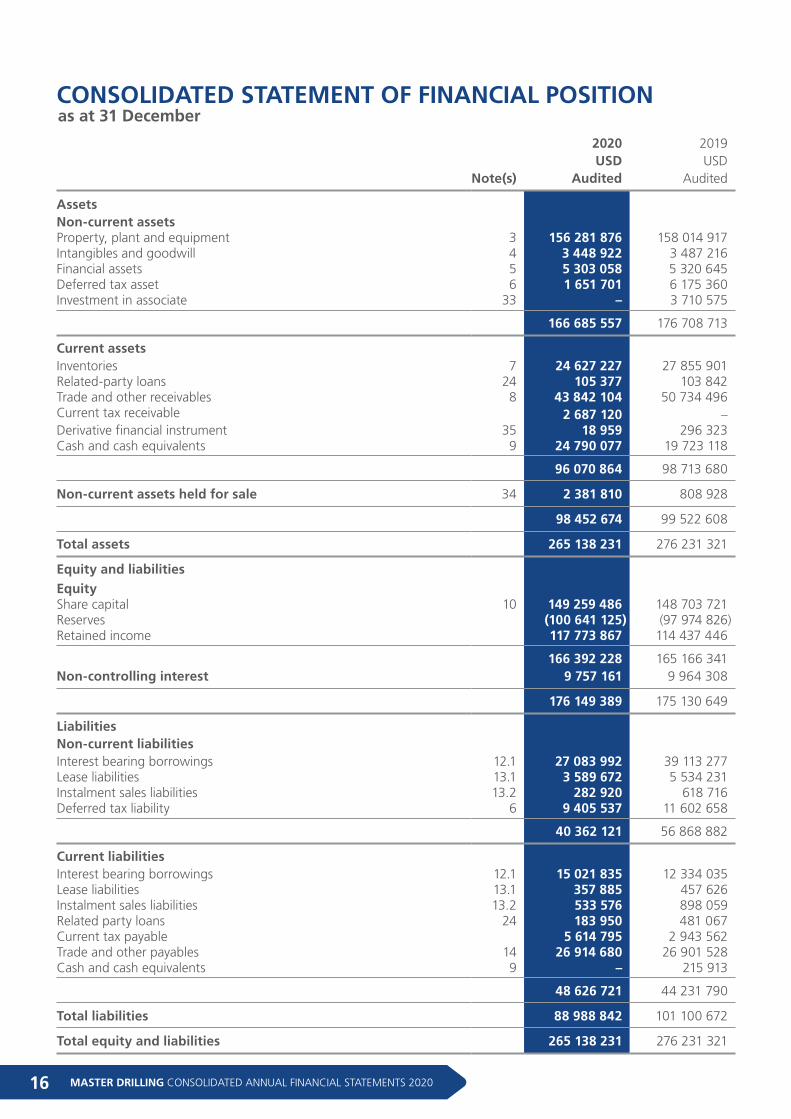
CONSOLIDATED STATEMENT OF FINANCIAL POSITION
2020 2019 USD USD
Note(s) Audited Audited
Assets Non-current assets Property, plant and equipment 3 156 281 876 158 014 917Intangibles and goodwill 4 3 448 922 3 487 216Financial assets 5 5 303 058 5 320 645Deferred tax asset 6 1 651 701 6 175 360Investment in associate 33 – 3 710 575
166 685 557 176 708 713
Current assets Inventories 7 24 627 227 27 855 901Related-party loans 24 105 377 103 842Trade and other receivables 8 43 842 104 50 734 496Current tax receivable 2 687 120 –Derivative financial instrument 35 18 959 296 323Cash and cash equivalents 9 24 790 077 19 723 118
96 070 864 98 713 680
Non-current assets held for sale 34 2 381 810 808 928
98 452 674 99 522 608
Total assets 265 138 231 276 231 321
Equity and liabilities
Equity Share capital 10 149 259 486 148 703 721Reserves (100 641 125) (97 974 826)Retained income 117 773 867 114 437 446
166 392 228 165 166 341Non-controlling interest 9 757 161 9 964 308
176 149 389 175 130 649
Liabilities Non-current liabilities Interest bearing borrowings 12.1 27 083 992 39 113 277Lease liabilities 13.1 3 589 672 5 534 231Instalment sales liabilities 13.2 282 920 618 716Deferred tax liability 6 9 405 537 11 602 658
40 362 121 56 868 882
Current liabilities Interest bearing borrowings 12.1 15 021 835 12 334 035Lease liabilities 13.1 357 885 457 626Instalment sales liabilities 13.2 533 576 898 059Related party loans 24 183 950 481 067Current tax payable 5 614 795 2 943 562Trade and other payables 14 26 914 680 26 901 528Cash and cash equivalents 9 – 215 913
48 626 721 44 231 790
Total liabilities 88 988 842 101 100 672
Total equity and liabilities 265 138 231 276 231 321
as at 31 December
17MASTER DRILLING CONSOLIDATED ANNUAL FINANCIAL STATEMENTS 2020
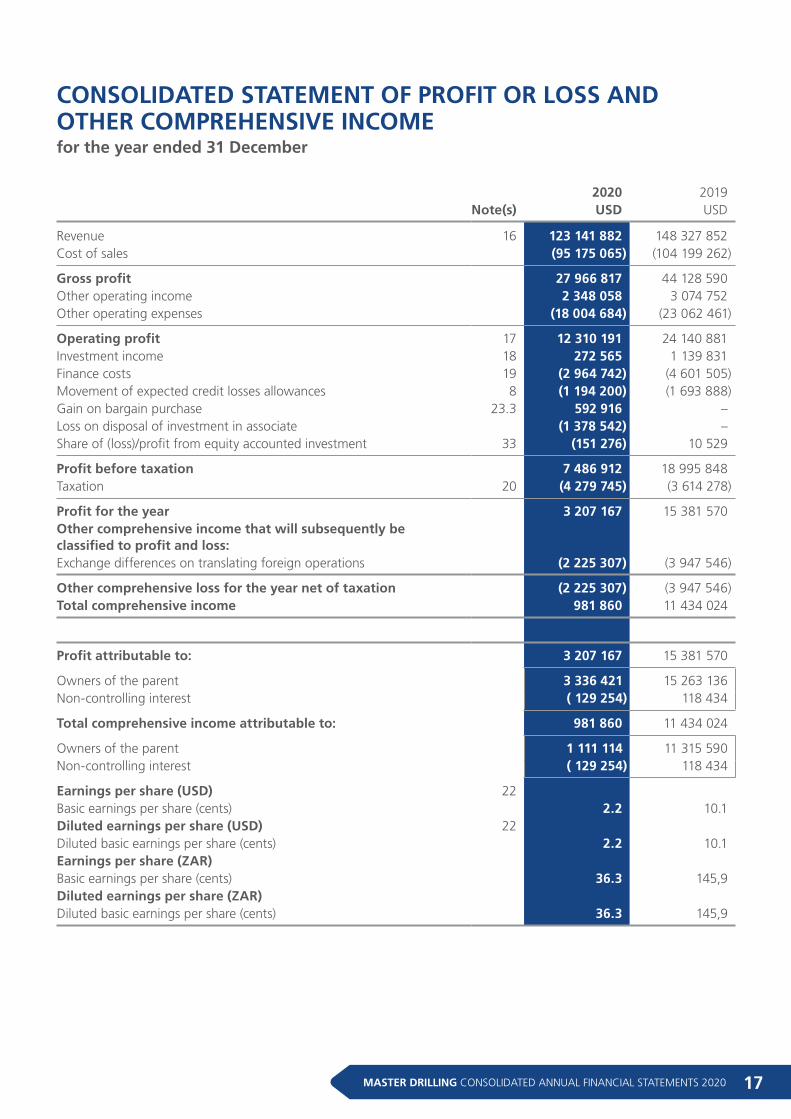
CONSOLIDATED STATEMENT OF PROFIT OR LOSS AND OTHER COMPREHENSIVE INCOME
2020 2019 Note(s) USD USD
Revenue 16 123 141 882 148 327 852Cost of sales (95 175 065) (104 199 262)
Gross profit 27 966 817 44 128 590Other operating income 2 348 058 3 074 752Other operating expenses (18 004 684) (23 062 461)
Operating profit 17 12 310 191 24 140 881Investment income 18 272 565 1 139 831Finance costs 19 (2 964 742) (4 601 505)Movement of expected credit losses allowances 8 (1 194 200) (1 693 888)Gain on bargain purchase 23.3 592 916 –Loss on disposal of investment in associate (1 378 542) –Share of (loss)/profit from equity accounted investment 33 (151 276) 10 529
Profit before taxation 7 486 912 18 995 848Taxation 20 (4 279 745) (3 614 278)
Profit for the year 3 207 167 15 381 570Other comprehensive income that will subsequently be classified to profit and loss: Exchange differences on translating foreign operations (2 225 307) (3 947 546)
Other comprehensive loss for the year net of taxation (2 225 307) (3 947 546)Total comprehensive income 981 860 11 434 024
Profit attributable to: 3 207 167 15 381 570
Owners of the parent 3 336 421 15 263 136Non-controlling interest ( 129 254) 118 434
Total comprehensive income attributable to: 981 860 11 434 024
Owners of the parent 1 111 114 11 315 590Non-controlling interest ( 129 254) 118 434
Earnings per share (USD) 22 Basic earnings per share (cents) 2.2 10.1Diluted earnings per share (USD) 22 Diluted basic earnings per share (cents) 2.2 10.1Earnings per share (ZAR) Basic earnings per share (cents) 36.3 145,9Diluted earnings per share (ZAR) Diluted basic earnings per share (cents) 36.3 145,9
for the year ended 31 December
MASTER DRILLING CONSOLIDATED ANNUAL FINANCIAL STATEMENTS 202018
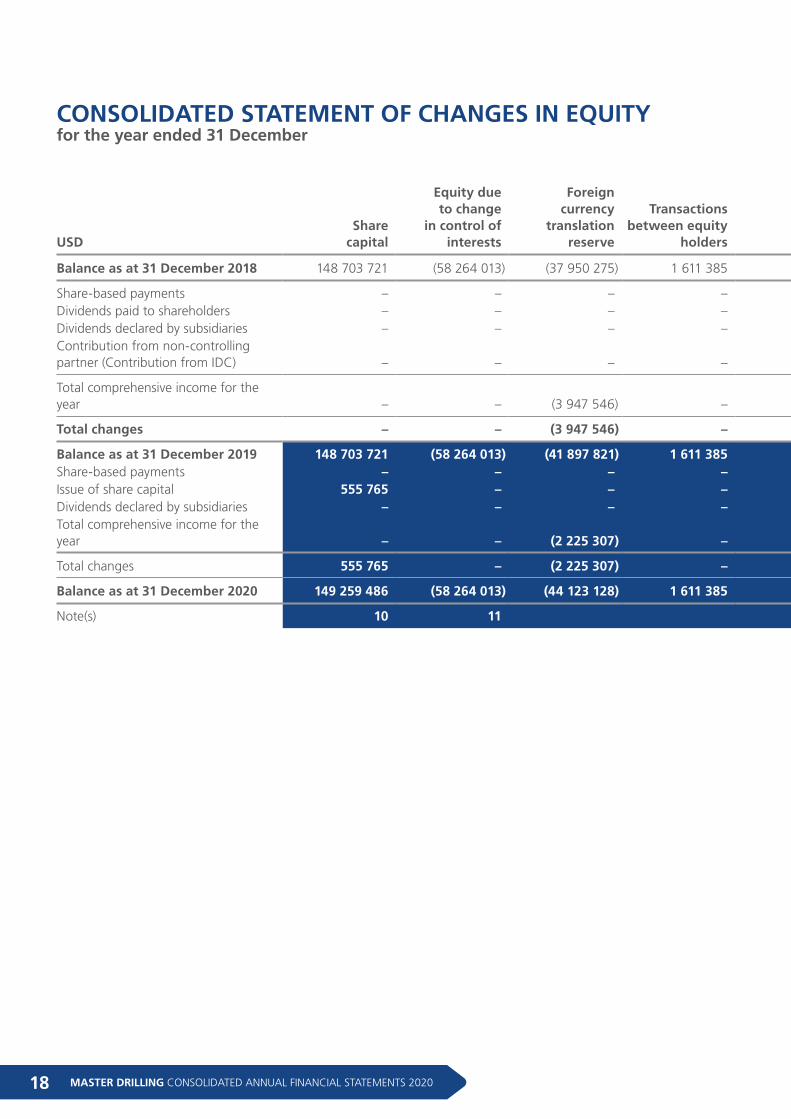
CONSOLIDATED STATEMENT OF CHANGES IN EQUITY
USDShare
capital
Equity due to change
in control of interests
Foreigncurrency
translationreserve
Transactions between equity
holders
Share-basedpayments
reserveTotal
reservesRetained
income
Attributableto owners of
the parent
Non-controlling
interest
TotalShareholders'
equity
Balance as at 31 December 2018 148 703 721 (58 264 013) (37 950 275) 1 611 385 715 912 (93 886 991) 101 837 302 156 654 032 9 002 330 165 656 362
Share-based payments – – – – (140 289) (140 289) – (140 289) – (140 289)Dividends paid to shareholders – – – – – – (2 662 992) (2 662 992) – (2 662 992)Dividends declared by subsidiaries – – – – – – – – (525 953) (525 953)Contribution from non-controlling partner (Contribution from IDC) – – – – – – – – 1 369 497 1 369 497
Total comprehensive income for the year – – (3 947 546) – – (3 947 546) 15 263 136 11 315 590 118 434 11 434 024
Total changes – – (3 947 546) – (140 289) (4 087 835) 12 600 144 8 512 309 961 978 9 474 287
Balance as at 31 December 2019 148 703 721 (58 264 013) (41 897 821) 1 611 385 575 623 (97 974 826) 114 437 446 165 166 341 9 964 308 175 130 649Share-based payments – – – – 62 574 62 574 – 62 574 – 62 574Issue of share capital 555 765 – – – (503 566) (503 566) – 52 199 – 52 199Dividends declared by subsidiaries – – – – – – – – (77 893) (77 893)Total comprehensive income for the year – – (2 225 307) – – (2 225 307) 3 336 421 1 111 114 (129 254) 981 860
Total changes 555 765 – (2 225 307) – (440 992) (2 666 299) 3 336 421 1 225 887 (207 147) 1 018 740
Balance as at 31 December 2020 149 259 486 (58 264 013) (44 123 128) 1 611 385 134 631 (100 641 125) 117 773 867 166 392 228 9 757 161 176 149 389
Note(s) 10 11
for the year ended 31 December
19MASTER DRILLING CONSOLIDATED ANNUAL FINANCIAL STATEMENTS 2020
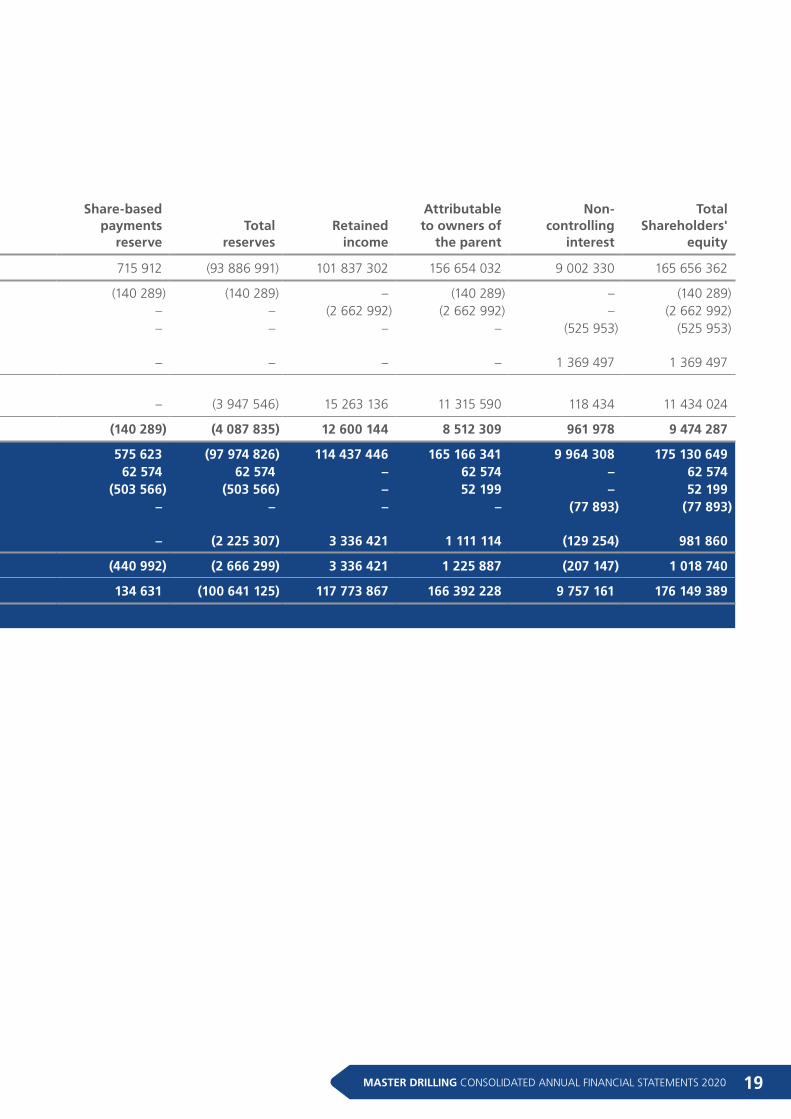
USDShare
capital
Equity due to change
in control of interests
Foreigncurrency
translationreserve
Transactions between equity
holders
Share-basedpayments
reserveTotal
reservesRetained
income
Attributableto owners of
the parent
Non-controlling
interest
TotalShareholders'
equity
Balance as at 31 December 2018 148 703 721 (58 264 013) (37 950 275) 1 611 385 715 912 (93 886 991) 101 837 302 156 654 032 9 002 330 165 656 362
Share-based payments – – – – (140 289) (140 289) – (140 289) – (140 289)Dividends paid to shareholders – – – – – – (2 662 992) (2 662 992) – (2 662 992)Dividends declared by subsidiaries – – – – – – – – (525 953) (525 953)Contribution from non-controlling partner (Contribution from IDC) – – – – – – – – 1 369 497 1 369 497
Total comprehensive income for the year – – (3 947 546) – – (3 947 546) 15 263 136 11 315 590 118 434 11 434 024
Total changes – – (3 947 546) – (140 289) (4 087 835) 12 600 144 8 512 309 961 978 9 474 287
Balance as at 31 December 2019 148 703 721 (58 264 013) (41 897 821) 1 611 385 575 623 (97 974 826) 114 437 446 165 166 341 9 964 308 175 130 649Share-based payments – – – – 62 574 62 574 – 62 574 – 62 574Issue of share capital 555 765 – – – (503 566) (503 566) – 52 199 – 52 199Dividends declared by subsidiaries – – – – – – – – (77 893) (77 893)Total comprehensive income for the year – – (2 225 307) – – (2 225 307) 3 336 421 1 111 114 (129 254) 981 860
Total changes 555 765 – (2 225 307) – (440 992) (2 666 299) 3 336 421 1 225 887 (207 147) 1 018 740
Balance as at 31 December 2020 149 259 486 (58 264 013) (44 123 128) 1 611 385 134 631 (100 641 125) 117 773 867 166 392 228 9 757 161 176 149 389
Note(s) 10 11
MASTER DRILLING CONSOLIDATED ANNUAL FINANCIAL STATEMENTS 202020
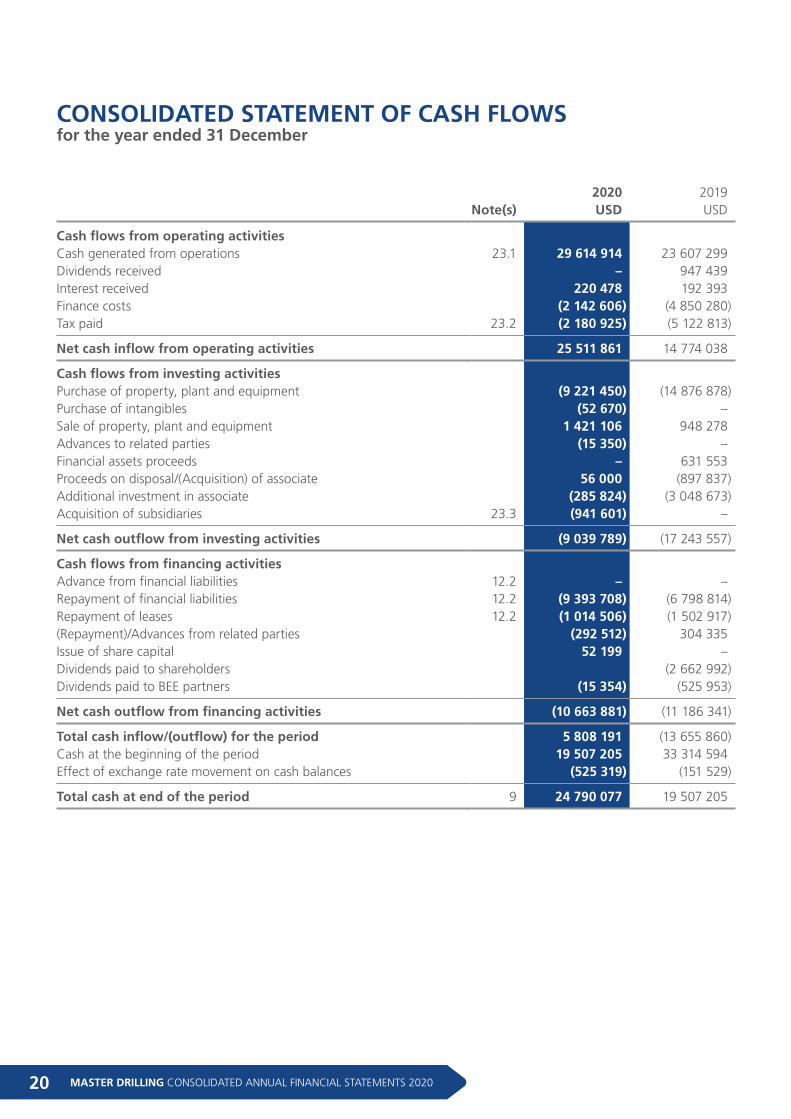
CONSOLIDATED STATEMENT OF CASH FLOWS
2020 2019 Note(s) USD USD
Cash flows from operating activities Cash generated from operations 23.1 29 614 914 23 607 299Dividends received – 947 439Interest received 220 478 192 393Finance costs (2 142 606) (4 850 280)Tax paid 23.2 (2 180 925) (5 122 813)
Net cash inflow from operating activities 25 511 861 14 774 038
Cash flows from investing activities Purchase of property, plant and equipment (9 221 450) (14 876 878)Purchase of intangibles (52 670) –Sale of property, plant and equipment 1 421 106 948 278Advances to related parties (15 350) –Financial assets proceeds – 631 553Proceeds on disposal/(Acquisition) of associate 56 000 (897 837)Additional investment in associate (285 824) (3 048 673)Acquisition of subsidiaries 23.3 (941 601) –
Net cash outflow from investing activities (9 039 789) (17 243 557)
Cash flows from financing activities Advance from financial liabilities 12.2 – –Repayment of financial liabilities 12.2 (9 393 708) (6 798 814)Repayment of leases 12.2 (1 014 506) (1 502 917)(Repayment)/Advances from related parties (292 512) 304 335Issue of share capital 52 199 –Dividends paid to shareholders (2 662 992)Dividends paid to BEE partners (15 354) (525 953)
Net cash outflow from financing activities (10 663 881) (11 186 341)
Total cash inflow/(outflow) for the period 5 808 191 (13 655 860)Cash at the beginning of the period 19 507 205 33 314 594Effect of exchange rate movement on cash balances (525 319) (151 529)
Total cash at end of the period 9 24 790 077 19 507 205
for the year ended 31 December
21MASTER DRILLING CONSOLIDATED ANNUAL FINANCIAL STATEMENTS 2020
ACCOUNTING POLICIES
1. PRESENTATION OF FINANCIAL INFORMATION The Group’s consolidated annual financial statements have been prepared in accordance with International Financial Reporting Standards, the SAICA Financial Reporting Guides as issued by the IFRS Interpretations Committee (“IFRIC”) and Financial Reporting Pronouncements as issued by the Financial Reporting Standards Council, the requirements of the Companies Act and the JSE Listings Requirements. The consolidated annual financial statements have been prepared on the historical cost basis, except for certain financial instruments at fair value or amortised cost and incorporate the principal accounting policies set out below. They are presented in United States Dollar (“USD”). The accounting policies are consistent in all material respects with those applied in the previous year except for the list of amendments to IFRS that are mandatory and effective for the annual financial year ending 31 December 2020 as indicated in note 2.1 below.
1.1 Functional and presentation currencyItems included in the consolidated annual financial statements of each of the Group’s entities are measured using the currency of the primary economic environment in which the entity operates, i.e. “functional currency”. The consolidated annual financial statements are presented in USD (the “presentation currency”). Management believes that USD is more useful to the users of the consolidated financial statements, as this currency most reliably reflects the global business performance of the Group as a whole.
1.2 ConsolidationBasis of consolidation
The Group annual financial statements incorporate all entities which are controlled by the Group.
At inception the Group annual financial statements had been accounted for under the pooling of interest method as acquisition of entities under common control, which is excluded from IFRS 3. The entities had been accounted for at historical carrying values for the period presented.
Adjustments are made when necessary to the financial statements of subsidiaries to bring their accounting policies in line with those of the Group.
All transactions and balances between Group companies are eliminated on consolidation, including unrealised gains and losses on transactions between Group companies. Where unrealised losses on intra-group asset sales are reversed on consolidation, the underlying asset is also tested for impairment from a Group perspective. Amounts reported in the financial statements of subsidiaries have been adjusted where necessary to ensure consistency with the accounting policies adopted by the Group.
Control is considered to exist if all of the factors below are satisfied.
(a) The investor has power over the investee, i.e. the investor has existing rights that give it the ability to direct the relevant activities;
(b) The investor has exposure, or rights to variable returns from its involvement with the investee; and
(c) The investor has the ability to use its power over the investee to affect the amount of the investors returns.
The Group assesses its control of an investee at the time of its initial investment and again if changes in facts and circumstances affect one or more of the control factors listed above. In assessing whether the Group has control over an investee, consideration is given to many factors including shareholding, voting rights and their impact on the Group’s ability to direct the management, operations and returns of the investee; contractual obligations; minority shareholder rights and whether these are protective or substantive in nature; and the financial position of the investee.
MASTER DRILLING CONSOLIDATED ANNUAL FINANCIAL STATEMENTS 202022
ACCOUNTING POLICIES (CONTINUED)
1.3 Business combinationsThe Group applies the acquisition method in accounting for business combinations. The consideration transferred by the Group to obtain control of a subsidiary is calculated as the sum of the acquisition-date fair values of assets transferred, liabilities incurred and the equity interests issued by the Group, which includes the fair value of any asset or liability arising from a contingent consideration arrangement. Acquisition costs are expensed as incurred.
The Group recognises identifiable assets acquired and liabilities assumed in a business combination regardless of whether they have been previously recognised in the acquiree’s financial statements prior to the acquisition. Assets acquired and liabilities assumed are generally measured at their acquisition-date fair values.
1.4 Significant judgements and sources of estimation uncertaintyIn preparing the Group annual financial statements, management is required to make estimates and assumptions that affect the amounts represented in the financial information and related disclosures. Use of available information and the application of judgement are inherent in the formation of estimates. Actual results in the future could differ from these estimates which may be material to the financial information. Significant judgements and areas of uncertainty include:
(a) Trade receivables
The Group applies the IFRS 9 simplified model of recognising lifetime expected credit losses (“ECL”) for all trade receivables as these items do not have a significant financing component.
In measuring the expected credit losses, the trade receivables have been assessed on a collective basis as they possess shared industry credit risk characteristics. Credit losses are measured in accordance with industry related values as reported by an accredited investor services company.
Failure to make payments within contractual agreement from the invoice date and failure to engage with the Group on alternative payment arrangement amongst other is considered indicators of an increase in credit risk.
In making this assessment, as far as available, the Group considers both quantitative and qualitative information that is reasonable and supportable, including historical experience and forward-looking information that is available without undue cost or effort. Forward looking information considered includes the future prospects of the industries in which the Group’s debtors operate, obtained from various other external sources such as economic expert reports, financial analysts, governmental bodies as well as consideration of actual and forecast economic information that relate to the Group’s core operations. These assessments are done in the various business units for the specific countries that it operates in.
Trade receivables are written off (ie derecognised) when there is no reasonable expectation of recovery.
The group assesses the expected credit losses on inter-group and related party receivables based on the forward-looking expected credit loss model. The methodology used to determine the amount of allowance is based on the underlying liquid assets of the respective parties for on-demand collectability.
(b) Goodwill
Determining whether goodwill is impaired requires an estimation of the value-in-use of the cash-generating units to which goodwill has been allocated. The value-in-use calculation requires the directors to estimate the future cash flows expected to arise from the
23MASTER DRILLING CONSOLIDATED ANNUAL FINANCIAL STATEMENTS 2020
cash-generating unit and a suitable discount rate in order to calculate present value. Where the actual future cash flows are less than expected, an impairment loss may arise.
(c) Taxation
Judgement is required in determining the provision for income taxes due to the complexity of legislation. There are many transactions and calculations for which the ultimate tax determination is uncertain during the ordinary course of business. The Group recognises liabilities for anticipated tax audit issues based on estimates of whether additional taxes will be due. Where the final tax outcome of these matters is different from the amounts that were initially recorded, such differences will impact the income tax and deferred tax provisions in the year in which such determination is made. The assessment of IFRIC 23 indicated no material changes in the corporate tax liabilities.
(d) Deferred taxation
The Group recognises the net future tax benefit related to deferred income tax assets to the extent that it is probable that the deductible temporary differences will reverse in the foreseeable future. Assessing the recoverability of deferred income tax assets requires the Group to make significant estimates related to expectations of future taxable income. Estimates of future taxable income are based on forecast cash flows from operations and the application of existing tax laws in each jurisdiction. To the extent that future cash flows and taxable income differ significantly from estimates, the ability of the Group to realise the net deferred tax assets recorded at the end of the reporting year could be impacted.
(e) Useful lives of depreciable assets
Management reviews its estimate of the useful lives and residual values of depreciable assets at each reporting date, based on the expected utility of the assets. Uncertainties in these estimates relate to technical obsolescence that may change the utility of certain assets. Management uses judgement to determine the useful lives and residual values based on the specific environmental conditions it operates within. As the majority of the assets are purpose built, no specific benchmark is available.
(f) Covid-19 Pandemic
The effects of Covid-19 have resulted in certain judgements and estimates being significant in the current period when they had not been in the past. This is due to the uncertainty introduced by the effects of the pandemic, such as collection risk for customers, the cash flows included in estimates of recoverable amounts.
(g) Intangible assets
Management reviews its estimate of the useful lives and residual values of depreciable intangibles at each reporting date, based on the expected utility of the assets. Uncertainties in these estimates relate to technical obsolescence that may change the utility of certain intangibles. Management uses judgement to determine the useful lives and residual values based on the specific environmental conditions it operates within.
MASTER DRILLING CONSOLIDATED ANNUAL FINANCIAL STATEMENTS 202024
ACCOUNTING POLICIES (CONTINUED)
1.5 GoodwillGoodwill arising on an acquisition of a business is carried at cost in the functional currency as established at the date of acquisition of the business (see note 4) less accumulated impairment losses, if any. Goodwill is translated to presentation currency and the difference is accounted for as a foreign currency translation difference.
For the purposes of impairment testing, goodwill is allocated to each of the Group’s cash-generating units (or Groups of cash-generating units) that is expected to benefit from the synergies of the combination.
1.6 Investment in associateThe assets, liabilities and share of profit or loss of associates are incorporated in these consolidated annual financial statements using the equity method of accounting. An investment in associate is initially recognised in the consolidated statement of financial position at cost and adjusted for thereafter to recognise the Group’s share of the profit or loss in associate and other comprehensive income of the associate.
1.7 IntangiblesPatents are acquired by the Group and have an indefinite useful life and is thus not depreciated as the Group’s plan and ability is to renew and maintain the patent indefinitely. It is expected that the patent will generate revenue for the Group for an unlimited period of time. Patents are carried at cost less accumulated impairment losses. Patents are assessed annually for possible impairment.
Computer software are initially measured at cost and subsequently at cost less any accumulated amortisation and accumulated impairment losses.
Amortisation methods, useful lives and residual values are reviewed at each reporting date and adjusted if appropriate.
Costs include costs incurred initially to acquire computer software.
Average Depreciation Item useful life Method
Computer software 3 – 10 years Straight line
1.8 Property, plant and equipment Property, plant and equipment are initially measured at cost and subsequently at cost less any accumulated depreciation and accumulated impairment losses.
Costs include costs incurred initially to acquire or construct an item of property, plant and equipment. Cost associated with equipment upgrades that result in increased capabilities or performance enhancements of property and equipment are capitalised. If a replacement part is recognised in the carrying amount of an item of property, plant and equipment, the carrying amount of the replaced part is derecognised.
An asset under construction will be reclassified to the relevant asset category as soon as it is available for use. Assets under construction are not depreciated.
25MASTER DRILLING CONSOLIDATED ANNUAL FINANCIAL STATEMENTS 2020
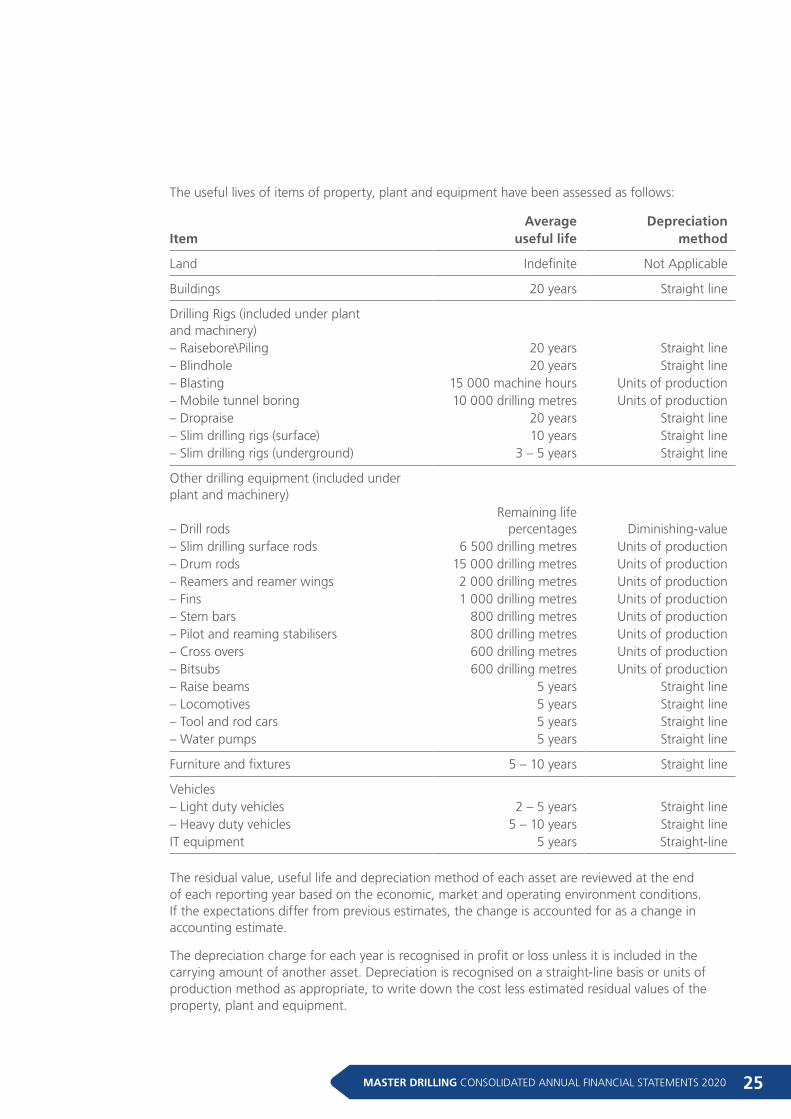
The useful lives of items of property, plant and equipment have been assessed as follows:
Average Depreciation Item useful life method
Land Indefinite Not Applicable
Buildings 20 years Straight line
Drilling Rigs (included under plant and machinery) – Raisebore\Piling 20 years Straight line– Blindhole 20 years Straight line– Blasting 15 000 machine hours Units of production– Mobile tunnel boring 10 000 drilling metres Units of production– Dropraise 20 years Straight line– Slim drilling rigs (surface) 10 years Straight line– Slim drilling rigs (underground) 3 – 5 years Straight line
Other drilling equipment (included under plant and machinery)
– Drill rodsRemaining life
percentages Diminishing-value – Slim drilling surface rods 6 500 drilling metres Units of production– Drum rods 15 000 drilling metres Units of production– Reamers and reamer wings 2 000 drilling metres Units of production– Fins 1 000 drilling metres Units of production– Stem bars 800 drilling metres Units of production– Pilot and reaming stabilisers 800 drilling metres Units of production– Cross overs 600 drilling metres Units of production– Bitsubs 600 drilling metres Units of production– Raise beams 5 years Straight line– Locomotives 5 years Straight line– Tool and rod cars 5 years Straight line– Water pumps 5 years Straight line
Furniture and fixtures 5 – 10 years Straight line
Vehicles – Light duty vehicles 2 – 5 years Straight line– Heavy duty vehicles 5 – 10 years Straight lineIT equipment 5 years Straight-line
The residual value, useful life and depreciation method of each asset are reviewed at the end of each reporting year based on the economic, market and operating environment conditions. If the expectations differ from previous estimates, the change is accounted for as a change in accounting estimate.
The depreciation charge for each year is recognised in profit or loss unless it is included in the carrying amount of another asset. Depreciation is recognised on a straight-line basis or units of production method as appropriate, to write down the cost less estimated residual values of the property, plant and equipment.
MASTER DRILLING CONSOLIDATED ANNUAL FINANCIAL STATEMENTS 202026
ACCOUNTING POLICIES (CONTINUED)
The gain or loss arising from the derecognition of an item of property, plant and equipment is included in profit or loss when the item is derecognised. The gain or loss arising from the derecognition of an item of property, plant and equipment is determined as the difference between the net disposal proceeds, if any, and the carrying amount of the item.
1.9 Segment reporting The chief operating decision maker of the Group is the Chief Executive Officer. Information reported to the group’s chief operating decision maker for purposes of resource allocation and assessment of segment performance is focused on geographical areas. Each reportable segment derives its revenues from the sale of goods related services.
The Group has four operating segments. In identifying these operating segments, management generally follows the Group’s geographical spread. Each of these operating segments is managed separately as each requires different technologies, marketing approaches and other resources.
1.10 Financial instruments The standard for financial instruments (IFRS 9) provides guidance on the classification and measurement of financial assets and ‘expected credit loss’ model for the impairment of financial assets.
(a) Classification
The Group classifies financial assets and financial liabilities into the following categories:
– amortised cost; and
– fair value through profit and loss.
Classification of financial assets is determined by:
– the entity’s business model for managing financial instrument; and
– the contractual cashflow characteristics.
(b) Initial recognition and measurement
Financial instruments are recognised initially when the Group becomes a party to the contractual provisions of the instruments at fair value. Classification of financial liabilities is determined by the purpose for which the liability was acquired and its contractual terms.
(c) Subsequent measurement
Financial assets are subsequently measured at amortised cost, using the effective interest method, less accumulated impairment losses.
Financial liabilities are subsequently measured at amortised cost, using the effective interest method.
The fair values of financial assets in this category are determined by reference to active market transactions or using a valuation technique where no active market exists.
All income and expenses relating to financial assets that are recognised in profit or loss are presented within finance costs, finance income or other financial items, except for impairment of trade receivables which is presented within other expenses.
All derivative financial instruments are subsequently measured at FVTPL.
1.8 Property, plant and equipment continued
27MASTER DRILLING CONSOLIDATED ANNUAL FINANCIAL STATEMENTS 2020
(d) Impairment of financial assets
At each reporting date the Group assesses all financial assets, to determine whether there is objective evidence that a financial asset has been impaired.
IFRS 9’s impairment requires the use of forward-looking information to recognise expected credit losses. The Group uses the simplified approach on the ECL measurements based on a provision matrix. The Group considers risks related to the clients that it deals with in the industries it operates in to calculate the ECL measurements. The Group’s clients have been fairly consistent over an extensive period of time, making it possible to consider the past events, current conditions, reasonable and supportable forecasts available in the determination of the ECL measurements.
Instruments for which expected credit losses are recognised include loans and other debt-type financial assets measured at amortised cost, trade receivables and loans to employees that are not measured at fair value through profit or loss.
IFRS 9’s impairment requirements use more forward-looking information to recognise expected credit losses – the ‘expected credit loss model.
In applying this forward-looking approach, a distinction is made between:
– financial instruments that have not deteriorated significantly in credit quality since initial recognition or that have low credit risk (‘Stage 1’);
– financial instruments that have deteriorated significantly in credit quality since initial recognition and whose credit risk is not low (‘Stage 2’); or
– financial instruments that have objective evidence of impairment at the reporting date ('Stage 3’).
Besides for the trade and receivables, the Group performed credit risk assessment on its financial assets, related parties and cash and cash equivalents and concluded that ECL measurements are immaterial.
Impairment losses are recognised in profit or loss.
The Group considers a broader range of information when assessing credit risk and measuring expected credit losses, including past events, current conditions, reasonable and supportable forecasts that affect the expected collectability of the future cash flows of the financial instruments. In assessing ECL, the Group makes use of the general 3-stage approach as disclosed in note 8.
Reversals of impairment losses are recognised in profit or loss.
Where financial assets are impaired through use of an allowance account, the amount of the loss is recognised in profit or loss within operating expenses. When such assets are written off, the write off is made against the relevant allowance account. Subsequent recoveries of amounts previously written off are credited against operating expenses.
(e) Loans to/(from) related parties
These include loans to and from related parties and are recognised initially at fair value plus direct transaction costs.
Loans to related parties are classified as financial assets carried at amortised cost.
Loans from related parties are classified as financial liabilities measured at amortised cost.
MASTER DRILLING CONSOLIDATED ANNUAL FINANCIAL STATEMENTS 202028
ACCOUNTING POLICIES (CONTINUED)
(f) Loans to employees
These financial assets are classified as financial assets carried under amortised cost.
(g) Financial assets
These financial assets as disclosed in note 5 are classified as financial assets carried under amortised cost.
(h) Trade and other receivables
Trade receivables are measured at initial recognition at transaction price and are subsequently measured at amortised cost using the effective interest method.
(i) Trade and other payables
Trade payables are initially measured at fair value including transaction costs, and are subsequently measured at amortised cost, using the effective interest method.
(j) Cash and cash equivalents
Cash and cash equivalents comprise cash on hand and demand deposits, and other short-term highly liquid investments that are readily convertible to a known amount of cash and are subject to an insignificant risk of changes in value. Cash and cash equivalents are classified as financial assets carried at amortised cost.
(k) Bank overdrafts and borrowings
Bank overdrafts and borrowings are initially measured at fair value including transaction costs, and are subsequently measured at amortised cost, using the effective interest rate method. Any difference between the proceeds (net of transaction costs) and the settlement or redemption of borrowings is recognised over the term of the borrowings in accordance with the Group’s accounting policy for borrowing costs.
(l) Derivative financial instruments
Fair values for simple over-the-counter derivative financial instruments are based on market quotes. These quotes are assessed for reasonableness by discounting estimated future cash flows using the market rate for similar instruments at measurement date.
1.11 Non-current assets held for saleNon-current assets are classified as held for sale if it is highly probable that they will be recovered primarily through sale rather than through continuing use.
Such assets are generally measured at the lower of their carrying amount and fair value less costs to sell. Impairment losses on initial classification as held for sale and subsequent gains and losses on remeasurement are recognised in profit or loss.
Once classified as held for sale, non-current assets are no longer depreciated.
1.12 Tax(a) Current tax assets and liabilities
Current tax for current and prior years is, to the extent unpaid, recognised as a liability. If the amount already paid in respect of current and prior years exceeds the amount due for those years, the excess is recognised as an asset.
1.10 Financial instruments continued
29MASTER DRILLING CONSOLIDATED ANNUAL FINANCIAL STATEMENTS 2020
Current tax liabilities (assets) for the current and prior years are measured at the amount expected to be paid to (recovered from) the tax authorities, using the tax rates (and tax laws) that have been enacted or substantively enacted by the end of the reporting year.
(b) Deferred tax assets and liabilities
A deferred tax liability is recognised for all taxable temporary differences, except to the extent that the deferred tax liability arises from the initial recognition of an asset or liability in a transaction which at the time of the transaction, affects neither accounting profit nor taxable profit (tax loss).
A deferred tax asset is recognised for all deductible temporary differences to the extent that it is probable that taxable profit will be available against which the deductible temporary difference can be utilised. A deferred tax asset is not recognised when it arises from the initial recognition of an asset or liability in a transaction at the time of the transaction, affects neither accounting profit nor taxable profit (tax loss).
A deferred tax asset is recognised for the carry forward of unused tax losses to the extent that it is probable that future taxable profit will be available against which the unused tax losses can be utilised.
Deferred tax assets and liabilities are measured at the tax rates that are expected to apply to the year when the asset is realised or the liability is settled, based on tax rates (and tax laws) that have been enacted or substantively enacted by the end of the reporting year.
(c) Tax expenses
Current and deferred taxes are recognised as income or an expense and included in profit or loss for the year, except to the extent that the tax arises from:
– a transaction or event which is recognised, in the same or a different year, to other comprehensive income; or
– a business combination.
Current tax and deferred taxes are charged or credited to other comprehensive income if the tax relates to items that are credited or charged, in the same or a different year, to other comprehensive income.
1.13 LeasesAll leases are accounted for by recognising a right-of-use asset and a lease liability except for:
– leases of low value assets; and
– leases with a duration of 12 months or less.
Lease liabilities are measured at the present value of the contractual payments due to the lessor over the lease term, with the discount rate determined by reference to the rate inherent in the lease unless (as is typically the case) this is not readily determinable, in which case the group’s incremental borrowing rate on commencement of the lease is used. Variable lease payments are only included in the measurement of the lease liability if they depend on an index or rate. In such cases, the initial measurement of the lease liability assumes the variable element will remain unchanged throughout the lease term.
On initial recognition, the carrying amount of lease liability includes amount expected to be payable under the agreement while the right of use asset are initially measured at the same amount as the lease liability.
MASTER DRILLING CONSOLIDATED ANNUAL FINANCIAL STATEMENTS 202030
ACCOUNTING POLICIES (CONTINUED)
Subsequent to initial measurement lease liabilities increase as a result of interest charged at a constant rate on the balance outstanding and are reduced for lease payments made. Right-of-use assets are amortised on a straight-line basis over the remaining term of the lease.
When the group revises its estimate of the term of any lease, it adjusts the carrying amount of the lease liability to reflect the payments to make over the revised term, which are discounted at the same discount rate that applied on lease commencement. The carrying value of lease liabilities is similarly revised when the variable element of future lease payments dependent on a rate or index is revised. In both cases an equivalent adjustment is made to the carrying value of the right-of-use asset, with the revised carrying amount being amortised over the remaining (revised) lease term.
Refer to note 3 and 13 of the financial statements to see the impact of both the right of use of assets and liabilities.
1.14 InventoriesInventories are measured at the lower of cost and net realisable value. Allowance for obsolete stock is made on the basis of stock becoming redundant and no future economic benefits is expected to flow to the Group.
The cost of inventories is assigned using the weighted average cost formula. The same cost formula is used for all inventories having a similar nature and use to the entity.
Net realisable value is the estimated selling price in the ordinary course of business less the estimated costs of completion and the estimated costs necessary to make the sale.
The cost of inventories comprises all costs of purchase, costs of conversion and other costs incurred in bringing the inventories to their present location and condition.
The cost of inventories of items that are not ordinarily interchangeable and goods or services produced and segregated for specific projects is assigned using specific identification of the individual costs.
When inventories are utilised, the carrying amount of those inventories are recognised as an expense in the year in which the related revenue is recognised. The amount of any write-down of inventories to net realisable value and all losses of inventories are recognised as an expense in the year the write-down or loss occurs. The amount of any reversal of any write-down of inventories, arising from an increase in net realisable value, are recognised as a reduction in the amount of inventories recognised as an expense in the year in which the reversal occurs.
1.15 Impairment of goodwill and property, plant and equipment For impairment assessment purposes, assets are grouped at the lowest levels for which there are largely independent cash inflows (cash-generating units). As a result, some assets are tested individually for impairment and some are tested at cash-generating unit level. Goodwill is allocated to those cash-generating units that are expected to benefit from synergies of the related business combination and represent the lowest level within the Group at which Management monitors goodwill.
An impairment loss is recognised for the amount by which the asset’s or cash-generating units carrying amount exceeds its recoverable amount, which is the higher of fair value less costs of disposal and value-in-use. To determine the value-in-use, management estimates expected future cash flows from each cash-generating unit and determines a suitable interest rate in order to calculate the present value of those cash flows. The data used for impairment testing procedures
1.13 Leases continued
31MASTER DRILLING CONSOLIDATED ANNUAL FINANCIAL STATEMENTS 2020
are directly linked to the Group’s latest approved budget, adjusted as necessary to exclude the effects of future reorganisations and asset enhancements. Discount factors are determined individually for each cash-generating unit and reflect management’s assessment of respective risk profiles, such as market and asset-specific risks factors.
Impairment losses for cash-generating units reduce first the carrying amount of any goodwill allocated to that cash-generating unit. Any remaining impairment loss is allocated pro rata to the other assets in the cash-generating unit. With the exception of goodwill, all assets are subsequently reassessed for indications that an impairment loss previously recognised may no longer exist. An impairment loss is reversed if the asset’s or cash-generating unit’s recoverable amount exceeds its carrying amount.
1.16 Employee benefits(a) Short-term employee benefits
The cost of short-term employee benefits (those payable within 12 months after the service is rendered, such as paid vacation leave and sick leave, bonuses, and non-monetary benefits such as medical care), are recognised as an expense in the year in which the service is rendered and are not discounted.
The expected cost of compensated absences is recognised as an expense as the employees render services that increase their entitlement or, in the case of non-accumulating absences, when the absence occurs.
The expected cost of profit-sharing and bonus payments is recognised as an expense when there is a legal or constructive obligation to make such payments as a result of past performance.
(b) Defined contribution plans
Payments to defined contribution retirement benefit plans are charged as an expense as they fall due.
1.17 ContingenciesContingent assets are disclosed when it is probable that there will be an inflow of future economic benefits. Contingent liabilities are recognised as a provision when it is probable that there will be an outflow of economic resources, unless the possibility of an outflow of economic resources is remote.
1.18 RevenueRevenue is measured based on the consideration specified in a contract with a customer. The Group recognises revenue when it transfers control of a service to a customer using the five-step approach in the revenue framework in IFRS 15. The Group provides drillings services to its customers. Drilling revenue is recognised as revenue when the outcome of the drilling can be estimated reliably to the actual chargeable meters drilled. Such services are recognised as a performance obligation is satisfied over time when the drilling service has met the performance obligations under IFRS 15. Payment for drilling services is not due from the customer until the drilling service has been performed and invoiced. Revenue from the provision of services in the course of ordinary activities is measured at the fair value of the consideration received or receivable, net of discounts and value added taxes.
The outcome can be estimated reliably when all the following conditions are satisfied:
– the amount of revenue can be measured reliably;
MASTER DRILLING CONSOLIDATED ANNUAL FINANCIAL STATEMENTS 202032
ACCOUNTING POLICIES (CONTINUED)
– it is probable that the economic benefits associated with the drilling service rendered will flow to the Group;
– the work performed of the drilling service at the end of the reporting period can be measured reliably and has been agreed with the customer; and
– the costs incurred for and to complete the drilling can be measured reliably.
Management's assessment indicated that the contract’s performance obligations and related contract costs are realised over time and revenue for the Group is recognised using the output method based on the progress towards completion of the contract and meters drilled. The selling prices are contract specific.
The Group has taken advantage of the practical exemptions:
– not to account for significant financing components where the time difference between receiving consideration and transferring control of services to its customers is one year or less; and
– expense the incremental costs of obtaining a contract when the amortization period of the asset otherwise recognized would have been one year or less.
1.19 Investment incomeInterest is recognised, in profit or loss, using the effective interest rate method. Interest is disclosed as investment income in the statement of profit and loss and other comprehensive income.
Dividends are recognised, in profit or loss, when the Group’s right to receive payment has been established. Dividends received is disclosed as investment income in the statement of profit and loss and other comprehensive income.
1.20 Cost of sales The related cost of providing services recognised as revenue in the current year is included in cost of sales.
Contract costs comprise:
– costs that relate directly to the specific contract;
– costs that are attributable to contract activity in general and can be allocated to the contract; and
– such other costs as are specifically chargeable to the customer under the terms of the contract.
1.21 Translation on foreign currencies (a) Foreign currency translation
A foreign currency transaction is translated into the functional currency of the respective Group entity, using the exchange rates prevailing at the dates of the transactions (spot exchange rate).
At the end of the reporting year:
– foreign currency monetary items are translated using the closing rate;
– non-monetary items that are measured in terms of historical cost in a foreign currency are translated using the exchange rate at the date of the transaction; and
– non-monetary items that are measured at fair value in a foreign currency are translated using the exchange rates at the date when the fair value was determined.
1.18 Revenue continued
33MASTER DRILLING CONSOLIDATED ANNUAL FINANCIAL STATEMENTS 2020
Exchange differences arising on the settlement of monetary items or on translating monetary items at rates different from those at which they were translated on initial recognition during the year or in previous financial statements are recognised in profit or loss in the year in which they arise.
When a gain or loss on a non-monetary item is recognised in other comprehensive income and accumulated in equity, any exchange component of that gain or loss is recognised in other comprehensive income and accumulated in equity. When a gain or loss on a non-monetary item is recognised in profit or loss, any exchange component of that gain or loss is recognised in profit or loss.
(b) Translation to presentation currency
The results and financial position of operations are translated into the presentation currency using the following procedures:
– assets and liabilities for each statement of financial position presented are translated at the closing rate at the date of that statement of financial position;
– income and expenses for each item of profit or loss are translated at exchange rates at the dates of the transactions; and
– all resulting exchange differences are recognised in other comprehensive income and accumulated as a foreign currency translation reserve.
Exchange differences arising on a monetary item that forms part of a net investment in a foreign operation are recognised initially to other comprehensive income and accumulated in the translation reserve. They are recognised in profit or loss as a reclassification adjustment through other comprehensive income on disposal of the net investment.
Any goodwill arising on the acquisition of a foreign operation and any fair value adjustments to the carrying amounts of assets and liabilities arising on the acquisition of that foreign operation are treated as assets and liabilities of the foreign operation.
The cash flows of a foreign subsidiary are translated at the exchange rates between the functional currency and the foreign currency at the dates of the cash flows.
Related party transactions are those where a transfer of resources or obligations between related parties occur, regardless of whether or not a price is charged.
1.22 Borrowing costs Borrowing costs that are directly attributable to the acquisition, construction or production of a qualifying asset are capitalised as part of the cost of that asset until such time as the asset is ready for its intended use. The amount of borrowing costs eligible for capitalisation is determined as follows:
– actual borrowing costs on funds specifically borrowed for the purpose of obtaining a qualifying asset less any temporary investment of those borrowings; and
– weighted average of the borrowing costs applicable to the entity on funds generally borrowed for the purpose of obtaining a qualifying asset. The borrowing costs capitalised do not exceed the total borrowing costs incurred.
The capitalisation of borrowing costs begins when:
– expenditures for the asset have occurred;
– borrowing costs have been incurred; and
– activities that are necessary to prepare the asset for its intended use or sale are in progress.
MASTER DRILLING CONSOLIDATED ANNUAL FINANCIAL STATEMENTS 202034
ACCOUNTING POLICIES (CONTINUED)
Capitalisation is suspended during extended years in which active development is interrupted.
Capitalisation ceases when substantially all the activities necessary to prepare the qualifying asset for its intended use or sale are complete.
All other borrowing costs are recognised as an expense in the year in which they are incurred.
1.23 Share-based paymentsEligible employees of the Group receive remuneration in the form of share-based payments, whereby employees render services as consideration for equity instruments.
(a) Equity-settled transactions
The cost of equity-settled transactions is determined by the fair value at the date when the grant is made using an appropriate valuation model. That cost is recognised, together with a corresponding increase in other capital reserves in equity, over the year in which the performance and/or service conditions are fulfilled in employee benefits expense. The cumulative expense recognised for equity-settled transactions at each reporting date until the vesting date reflects the extent to which the vesting year has expired and the Group’s best estimate of the number of equity instruments that will ultimately vest.
The statement of profit or loss expense or credit for a year represents the movement in cumulative expense recognised as at the beginning and end of that year and is recognised in employee benefits expense. No expense is recognised for awards that do not ultimately vest, except for equity-settled transactions for which vesting is conditional upon a market or non-vesting condition. These are treated as vesting irrespective of whether or not the market or non-vesting condition is satisfied, provided that all other performance and/or service conditions are satisfied.
When the terms of an equity-settled award are modified, the minimum expense recognised is the expense had the terms not been modified, if the original terms of the award are met. An additional expense is recognised for any modification that increases the total fair value of the share-based payment transaction or is otherwise beneficial to the employee as measured at the date of modification. The dilutive effect of outstanding options is reflected as additional share dilution in the computation of diluted earnings per share.
1.22 Borrowing costs continued
35MASTER DRILLING CONSOLIDATED ANNUAL FINANCIAL STATEMENTS 2020
2. STANDARDS, AMENDMENTS AND INTERPRETATIONS TO EXISTING STANDARDS
2.1 Standards, amendments and interpretations adoptedThe significant accounting policies are consistent in all material respects with those applied in the previous year except for the list of amendments to IFRS that are mandatory and effective for the annual financial year ending 31 December 2020 as indicated below:
– IFRS 3 Business Combinations (“IFRS 3”);
– IFRS 16 Leases - Covid-19 Related rent concessions (“IFRS 16”)
– IAS 1 Presentation of financial statements (“IAS 1”)
– IAS 8 Accounting Policies, Changes in Accounting Estimates and Errors (“IAS 8”)
The directors have reviewed the above-mentioned mandatory standards and has applied these, where applicable, in the consolidated annual financial statements for the financial year ending 31 December 2020. None of the standards adopted had a material impact on the consolidated annual financial statements.
2.2 Standards, amendments and interpretations to existing standards that are not yet effective and have not been adopted early by the groupAt the date of authorisation of these annual financial statements, certain new standards, amendments and interpretations to existing standards have been published by the International Accounting Standards Board but are not yet effective, and have not been early adopted by the Group. Management anticipates that all of the relevant pronouncements will be adopted in the Group’s accounting policies for the first year beginning after the effective date of the pronouncement. Information on new standards, amendments and interpretations that are expected to be relevant to the Group’s annual financial statements is provided below.
2.2.1 IAS 16 Property, Plant and Equipment Amendments were made to proceeds before intended use.
IAS 16 is effective from periods beginning on or after 1 January 2022.
The directors have assessed the impact of the new standards, they believe the new standards will not have a material impact on the Group’s financial statements.
2.2.2 IFRS 10 Consolidated financial statementsAmendments were made to the sale or contribution of assets between an investor and its associate or joint venture.
IFRS 10’s effective date has been deferred indefinitely until further notice.
The directors have assessed the impact of the new standards, they believe the new standards will not have a material impact on the Group’s financial statements.
2.2.3 IAS 1 Presentation of financial statementsAmendments were made to the classification of liabilities as current or non-current.
IAS 1 is effective from periods beginning on or after 1 January 2023.
The directors have assessed the impact of the new standards, they believe the new standards will not have a material impact on the Group’s financial statements.
MASTER DRILLING CONSOLIDATED ANNUAL FINANCIAL STATEMENTS 202036
ACCOUNTING POLICIES (CONTINUED)
2.2.4 IAS 28 Investments in associated and joint ventures IAS 28’s effective date has been deferred indefinitely until further notice.
The directors have assessed the impact of the new standards, they believe the new standards will not have a material impact on the Group’s financial statements.
2.2.5 IAS 37 Provisions, contingent liabilities and contingent assets Amendments were made to the cost of fulfilling an onerous contract.
IAS 37 is effective from periods beginning on or after 1 January 2022.
The directors have assessed the impact of the new standards, they believe the new standards will not have a material impact on the Group’s financial statements.
2. STANDARDS, AMENDMENTS AND INTERPRETATIONS TO EXISTING STANDARDS continued
2.3 Standards, amendments and interpretations to existing standards that are not yet effective and have not been adopted early by the group continued
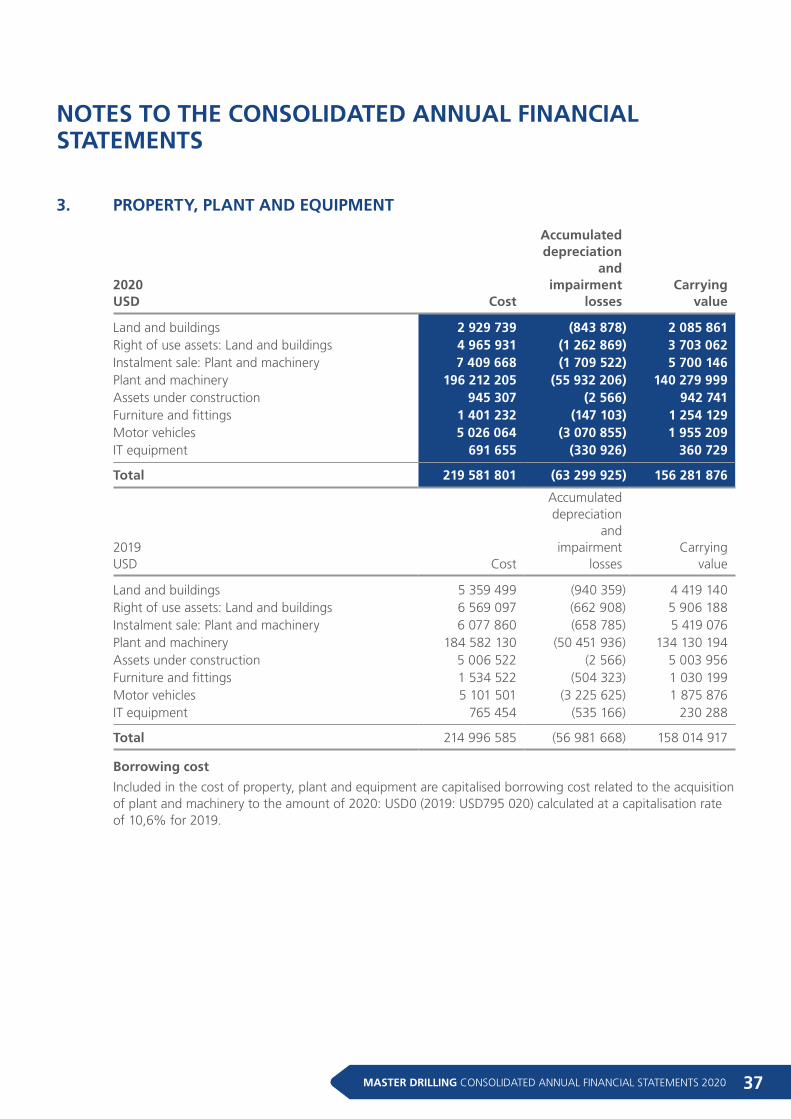
37MASTER DRILLING CONSOLIDATED ANNUAL FINANCIAL STATEMENTS 2020
NOTES TO THE CONSOLIDATED ANNUAL FINANCIAL STATEMENTS
3. PROPERTY, PLANT AND EQUIPMENT
2020USD Cost
Accumulated depreciation
and impairment
lossesCarrying
value
Land and buildings 2 929 739 (843 878) 2 085 861Right of use assets: Land and buildings 4 965 931 (1 262 869) 3 703 062Instalment sale: Plant and machinery 7 409 668 (1 709 522) 5 700 146Plant and machinery 196 212 205 (55 932 206) 140 279 999Assets under construction 945 307 (2 566) 942 741Furniture and fittings 1 401 232 (147 103) 1 254 129Motor vehicles 5 026 064 (3 070 855) 1 955 209IT equipment 691 655 (330 926) 360 729
Total 219 581 801 (63 299 925) 156 281 876
2019USD Cost
Accumulated depreciation
and impairment
lossesCarrying
value
Land and buildings 5 359 499 (940 359) 4 419 140Right of use assets: Land and buildings 6 569 097 (662 908) 5 906 188Instalment sale: Plant and machinery 6 077 860 (658 785) 5 419 076Plant and machinery 184 582 130 (50 451 936) 134 130 194Assets under construction 5 006 522 (2 566) 5 003 956Furniture and fittings 1 534 522 (504 323) 1 030 199Motor vehicles 5 101 501 (3 225 625) 1 875 876IT equipment 765 454 (535 166) 230 288
Total 214 996 585 (56 981 668) 158 014 917
Borrowing cost
Included in the cost of property, plant and equipment are capitalised borrowing cost related to the acquisition of plant and machinery to the amount of 2020: USD0 (2019: USD795 020) calculated at a capitalisation rate of 10,6% for 2019.
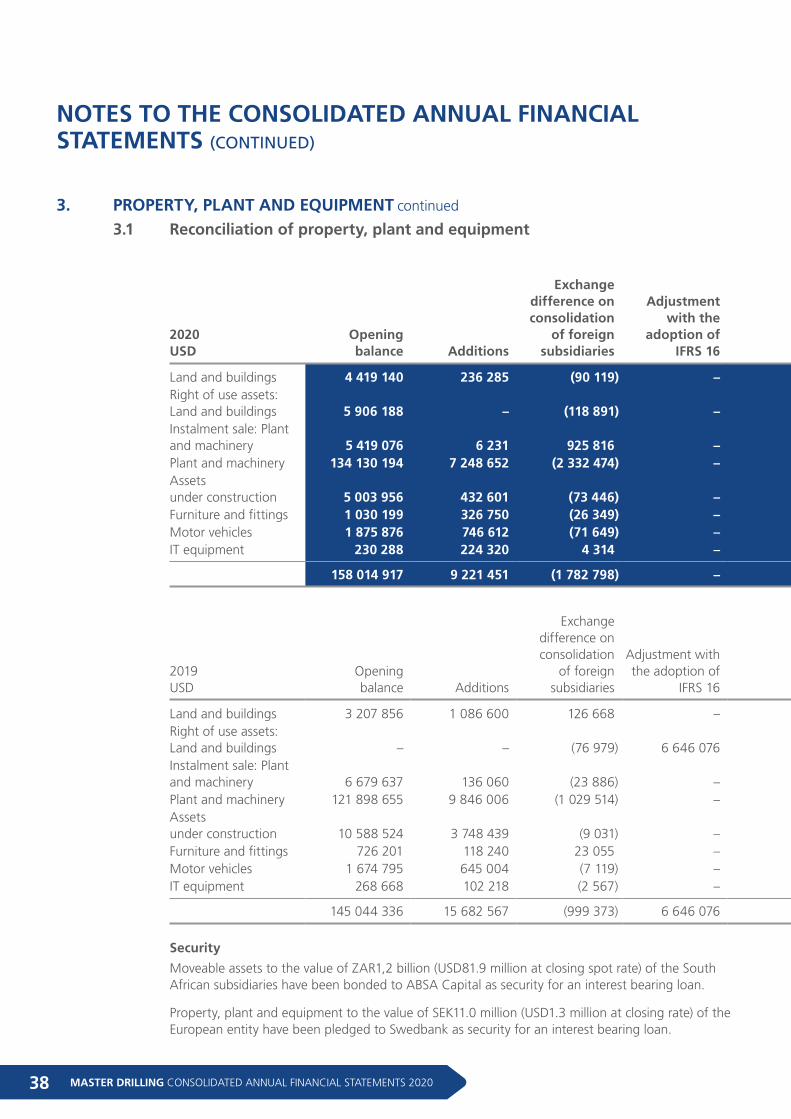
MASTER DRILLING CONSOLIDATED ANNUAL FINANCIAL STATEMENTS 202038
NOTES TO THE CONSOLIDATED ANNUAL FINANCIAL STATEMENTS (CONTINUED)
3.1 Reconciliation of property, plant and equipment
2020USD
Opening balance Additions
Exchange difference onconsolidation
of foreignsubsidiaries
Adjustment with the
adoption of IFRS 16
Assets acquiredthroughbusiness
combination
Reclassificationsand transfers
(to)/from inventory/assets
held for sale/derecognition of
assets Disposals DepreciationImpairment of
assets Total
Land and buildings 4 419 140 236 285 (90 119) – – (2 381 810) (94 801) (2 834) – 2 085 861Right of use assets: Land and buildings 5 906 188 – (118 891) – – (1 484 275) – (599 960) – 3 703 062Instalment sale: Plant and machinery 5 419 076 6 231 925 816 – – – (26 681) (624 296) – 5 700 146Plant and machinery 134 130 194 7 248 652 (2 332 474) – 1 414 730 7 970 401 (662 945) (7 488 559) – 140 279 999Assets under construction 5 003 956 432 601 (73 446) – – (4 370 906) (49 464) – – 942 741Furniture and fittings 1 030 199 326 750 (26 349) – – – (47 875) (28 596) – 1 254 129Motor vehicles 1 875 876 746 612 (71 649) – – – (103 745) (491 885) – 1 955 209IT equipment 230 288 224 320 4 314 – – – (28 323) (69 870) – 360 729
158 014 917 9 221 451 (1 782 798) – 1 414 730 (266 590) (1 013 834) (9 306 000) – 156 281 876
2019USD
Opening balance Additions
Exchange difference onconsolidation
of foreignsubsidiaries
Adjustment with the adoption of
IFRS 16
Assets acquiredthroughbusiness
combination
Reclassificationsand transfers (to)/
from inventory/assets held for sale/
derecognition of assets Disposals Depreciation
Impairment of assets Total
Land and buildings 3 207 856 1 086 600 126 668 – – – – (1 984) – 4 419 140Right of use assets: Land and buildings – – (76 979) 6 646 076 – – – (662 908) – 5 906 189Instalment sale: Plant and machinery 6 679 637 136 060 (23 886) – – (870 532) (12 727) (489 477) – 5 419 075Plant and machinery 121 898 655 9 846 006 (1 029 514) – – 9 627 047 (359 302) (5 514 728) (337 970) 134 130 194Assets under construction 10 588 524 3 748 439 (9 031) – – (9 323 976) – – – 5 003 956Furniture and fittings 726 201 118 240 23 055 – – 212 261 (12 038) (37 520) – 1 030 199Motor vehicles 1 674 795 645 004 (7 119) – – 559 104 (511 290) (484 618) – 1 875 876IT equipment 268 668 102 218 (2 567) – – (978) (36 845) (100 208) – 230 288
145 044 336 15 682 567 (999 373) 6 646 076 – 202 926 (932 202) (7 291 443) (337 970) 158 014 917
Security
Moveable assets to the value of ZAR1,2 billion (USD81.9 million at closing spot rate) of the South African subsidiaries have been bonded to ABSA Capital as security for an interest bearing loan.
Property, plant and equipment to the value of SEK11.0 million (USD1.3 million at closing rate) of the European entity have been pledged to Swedbank as security for an interest bearing loan.
3. PROPERTY, PLANT AND EQUIPMENT continued
Impairment
During 2019, throughout the Group, plant and machinery were impaired during the current financial period. The future cash flows of these specific rigs were negatively affected by the current declining demand for the smaller class machinery.
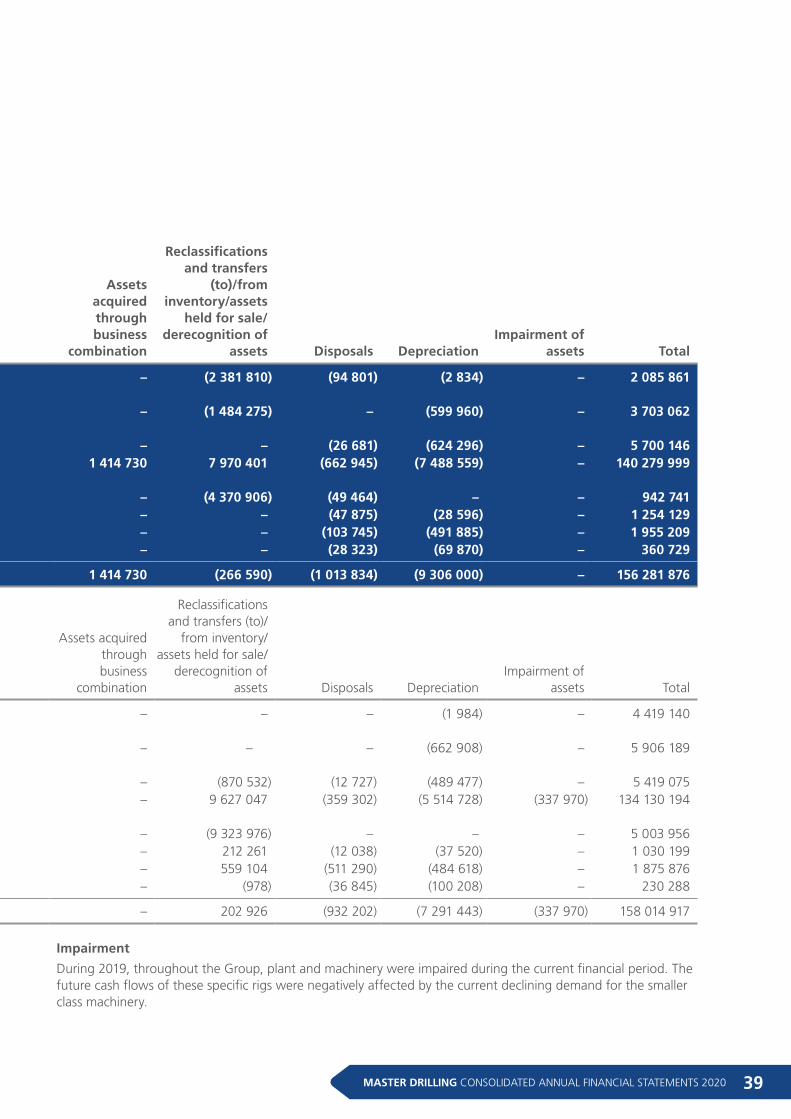
39MASTER DRILLING CONSOLIDATED ANNUAL FINANCIAL STATEMENTS 2020
3.1 Reconciliation of property, plant and equipment
2020USD
Opening balance Additions
Exchange difference onconsolidation
of foreignsubsidiaries
Adjustment with the
adoption of IFRS 16
Assets acquiredthroughbusiness
combination
Reclassificationsand transfers
(to)/from inventory/assets
held for sale/derecognition of
assets Disposals DepreciationImpairment of
assets Total
Land and buildings 4 419 140 236 285 (90 119) – – (2 381 810) (94 801) (2 834) – 2 085 861Right of use assets: Land and buildings 5 906 188 – (118 891) – – (1 484 275) – (599 960) – 3 703 062Instalment sale: Plant and machinery 5 419 076 6 231 925 816 – – – (26 681) (624 296) – 5 700 146Plant and machinery 134 130 194 7 248 652 (2 332 474) – 1 414 730 7 970 401 (662 945) (7 488 559) – 140 279 999Assets under construction 5 003 956 432 601 (73 446) – – (4 370 906) (49 464) – – 942 741Furniture and fittings 1 030 199 326 750 (26 349) – – – (47 875) (28 596) – 1 254 129Motor vehicles 1 875 876 746 612 (71 649) – – – (103 745) (491 885) – 1 955 209IT equipment 230 288 224 320 4 314 – – – (28 323) (69 870) – 360 729
158 014 917 9 221 451 (1 782 798) – 1 414 730 (266 590) (1 013 834) (9 306 000) – 156 281 876
2019USD
Opening balance Additions
Exchange difference onconsolidation
of foreignsubsidiaries
Adjustment with the adoption of
IFRS 16
Assets acquiredthroughbusiness
combination
Reclassificationsand transfers (to)/
from inventory/assets held for sale/
derecognition of assets Disposals Depreciation
Impairment of assets Total
Land and buildings 3 207 856 1 086 600 126 668 – – – – (1 984) – 4 419 140Right of use assets: Land and buildings – – (76 979) 6 646 076 – – – (662 908) – 5 906 189Instalment sale: Plant and machinery 6 679 637 136 060 (23 886) – – (870 532) (12 727) (489 477) – 5 419 075Plant and machinery 121 898 655 9 846 006 (1 029 514) – – 9 627 047 (359 302) (5 514 728) (337 970) 134 130 194Assets under construction 10 588 524 3 748 439 (9 031) – – (9 323 976) – – – 5 003 956Furniture and fittings 726 201 118 240 23 055 – – 212 261 (12 038) (37 520) – 1 030 199Motor vehicles 1 674 795 645 004 (7 119) – – 559 104 (511 290) (484 618) – 1 875 876IT equipment 268 668 102 218 (2 567) – – (978) (36 845) (100 208) – 230 288
145 044 336 15 682 567 (999 373) 6 646 076 – 202 926 (932 202) (7 291 443) (337 970) 158 014 917
Security
Moveable assets to the value of ZAR1,2 billion (USD81.9 million at closing spot rate) of the South African subsidiaries have been bonded to ABSA Capital as security for an interest bearing loan.
Property, plant and equipment to the value of SEK11.0 million (USD1.3 million at closing rate) of the European entity have been pledged to Swedbank as security for an interest bearing loan.
Impairment
During 2019, throughout the Group, plant and machinery were impaired during the current financial period. The future cash flows of these specific rigs were negatively affected by the current declining demand for the smaller class machinery.
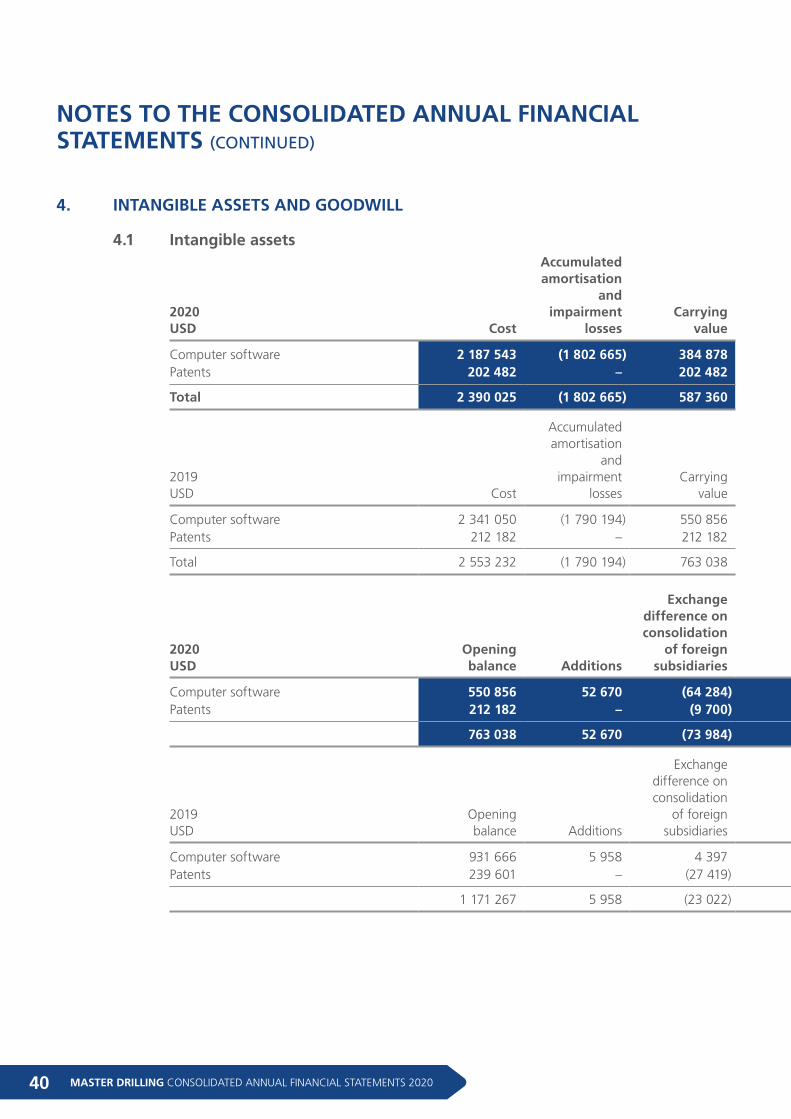
MASTER DRILLING CONSOLIDATED ANNUAL FINANCIAL STATEMENTS 202040
NOTES TO THE CONSOLIDATED ANNUAL FINANCIAL STATEMENTS (CONTINUED)
4. INTANGIBLE ASSETS AND GOODWILL
4.1 Intangible assets
2020USD Cost
Accumulated amortisation
and impairment
lossesCarrying
value
Computer software 2 187 543 (1 802 665) 384 878Patents 202 482 – 202 482
Total 2 390 025 (1 802 665) 587 360
2019USD Cost
Accumulated amortisation
and impairment
lossesCarrying
value
Computer software 2 341 050 (1 790 194) 550 856Patents 212 182 – 212 182
Total 2 553 232 (1 790 194) 763 038
2020USD
Opening balance Additions
Exchange difference onconsolidation
of foreignsubsidiaries
Assets acquiredthroughbusiness
combination
Reclassificationsand transfers
(to)/from inventory/assets
held for sale Disposals Amortisation
Impairment of intangible
assets Total
Computer software 550 856 52 670 (64 284) – – – (154 364) – 384 878Patents 212 182 – (9 700) – – – – – 202 482
763 038 52 670 (73 984) – – – (154 364) – 587 360
2019USD
Opening balance Additions
Exchange difference onconsolidation
of foreignsubsidiaries
Assets acquiredthroughbusiness
combination
Reclassificationsand transfers (to)/
from inventory/assets held for sale Disposals Amortisation
Impairment of intangible assets Total
Computer software 931 666 5 958 4 397 – (206 070) – (138 347) (46 748) 550 856Patents 239 601 – (27 419) – – – – – 212 182
1 171 267 5 958 (23 022) – (206 070) – (138 347) (46 748) 763 038
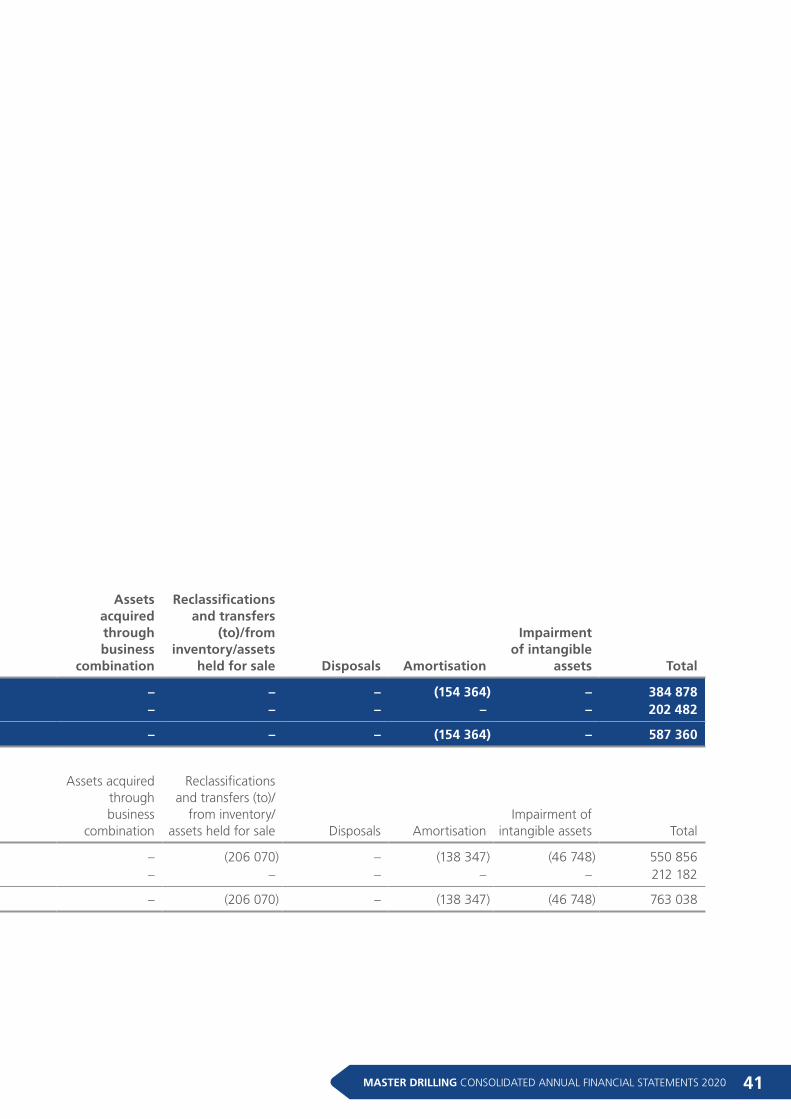
41MASTER DRILLING CONSOLIDATED ANNUAL FINANCIAL STATEMENTS 2020
4. INTANGIBLE ASSETS AND GOODWILL
4.1 Intangible assets
2020USD Cost
Accumulated amortisation
and impairment
lossesCarrying
value
Computer software 2 187 543 (1 802 665) 384 878Patents 202 482 – 202 482
Total 2 390 025 (1 802 665) 587 360
2019USD Cost
Accumulated amortisation
and impairment
lossesCarrying
value
Computer software 2 341 050 (1 790 194) 550 856Patents 212 182 – 212 182
Total 2 553 232 (1 790 194) 763 038
2020USD
Opening balance Additions
Exchange difference onconsolidation
of foreignsubsidiaries
Assets acquiredthroughbusiness
combination
Reclassificationsand transfers
(to)/from inventory/assets
held for sale Disposals Amortisation
Impairment of intangible
assets Total
Computer software 550 856 52 670 (64 284) – – – (154 364) – 384 878Patents 212 182 – (9 700) – – – – – 202 482
763 038 52 670 (73 984) – – – (154 364) – 587 360
2019USD
Opening balance Additions
Exchange difference onconsolidation
of foreignsubsidiaries
Assets acquiredthroughbusiness
combination
Reclassificationsand transfers (to)/
from inventory/assets held for sale Disposals Amortisation
Impairment of intangible assets Total
Computer software 931 666 5 958 4 397 – (206 070) – (138 347) (46 748) 550 856Patents 239 601 – (27 419) – – – – – 212 182
1 171 267 5 958 (23 022) – (206 070) – (138 347) (46 748) 763 038
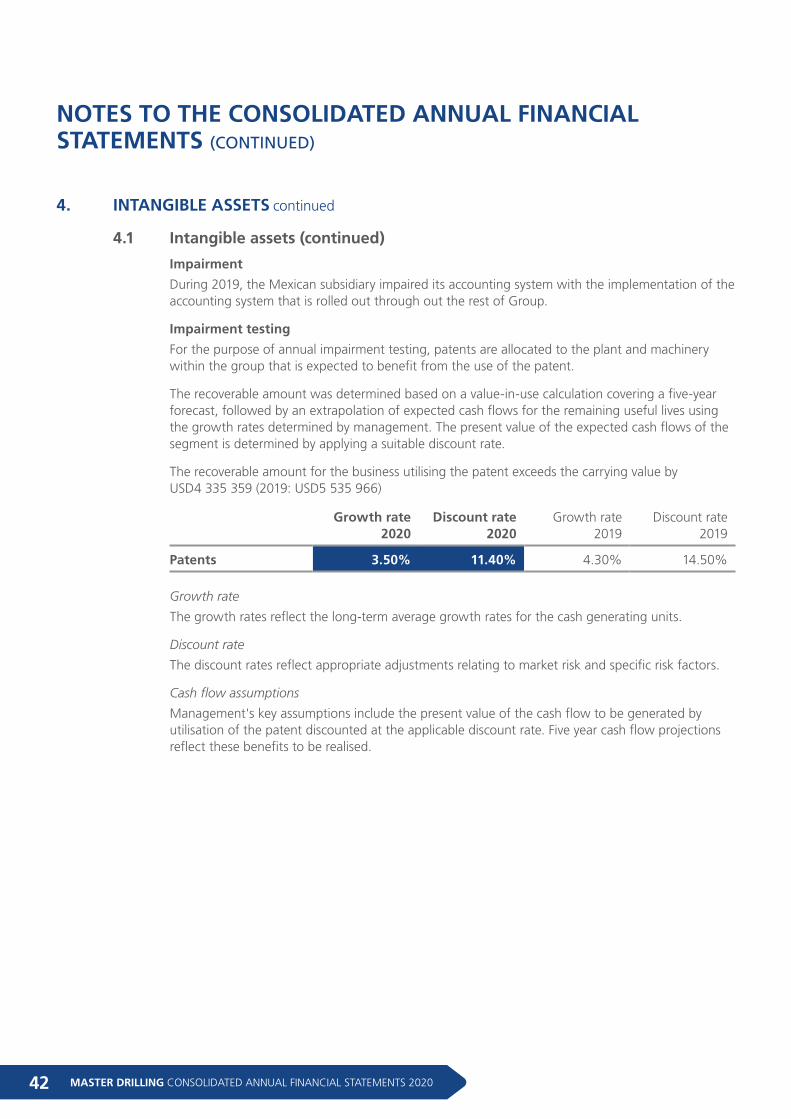
MASTER DRILLING CONSOLIDATED ANNUAL FINANCIAL STATEMENTS 202042
NOTES TO THE CONSOLIDATED ANNUAL FINANCIAL STATEMENTS (CONTINUED)
Impairment
During 2019, the Mexican subsidiary impaired its accounting system with the implementation of the accounting system that is rolled out through out the rest of Group.
Impairment testing
For the purpose of annual impairment testing, patents are allocated to the plant and machinery within the group that is expected to benefit from the use of the patent.
The recoverable amount was determined based on a value-in-use calculation covering a five-year forecast, followed by an extrapolation of expected cash flows for the remaining useful lives using the growth rates determined by management. The present value of the expected cash flows of the segment is determined by applying a suitable discount rate.
The recoverable amount for the business utilising the patent exceeds the carrying value by USD4 335 359 (2019: USD5 535 966)
Growth rate2020
Discount rate2020
Growth rate2019
Discount rate2019
Patents 3.50% 11.40% 4.30% 14.50%
Growth rate
The growth rates reflect the long-term average growth rates for the cash generating units.
Discount rate
The discount rates reflect appropriate adjustments relating to market risk and specific risk factors.
Cash flow assumptions
Management's key assumptions include the present value of the cash flow to be generated by utilisation of the patent discounted at the applicable discount rate. Five year cash flow projections reflect these benefits to be realised.
4. INTANGIBLE ASSETS continued
4.1 Intangible assets (continued)
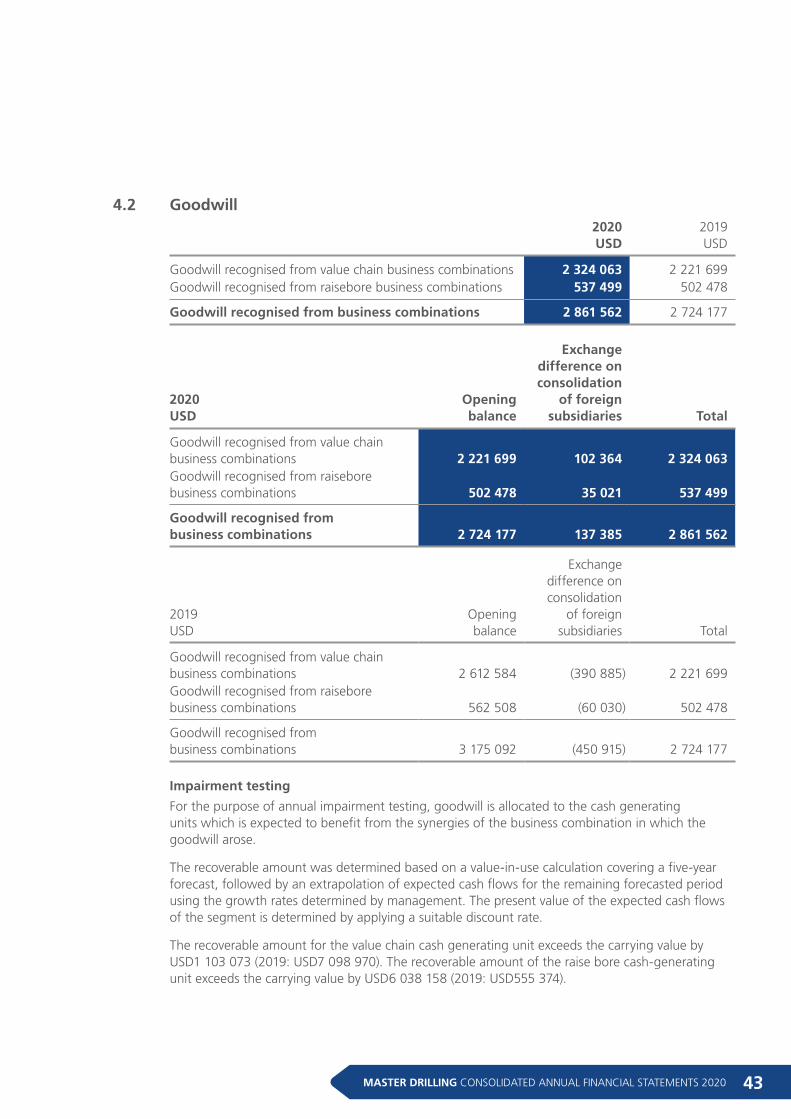
43MASTER DRILLING CONSOLIDATED ANNUAL FINANCIAL STATEMENTS 2020
4.2 Goodwill
2020USD
2019USD
Goodwill recognised from value chain business combinations 2 324 063 2 221 699Goodwill recognised from raisebore business combinations 537 499 502 478
Goodwill recognised from business combinations 2 861 562 2 724 177
2020USD
Opening balance
Exchange difference onconsolidation
of foreignsubsidiaries Total
Goodwill recognised from value chain business combinations 2 221 699 102 364 2 324 063Goodwill recognised from raisebore business combinations 502 478 35 021 537 499
Goodwill recognised from business combinations 2 724 177 137 385 2 861 562
2019USD
Opening balance
Exchange difference onconsolidation
of foreignsubsidiaries Total
Goodwill recognised from value chain business combinations 2 612 584 (390 885) 2 221 699Goodwill recognised from raisebore business combinations 562 508 (60 030) 502 478
Goodwill recognised from business combinations 3 175 092 (450 915) 2 724 177
Impairment testing
For the purpose of annual impairment testing, goodwill is allocated to the cash generating units which is expected to benefit from the synergies of the business combination in which the goodwill arose.
The recoverable amount was determined based on a value-in-use calculation covering a five-year forecast, followed by an extrapolation of expected cash flows for the remaining forecasted period using the growth rates determined by management. The present value of the expected cash flows of the segment is determined by applying a suitable discount rate.
The recoverable amount for the value chain cash generating unit exceeds the carrying value by USD1 103 073 (2019: USD7 098 970). The recoverable amount of the raise bore cash-generating unit exceeds the carrying value by USD6 038 158 (2019: USD555 374).
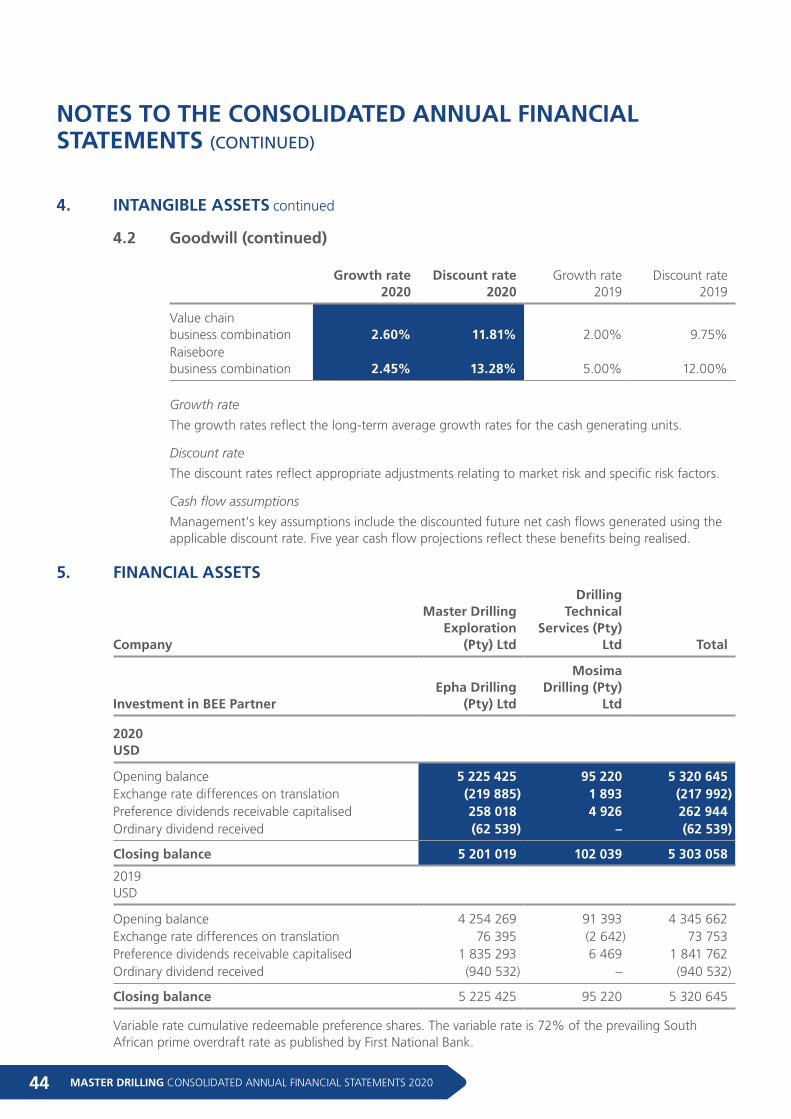
MASTER DRILLING CONSOLIDATED ANNUAL FINANCIAL STATEMENTS 202044
NOTES TO THE CONSOLIDATED ANNUAL FINANCIAL STATEMENTS (CONTINUED)
Growth rate
2020Discount rate
2020Growth rate
2019Discount rate
2019
Value chain business combination 2.60% 11.81% 2.00% 9.75%Raisebore business combination 2.45% 13.28% 5.00% 12.00%
Growth rate
The growth rates reflect the long-term average growth rates for the cash generating units.
Discount rate
The discount rates reflect appropriate adjustments relating to market risk and specific risk factors.
Cash flow assumptions
Management's key assumptions include the discounted future net cash flows generated using the applicable discount rate. Five year cash flow projections reflect these benefits being realised.
5. FINANCIAL ASSETS
Company
Master Drilling Exploration
(Pty) Ltd
Drilling Technical
Services (Pty) Ltd Total
Investment in BEE PartnerEpha Drilling
(Pty) Ltd
Mosima Drilling (Pty)
Ltd
2020USD
Opening balance 5 225 425 95 220 5 320 645Exchange rate differences on translation (219 885) 1 893 (217 992)Preference dividends receivable capitalised 258 018 4 926 262 944Ordinary dividend received (62 539) – (62 539)
Closing balance 5 201 019 102 039 5 303 058
2019USD
Opening balance 4 254 269 91 393 4 345 662Exchange rate differences on translation 76 395 (2 642) 73 753Preference dividends receivable capitalised 1 835 293 6 469 1 841 762Ordinary dividend received (940 532) – (940 532)
Closing balance 5 225 425 95 220 5 320 645
Variable rate cumulative redeemable preference shares. The variable rate is 72% of the prevailing South African prime overdraft rate as published by First National Bank.
4. INTANGIBLE ASSETS continued
4.2 Goodwill (continued)
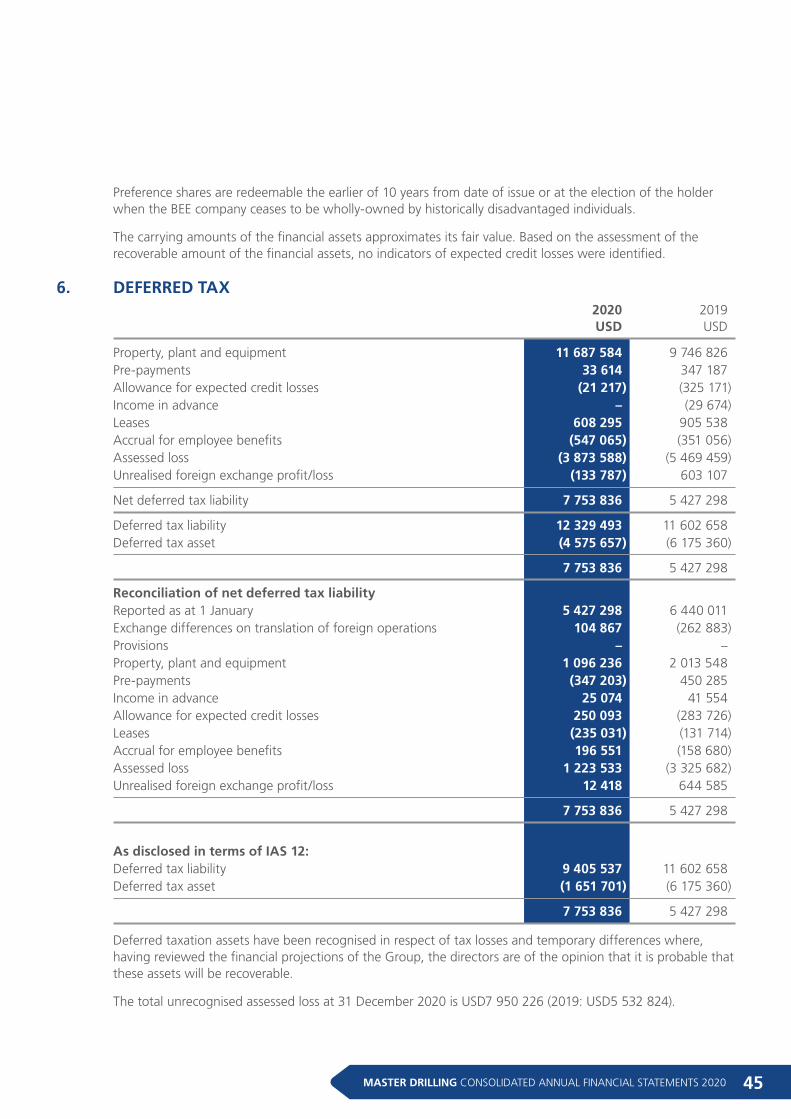
45MASTER DRILLING CONSOLIDATED ANNUAL FINANCIAL STATEMENTS 2020
Preference shares are redeemable the earlier of 10 years from date of issue or at the election of the holder when the BEE company ceases to be wholly-owned by historically disadvantaged individuals.
The carrying amounts of the financial assets approximates its fair value. Based on the assessment of the recoverable amount of the financial assets, no indicators of expected credit losses were identified.
6. DEFERRED TAX
2020USD
2019USD
Property, plant and equipment 11 687 584 9 746 826Pre-payments 33 614 347 187Allowance for expected credit losses (21 217) (325 171)Income in advance – (29 674)Leases 608 295 905 538Accrual for employee benefits (547 065) (351 056)Assessed loss (3 873 588) (5 469 459)Unrealised foreign exchange profit/loss (133 787) 603 107
Net deferred tax liability 7 753 836 5 427 298
Deferred tax liability 12 329 493 11 602 658Deferred tax asset (4 575 657) (6 175 360)
7 753 836 5 427 298
Reconciliation of net deferred tax liability Reported as at 1 January 5 427 298 6 440 011Exchange differences on translation of foreign operations 104 867 (262 883)Provisions – –Property, plant and equipment 1 096 236 2 013 548Pre-payments (347 203) 450 285Income in advance 25 074 41 554Allowance for expected credit losses 250 093 (283 726)Leases (235 031) (131 714)Accrual for employee benefits 196 551 (158 680)Assessed loss 1 223 533 (3 325 682)Unrealised foreign exchange profit/loss 12 418 644 585
7 753 836 5 427 298
As disclosed in terms of IAS 12: Deferred tax liability 9 405 537 11 602 658Deferred tax asset (1 651 701) (6 175 360)
7 753 836 5 427 298
Deferred taxation assets have been recognised in respect of tax losses and temporary differences where, having reviewed the financial projections of the Group, the directors are of the opinion that it is probable that these assets will be recoverable.
The total unrecognised assessed loss at 31 December 2020 is USD7 950 226 (2019: USD5 532 824).
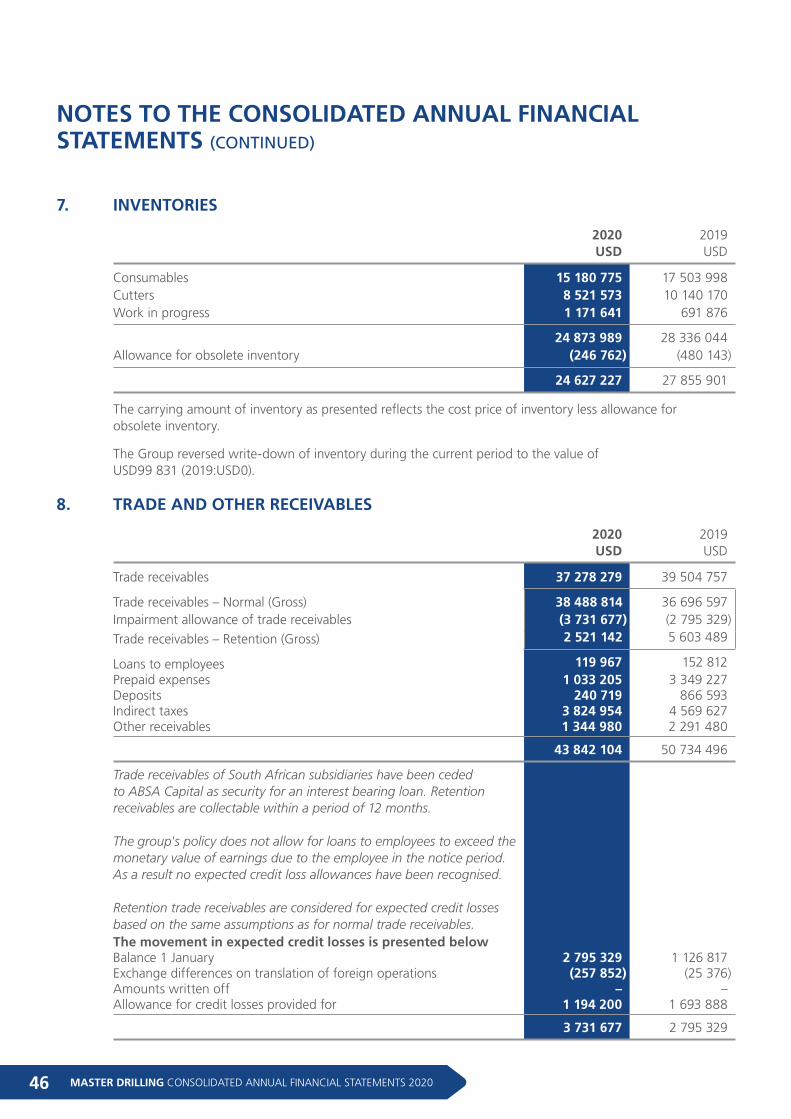
MASTER DRILLING CONSOLIDATED ANNUAL FINANCIAL STATEMENTS 202046
NOTES TO THE CONSOLIDATED ANNUAL FINANCIAL STATEMENTS (CONTINUED)
7. INVENTORIES
2020USD
2019USD
Consumables 15 180 775 17 503 998Cutters 8 521 573 10 140 170Work in progress 1 171 641 691 876
24 873 989 28 336 044Allowance for obsolete inventory (246 762) (480 143)
24 627 227 27 855 901
The carrying amount of inventory as presented reflects the cost price of inventory less allowance for obsolete inventory.
The Group reversed write-down of inventory during the current period to the value of USD99 831 (2019:USD0).
8. TRADE AND OTHER RECEIVABLES
2020USD
2019USD
Trade receivables 37 278 279 39 504 757
Trade receivables – Normal (Gross) 38 488 814 36 696 597Impairment allowance of trade receivables (3 731 677) (2 795 329)
Trade receivables – Retention (Gross) 2 521 142 5 603 489
Loans to employees 119 967 152 812Prepaid expenses 1 033 205 3 349 227Deposits 240 719 866 593Indirect taxes 3 824 954 4 569 627Other receivables 1 344 980 2 291 480
43 842 104 50 734 496
Trade receivables of South African subsidiaries have been ceded to ABSA Capital as security for an interest bearing loan. Retention receivables are collectable within a period of 12 months.
The group's policy does not allow for loans to employees to exceed the monetary value of earnings due to the employee in the notice period. As a result no expected credit loss allowances have been recognised.
Retention trade receivables are considered for expected credit losses based on the same assumptions as for normal trade receivables. The movement in expected credit losses is presented below Balance 1 January 2 795 329 1 126 817Exchange differences on translation of foreign operations (257 852) (25 376)Amounts written off – –Allowance for credit losses provided for 1 194 200 1 693 888
3 731 677 2 795 329
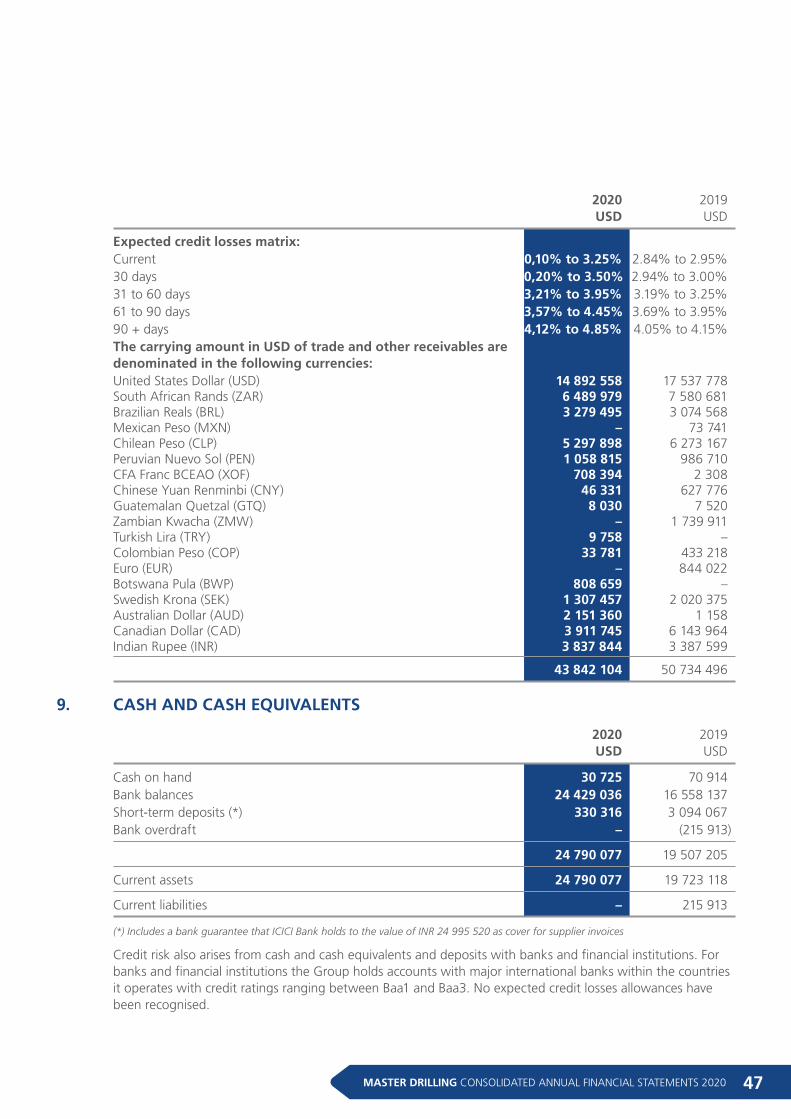
47MASTER DRILLING CONSOLIDATED ANNUAL FINANCIAL STATEMENTS 2020
2020USD
2019USD
Expected credit losses matrix:
Current 0,10% to 3.25% 2.84% to 2.95%30 days 0,20% to 3.50% 2.94% to 3.00%31 to 60 days 3,21% to 3.95% 3.19% to 3.25%61 to 90 days 3,57% to 4.45% 3.69% to 3.95%90 + days 4,12% to 4.85% 4.05% to 4.15%The carrying amount in USD of trade and other receivables are denominated in the following currencies: United States Dollar (USD) 14 892 558 17 537 778South African Rands (ZAR) 6 489 979 7 580 681Brazilian Reals (BRL) 3 279 495 3 074 568Mexican Peso (MXN) – 73 741Chilean Peso (CLP) 5 297 898 6 273 167Peruvian Nuevo Sol (PEN) 1 058 815 986 710CFA Franc BCEAO (XOF) 708 394 2 308Chinese Yuan Renminbi (CNY) 46 331 627 776Guatemalan Quetzal (GTQ) 8 030 7 520Zambian Kwacha (ZMW) – 1 739 911Turkish Lira (TRY) 9 758 –Colombian Peso (COP) 33 781 433 218Euro (EUR) – 844 022Botswana Pula (BWP) 808 659 –Swedish Krona (SEK) 1 307 457 2 020 375Australian Dollar (AUD) 2 151 360 1 158Canadian Dollar (CAD) 3 911 745 6 143 964Indian Rupee (INR) 3 837 844 3 387 599
43 842 104 50 734 496
9. CASH AND CASH EQUIVALENTS
2020USD
2019USD
Cash on hand 30 725 70 914Bank balances 24 429 036 16 558 137Short-term deposits (*) 330 316 3 094 067Bank overdraft – (215 913)
24 790 077 19 507 205
Current assets 24 790 077 19 723 118
Current liabilities – 215 913
(*) Includes a bank guarantee that ICICI Bank holds to the value of INR 24 995 520 as cover for supplier invoices
Credit risk also arises from cash and cash equivalents and deposits with banks and financial institutions. For banks and financial institutions the Group holds accounts with major international banks within the countries it operates with credit ratings ranging between Baa1 and Baa3. No expected credit losses allowances have been recognised.
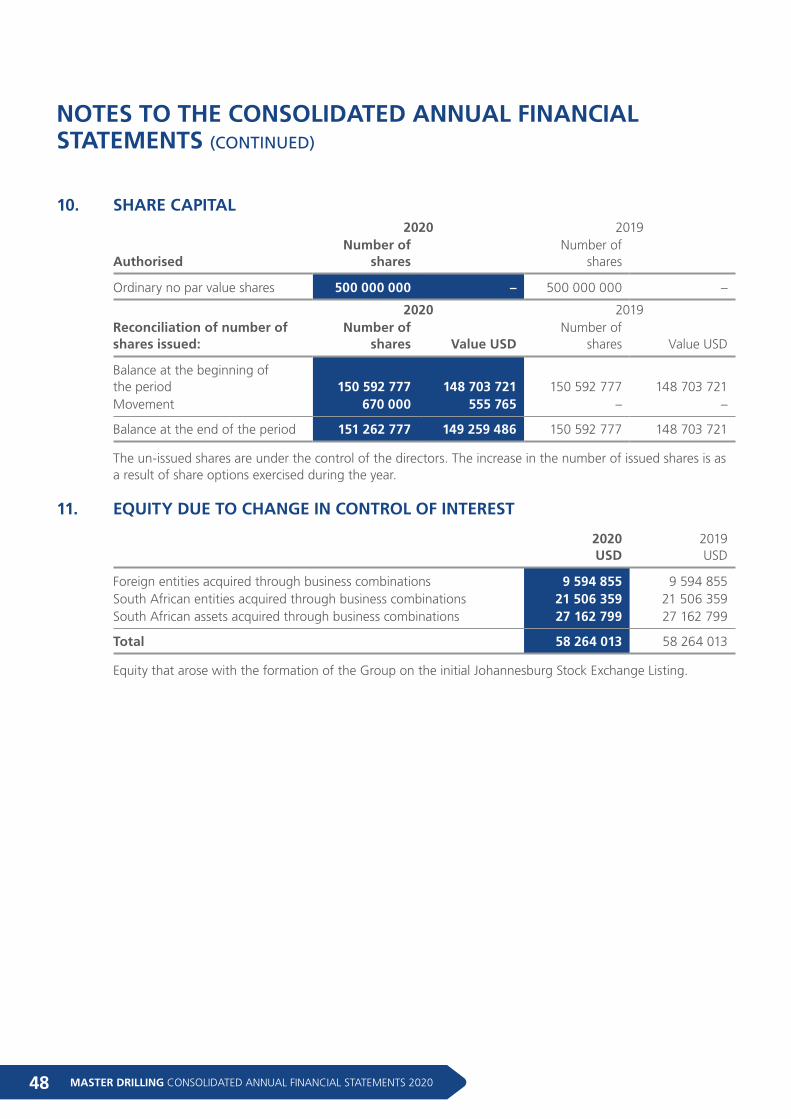
MASTER DRILLING CONSOLIDATED ANNUAL FINANCIAL STATEMENTS 202048
NOTES TO THE CONSOLIDATED ANNUAL FINANCIAL STATEMENTS (CONTINUED)
10. SHARE CAPITAL 2020 2019
AuthorisedNumber of
shares Number of
shares
Ordinary no par value shares 500 000 000 – 500 000 000 –
2020 2019Reconciliation of number of shares issued:
Number of shares Value USD
Number of shares Value USD
Balance at the beginning of the period 150 592 777 148 703 721 150 592 777 148 703 721Movement 670 000 555 765 – –
Balance at the end of the period 151 262 777 149 259 486 150 592 777 148 703 721
The un-issued shares are under the control of the directors. The increase in the number of issued shares is as a result of share options exercised during the year.
11. EQUITY DUE TO CHANGE IN CONTROL OF INTEREST
2020USD
2019USD
Foreign entities acquired through business combinations 9 594 855 9 594 855South African entities acquired through business combinations 21 506 359 21 506 359South African assets acquired through business combinations 27 162 799 27 162 799
Total 58 264 013 58 264 013
Equity that arose with the formation of the Group on the initial Johannesburg Stock Exchange Listing.
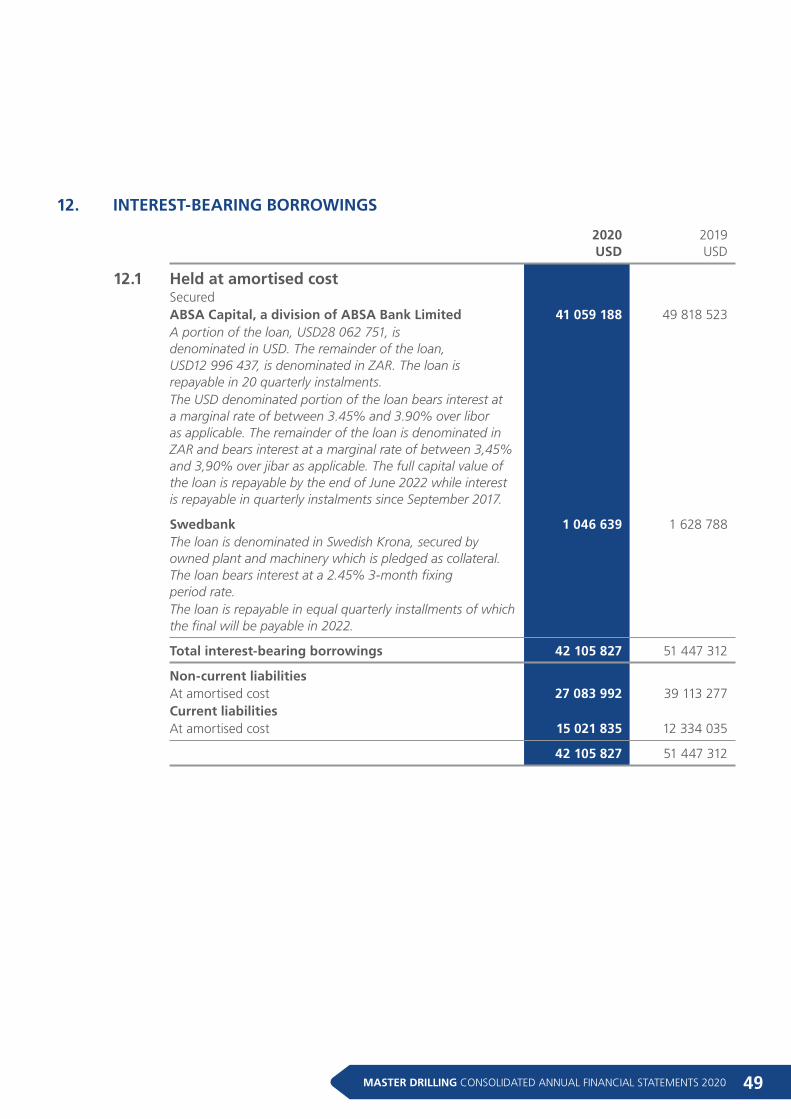
49MASTER DRILLING CONSOLIDATED ANNUAL FINANCIAL STATEMENTS 2020
12. INTEREST-BEARING BORROWINGS
2020USD
2019USD
12.1 Held at amortised cost Secured ABSA Capital, a division of ABSA Bank Limited 41 059 188 49 818 523
A portion of the loan, USD28 062 751, is denominated in USD. The remainder of the loan, USD12 996 437, is denominated in ZAR. The loan is repayable in 20 quarterly instalments.
The USD denominated portion of the loan bears interest at a marginal rate of between 3.45% and 3.90% over libor as applicable. The remainder of the loan is denominated in ZAR and bears interest at a marginal rate of between 3,45% and 3,90% over jibar as applicable. The full capital value of the loan is repayable by the end of June 2022 while interest is repayable in quarterly instalments since September 2017.
Swedbank 1 046 639 1 628 788
The loan is denominated in Swedish Krona, secured by owned plant and machinery which is pledged as collateral. The loan bears interest at a 2.45% 3-month fixing period rate.
The loan is repayable in equal quarterly installments of which the final will be payable in 2022.
Total interest-bearing borrowings 42 105 827 51 447 312
Non-current liabilities At amortised cost 27 083 992 39 113 277 Current liabilities At amortised cost 15 021 835 12 334 035
42 105 827 51 447 312
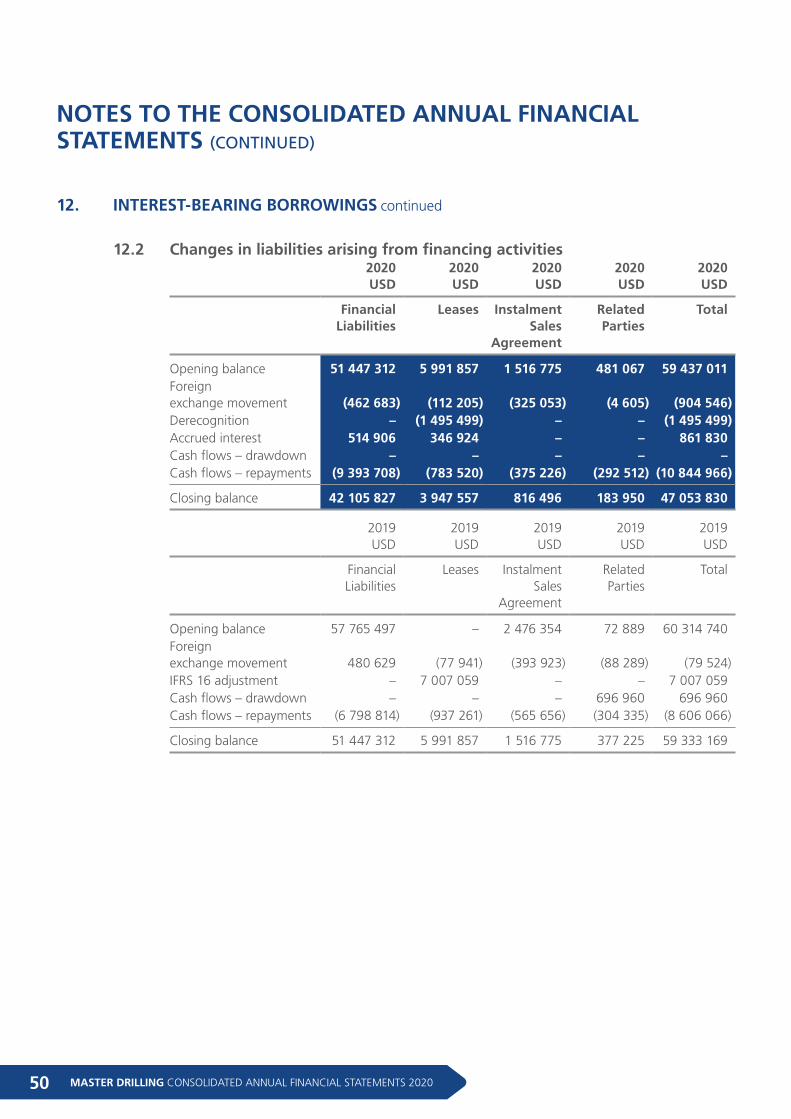
MASTER DRILLING CONSOLIDATED ANNUAL FINANCIAL STATEMENTS 202050
NOTES TO THE CONSOLIDATED ANNUAL FINANCIAL STATEMENTS (CONTINUED)
12.2 Changes in liabilities arising from financing activities
2020USD
2020USD
2020USD
2020USD
2020USD
Financial Liabilities
Leases Instalment Sales
Agreement
Related Parties
Total
Opening balance 51 447 312 5 991 857 1 516 775 481 067 59 437 011Foreign exchange movement (462 683) (112 205) (325 053) (4 605) (904 546)Derecognition – (1 495 499) – – (1 495 499)Accrued interest 514 906 346 924 – – 861 830Cash flows – drawdown – – – – –Cash flows – repayments (9 393 708) (783 520) (375 226) (292 512) (10 844 966)
Closing balance 42 105 827 3 947 557 816 496 183 950 47 053 830
2019USD
2019USD
2019USD
2019USD
2019USD
Financial Liabilities
Leases Instalment Sales
Agreement
Related Parties
Total
Opening balance 57 765 497 – 2 476 354 72 889 60 314 740Foreign exchange movement 480 629 (77 941) (393 923) (88 289) (79 524)IFRS 16 adjustment – 7 007 059 – – 7 007 059Cash flows – drawdown – – – 696 960 696 960Cash flows – repayments (6 798 814) (937 261) (565 656) (304 335) (8 606 066)
Closing balance 51 447 312 5 991 857 1 516 775 377 225 59 333 169
12. INTEREST-BEARING BORROWINGS continued
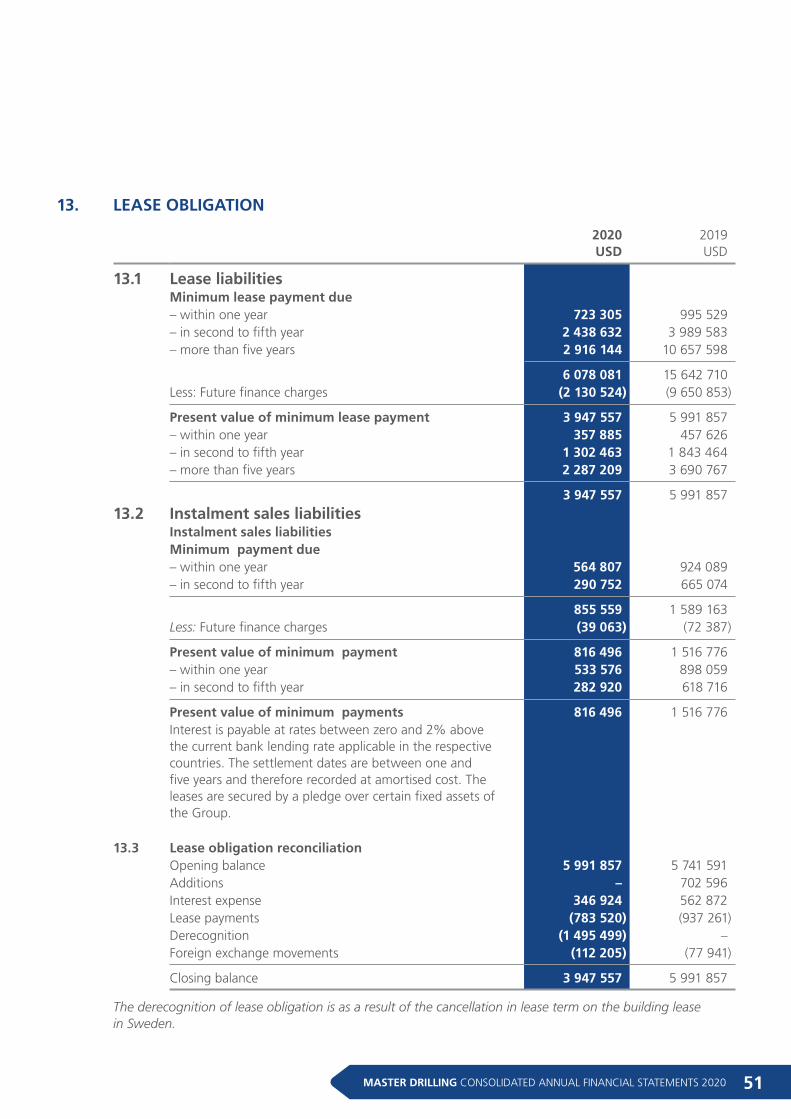
51MASTER DRILLING CONSOLIDATED ANNUAL FINANCIAL STATEMENTS 2020
13. LEASE OBLIGATION
2020USD
2019USD
13.1 Lease liabilities Minimum lease payment due – within one year 723 305 995 529 – in second to fifth year 2 438 632 3 989 583 – more than five years 2 916 144 10 657 598
6 078 081 15 642 710 Less: Future finance charges (2 130 524) (9 650 853)
Present value of minimum lease payment 3 947 557 5 991 857 – within one year 357 885 457 626 – in second to fifth year 1 302 463 1 843 464 – more than five years 2 287 209 3 690 767
3 947 557 5 991 857
13.2 Instalment sales liabilities Instalment sales liabilities Minimum payment due – within one year 564 807 924 089 – in second to fifth year 290 752 665 074
855 559 1 589 163 Less: Future finance charges (39 063) (72 387)
Present value of minimum payment 816 496 1 516 776 – within one year 533 576 898 059 – in second to fifth year 282 920 618 716
Present value of minimum payments 816 496 1 516 776
Interest is payable at rates between zero and 2% above the current bank lending rate applicable in the respective countries. The settlement dates are between one and five years and therefore recorded at amortised cost. The leases are secured by a pledge over certain fixed assets of the Group.
13.3 Lease obligation reconciliation Opening balance 5 991 857 5 741 591 Additions – 702 596 Interest expense 346 924 562 872 Lease payments (783 520) (937 261) Derecognition (1 495 499) – Foreign exchange movements (112 205) (77 941)
Closing balance 3 947 557 5 991 857
The derecognition of lease obligation is as a result of the cancellation in lease term on the building lease in Sweden.
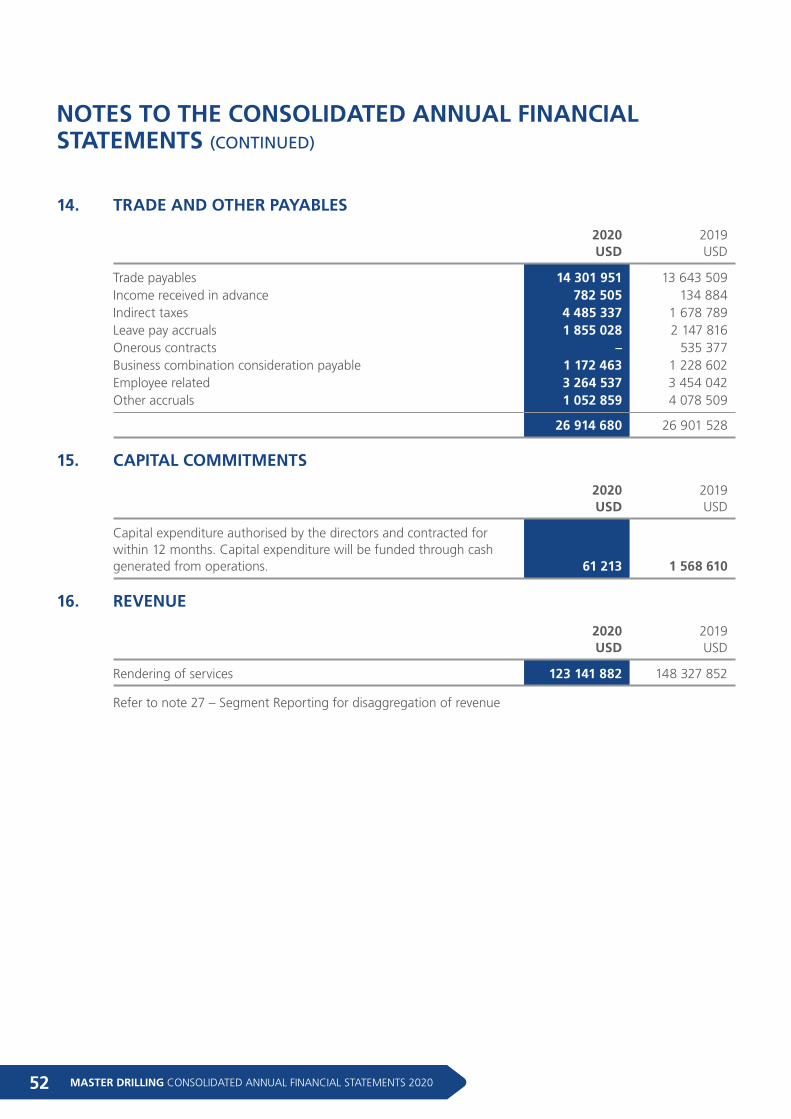
MASTER DRILLING CONSOLIDATED ANNUAL FINANCIAL STATEMENTS 202052
NOTES TO THE CONSOLIDATED ANNUAL FINANCIAL STATEMENTS (CONTINUED)
14. TRADE AND OTHER PAYABLES
2020USD
2019USD
Trade payables 14 301 951 13 643 509Income received in advance 782 505 134 884Indirect taxes 4 485 337 1 678 789Leave pay accruals 1 855 028 2 147 816Onerous contracts – 535 377Business combination consideration payable 1 172 463 1 228 602Employee related 3 264 537 3 454 042Other accruals 1 052 859 4 078 509
26 914 680 26 901 528
15. CAPITAL COMMITMENTS
2020USD
2019USD
Capital expenditure authorised by the directors and contracted for within 12 months. Capital expenditure will be funded through cash generated from operations. 61 213 1 568 610
16. REVENUE
2020USD
2019USD
Rendering of services 123 141 882 148 327 852
Refer to note 27 – Segment Reporting for disaggregation of revenue
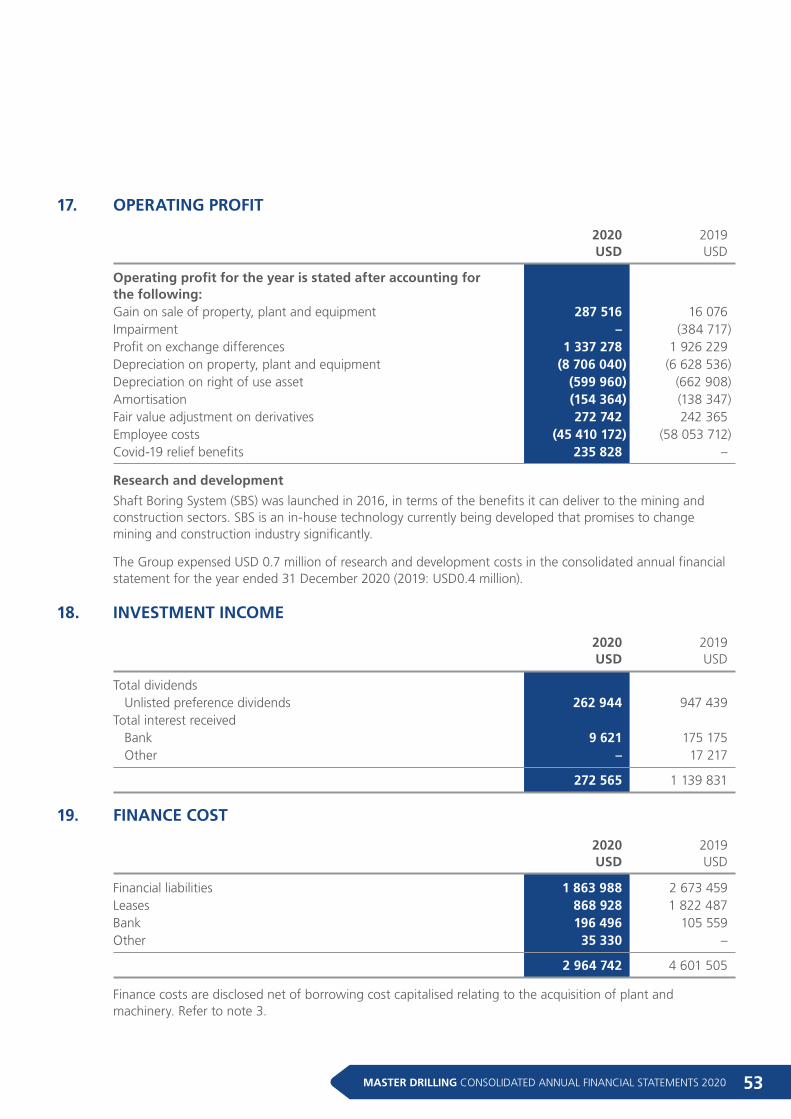
53MASTER DRILLING CONSOLIDATED ANNUAL FINANCIAL STATEMENTS 2020
17. OPERATING PROFIT
2020USD
2019USD
Operating profit for the year is stated after accounting for the following: Gain on sale of property, plant and equipment 287 516 16 076Impairment – (384 717)Profit on exchange differences 1 337 278 1 926 229Depreciation on property, plant and equipment (8 706 040) (6 628 536)Depreciation on right of use asset (599 960) (662 908)Amortisation (154 364) (138 347)Fair value adjustment on derivatives 272 742 242 365Employee costs (45 410 172) (58 053 712)Covid-19 relief benefits 235 828 –
Research and development
Shaft Boring System (SBS) was launched in 2016, in terms of the benefits it can deliver to the mining and construction sectors. SBS is an in-house technology currently being developed that promises to change mining and construction industry significantly.
The Group expensed USD 0.7 million of research and development costs in the consolidated annual financial statement for the year ended 31 December 2020 (2019: USD0.4 million).
18. INVESTMENT INCOME
2020USD
2019USD
Total dividends Unlisted preference dividends 262 944 947 439
Total interest received Bank 9 621 175 175Other – 17 217
272 565 1 139 831
19. FINANCE COST
2020USD
2019USD
Financial liabilities 1 863 988 2 673 459Leases 868 928 1 822 487Bank 196 496 105 559Other 35 330 –
2 964 742 4 601 505
Finance costs are disclosed net of borrowing cost capitalised relating to the acquisition of plant and machinery. Refer to note 3.
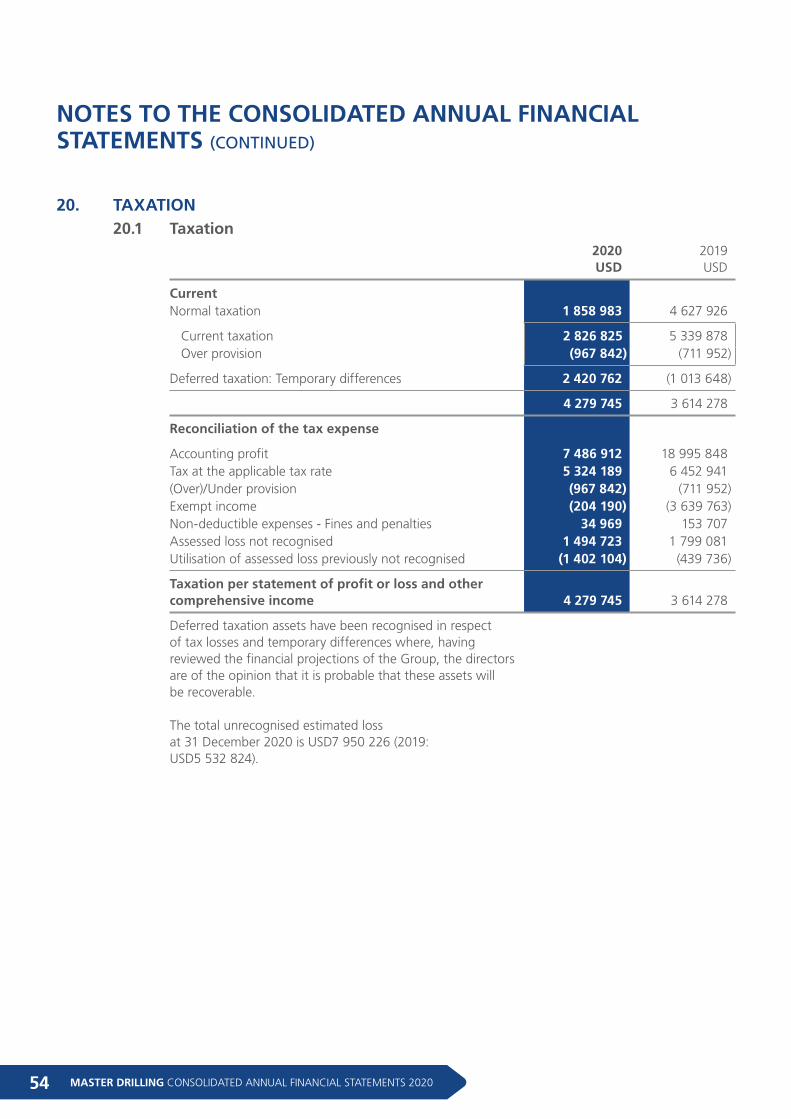
MASTER DRILLING CONSOLIDATED ANNUAL FINANCIAL STATEMENTS 202054
NOTES TO THE CONSOLIDATED ANNUAL FINANCIAL STATEMENTS (CONTINUED)
20. TAXATION20.1 Taxation
2020USD
2019USD
Current Normal taxation 1 858 983 4 627 926
Current taxation 2 826 825 5 339 878Over provision (967 842) (711 952)
Deferred taxation: Temporary differences 2 420 762 (1 013 648)
4 279 745 3 614 278
Reconciliation of the tax expense
Accounting profit 7 486 912 18 995 848Tax at the applicable tax rate 5 324 189 6 452 941(Over)/Under provision (967 842) (711 952)Exempt income (204 190) (3 639 763)Non-deductible expenses - Fines and penalties 34 969 153 707Assessed loss not recognised 1 494 723 1 799 081Utilisation of assessed loss previously not recognised (1 402 104) (439 736)
Taxation per statement of profit or loss and other comprehensive income 4 279 745 3 614 278
Deferred taxation assets have been recognised in respect of tax losses and temporary differences where, having reviewed the financial projections of the Group, the directors are of the opinion that it is probable that these assets will be recoverable.
The total unrecognised estimated loss at 31 December 2020 is USD7 950 226 (2019: USD5 532 824).
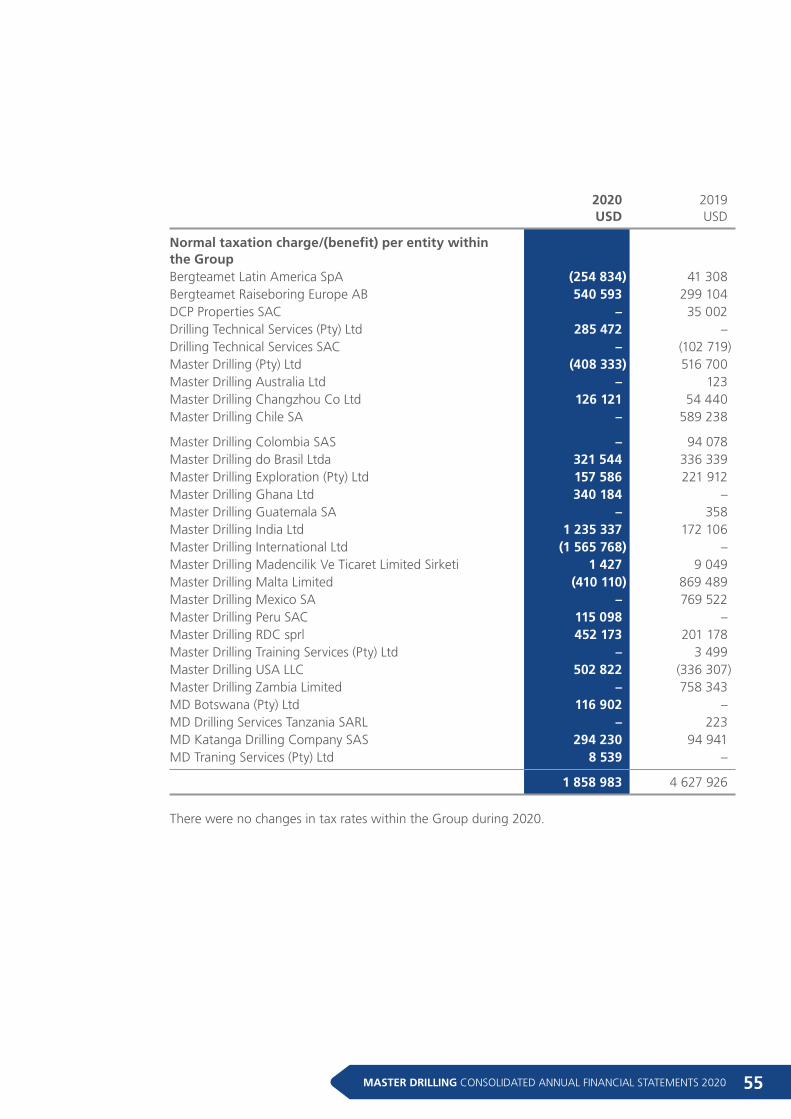
55MASTER DRILLING CONSOLIDATED ANNUAL FINANCIAL STATEMENTS 2020
2020USD
2019USD
Normal taxation charge/(benefit) per entity within the Group Bergteamet Latin America SpA (254 834) 41 308Bergteamet Raiseboring Europe AB 540 593 299 104DCP Properties SAC – 35 002Drilling Technical Services (Pty) Ltd 285 472 –Drilling Technical Services SAC – (102 719)Master Drilling (Pty) Ltd (408 333) 516 700Master Drilling Australia Ltd – 123Master Drilling Changzhou Co Ltd 126 121 54 440Master Drilling Chile SA – 589 238
Master Drilling Colombia SAS – 94 078Master Drilling do Brasil Ltda 321 544 336 339Master Drilling Exploration (Pty) Ltd 157 586 221 912Master Drilling Ghana Ltd 340 184 –Master Drilling Guatemala SA – 358Master Drilling India Ltd 1 235 337 172 106Master Drilling International Ltd (1 565 768) –Master Drilling Madencilik Ve Ticaret Limited Sirketi 1 427 9 049Master Drilling Malta Limited (410 110) 869 489Master Drilling Mexico SA – 769 522Master Drilling Peru SAC 115 098 –Master Drilling RDC sprl 452 173 201 178Master Drilling Training Services (Pty) Ltd – 3 499Master Drilling USA LLC 502 822 (336 307)Master Drilling Zambia Limited – 758 343MD Botswana (Pty) Ltd 116 902 –MD Drilling Services Tanzania SARL – 223MD Katanga Drilling Company SAS 294 230 94 941MD Traning Services (Pty) Ltd 8 539 –
1 858 983 4 627 926
There were no changes in tax rates within the Group during 2020.
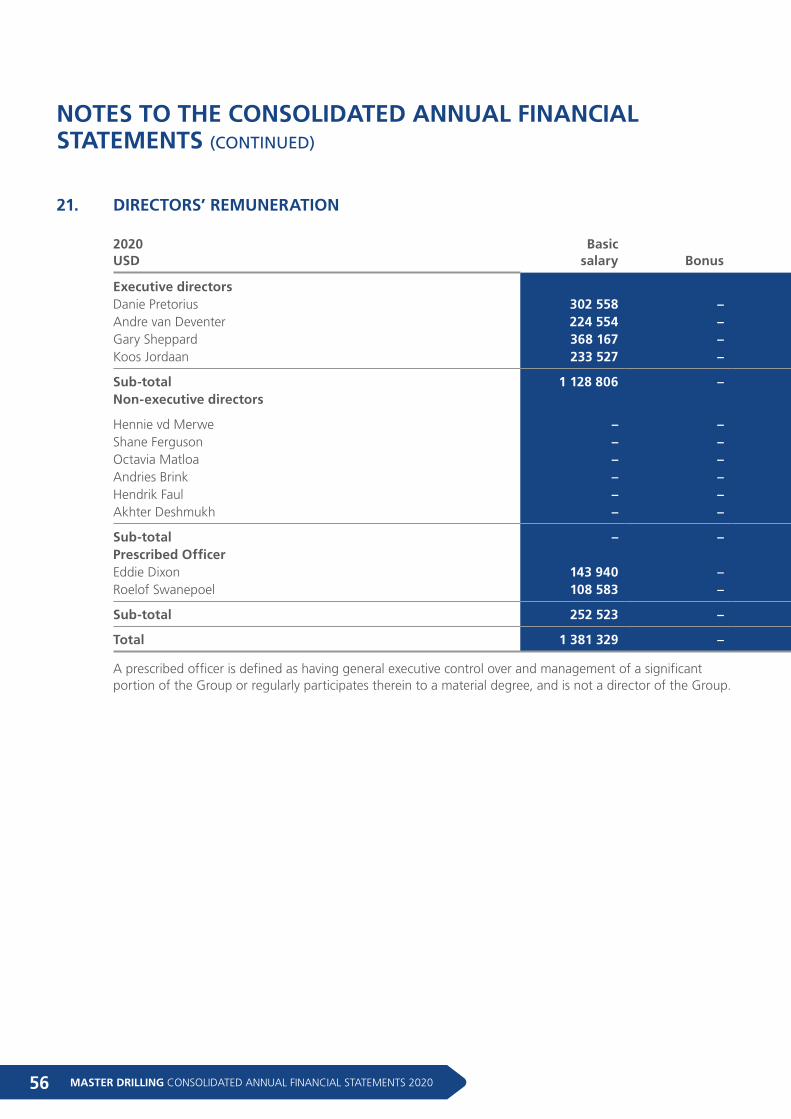
MASTER DRILLING CONSOLIDATED ANNUAL FINANCIAL STATEMENTS 202056
NOTES TO THE CONSOLIDATED ANNUAL FINANCIAL STATEMENTS (CONTINUED)
21. DIRECTORS’ REMUNERATION
2020USD
Basic salary Bonus
Fringebenefits
Provident/Pension fundcontributions
Director’sfees
Consultingand legal fees Total
Executive directors Danie Pretorius 302 558 – 17 751 – – – 320 309Andre van Deventer 224 554 – 12 315 – – – 236 869Gary Sheppard 368 167 – 20 537 – – – 388 704Koos Jordaan 233 527 – 12 316 – – – 245 843
Sub-total 1 128 806 – 62 919 – – – 1 191 725Non-executive directors
Hennie vd Merwe – – – – 52 041 – 52 041Shane Ferguson – – – – 27 037 29 246 56 283Octavia Matloa – – – – 25 879 – 25 879Andries Brink – – – – 27 402 – 27 402Hendrik Faul – – – – 10 721 – 10 721Akhter Deshmukh – – – – 34 409 – 34 409
Sub-total – – – – 177 489 29 246 206 735Prescribed Officer Eddie Dixon 143 940 – 15 478 10 389 – – 169 807Roelof Swanepoel 108 583 – 4 605 7 769 – – 120 957
Sub-total 252 523 – 20 083 18 158 – – 290 764
Total 1 381 329 – 83 002 18 158 177 489 29 246 1 689 224
A prescribed officer is defined as having general executive control over and management of a significant portion of the Group or regularly participates therein to a material degree, and is not a director of the Group.
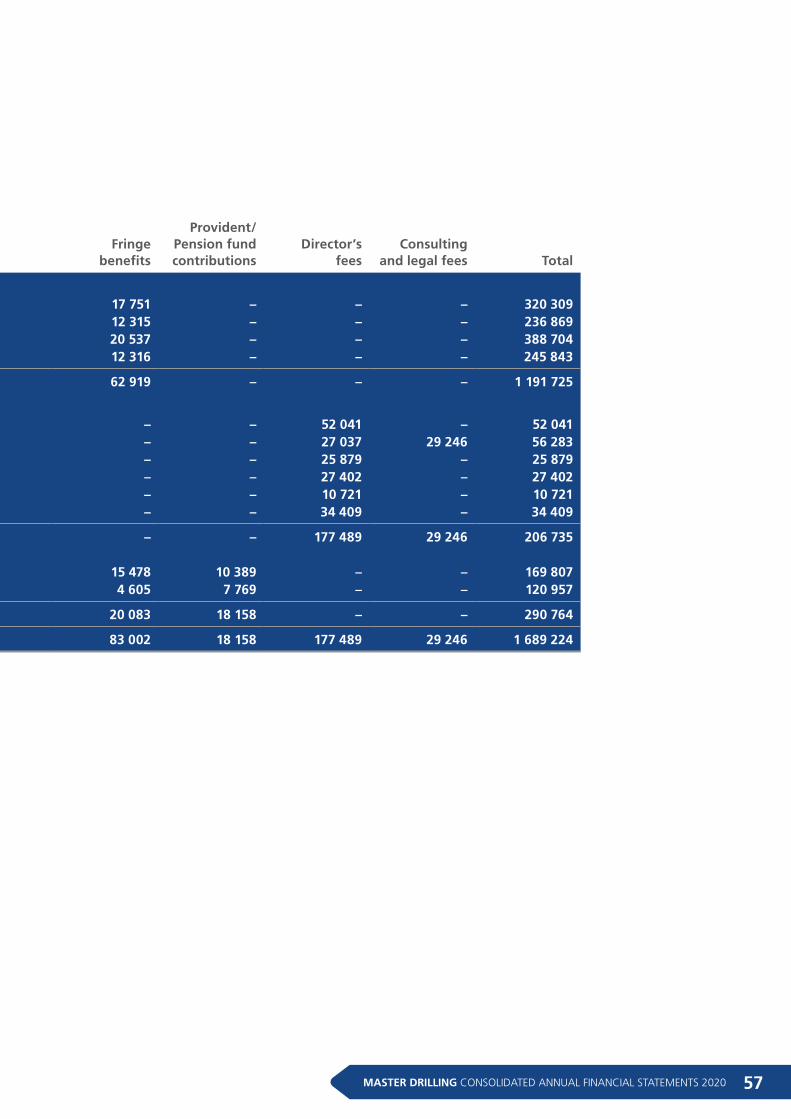
57MASTER DRILLING CONSOLIDATED ANNUAL FINANCIAL STATEMENTS 2020
21. DIRECTORS’ REMUNERATION
2020USD
Basic salary Bonus
Fringebenefits
Provident/Pension fundcontributions
Director’sfees
Consultingand legal fees Total
Executive directors Danie Pretorius 302 558 – 17 751 – – – 320 309Andre van Deventer 224 554 – 12 315 – – – 236 869Gary Sheppard 368 167 – 20 537 – – – 388 704Koos Jordaan 233 527 – 12 316 – – – 245 843
Sub-total 1 128 806 – 62 919 – – – 1 191 725Non-executive directors
Hennie vd Merwe – – – – 52 041 – 52 041Shane Ferguson – – – – 27 037 29 246 56 283Octavia Matloa – – – – 25 879 – 25 879Andries Brink – – – – 27 402 – 27 402Hendrik Faul – – – – 10 721 – 10 721Akhter Deshmukh – – – – 34 409 – 34 409
Sub-total – – – – 177 489 29 246 206 735Prescribed Officer Eddie Dixon 143 940 – 15 478 10 389 – – 169 807Roelof Swanepoel 108 583 – 4 605 7 769 – – 120 957
Sub-total 252 523 – 20 083 18 158 – – 290 764
Total 1 381 329 – 83 002 18 158 177 489 29 246 1 689 224
A prescribed officer is defined as having general executive control over and management of a significant portion of the Group or regularly participates therein to a material degree, and is not a director of the Group.
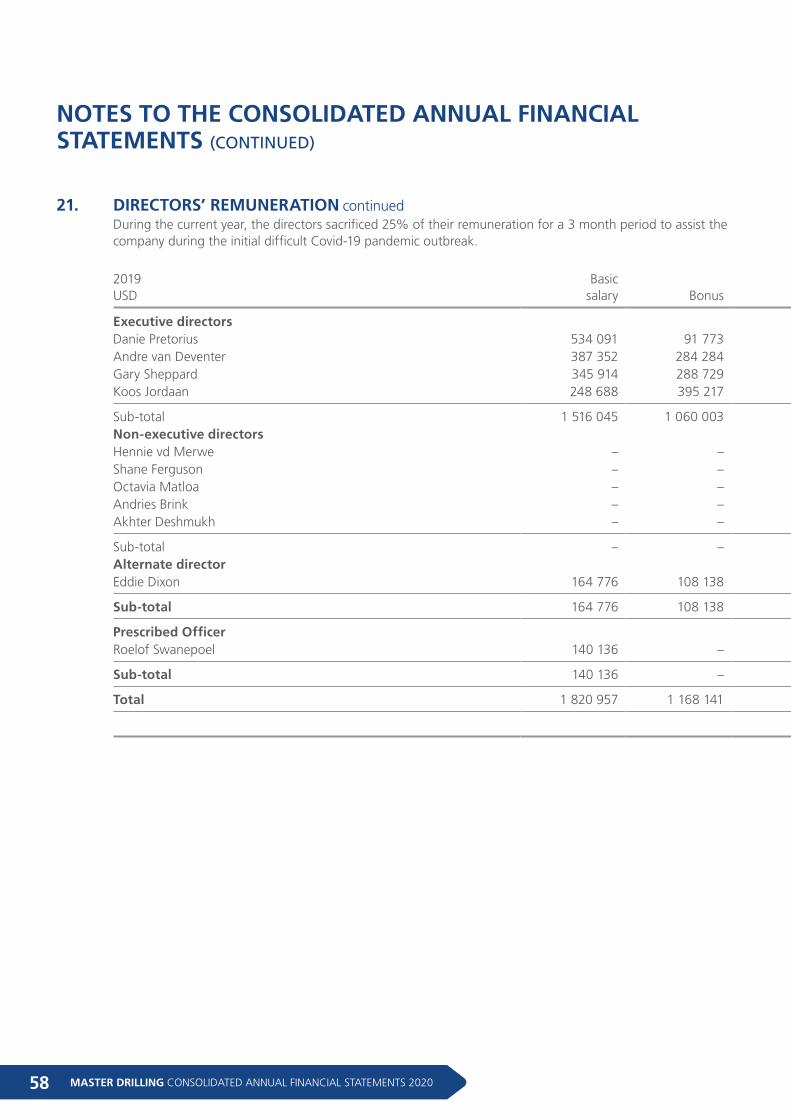
MASTER DRILLING CONSOLIDATED ANNUAL FINANCIAL STATEMENTS 202058
NOTES TO THE CONSOLIDATED ANNUAL FINANCIAL STATEMENTS (CONTINUED)
During the current year, the directors sacrificed 25% of their remuneration for a 3 month period to assist the company during the initial difficult Covid-19 pandemic outbreak.
2019USD
Basic salary Bonus
Fringebenefits
Provident/Pension fundcontributions
Director’sfees
Consultingand legal fees Total
Executive directors Danie Pretorius 534 091 91 773 20 239 – – – 646 103Andre van Deventer 387 352 284 284 15 728 – – – 687 364Gary Sheppard 345 914 288 729 24 593 5 972 – – 665 208Koos Jordaan 248 688 395 217 34 512 – – – 678 417
Sub-total 1 516 045 1 060 003 95 072 5 972 – – 2 677 092Non-executive directors Hennie vd Merwe – – – – 61 234 – 61 234Shane Ferguson – – – – – 96 292 96 292Octavia Matloa – – – – 29 339 – 29 339Andries Brink – – – – 29 339 – 29 339Akhter Deshmukh – – – – 39 527 – 39 527
Sub-total – – – – 159 439 96 292 255 731Alternate director Eddie Dixon 164 776 108 138 11 810 17 875 – – 302 599
Sub-total 164 776 108 138 11 810 17 875 – – 302 599
Prescribed Officer Roelof Swanepoel 140 136 – 3 579 8 494 – – 152 209
Sub-total 140 136 – 3 579 8 494 – – 152 209
Total 1 820 957 1 168 141 110 461 32 341 159 439 96 292 3 387 631
21. DIRECTORS’ REMUNERATION continued
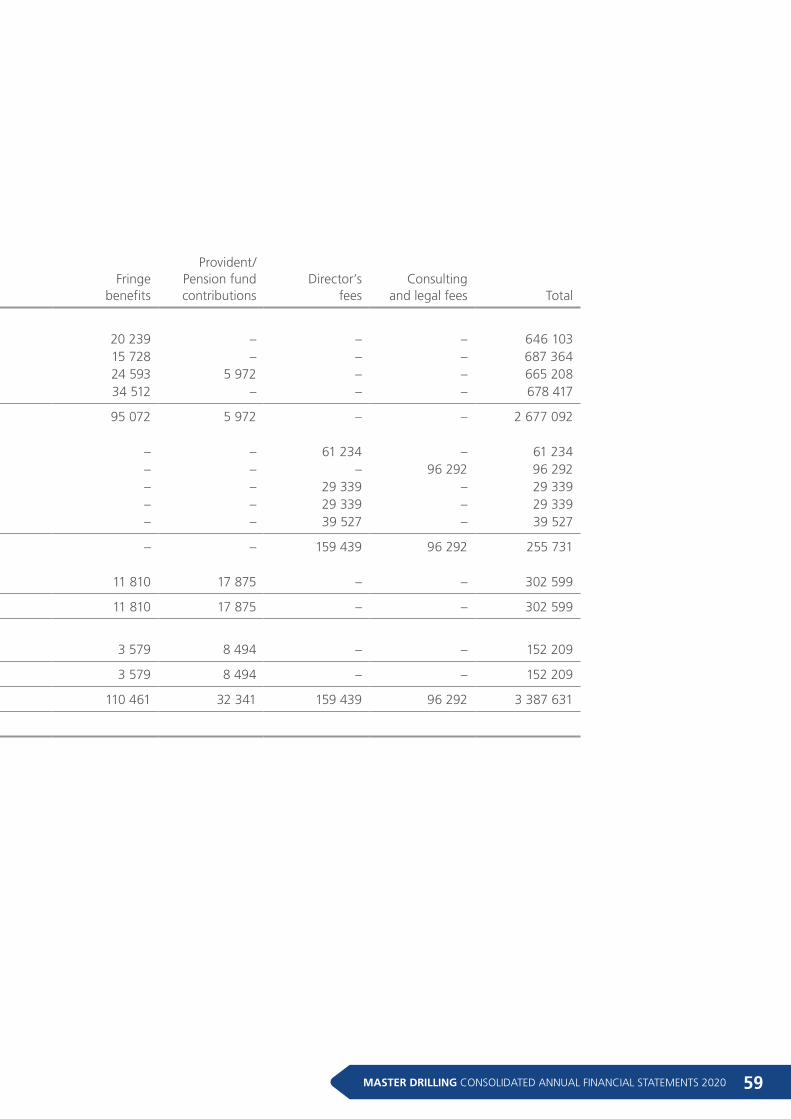
59MASTER DRILLING CONSOLIDATED ANNUAL FINANCIAL STATEMENTS 2020
During the current year, the directors sacrificed 25% of their remuneration for a 3 month period to assist the company during the initial difficult Covid-19 pandemic outbreak.
2019USD
Basic salary Bonus
Fringebenefits
Provident/Pension fundcontributions
Director’sfees
Consultingand legal fees Total
Executive directors Danie Pretorius 534 091 91 773 20 239 – – – 646 103Andre van Deventer 387 352 284 284 15 728 – – – 687 364Gary Sheppard 345 914 288 729 24 593 5 972 – – 665 208Koos Jordaan 248 688 395 217 34 512 – – – 678 417
Sub-total 1 516 045 1 060 003 95 072 5 972 – – 2 677 092Non-executive directors Hennie vd Merwe – – – – 61 234 – 61 234Shane Ferguson – – – – – 96 292 96 292Octavia Matloa – – – – 29 339 – 29 339Andries Brink – – – – 29 339 – 29 339Akhter Deshmukh – – – – 39 527 – 39 527
Sub-total – – – – 159 439 96 292 255 731Alternate director Eddie Dixon 164 776 108 138 11 810 17 875 – – 302 599
Sub-total 164 776 108 138 11 810 17 875 – – 302 599
Prescribed Officer Roelof Swanepoel 140 136 – 3 579 8 494 – – 152 209
Sub-total 140 136 – 3 579 8 494 – – 152 209
Total 1 820 957 1 168 141 110 461 32 341 159 439 96 292 3 387 631
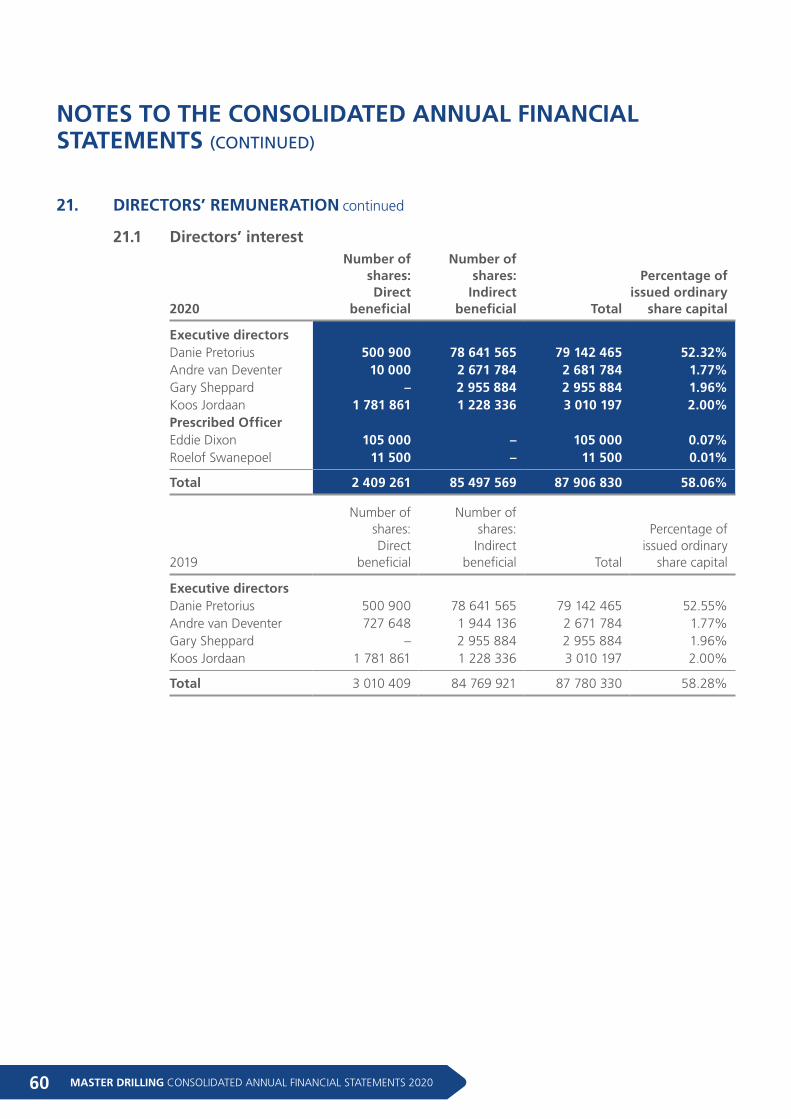
MASTER DRILLING CONSOLIDATED ANNUAL FINANCIAL STATEMENTS 202060
NOTES TO THE CONSOLIDATED ANNUAL FINANCIAL STATEMENTS (CONTINUED)
21.1 Directors’ interest
2020
Number of shares: Direct
beneficial
Number of shares:
Indirectbeneficial Total
Percentage of issued ordinary
share capital
Executive directors Danie Pretorius 500 900 78 641 565 79 142 465 52.32%Andre van Deventer 10 000 2 671 784 2 681 784 1.77%Gary Sheppard – 2 955 884 2 955 884 1.96%Koos Jordaan 1 781 861 1 228 336 3 010 197 2.00%Prescribed Officer Eddie Dixon 105 000 – 105 000 0.07%Roelof Swanepoel 11 500 – 11 500 0.01%
Total 2 409 261 85 497 569 87 906 830 58.06%
2019
Number of shares: Direct
beneficial
Number of shares:Indirect
beneficial Total
Percentage of issued ordinary
share capital
Executive directors Danie Pretorius 500 900 78 641 565 79 142 465 52.55%Andre van Deventer 727 648 1 944 136 2 671 784 1.77%Gary Sheppard – 2 955 884 2 955 884 1.96%Koos Jordaan 1 781 861 1 228 336 3 010 197 2.00%
Total 3 010 409 84 769 921 87 780 330 58.28%
21. DIRECTORS’ REMUNERATION continued
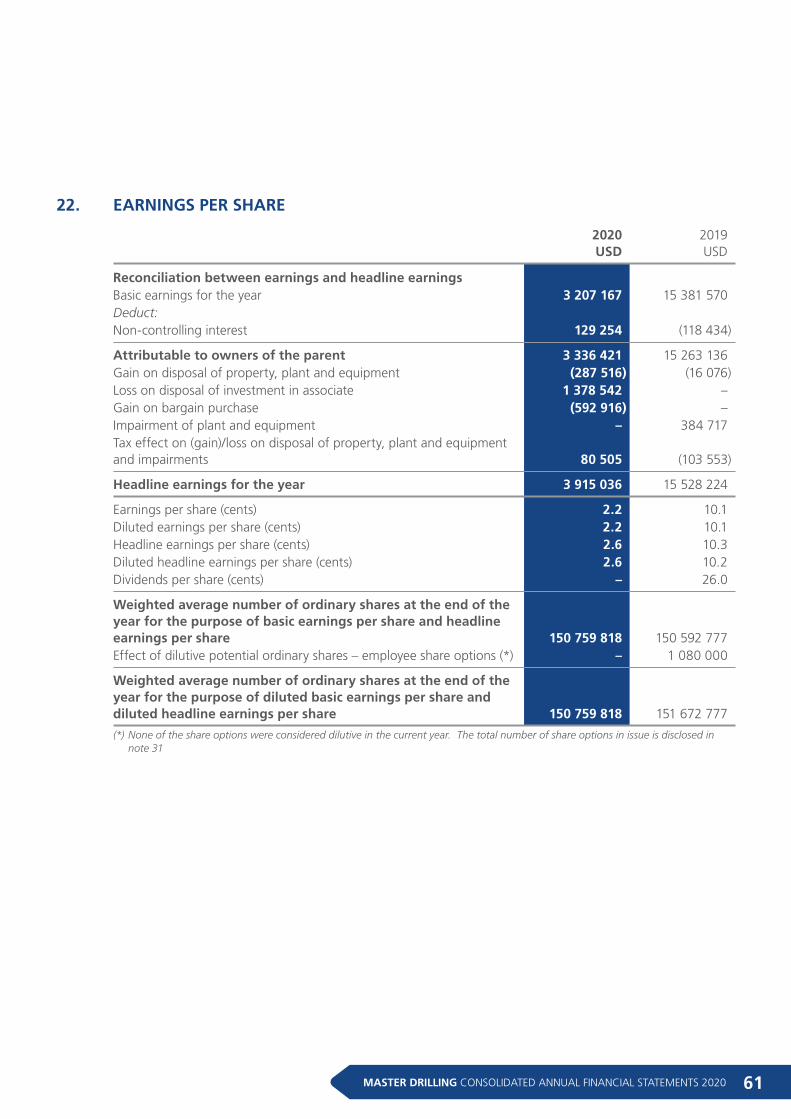
61MASTER DRILLING CONSOLIDATED ANNUAL FINANCIAL STATEMENTS 2020
22. EARNINGS PER SHARE
2020USD
2019USD
Reconciliation between earnings and headline earnings Basic earnings for the year 3 207 167 15 381 570Deduct: Non-controlling interest 129 254 (118 434)
Attributable to owners of the parent 3 336 421 15 263 136Gain on disposal of property, plant and equipment (287 516) (16 076)Loss on disposal of investment in associate 1 378 542 –Gain on bargain purchase (592 916) –Impairment of plant and equipment – 384 717Tax effect on (gain)/loss on disposal of property, plant and equipment and impairments 80 505 (103 553)
Headline earnings for the year 3 915 036 15 528 224
Earnings per share (cents) 2.2 10.1Diluted earnings per share (cents) 2.2 10.1Headline earnings per share (cents) 2.6 10.3Diluted headline earnings per share (cents) 2.6 10.2Dividends per share (cents) – 26.0
Weighted average number of ordinary shares at the end of the year for the purpose of basic earnings per share and headline earnings per share 150 759 818 150 592 777Effect of dilutive potential ordinary shares – employee share options (*) – 1 080 000
Weighted average number of ordinary shares at the end of the year for the purpose of diluted basic earnings per share and diluted headline earnings per share 150 759 818 151 672 777
(*) None of the share options were considered dilutive in the current year. The total number of share options in issue is disclosed in note 31
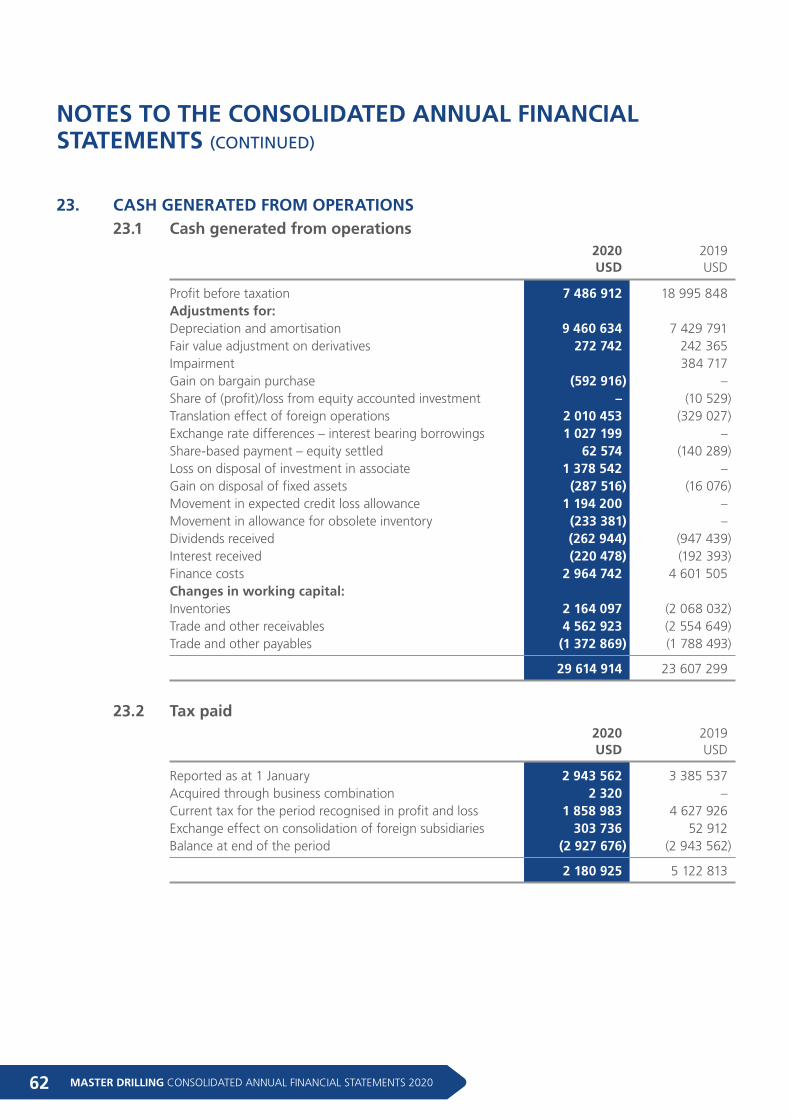
MASTER DRILLING CONSOLIDATED ANNUAL FINANCIAL STATEMENTS 202062
NOTES TO THE CONSOLIDATED ANNUAL FINANCIAL STATEMENTS (CONTINUED)
23. CASH GENERATED FROM OPERATIONS23.1 Cash generated from operations
2020USD
2019USD
Profit before taxation 7 486 912 18 995 848Adjustments for: Depreciation and amortisation 9 460 634 7 429 791Fair value adjustment on derivatives 272 742 242 365Impairment 384 717Gain on bargain purchase (592 916) –Share of (profit)/loss from equity accounted investment – (10 529)Translation effect of foreign operations 2 010 453 (329 027)Exchange rate differences – interest bearing borrowings 1 027 199 –Share-based payment – equity settled 62 574 (140 289)Loss on disposal of investment in associate 1 378 542 –Gain on disposal of fixed assets (287 516) (16 076)Movement in expected credit loss allowance 1 194 200 –Movement in allowance for obsolete inventory (233 381) –Dividends received (262 944) (947 439)Interest received (220 478) (192 393)Finance costs 2 964 742 4 601 505Changes in working capital: Inventories 2 164 097 (2 068 032)Trade and other receivables 4 562 923 (2 554 649)Trade and other payables (1 372 869) (1 788 493)
29 614 914 23 607 299
23.2 Tax paid
2020USD
2019USD
Reported as at 1 January 2 943 562 3 385 537Acquired through business combination 2 320 –Current tax for the period recognised in profit and loss 1 858 983 4 627 926Exchange effect on consolidation of foreign subsidiaries 303 736 52 912Balance at end of the period (2 927 676) (2 943 562)
2 180 925 5 122 813
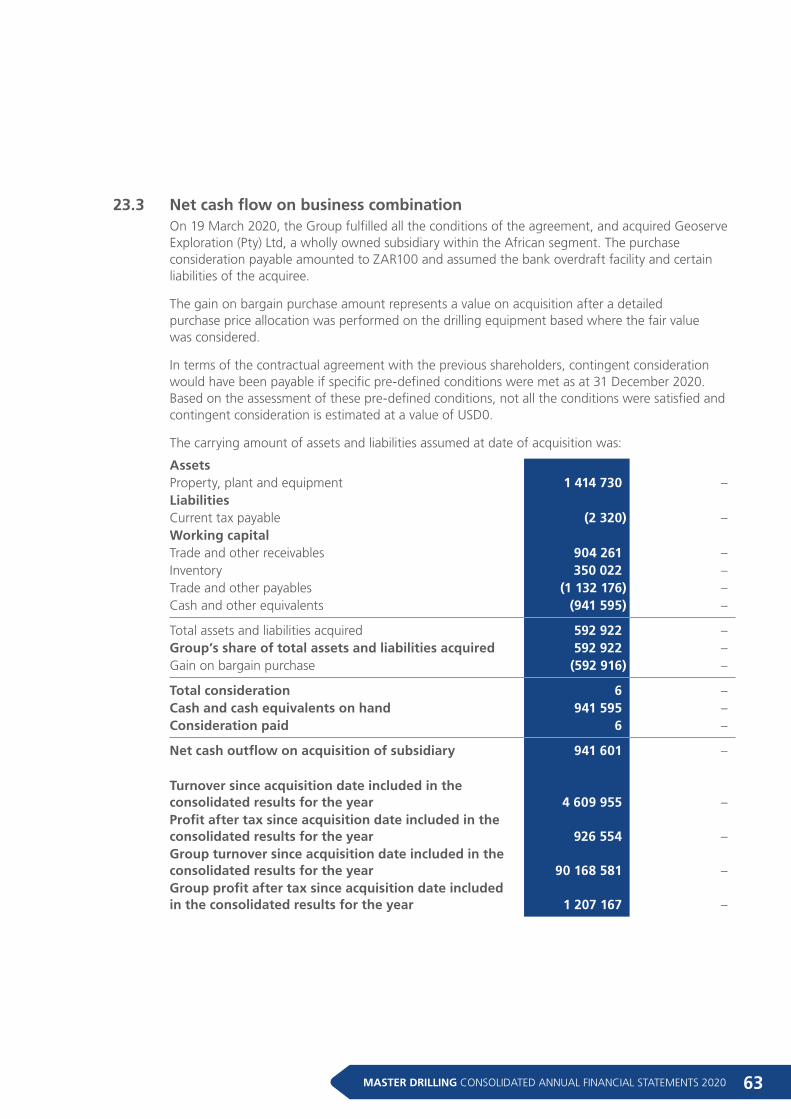
63MASTER DRILLING CONSOLIDATED ANNUAL FINANCIAL STATEMENTS 2020
23.3 Net cash flow on business combinationOn 19 March 2020, the Group fulfilled all the conditions of the agreement, and acquired Geoserve Exploration (Pty) Ltd, a wholly owned subsidiary within the African segment. The purchase consideration payable amounted to ZAR100 and assumed the bank overdraft facility and certain liabilities of the acquiree.
The gain on bargain purchase amount represents a value on acquisition after a detailed purchase price allocation was performed on the drilling equipment based where the fair value was considered.
In terms of the contractual agreement with the previous shareholders, contingent consideration would have been payable if specific pre-defined conditions were met as at 31 December 2020. Based on the assessment of these pre-defined conditions, not all the conditions were satisfied and contingent consideration is estimated at a value of USD0.
The carrying amount of assets and liabilities assumed at date of acquisition was:
Assets Property, plant and equipment 1 414 730 –Liabilities Current tax payable (2 320) –Working capital Trade and other receivables 904 261 –Inventory 350 022 –Trade and other payables (1 132 176) –Cash and other equivalents (941 595) –
Total assets and liabilities acquired 592 922 –Group’s share of total assets and liabilities acquired 592 922 –Gain on bargain purchase (592 916) –
Total consideration 6 –Cash and cash equivalents on hand 941 595 –Consideration paid 6 –
Net cash outflow on acquisition of subsidiary 941 601 – Turnover since acquisition date included in the consolidated results for the year 4 609 955 –Profit after tax since acquisition date included in the consolidated results for the year 926 554 –Group turnover since acquisition date included in theconsolidated results for the year 90 168 581 –Group profit after tax since acquisition date included in the consolidated results for the year 1 207 167 –
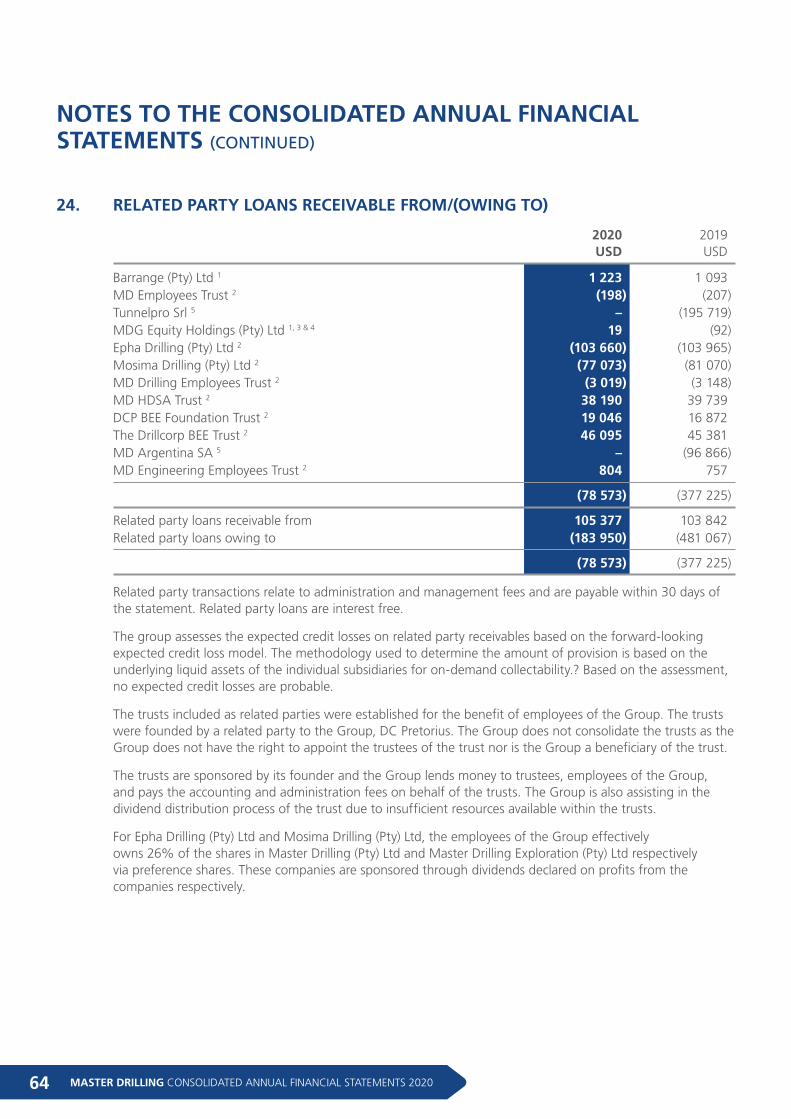
MASTER DRILLING CONSOLIDATED ANNUAL FINANCIAL STATEMENTS 202064
NOTES TO THE CONSOLIDATED ANNUAL FINANCIAL STATEMENTS (CONTINUED)
24. RELATED PARTY LOANS RECEIVABLE FROM/(OWING TO)
2020USD
2019USD
Barrange (Pty) Ltd 1 1 223 1 093MD Employees Trust 2 (198) (207)Tunnelpro Srl 5 – (195 719)MDG Equity Holdings (Pty) Ltd 1, 3 & 4 19 (92)Epha Drilling (Pty) Ltd 2 (103 660) (103 965)Mosima Drilling (Pty) Ltd 2 (77 073) (81 070)MD Drilling Employees Trust 2 (3 019) (3 148)MD HDSA Trust 2 38 190 39 739DCP BEE Foundation Trust 2 19 046 16 872The Drillcorp BEE Trust 2 46 095 45 381MD Argentina SA 5 – (96 866)MD Engineering Employees Trust 2 804 757
(78 573) (377 225)
Related party loans receivable from 105 377 103 842Related party loans owing to (183 950) (481 067)
(78 573) (377 225)
Related party transactions relate to administration and management fees and are payable within 30 days of the statement. Related party loans are interest free.
The group assesses the expected credit losses on related party receivables based on the forward-looking expected credit loss model. The methodology used to determine the amount of provision is based on the underlying liquid assets of the individual subsidiaries for on-demand collectability.? Based on the assessment, no expected credit losses are probable.
The trusts included as related parties were established for the benefit of employees of the Group. The trusts were founded by a related party to the Group, DC Pretorius. The Group does not consolidate the trusts as the Group does not have the right to appoint the trustees of the trust nor is the Group a beneficiary of the trust.
The trusts are sponsored by its founder and the Group lends money to trustees, employees of the Group, and pays the accounting and administration fees on behalf of the trusts. The Group is also assisting in the dividend distribution process of the trust due to insufficient resources available within the trusts.
For Epha Drilling (Pty) Ltd and Mosima Drilling (Pty) Ltd, the employees of the Group effectively owns 26% of the shares in Master Drilling (Pty) Ltd and Master Drilling Exploration (Pty) Ltd respectively via preference shares. These companies are sponsored through dividends declared on profits from the companies respectively.
65MASTER DRILLING CONSOLIDATED ANNUAL FINANCIAL STATEMENTS 2020
The above loans are with legal entities where the following related parties have control:1 Danie Pretorius2 BEE Partner3 Andre van Deventer4 Koos Jordaan5 Associate company
Salaries paid to key management amounts to 2020: USD1 446 127 (2019: USD1 877 336).
Key management is defined as the employees who have the authority to directly or indirectly plan and control the specific business operations within the country it operates. Key management excludes the directors and prescribed officer of the Group. Refer to note 21 for disclosure on directors’ remuneration.
25. RISK MANAGEMENT25.1 Capital risk management
The Group's objectives when managing capital are to safeguard the Group's ability to continue as a going concern in order to provide returns for shareholders and benefits for other stakeholders and to maintain an optimal capital structure to reduce the cost of capital.
The capital structure of the Group consists of debt, which includes the borrowings disclosed in notes 12 and 13, cash and cash equivalents disclosed in note 9, and equity as disclosed in the statement of financial position.
In order to maintain or adjust the capital structure the Group may adjust the amount of dividends paid to shareholders, return capital to shareholders, issue new shares or sell assets to reduce debt.
The ABSA Capital facility has the following covenant ratio requirements:– leverage ratio less than 1.5;– debt service cover ratio not less than 1.4; and– interest coverage rate not less than 4.
The above covenant ratios are closely monitored by management and as at 31 December 2020 the above covenant ratios were all adhered to.
25.2 Financial risk managementThe Group’s activities expose it to a variety of financial risks: market risk (including currency risk, fair value interest rate risk and cash flow interest rate risk), credit risk and liquidity risk.
The Group’s overall risk management program focuses on the unpredictability of financial markets and seeks to minimise potential adverse effects on the Group’s financial performance. The principles for financial management are included in the Group's treasury policy and cover specific areas, such as foreign exchange risk, interest rate risk, credit risk.
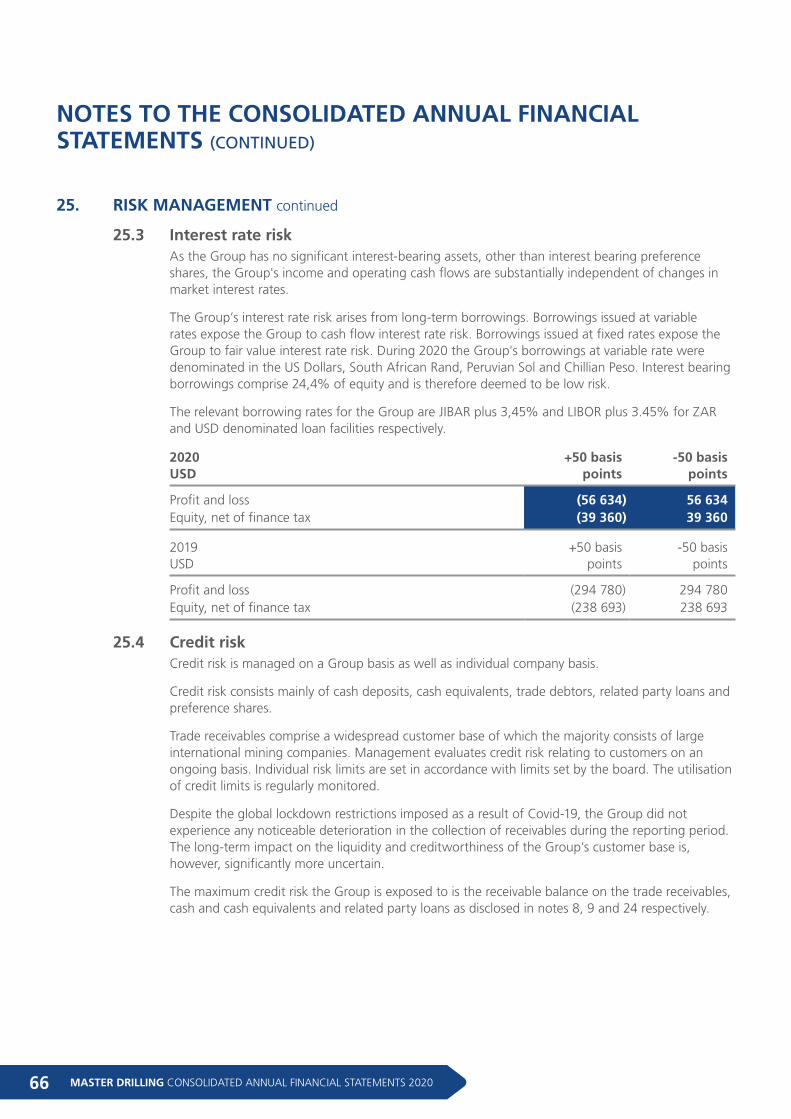
MASTER DRILLING CONSOLIDATED ANNUAL FINANCIAL STATEMENTS 202066
NOTES TO THE CONSOLIDATED ANNUAL FINANCIAL STATEMENTS (CONTINUED)
25. RISK MANAGEMENT continued
25.3 Interest rate riskAs the Group has no significant interest-bearing assets, other than interest bearing preference shares, the Group's income and operating cash flows are substantially independent of changes in market interest rates.
The Group’s interest rate risk arises from long-term borrowings. Borrowings issued at variable rates expose the Group to cash flow interest rate risk. Borrowings issued at fixed rates expose the Group to fair value interest rate risk. During 2020 the Group's borrowings at variable rate were denominated in the US Dollars, South African Rand, Peruvian Sol and Chillian Peso. Interest bearing borrowings comprise 24,4% of equity and is therefore deemed to be low risk.
The relevant borrowing rates for the Group are JIBAR plus 3,45% and LIBOR plus 3.45% for ZAR and USD denominated loan facilities respectively.
2020USD
+50 basispoints
-50 basispoints
Profit and loss (56 634) 56 634Equity, net of finance tax (39 360) 39 360
2019USD
+50 basispoints
-50 basispoints
Profit and loss (294 780) 294 780Equity, net of finance tax (238 693) 238 693
25.4 Credit riskCredit risk is managed on a Group basis as well as individual company basis.
Credit risk consists mainly of cash deposits, cash equivalents, trade debtors, related party loans and preference shares.
Trade receivables comprise a widespread customer base of which the majority consists of large international mining companies. Management evaluates credit risk relating to customers on an ongoing basis. Individual risk limits are set in accordance with limits set by the board. The utilisation of credit limits is regularly monitored.
Despite the global lockdown restrictions imposed as a result of Covid-19, the Group did not experience any noticeable deterioration in the collection of receivables during the reporting period. The long-term impact on the liquidity and creditworthiness of the Group’s customer base is, however, significantly more uncertain.
The maximum credit risk the Group is exposed to is the receivable balance on the trade receivables, cash and cash equivalents and related party loans as disclosed in notes 8, 9 and 24 respectively.
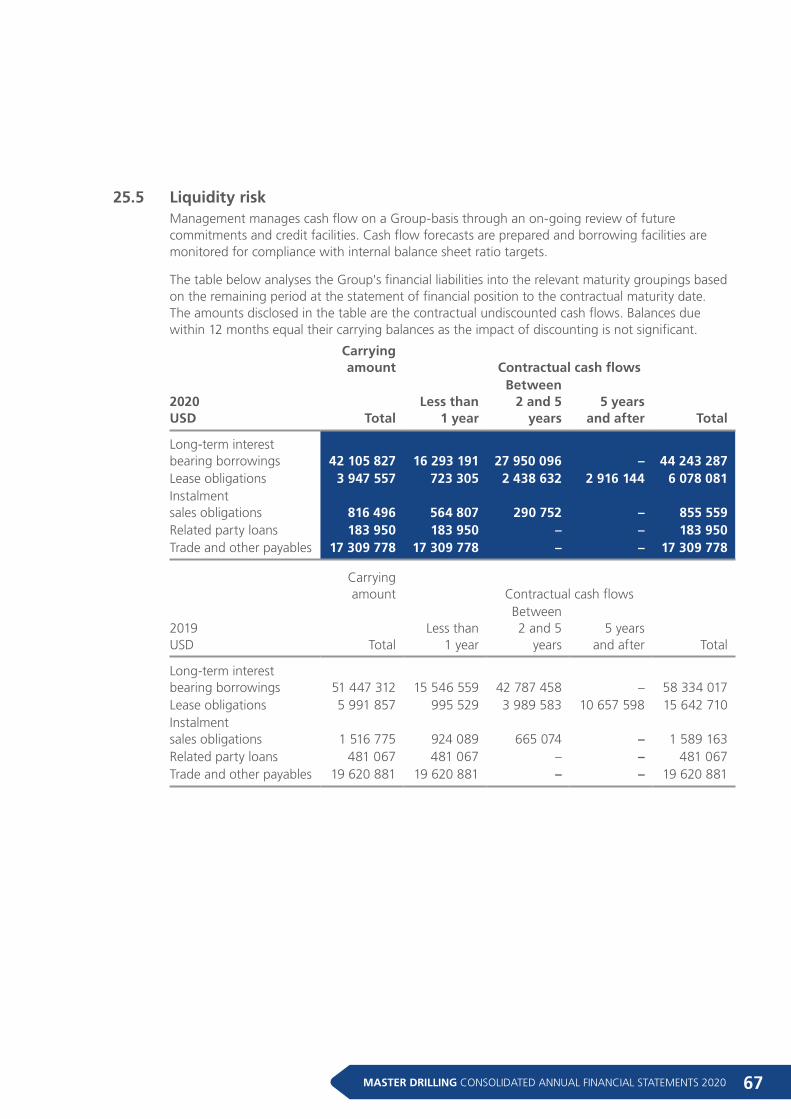
67MASTER DRILLING CONSOLIDATED ANNUAL FINANCIAL STATEMENTS 2020
25.5 Liquidity riskManagement manages cash flow on a Group-basis through an on-going review of future commitments and credit facilities. Cash flow forecasts are prepared and borrowing facilities are monitored for compliance with internal balance sheet ratio targets.
The table below analyses the Group's financial liabilities into the relevant maturity groupings based on the remaining period at the statement of financial position to the contractual maturity date. The amounts disclosed in the table are the contractual undiscounted cash flows. Balances due within 12 months equal their carrying balances as the impact of discounting is not significant.
Carrying amount Contractual cash flows
2020USD Total
Less than1 year
Between 2 and 5
years5 years
and after Total
Long-term interest bearing borrowings 42 105 827 16 293 191 27 950 096 – 44 243 287Lease obligations 3 947 557 723 305 2 438 632 2 916 144 6 078 081Instalment sales obligations 816 496 564 807 290 752 – 855 559Related party loans 183 950 183 950 – – 183 950Trade and other payables 17 309 778 17 309 778 – – 17 309 778
Carrying amount Contractual cash flows
2019USD Total
Less than1 year
Between 2 and 5
years5 years
and after Total
Long-term interest bearing borrowings 51 447 312 15 546 559 42 787 458 – 58 334 017Lease obligations 5 991 857 995 529 3 989 583 10 657 598 15 642 710Instalment sales obligations 1 516 775 924 089 665 074 – 1 589 163Related party loans 481 067 481 067 – – 481 067Trade and other payables 19 620 881 19 620 881 – – 19 620 881
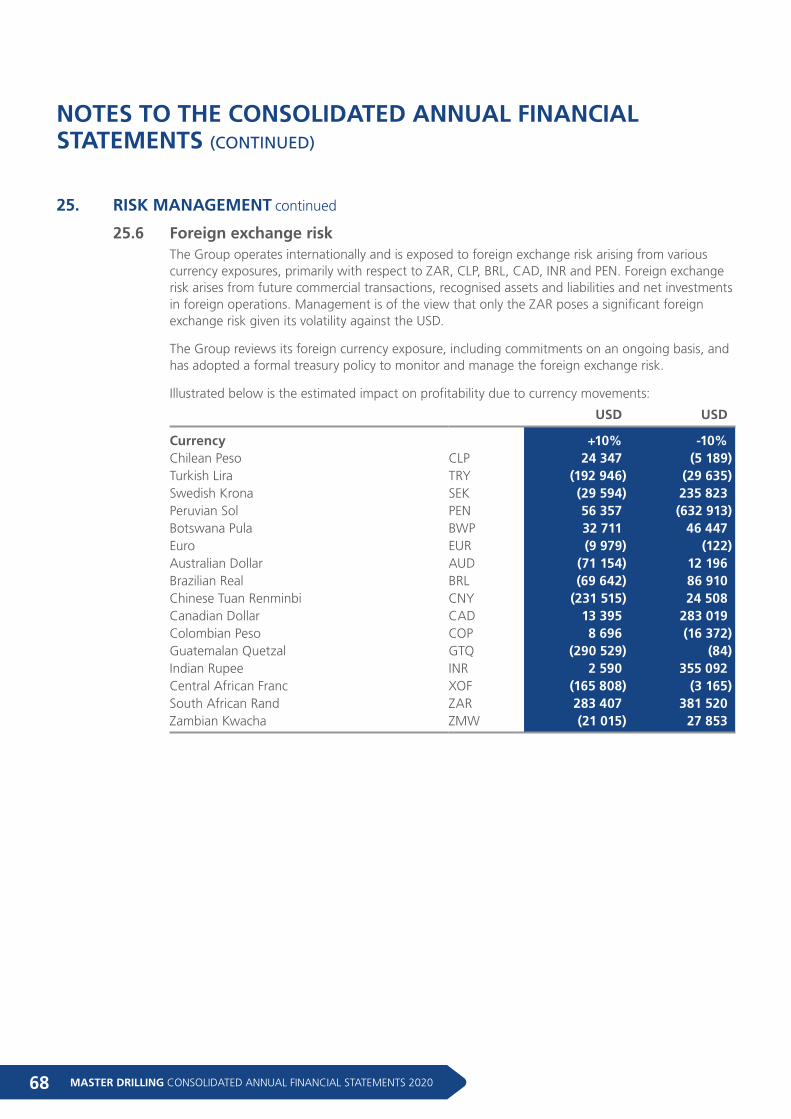
MASTER DRILLING CONSOLIDATED ANNUAL FINANCIAL STATEMENTS 202068
NOTES TO THE CONSOLIDATED ANNUAL FINANCIAL STATEMENTS (CONTINUED)
25.6 Foreign exchange riskThe Group operates internationally and is exposed to foreign exchange risk arising from various currency exposures, primarily with respect to ZAR, CLP, BRL, CAD, INR and PEN. Foreign exchange risk arises from future commercial transactions, recognised assets and liabilities and net investments in foreign operations. Management is of the view that only the ZAR poses a significant foreign exchange risk given its volatility against the USD.
The Group reviews its foreign currency exposure, including commitments on an ongoing basis, and has adopted a formal treasury policy to monitor and manage the foreign exchange risk.
Illustrated below is the estimated impact on profitability due to currency movements:
USD USD
Currency +10% -10%Chilean Peso CLP 24 347 (5 189)Turkish Lira TRY (192 946) (29 635)Swedish Krona SEK (29 594) 235 823Peruvian Sol PEN 56 357 (632 913)Botswana Pula BWP 32 711 46 447Euro EUR (9 979) (122)Australian Dollar AUD (71 154) 12 196Brazilian Real BRL (69 642) 86 910Chinese Tuan Renminbi CNY (231 515) 24 508Canadian Dollar CAD 13 395 283 019Colombian Peso COP 8 696 (16 372)Guatemalan Quetzal GTQ (290 529) (84)Indian Rupee INR 2 590 355 092Central African Franc XOF (165 808) (3 165)South African Rand ZAR 283 407 381 520Zambian Kwacha ZMW (21 015) 27 853
25. RISK MANAGEMENT continued
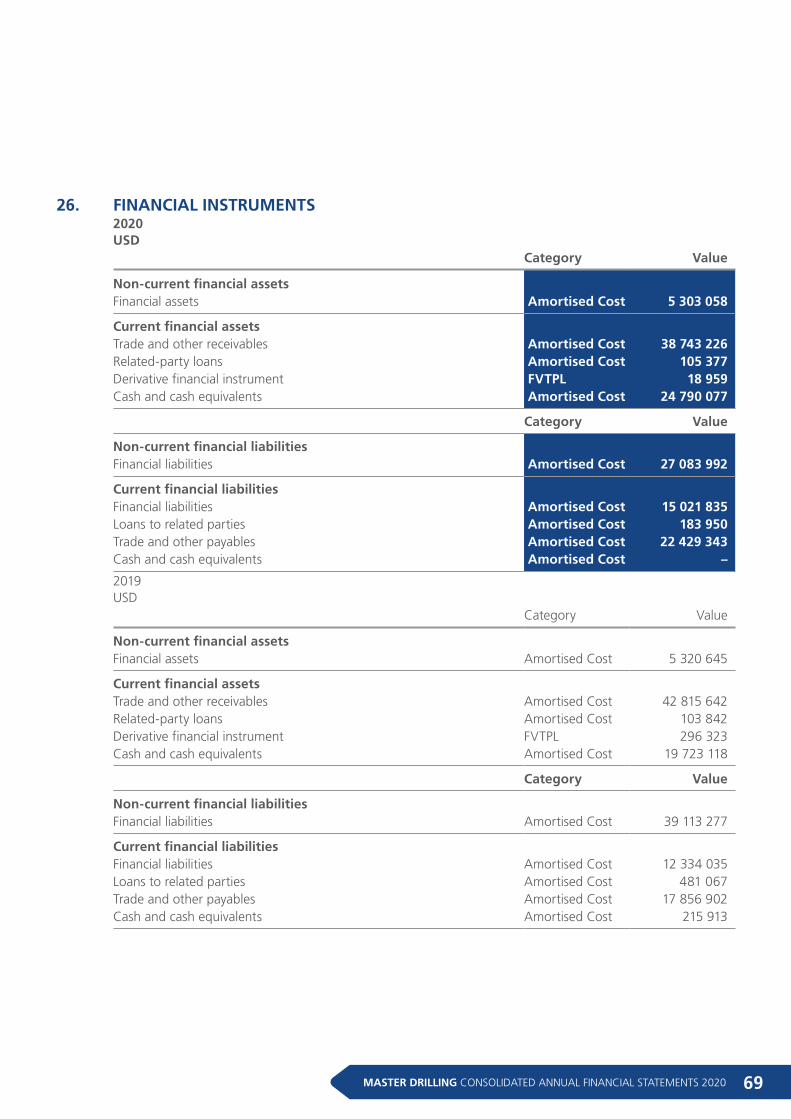
69MASTER DRILLING CONSOLIDATED ANNUAL FINANCIAL STATEMENTS 2020
26. FINANCIAL INSTRUMENTS2020USD Category Value
Non-current financial assets Financial assets Amortised Cost 5 303 058
Current financial assets Trade and other receivables Amortised Cost 38 743 226Related-party loans Amortised Cost 105 377Derivative financial instrument FVTPL 18 959Cash and cash equivalents Amortised Cost 24 790 077
Category Value
Non-current financial liabilities Financial liabilities Amortised Cost 27 083 992
Current financial liabilities Financial liabilities Amortised Cost 15 021 835Loans to related parties Amortised Cost 183 950Trade and other payables Amortised Cost 22 429 343Cash and cash equivalents Amortised Cost –
2019USD Category Value
Non-current financial assets Financial assets Amortised Cost 5 320 645
Current financial assets Trade and other receivables Amortised Cost 42 815 642Related-party loans Amortised Cost 103 842Derivative financial instrument FVTPL 296 323Cash and cash equivalents Amortised Cost 19 723 118
Category Value
Non-current financial liabilities Financial liabilities Amortised Cost 39 113 277
Current financial liabilities Financial liabilities Amortised Cost 12 334 035Loans to related parties Amortised Cost 481 067Trade and other payables Amortised Cost 17 856 902Cash and cash equivalents Amortised Cost 215 913
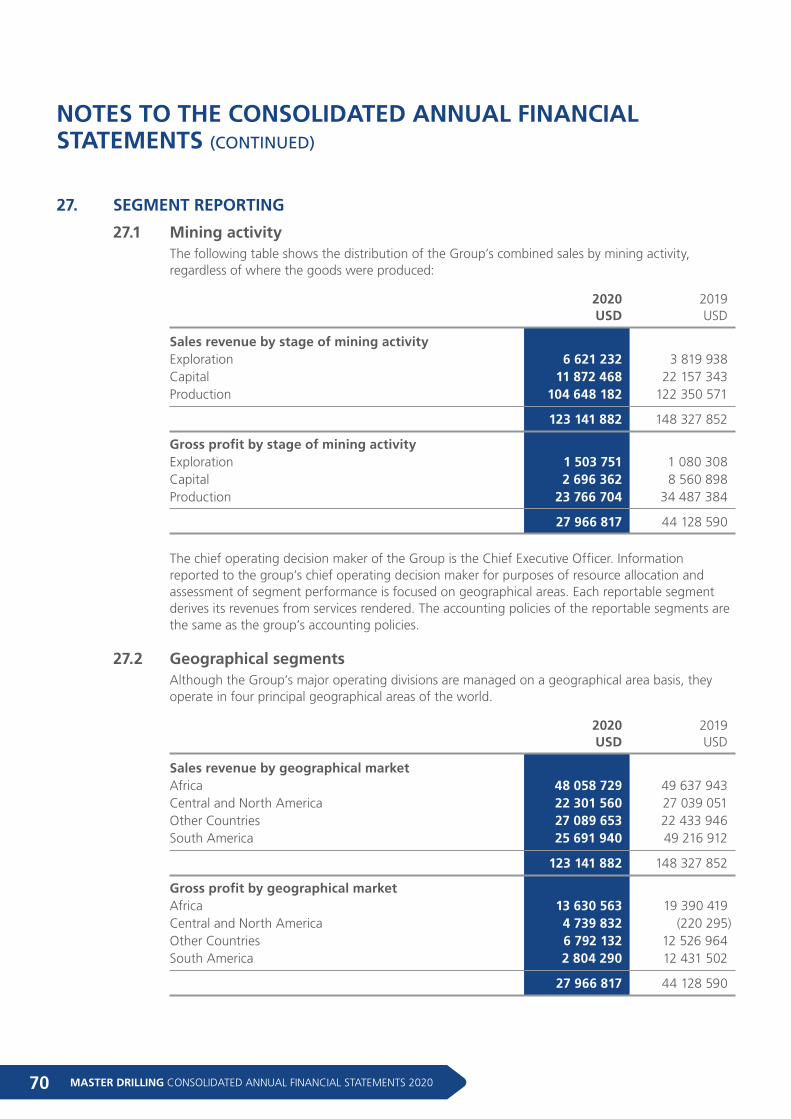
MASTER DRILLING CONSOLIDATED ANNUAL FINANCIAL STATEMENTS 202070
NOTES TO THE CONSOLIDATED ANNUAL FINANCIAL STATEMENTS (CONTINUED)
27. SEGMENT REPORTING
27.1 Mining activityThe following table shows the distribution of the Group’s combined sales by mining activity, regardless of where the goods were produced:
2020USD
2019USD
Sales revenue by stage of mining activity Exploration 6 621 232 3 819 938Capital 11 872 468 22 157 343Production 104 648 182 122 350 571
123 141 882 148 327 852
Gross profit by stage of mining activity Exploration 1 503 751 1 080 308Capital 2 696 362 8 560 898Production 23 766 704 34 487 384
27 966 817 44 128 590
The chief operating decision maker of the Group is the Chief Executive Officer. Information reported to the group’s chief operating decision maker for purposes of resource allocation and assessment of segment performance is focused on geographical areas. Each reportable segment derives its revenues from services rendered. The accounting policies of the reportable segments are the same as the group’s accounting policies.
27.2 Geographical segmentsAlthough the Group’s major operating divisions are managed on a geographical area basis, they operate in four principal geographical areas of the world.
2020USD
2019USD
Sales revenue by geographical market Africa 48 058 729 49 637 943Central and North America 22 301 560 27 039 051Other Countries 27 089 653 22 433 946South America 25 691 940 49 216 912
123 141 882 148 327 852
Gross profit by geographical market Africa 13 630 563 19 390 419Central and North America 4 739 832 (220 295)Other Countries 6 792 132 12 526 964South America 2 804 290 12 431 502
27 966 817 44 128 590
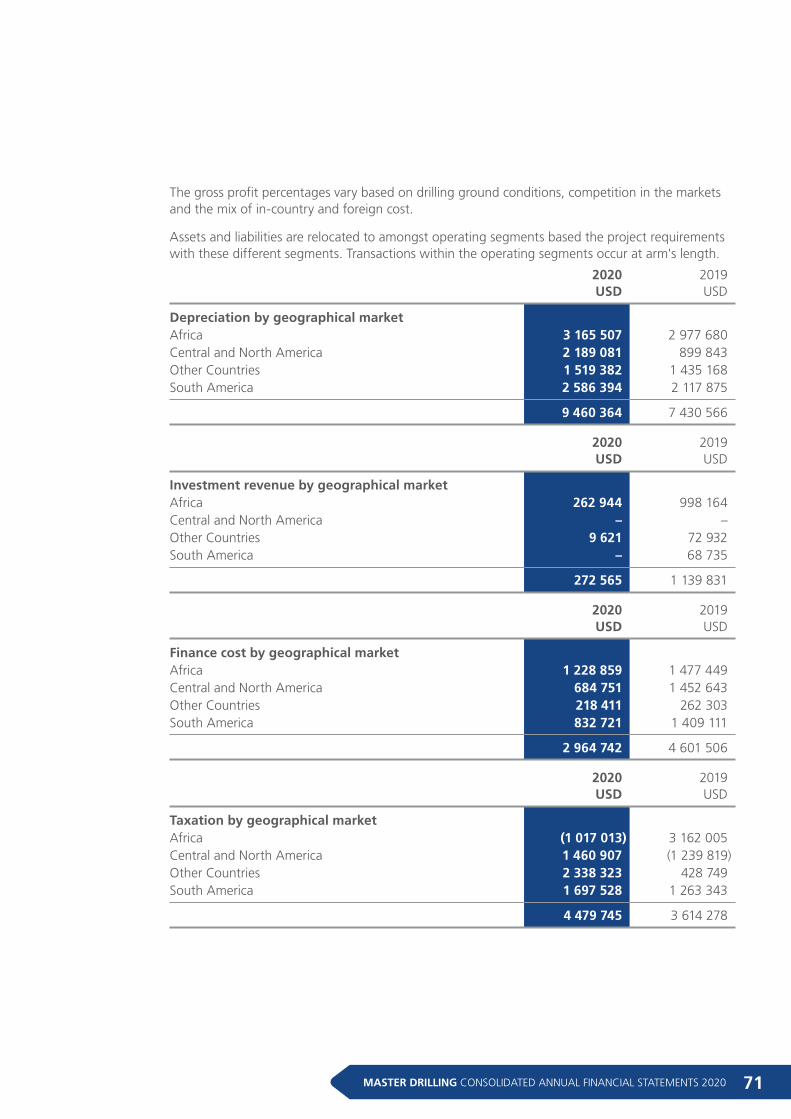
71MASTER DRILLING CONSOLIDATED ANNUAL FINANCIAL STATEMENTS 2020
The gross profit percentages vary based on drilling ground conditions, competition in the markets and the mix of in-country and foreign cost.
Assets and liabilities are relocated to amongst operating segments based the project requirements with these different segments. Transactions within the operating segments occur at arm's length.
2020USD
2019USD
Depreciation by geographical market Africa 3 165 507 2 977 680Central and North America 2 189 081 899 843Other Countries 1 519 382 1 435 168South America 2 586 394 2 117 875
9 460 364 7 430 566
2020USD
2019USD
Investment revenue by geographical market Africa 262 944 998 164Central and North America – –Other Countries 9 621 72 932South America – 68 735
272 565 1 139 831
2020USD
2019USD
Finance cost by geographical market Africa 1 228 859 1 477 449Central and North America 684 751 1 452 643Other Countries 218 411 262 303South America 832 721 1 409 111
2 964 742 4 601 506
2020USD
2019USD
Taxation by geographical market Africa (1 017 013) 3 162 005Central and North America 1 460 907 (1 239 819)Other Countries 2 338 323 428 749South America 1 697 528 1 263 343
4 479 745 3 614 278
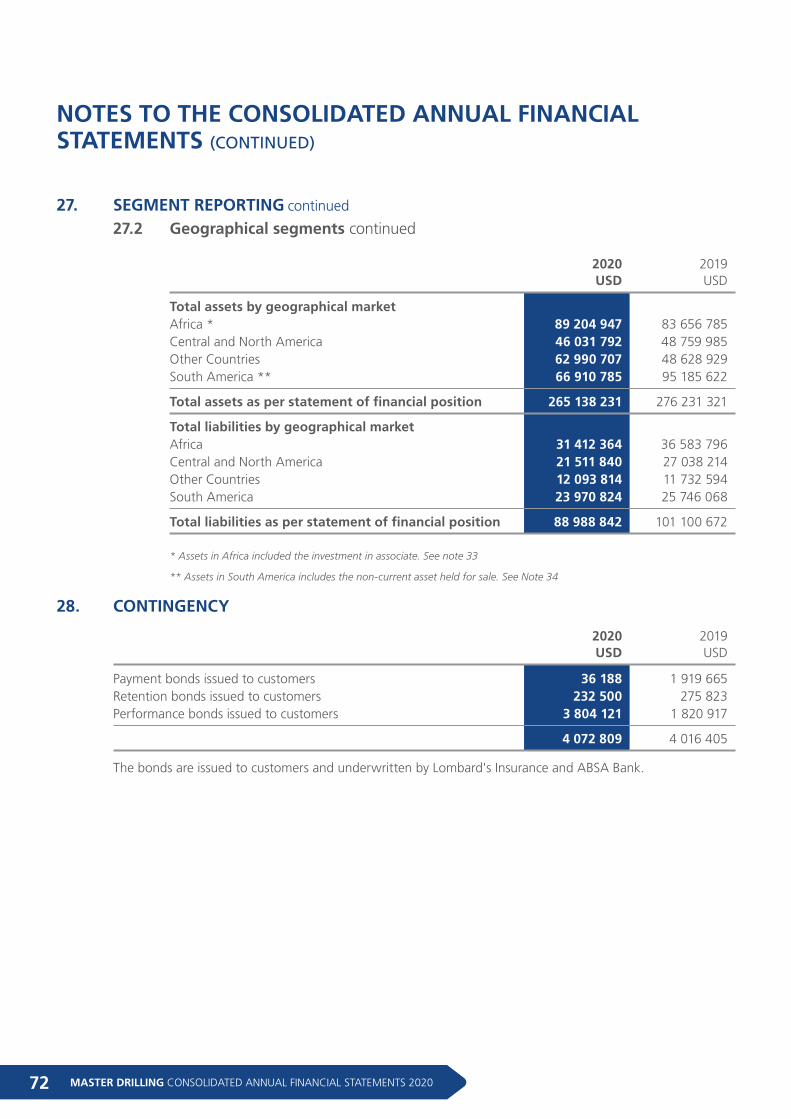
MASTER DRILLING CONSOLIDATED ANNUAL FINANCIAL STATEMENTS 202072
NOTES TO THE CONSOLIDATED ANNUAL FINANCIAL STATEMENTS (CONTINUED)
2020USD
2019USD
Total assets by geographical market Africa * 89 204 947 83 656 785Central and North America 46 031 792 48 759 985Other Countries 62 990 707 48 628 929South America ** 66 910 785 95 185 622
Total assets as per statement of financial position 265 138 231 276 231 321
Total liabilities by geographical market Africa 31 412 364 36 583 796Central and North America 21 511 840 27 038 214Other Countries 12 093 814 11 732 594South America 23 970 824 25 746 068
Total liabilities as per statement of financial position 88 988 842 101 100 672
* Assets in Africa included the investment in associate. See note 33
** Assets in South America includes the non-current asset held for sale. See Note 34
28. CONTINGENCY
2020USD
2019USD
Payment bonds issued to customers 36 188 1 919 665Retention bonds issued to customers 232 500 275 823Performance bonds issued to customers 3 804 121 1 820 917
4 072 809 4 016 405
The bonds are issued to customers and underwritten by Lombard's Insurance and ABSA Bank.
27. SEGMENT REPORTING continued
27.2 Geographical segments continued
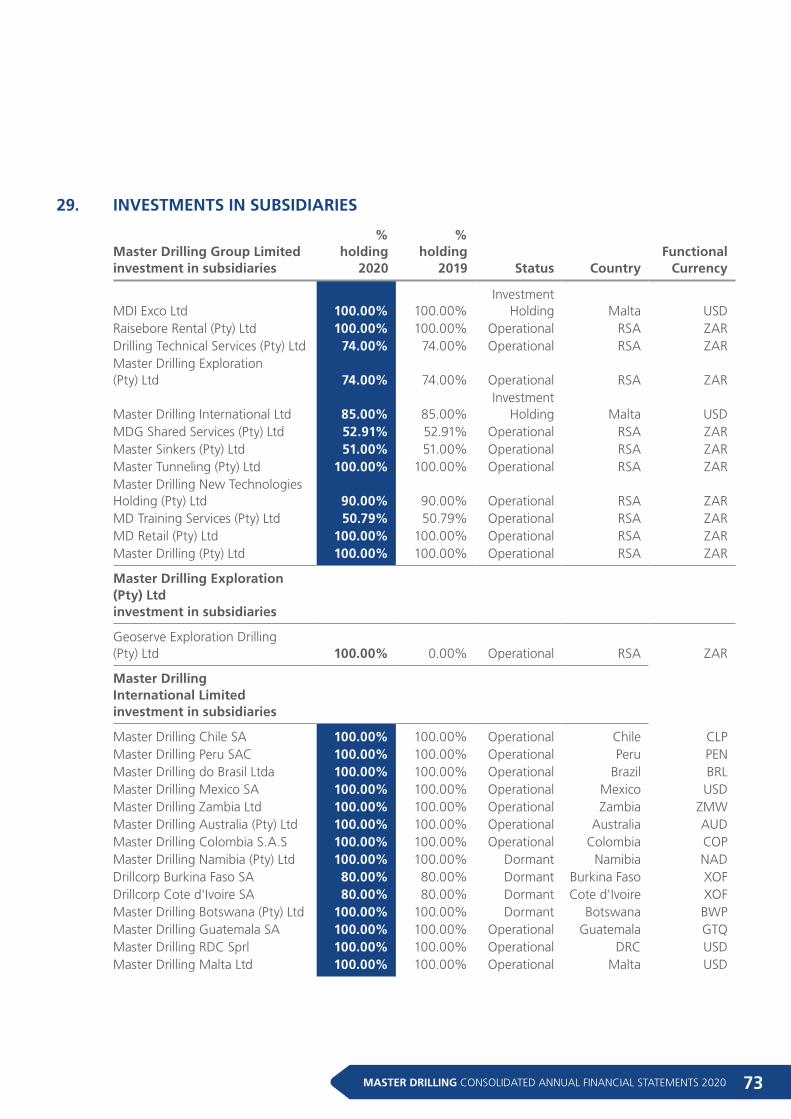
73MASTER DRILLING CONSOLIDATED ANNUAL FINANCIAL STATEMENTS 2020
29. INVESTMENTS IN SUBSIDIARIES
Master Drilling Group Limitedinvestment in subsidiaries
%holding
2020
%holding
2019 Status CountryFunctional
Currency
MDI Exco Ltd 100.00% 100.00%Investment
Holding Malta USDRaisebore Rental (Pty) Ltd 100.00% 100.00% Operational RSA ZARDrilling Technical Services (Pty) Ltd 74.00% 74.00% Operational RSA ZARMaster Drilling Exploration (Pty) Ltd 74.00% 74.00% Operational RSA ZAR
Master Drilling International Ltd 85.00% 85.00%Investment
Holding Malta USDMDG Shared Services (Pty) Ltd 52.91% 52.91% Operational RSA ZARMaster Sinkers (Pty) Ltd 51.00% 51.00% Operational RSA ZARMaster Tunneling (Pty) Ltd 100.00% 100.00% Operational RSA ZARMaster Drilling New Technologies Holding (Pty) Ltd 90.00% 90.00% Operational RSA ZARMD Training Services (Pty) Ltd 50.79% 50.79% Operational RSA ZARMD Retail (Pty) Ltd 100.00% 100.00% Operational RSA ZARMaster Drilling (Pty) Ltd 100.00% 100.00% Operational RSA ZAR
Master Drilling Exploration (Pty) Ltdinvestment in subsidiaries
Geoserve Exploration Drilling (Pty) Ltd 100.00% 0.00% Operational RSA ZAR
Master Drilling International Limitedinvestment in subsidiaries
Master Drilling Chile SA 100.00% 100.00% Operational Chile CLPMaster Drilling Peru SAC 100.00% 100.00% Operational Peru PENMaster Drilling do Brasil Ltda 100.00% 100.00% Operational Brazil BRLMaster Drilling Mexico SA 100.00% 100.00% Operational Mexico USDMaster Drilling Zambia Ltd 100.00% 100.00% Operational Zambia ZMWMaster Drilling Australia (Pty) Ltd 100.00% 100.00% Operational Australia AUDMaster Drilling Colombia S.A.S 100.00% 100.00% Operational Colombia COPMaster Drilling Namibia (Pty) Ltd 100.00% 100.00% Dormant Namibia NADDrillcorp Burkina Faso SA 80.00% 80.00% Dormant Burkina Faso XOFDrillcorp Cote d'Ivoire SA 80.00% 80.00% Dormant Cote d'Ivoire XOFMaster Drilling Botswana (Pty) Ltd 100.00% 100.00% Dormant Botswana BWPMaster Drilling Guatemala SA 100.00% 100.00% Operational Guatemala GTQMaster Drilling RDC Sprl 100.00% 100.00% Operational DRC USDMaster Drilling Malta Ltd 100.00% 100.00% Operational Malta USD
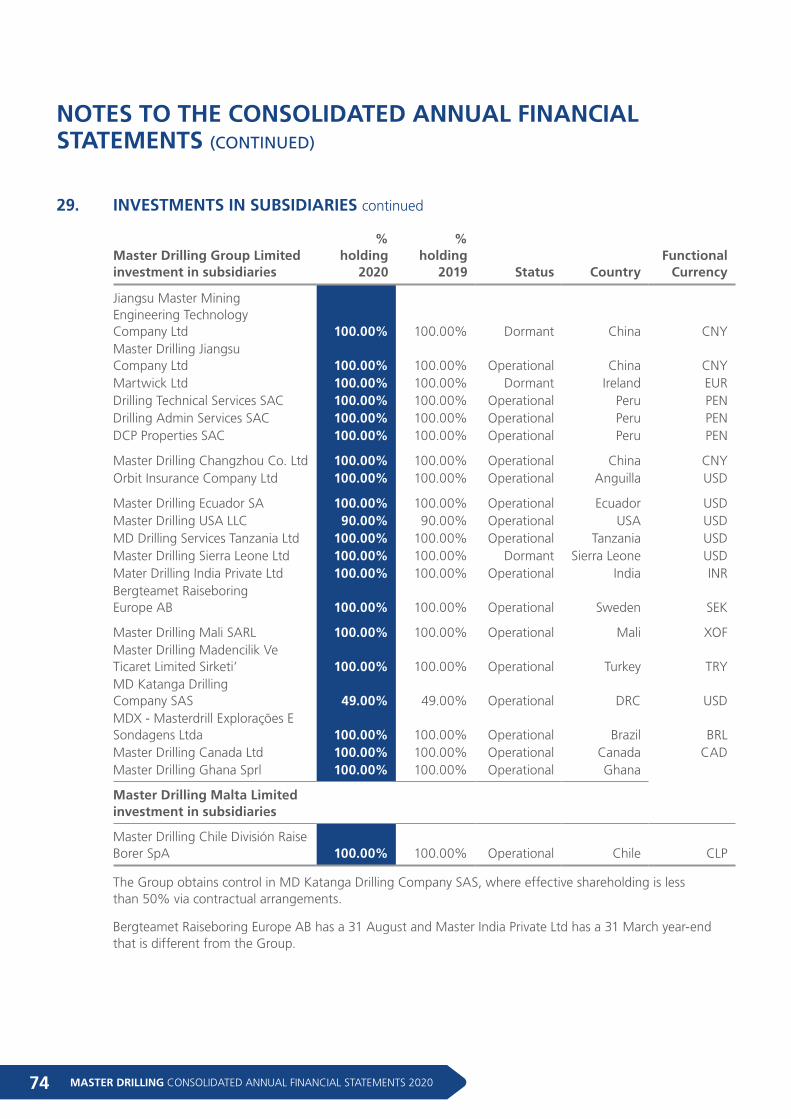
MASTER DRILLING CONSOLIDATED ANNUAL FINANCIAL STATEMENTS 202074
NOTES TO THE CONSOLIDATED ANNUAL FINANCIAL STATEMENTS (CONTINUED)
Master Drilling Group Limitedinvestment in subsidiaries
%holding
2020
%holding
2019 Status CountryFunctional
Currency
Jiangsu Master Mining Engineering Technology Company Ltd 100.00% 100.00% Dormant China CNYMaster Drilling Jiangsu Company Ltd 100.00% 100.00% Operational China CNYMartwick Ltd 100.00% 100.00% Dormant Ireland EURDrilling Technical Services SAC 100.00% 100.00% Operational Peru PENDrilling Admin Services SAC 100.00% 100.00% Operational Peru PENDCP Properties SAC 100.00% 100.00% Operational Peru PEN
Master Drilling Changzhou Co. Ltd 100.00% 100.00% Operational China CNYOrbit Insurance Company Ltd 100.00% 100.00% Operational Anguilla USD
Master Drilling Ecuador SA 100.00% 100.00% Operational Ecuador USDMaster Drilling USA LLC 90.00% 90.00% Operational USA USDMD Drilling Services Tanzania Ltd 100.00% 100.00% Operational Tanzania USDMaster Drilling Sierra Leone Ltd 100.00% 100.00% Dormant Sierra Leone USDMater Drilling India Private Ltd 100.00% 100.00% Operational India INRBergteamet Raiseboring Europe AB 100.00% 100.00% Operational Sweden SEK
Master Drilling Mali SARL 100.00% 100.00% Operational Mali XOFMaster Drilling Madencilik Ve Ticaret Limited Sirketi’ 100.00% 100.00% Operational Turkey TRYMD Katanga Drilling Company SAS 49.00% 49.00% Operational DRC USDMDX - Masterdrill Explorações E Sondagens Ltda 100.00% 100.00% Operational Brazil BRLMaster Drilling Canada Ltd 100.00% 100.00% Operational Canada CADMaster Drilling Ghana Sprl 100.00% 100.00% Operational Ghana
Master Drilling Malta Limited investment in subsidiaries
Master Drilling Chile División Raise Borer SpA 100.00% 100.00% Operational Chile CLP
The Group obtains control in MD Katanga Drilling Company SAS, where effective shareholding is less than 50% via contractual arrangements.
Bergteamet Raiseboring Europe AB has a 31 August and Master India Private Ltd has a 31 March year-end that is different from the Group.
29. INVESTMENTS IN SUBSIDIARIES continued
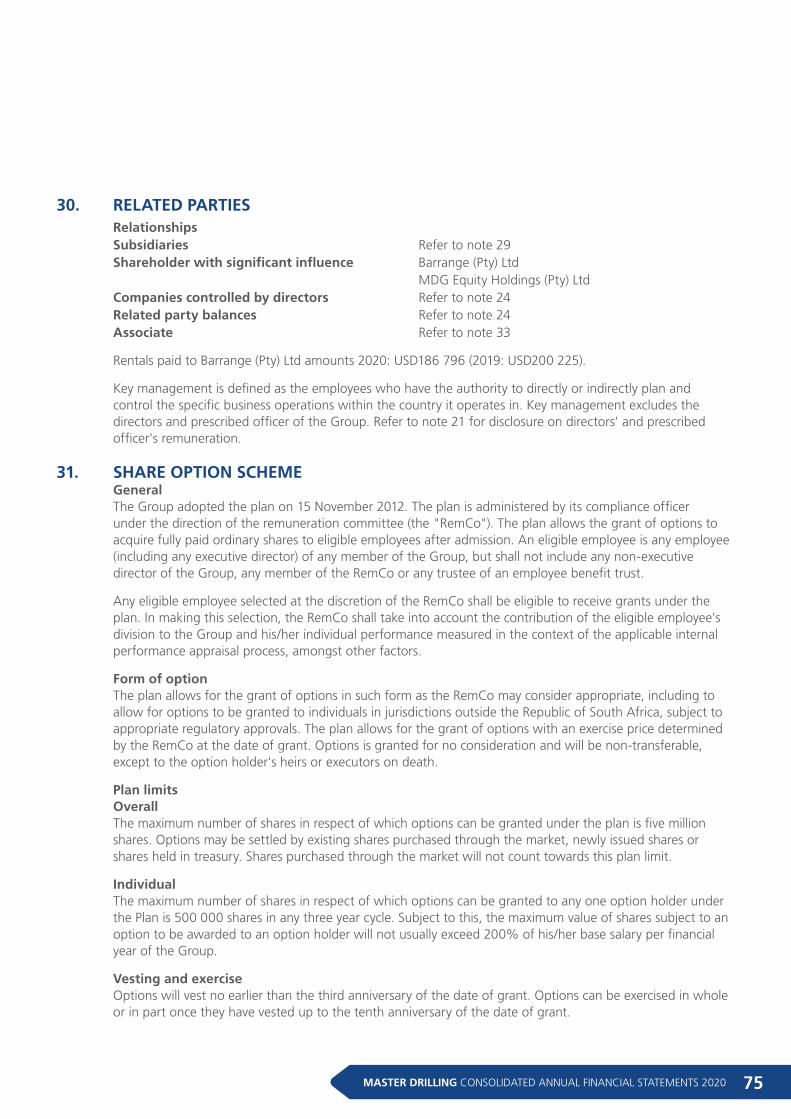
75MASTER DRILLING CONSOLIDATED ANNUAL FINANCIAL STATEMENTS 2020
30. RELATED PARTIESRelationships Subsidiaries Refer to note 29Shareholder with significant influence Barrange (Pty) Ltd MDG Equity Holdings (Pty) LtdCompanies controlled by directors Refer to note 24Related party balances Refer to note 24Associate Refer to note 33
Rentals paid to Barrange (Pty) Ltd amounts 2020: USD186 796 (2019: USD200 225).
Key management is defined as the employees who have the authority to directly or indirectly plan and control the specific business operations within the country it operates in. Key management excludes the directors and prescribed officer of the Group. Refer to note 21 for disclosure on directors' and prescribed officer's remuneration.
31. SHARE OPTION SCHEMEGeneralThe Group adopted the plan on 15 November 2012. The plan is administered by its compliance officer under the direction of the remuneration committee (the "RemCo"). The plan allows the grant of options to acquire fully paid ordinary shares to eligible employees after admission. An eligible employee is any employee (including any executive director) of any member of the Group, but shall not include any non-executive director of the Group, any member of the RemCo or any trustee of an employee benefit trust.
Any eligible employee selected at the discretion of the RemCo shall be eligible to receive grants under the plan. In making this selection, the RemCo shall take into account the contribution of the eligible employee's division to the Group and his/her individual performance measured in the context of the applicable internal performance appraisal process, amongst other factors.
Form of optionThe plan allows for the grant of options in such form as the RemCo may consider appropriate, including to allow for options to be granted to individuals in jurisdictions outside the Republic of South Africa, subject to appropriate regulatory approvals. The plan allows for the grant of options with an exercise price determined by the RemCo at the date of grant. Options is granted for no consideration and will be non-transferable, except to the option holder's heirs or executors on death.
Plan limits OverallThe maximum number of shares in respect of which options can be granted under the plan is five million shares. Options may be settled by existing shares purchased through the market, newly issued shares or shares held in treasury. Shares purchased through the market will not count towards this plan limit.
IndividualThe maximum number of shares in respect of which options can be granted to any one option holder under the Plan is 500 000 shares in any three year cycle. Subject to this, the maximum value of shares subject to an option to be awarded to an option holder will not usually exceed 200% of his/her base salary per financial year of the Group.
Vesting and exerciseOptions will vest no earlier than the third anniversary of the date of grant. Options can be exercised in whole or in part once they have vested up to the tenth anniversary of the date of grant.
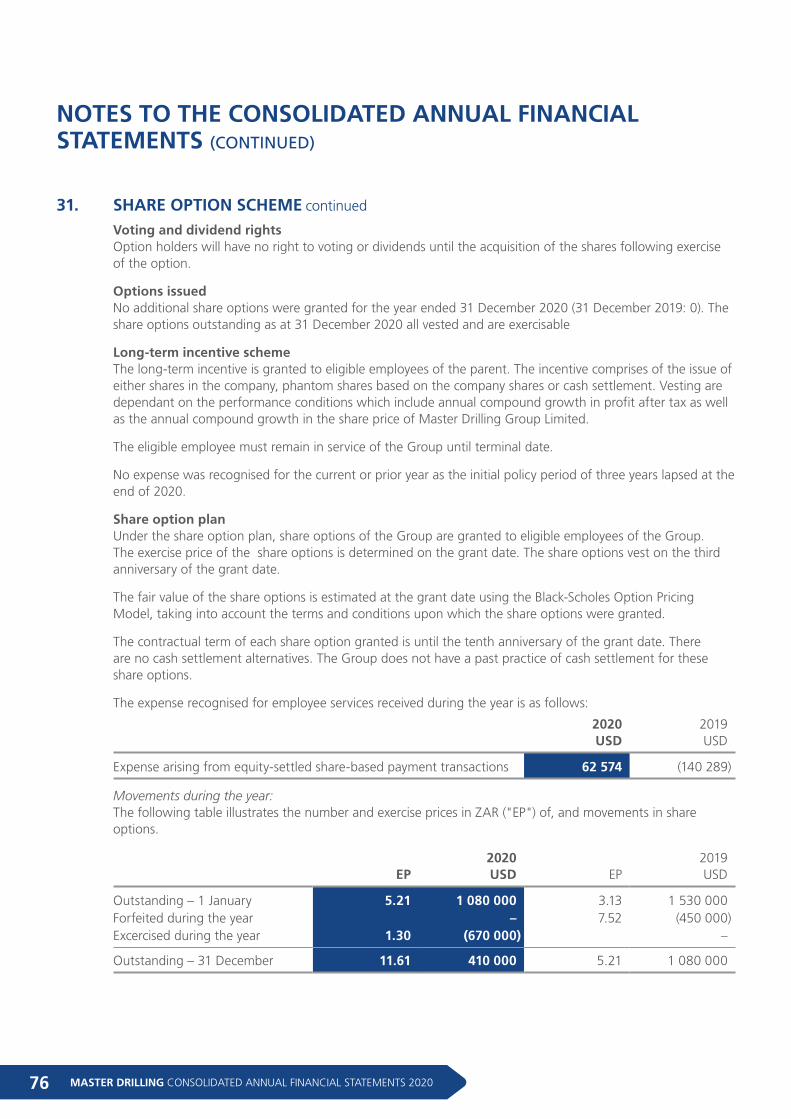
MASTER DRILLING CONSOLIDATED ANNUAL FINANCIAL STATEMENTS 202076
NOTES TO THE CONSOLIDATED ANNUAL FINANCIAL STATEMENTS (CONTINUED)
Voting and dividend rightsOption holders will have no right to voting or dividends until the acquisition of the shares following exercise of the option.
Options issuedNo additional share options were granted for the year ended 31 December 2020 (31 December 2019: 0). The share options outstanding as at 31 December 2020 all vested and are exercisable
Long-term incentive schemeThe long-term incentive is granted to eligible employees of the parent. The incentive comprises of the issue of either shares in the company, phantom shares based on the company shares or cash settlement. Vesting are dependant on the performance conditions which include annual compound growth in profit after tax as well as the annual compound growth in the share price of Master Drilling Group Limited.
The eligible employee must remain in service of the Group until terminal date.
No expense was recognised for the current or prior year as the initial policy period of three years lapsed at the end of 2020.
Share option planUnder the share option plan, share options of the Group are granted to eligible employees of the Group. The exercise price of the share options is determined on the grant date. The share options vest on the third anniversary of the grant date.
The fair value of the share options is estimated at the grant date using the Black-Scholes Option Pricing Model, taking into account the terms and conditions upon which the share options were granted.
The contractual term of each share option granted is until the tenth anniversary of the grant date. There are no cash settlement alternatives. The Group does not have a past practice of cash settlement for these share options.
The expense recognised for employee services received during the year is as follows:
2020USD
2019USD
Expense arising from equity-settled share-based payment transactions 62 574 (140 289)
Movements during the year:The following table illustrates the number and exercise prices in ZAR ("EP") of, and movements in share options.
EP2020USD EP
2019USD
Outstanding – 1 January 5.21 1 080 000 3.13 1 530 000Forfeited during the year – 7.52 (450 000)Excercised during the year 1.30 (670 000) –
Outstanding – 31 December 11.61 410 000 5.21 1 080 000
31. SHARE OPTION SCHEME continued
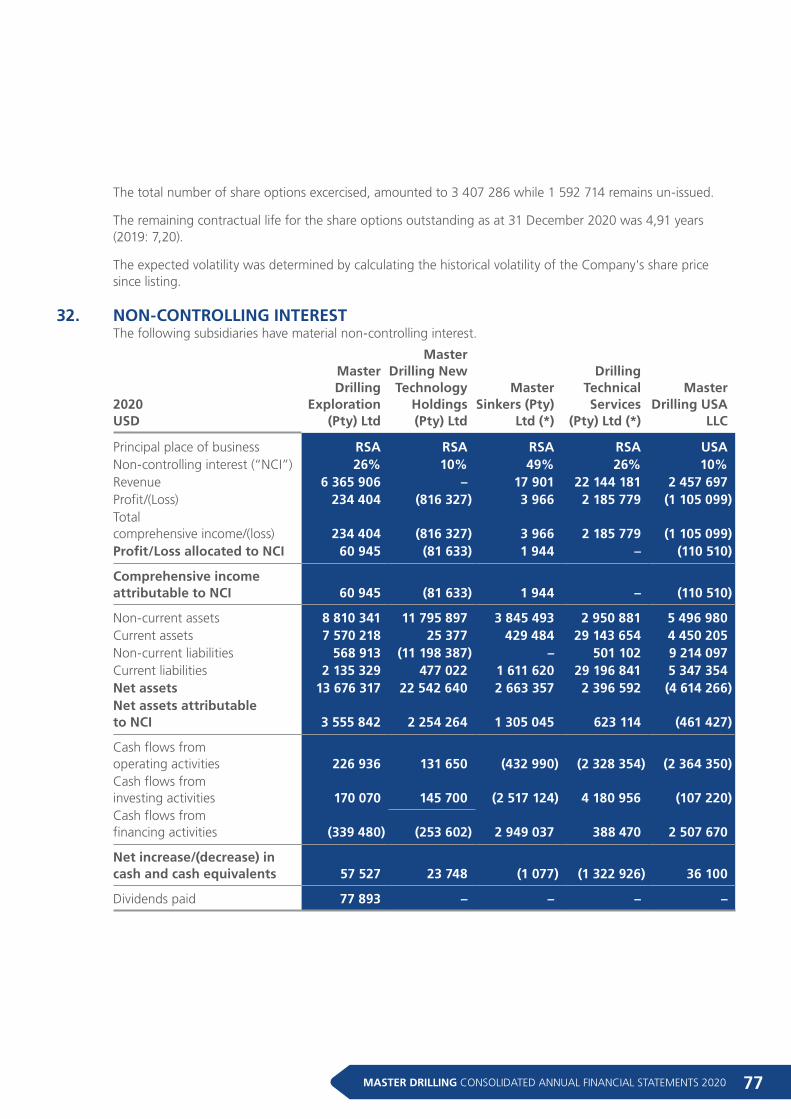
77MASTER DRILLING CONSOLIDATED ANNUAL FINANCIAL STATEMENTS 2020
The total number of share options excercised, amounted to 3 407 286 while 1 592 714 remains un-issued.
The remaining contractual life for the share options outstanding as at 31 December 2020 was 4,91 years (2019: 7,20).
The expected volatility was determined by calculating the historical volatility of the Company's share price since listing.
32. NON-CONTROLLING INTERESTThe following subsidiaries have material non-controlling interest.
2020USD
Master Drilling
Exploration (Pty) Ltd
Master Drilling New Technology
Holdings (Pty) Ltd
Master Sinkers (Pty)
Ltd (*)
Drilling Technical Services
(Pty) Ltd (*)
Master Drilling USA
LLC
Principal place of business RSA RSA RSA RSA USANon-controlling interest (“NCI”) 26% 10% 49% 26% 10%Revenue 6 365 906 – 17 901 22 144 181 2 457 697Profit/(Loss) 234 404 (816 327) 3 966 2 185 779 (1 105 099)Total comprehensive income/(loss) 234 404 (816 327) 3 966 2 185 779 (1 105 099)Profit/Loss allocated to NCI 60 945 (81 633) 1 944 – (110 510)
Comprehensive income attributable to NCI 60 945 (81 633) 1 944 – (110 510)
Non-current assets 8 810 341 11 795 897 3 845 493 2 950 881 5 496 980Current assets 7 570 218 25 377 429 484 29 143 654 4 450 205Non-current liabilities 568 913 (11 198 387) – 501 102 9 214 097Current liabilities 2 135 329 477 022 1 611 620 29 196 841 5 347 354Net assets 13 676 317 22 542 640 2 663 357 2 396 592 (4 614 266)Net assets attributable to NCI 3 555 842 2 254 264 1 305 045 623 114 (461 427)
Cash flows from operating activities 226 936 131 650 (432 990) (2 328 354) (2 364 350)Cash flows from investing activities 170 070 145 700 (2 517 124) 4 180 956 (107 220)Cash flows from financing activities (339 480) (253 602) 2 949 037 388 470 2 507 670
Net increase/(decrease) in cash and cash equivalents 57 527 23 748 (1 077) (1 322 926) 36 100
Dividends paid 77 893 – – – –
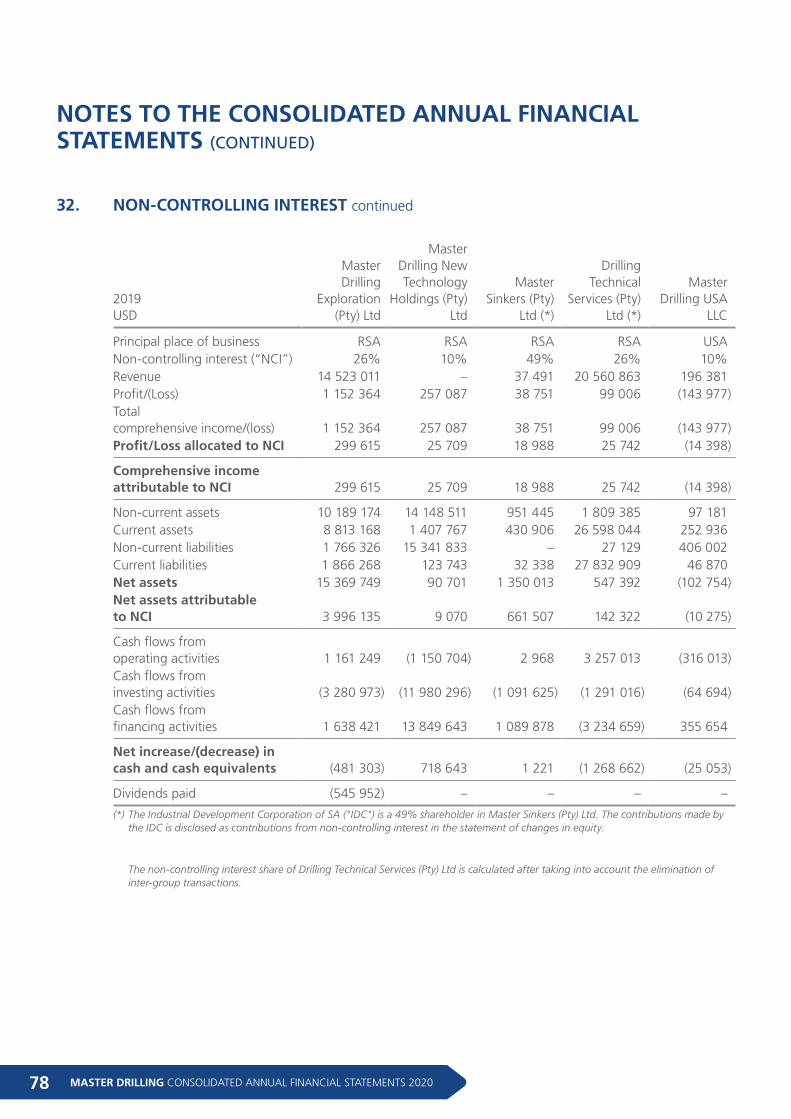
MASTER DRILLING CONSOLIDATED ANNUAL FINANCIAL STATEMENTS 202078
NOTES TO THE CONSOLIDATED ANNUAL FINANCIAL STATEMENTS (CONTINUED)
32. NON-CONTROLLING INTEREST continued
2019USD
Master Drilling
Exploration (Pty) Ltd
Master Drilling New Technology
Holdings (Pty) Ltd
Master Sinkers (Pty)
Ltd (*)
Drilling Technical
Services (Pty) Ltd (*)
Master Drilling USA
LLC
Principal place of business RSA RSA RSA RSA USANon-controlling interest (“NCI”) 26% 10% 49% 26% 10%Revenue 14 523 011 – 37 491 20 560 863 196 381Profit/(Loss) 1 152 364 257 087 38 751 99 006 (143 977)Total comprehensive income/(loss) 1 152 364 257 087 38 751 99 006 (143 977)Profit/Loss allocated to NCI 299 615 25 709 18 988 25 742 (14 398)
Comprehensive income attributable to NCI 299 615 25 709 18 988 25 742 (14 398)
Non-current assets 10 189 174 14 148 511 951 445 1 809 385 97 181Current assets 8 813 168 1 407 767 430 906 26 598 044 252 936Non-current liabilities 1 766 326 15 341 833 – 27 129 406 002Current liabilities 1 866 268 123 743 32 338 27 832 909 46 870Net assets 15 369 749 90 701 1 350 013 547 392 (102 754)Net assets attributable to NCI 3 996 135 9 070 661 507 142 322 (10 275)
Cash flows from operating activities 1 161 249 (1 150 704) 2 968 3 257 013 (316 013)Cash flows from investing activities (3 280 973) (11 980 296) (1 091 625) (1 291 016) (64 694)Cash flows from financing activities 1 638 421 13 849 643 1 089 878 (3 234 659) 355 654
Net increase/(decrease) in cash and cash equivalents (481 303) 718 643 1 221 (1 268 662) (25 053)
Dividends paid (545 952) – – – –
(*) The Industrial Development Corporation of SA ("IDC") is a 49% shareholder in Master Sinkers (Pty) Ltd. The contributions made by the IDC is disclosed as contributions from non-controlling interest in the statement of changes in equity.
The non-controlling interest share of Drilling Technical Services (Pty) Ltd is calculated after taking into account the elimination of inter-group transactions.
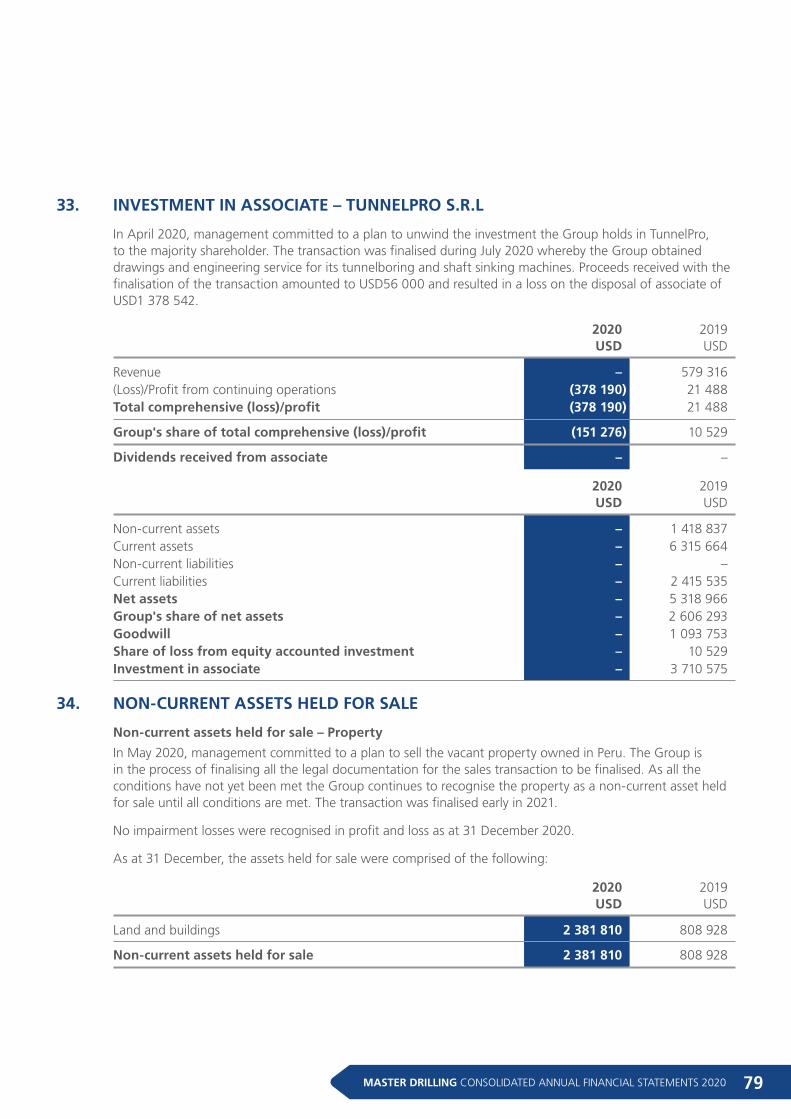
79MASTER DRILLING CONSOLIDATED ANNUAL FINANCIAL STATEMENTS 2020
33. INVESTMENT IN ASSOCIATE – TUNNELPRO S.R.L
In April 2020, management committed to a plan to unwind the investment the Group holds in TunnelPro, to the majority shareholder. The transaction was finalised during July 2020 whereby the Group obtained drawings and engineering service for its tunnelboring and shaft sinking machines. Proceeds received with the finalisation of the transaction amounted to USD56 000 and resulted in a loss on the disposal of associate of USD1 378 542.
2020USD
2019USD
Revenue – 579 316(Loss)/Profit from continuing operations (378 190) 21 488Total comprehensive (loss)/profit (378 190) 21 488
Group's share of total comprehensive (loss)/profit (151 276) 10 529
Dividends received from associate – –
2020USD
2019USD
Non-current assets – 1 418 837Current assets – 6 315 664Non-current liabilities – –Current liabilities – 2 415 535Net assets – 5 318 966Group's share of net assets – 2 606 293Goodwill – 1 093 753Share of loss from equity accounted investment – 10 529Investment in associate – 3 710 575
34. NON-CURRENT ASSETS HELD FOR SALE
Non-current assets held for sale – Property
In May 2020, management committed to a plan to sell the vacant property owned in Peru. The Group is in the process of finalising all the legal documentation for the sales transaction to be finalised. As all the conditions have not yet been met the Group continues to recognise the property as a non-current asset held for sale until all conditions are met. The transaction was finalised early in 2021.
No impairment losses were recognised in profit and loss as at 31 December 2020.
As at 31 December, the assets held for sale were comprised of the following:
2020USD
2019USD
Land and buildings 2 381 810 808 928
Non-current assets held for sale 2 381 810 808 928
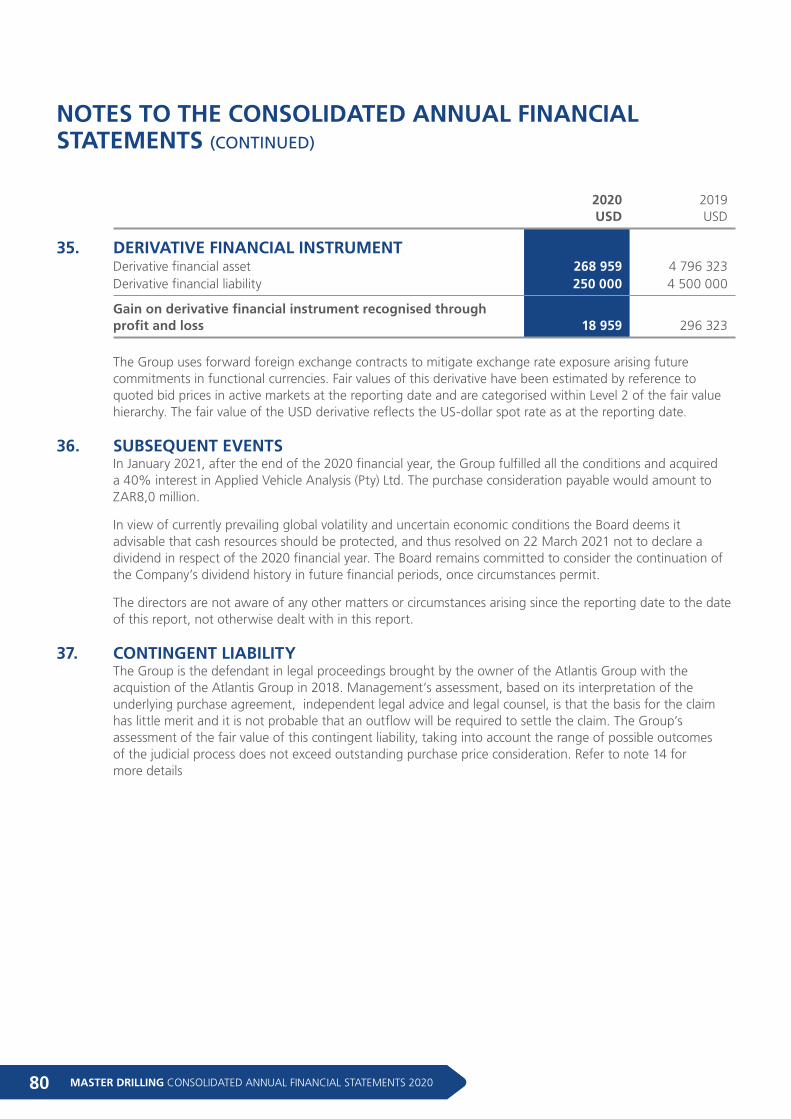
MASTER DRILLING CONSOLIDATED ANNUAL FINANCIAL STATEMENTS 202080
NOTES TO THE CONSOLIDATED ANNUAL FINANCIAL STATEMENTS (CONTINUED)
2020USD
2019USD
35. DERIVATIVE FINANCIAL INSTRUMENT
Derivative financial asset 268 959 4 796 323 Derivative financial liability 250 000 4 500 000
Gain on derivative financial instrument recognised through profit and loss 18 959 296 323
The Group uses forward foreign exchange contracts to mitigate exchange rate exposure arising future commitments in functional currencies. Fair values of this derivative have been estimated by reference to quoted bid prices in active markets at the reporting date and are categorised within Level 2 of the fair value hierarchy. The fair value of the USD derivative reflects the US-dollar spot rate as at the reporting date.
36. SUBSEQUENT EVENTSIn January 2021, after the end of the 2020 financial year, the Group fulfilled all the conditions and acquired a 40% interest in Applied Vehicle Analysis (Pty) Ltd. The purchase consideration payable would amount to ZAR8,0 million.
In view of currently prevailing global volatility and uncertain economic conditions the Board deems it advisable that cash resources should be protected, and thus resolved on 22 March 2021 not to declare a dividend in respect of the 2020 financial year. The Board remains committed to consider the continuation of the Company’s dividend history in future financial periods, once circumstances permit.
The directors are not aware of any other matters or circumstances arising since the reporting date to the date of this report, not otherwise dealt with in this report.
37. CONTINGENT LIABILITYThe Group is the defendant in legal proceedings brought by the owner of the Atlantis Group with the acquistion of the Atlantis Group in 2018. Management’s assessment, based on its interpretation of the underlying purchase agreement, independent legal advice and legal counsel, is that the basis for the claim has little merit and it is not probable that an outflow will be required to settle the claim. The Group’s assessment of the fair value of this contingent liability, taking into account the range of possible outcomes of the judicial process does not exceed outstanding purchase price consideration. Refer to note 14 for more details
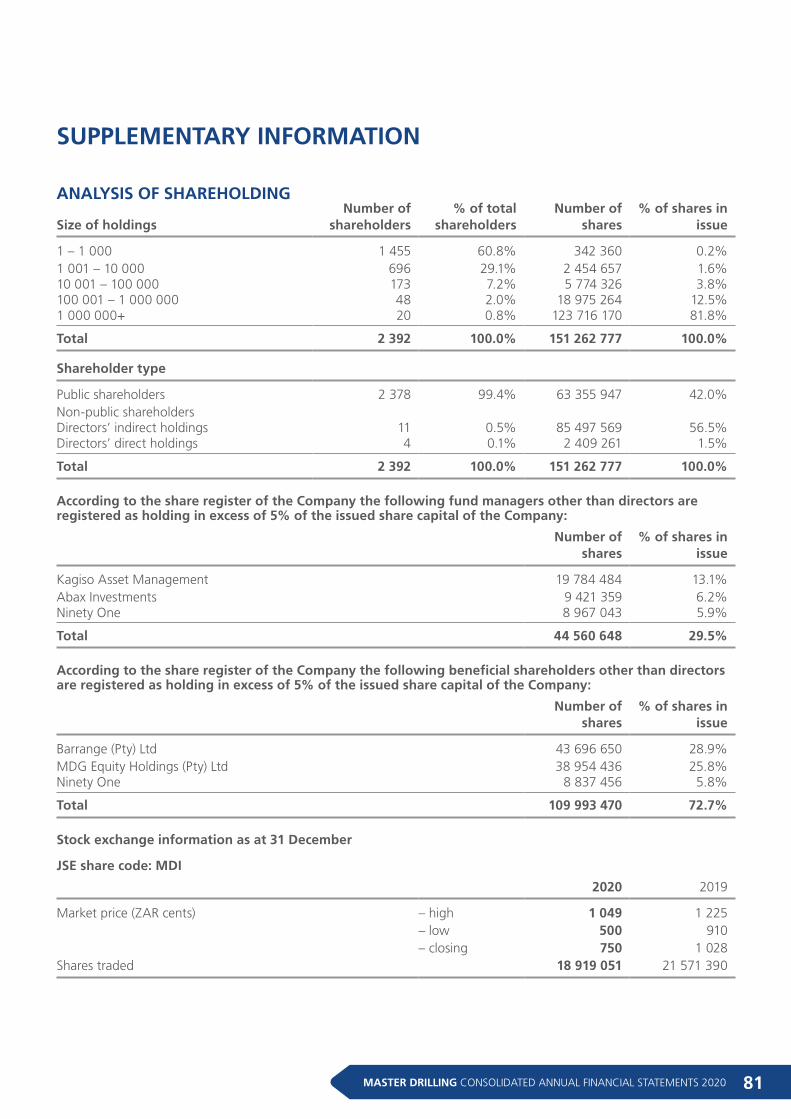
81MASTER DRILLING CONSOLIDATED ANNUAL FINANCIAL STATEMENTS 2020
ANALYSIS OF SHAREHOLDING
Size of holdingsNumber of
shareholders% of total
shareholdersNumber of
shares% of shares in
issue
1 – 1 000 1 455 60.8% 342 360 0.2%1 001 – 10 000 696 29.1% 2 454 657 1.6%10 001 – 100 000 173 7.2% 5 774 326 3.8%100 001 – 1 000 000 48 2.0% 18 975 264 12.5%1 000 000+ 20 0.8% 123 716 170 81.8%
Total 2 392 100.0% 151 262 777 100.0%
Shareholder type
Public shareholders 2 378 99.4% 63 355 947 42.0%Non-public shareholders Directors’ indirect holdings 11 0.5% 85 497 569 56.5%Directors’ direct holdings 4 0.1% 2 409 261 1.5%
Total 2 392 100.0% 151 262 777 100.0%
According to the share register of the Company the following fund managers other than directors are registered as holding in excess of 5% of the issued share capital of the Company:
Number of
shares% of shares in
issue
Kagiso Asset Management 19 784 484 13.1%Abax Investments 9 421 359 6.2%Ninety One 8 967 043 5.9%
Total 44 560 648 29.5%
According to the share register of the Company the following beneficial shareholders other than directors are registered as holding in excess of 5% of the issued share capital of the Company:
Number of
shares% of shares in
issue
Barrange (Pty) Ltd 43 696 650 28.9%MDG Equity Holdings (Pty) Ltd 38 954 436 25.8%Ninety One 8 837 456 5.8%
Total 109 993 470 72.7%
Stock exchange information as at 31 December
JSE share code: MDI
2020 2019
Market price (ZAR cents) – high 1 049 1 225 – low 500 910 – closing 750 1 028Shares traded 18 919 051 21 571 390
SUPPLEMENTARY INFORMATION
MASTER DRILLING CONSOLIDATED ANNUAL FINANCIAL STATEMENTS 202082
CORPORATE INFORMATION
MASTER DRILLING GROUP LIMITEDRegistration number: 2011/008265/06 Incorporated in the Republic of South AfricaJSE share code: MDIISIN: ZAE000171948 ||| LEI: 37890095B2AFC611E529
REGISTERED AND CORPORATE OFFICE4 Bosman StreetPO Box 902Fochville, 2515South Africa
DIRECTORS Executive Daniël (Danie) Coenraad Pretorius Chief executive officer and founderAndré Jean van Deventer Financial director and chief financial officerBarend Jacobus (Koos) Jordaan Executive directorGareth (Gary) Robert Sheppard # Chief operating officer
Non-executiveHendrik (Hennie) Roux van der Merwe Chairman and independent non-executiveAkhter Alli Deshmukh Independent non-executiveAndries Willem Brink Independent non-executive (also the lead
independent director)Octavia Matshidiso Matloa Independent non-executiveHendrik Johannes Faul Independent non-executiveShane Trevor Ferguson Non-executive# Resident in Peru
COMPANY SECRETARYAndrew Colin Beaven6 Dwars StreetKrugersdorp1739South AfricaPO Box 158, Krugersdorp, 1740South Africa
JSE SPONSORInvestec Bank Limited(Registration number: 1969/004763/06)100 Grayston Drive, SandownSandton, 2196South Africa
83MASTER DRILLING CONSOLIDATED ANNUAL FINANCIAL STATEMENTS 2020
INDEPENDENT AUDITORBDO South Africa IncorporatedSouth African member of BDO Group52 Corlett DriveIllovo2196South Africa
SHARE TRANSFER SECRETARIESComputershare Investor Services Proprietary Limited(Registration number: 2004/003647/07)Rosebank Towers, 15 Biermann AvenueRosebank, 2196(PO Box 61051, Marshalltown, 2107)South Africa
INVESTOR RELATIONS CONTACTSFrederic CornetInstinctif PartnersTelephone: +27 11 050 7504Mobile: +27 83 307 8286E-mail: [email protected]
GENERAL E-MAIL [email protected]
MASTER DRILLING WEBSITEwww.masterdrilling.com
COMPANY SECRETARIAL [email protected]
Master Drilling posts information that is important to investors on the main page of its website at www.masterdrilling.com and under the “investors” tab on the main page. The information is updated regularly and investors should visit the website to obtain important information about Master Drilling.

MASTER DRILLING CONSOLIDATED ANNUAL FINANCIAL STATEMENTS 202084

www.masterdrilling.com