Embed Size (px)
Citation preview
2015 AUDITED CONSOLIDATED ANNUAL FINANCIAL STATEMENTS
MASTER DRILLING CONSOLIDATED ANNUAL FINANCIAL STATEMENTS 20152
Directors’ responsibilities and approval 3Secretary’s certificate 4Audit committee report 5Independent auditor’s report 8Directors’ report 10Consolidated statement of financial position 14Consolidated statement of comprehensive income 15Consolidated statement of changes in equity 16Consolidated statement of cash flows 18Accounting policies 19Notes to the consolidated annual financial statements 35Corporate information 71
TABLE OF CONTENTS
3MASTER DRILLING CONSOLIDATED ANNUAL FINANCIAL STATEMENTS 2015
DIRECTORS’ RESPONSIBILITIES AND APPROVAL
The directors of Master Drilling Group (“the Group”) are required in terms of the Companies Act No. 71 of 2008 (“Companies Act”), to maintain adequate accounting records and are responsible for the preparation, the content and integrity of the Group’s annual financial statements and related financial information included in this report. It is their responsibility to ensure that the Group’s annual financial statements fairly present the state of affairs of the Group as at the end of the financial year and the results of its operations and cash flows for the year then ended, in conformity with International Financial Reporting Standards (“IFRS”), the Companies Act and the Johannesburg Stock Exchange (“JSE”) Listings Requirements. The external auditors are engaged to express an independent opinion on the Group’s financial statements.
The Group’s annual financial statements are prepared in accordance with IFRS, and the South African Institute of Chartered Accountants (“SAICA”) Financial Reporting Guides as issued by the Accounting Practices Committee and Financial Reporting Pronouncements as issued by the Financial Reporting Standards Council, and are based upon appropriate accounting policies consistently applied and supported by reasonable and prudent judgements and estimates.
The audited financial statements have been prepared by the corporate reporting staff, headed by Elzaan Swanepoel CA(SA), the Group’s Management Accountant. This process was supervised by André Jean van Deventer CA(SA), the Group’s chief financial officer.
The directors acknowledge that they are ultimately responsible for the system of internal financial control established by the Group and place considerable importance on maintaining a strong control environment. To enable the directors to meet these responsibilities, the directors set standards for internal control aimed at reducing the risk of error or loss in a cost-effective manner. The standards include the proper delegation of responsibilities within a clearly-defined framework, effective accounting procedures and adequate segregation of duties to ensure an acceptable level of risk. These controls are monitored throughout the Group and all employees are required to maintain the highest ethical standards in ensuring the Group’s business is conducted in a manner that in all reasonable circumstances, is above reproach. While operating risk cannot be fully eliminated, the Group endeavours to minimise it by ensuring that appropriate infrastructure, controls, systems and ethical behaviour are applied and managed within predetermined procedures and constraints.
Based on the information and explanations provided by management, the directors are of the opinion that the system of internal control provides reasonable assurance that the financial records may be relied on for the preparation of the financial statements. However, any system of internal financial control can provide only reasonable, and not absolute, assurance against material misstatement or loss.
The directors have reviewed the Group’s cash flow forecast for the year to 31 December 2016 and, in the light of this review and the current financial position, they are satisfied that the Group has access to adequate resources to continue in operational existence for the foreseeable future.
The directors are responsible for the financial affairs of the Group.
The external auditors are responsible for independently auditing and reporting on the Group’s annual financial statements. In accordance with section 29(1)(e)(ii) of the Companies Act, the annual financial statements of the Group, for the year ended 31 December 2015, have been audited by Grant Thornton, the Group’s independent external auditors, whose unqualified audit report can be found on pages 8 to 9 of this document.
MASTER DRILLING CONSOLIDATED ANNUAL FINANCIAL STATEMENTS 20154
The Group’s annual financial statements set out on pages 3 to 69, which have been prepared on the going concern basis, were approved by the directors on 29 March 2016 and were signed on its behalf by:
Daniël Coenraad Pretorius André Jean van Deventer
Director Director
Johannesburg Johannesburg
29 March 2016 29 March 2016
SECRETARY’S CERTIFICATE
In my capacity as company secretary, I hereby certify that in terms of section 88(2)(e) of the Companies Act, that for the year ended 31 December 2015, the Group has lodged with the Companies and Intellectual Property Commission, all such returns and notices as are required of a public company in terms of the Companies Act, and that all such returns and notices are true, correct and up-to-date.
Andrew Colin Beaven
Company Secretary
6 Dwars StreetKrugersdorp174129 March 2016
DIRECTORS’ RESPONSIBILITIES AND APPROVAL (CONTINUED)
5MASTER DRILLING CONSOLIDATED ANNUAL FINANCIAL STATEMENTS 2015
AUDIT COMMITTEE REPORT
This report is provided by the audit committee in respect of the 2015 financial period of the Group. The Group’s audit committee is established as a statutory committee in terms of section 94(2) of the Companies Act and oversees audit committee matters for all of the South African subsidiaries within the Group, as permitted by section 94(2)(a) of the Companies Act.
The audit committee’s operation is guided by a detailed charter, a copy of which can be found on the group’s website (www.masterdrilling.com). The Audit Committee Charter was informed by the Companies Act, JSE Listing Requirements as well as the Corporate Governance Principles under King III and approved by the directors. The Audit Committee Charter is reviewed on an annual basis.
MEMBERSHIPThe audit committee consisted of three non-executive directors of which two were independent at all times during the year. On 12 November 2015, Johan Louis Botha was appointed as an additional independent member of the audit committee. The members therefore comprise of JP de Wet (Chairman), AA Deshmukh, ST Ferguson and JL Botha. In addition, the chief financial officer, risk manager, as well as the internal and external auditors are permanent invitees to the audit committee meetings. The audit committee meets at least four times a year and details of attendance are contained in the governance report of the integrated report which will be released end of March 2016.
DUTIES AND RESPONSIBILITIESThe audit committee has executed its duties and responsibilities during the period in accordance with its charter as they relate to the Group’s accounting, internal auditing, internal control and financial reporting practices.
During the period under review:
In respect of the external auditor and the external audit, the audit committee, amongst other matters:
• nominated Grant Thornton as the external auditor for the financial period ended 31 December 2016; • ensured that the appointment of the external auditor complied with all applicable legal and
regulatory requirements for the appointment of an auditor. The audit committee confirms that the auditor is accredited by the JSE;
• approved the external audit engagement letter, the plan and the budgeted audit fees payable to the external auditor for 2015;
• obtained an annual written statement from the auditor that its independence was not impaired;• determined the nature and extent of all non-audit services provided by the external auditor and approved
the applicable non-audit services undertaken in terms of the audit charter;• considered whether any reportable irregularities were identified and reported by the external auditors in terms
of the Auditing Profession Act, 2005, and determined that there were none; and• nominated the external auditor for both the holding and subsidiary companies.
In respect of the annual financial statements, the audit committee, amongst other matters:
• confirmed the going concern as the basis of preparation of the annual financial statements;• examined and reviewed the annual financial statements, as well as all financial information disclosed to the
public prior to submission and approval by the directors;• ensured that the annual financial statements fairly present the financial position of the Group as at the end of
the period and the results of operations and cash flows for the financial period;• considered the appropriateness of the accounting policies adopted and changes thereto;• reviewed the external auditor’s audit report;• reviewed the representation letter relating to the annual financial statements which was signed by
management; and
for the year ended 31 December 2015
MASTER DRILLING CONSOLIDATED ANNUAL FINANCIAL STATEMENTS 20156
• considered any problems identified and reviewed any significant legal and tax matters that could have a material impact on the annual financial statements.
In respect of internal financial control and internal audit, the audit committee, amongst other matters:
• reviewed the Group’s system of internal financial control during the year under review, with input and reports from the independent internal auditors. The audit committee confirmed that there were no material areas of concern that would render the internal financial controls ineffective;
• appointed an internal auditor with the necessary international presence to ensure effective service delivery to the audit committee; and
• reviewed internal audit reports and deliberated on the audit findings of the internal auditor as part of the internal audit work program.
In respect of legal and regulatory requirements, to the extent that it may have an impact on the annual financial statements, the audit committee:
• reviewed legal matters with management that could have a material effect on the Group; and• considered reports provided by management and the external auditor regarding compliance with legal
and regulatory requirements.
In respect of the co-ordination of assurance activities, the audit committee reviewed the plans and outcomes and concluded that the assurance activities are adequate to address all significant financial risks facing the business.
In respect of the company's integrated report, the audit committee collaborated with the risk, social, ethics and sustainability, remuneration and company's governance committees' to ensure the accuracy and completeness of the report.
In addition, the audit committee:
• considered the expertise, resources and experience of the finance function and concluded that these were appropriate; and
• considered the experience and expertise of the chief financial officer and concluded that these were appropriate.
INDEPENDENCE OF THE EXTERNAL AUDITORThe audit committee is satisfied that Grant Thornton is independent of the Group after taking the following factors into account:
• representations made by Grant Thornton to the audit committee;• the auditor does not, except as external auditor or in rendering permitted non-audit services, receive
any remuneration or other benefit from the Group;• the external auditor’s independence was not impaired by any consultancy, advisory or other work undertaken
by the external auditor;• the external auditor’s independence was not prejudiced as a result of any previous appointment as external
auditor; and• the criteria specified for independence by the Independent Regulatory Board for Auditors and
international regulatory bodies.
AUDIT COMMITTEE REPORT (CONTINUED)
7MASTER DRILLING CONSOLIDATED ANNUAL FINANCIAL STATEMENTS 2015
ANNUAL FINANCIAL STATEMENTSFollowing the review by the audit committee of the annual financial statements of the Group for the period ended 31 December 2015, the audit committee is of the view that, in all material aspects, they comply with the relevant provisions of the Companies Act and IFRS and fairly present the consolidated position at that date and the results of operations and cash flows for the period then ended.
Having satisfied itself in all respects, the audit committee has recommended the financial statements, for the period ended 31 December 2015, for approval to the directors. The directors have subsequently approved the financial statements, which will be open for consideration at the forthcoming annual general meeting.
On behalf of the audit committee
J P de Wet
Chairman of the audit committee
Johannesburg
29 March 2016
MASTER DRILLING CONSOLIDATED ANNUAL FINANCIAL STATEMENTS 20158
INDEPENDENT AUDITOR’S REPORT
To the shareholders of Master Drilling Group LimitedWe have audited the consolidated financial statements of Master Drilling Group Limited set out on pages 14 to 69, which comprise the statement of financial position as at 31 December 2015, and the statement of comprehensive income, statement of changes in equity and statement of cash flows for the year then ended, and the notes, comprising a summary of significant accounting policies and other explanatory information.
Directors’ responsibility for the financial statementsThe Company’s directors are responsible for the preparation and fair presentation of these consolidated financial statements, in accordance with International Financial Reporting Standards and the requirements of the Companies Act of South Africa, and for such internal control as the directors determine is necessary to enable the preparation of consolidated financial statements that are free from material misstatements, whether due to fraud or error.
Auditor’s responsibilityOur responsibility is to express an opinion on these consolidated financial statements based on our audit. We conducted our audit in accordance with International Standards on Auditing. Those Standards require that we comply with ethical requirements and plan and perform the audit to obtain reasonable assurance about whether the consolidated financial statements are free from material misstatement.
An audit involves performing procedures to obtain audit evidence about the amounts and disclosures in the financial statements.
The procedures selected depend on the auditor’s judgement, including the assessment of the risks of material misstatement of the financial statements, whether due to fraud or error. In making those risk assessments, the auditor considers internal control relevant to the entity’s preparation and fair presentation of the financial statements in order to design audit procedures that are appropriate in the circumstances, but not for the purpose of expressing an opinion on the effectiveness of the entity’s internal control. An audit also includes evaluating the appropriateness of accounting policies used and the reasonableness of accounting estimates made by management, as well as evaluating the overall presentation of the financial statements.
We believe that the audit evidence we have obtained is sufficient and appropriate to provide a basis for our audit opinion.
OpinionIn our opinion, the consolidated financial statements present fairly, in all material respects, the consolidated financial position of Master Drilling Group Limited as at 31 December 2015, and its consolidated financial performance and consolidated cash flows for the period then ended in accordance with International Financial Reporting Standards, and the requirements of the Companies Act of South Africa.
9MASTER DRILLING CONSOLIDATED ANNUAL FINANCIAL STATEMENTS 2015
Other reports required by the Companies ActAs part of our audit of the consolidated financial statements for the period ended 31 December 2015, we have read the Directors’ Report, Audit and Risk Committees’ Report and Company Secretary’s Certificate for the purpose of identifying whether there are material inconsistencies between these reports and the audited consolidated financial statements. These reports are the responsibility of the respective preparers. Based on reading these reports we have not identified material inconsistencies between these reports and the audited consolidated financial statements. However, we have not audited these reports and, accordingly, do not express an opinion on these reports.
Report on Other Legal and Regulatory Requirements In terms of the IRBA Rule published in Government Gazette Number 39475 dated 4 December 2015, we report that Grant Thornton has been the auditor of Master Drilling Group Limited for four years.
Grant Thornton Johannesburg Partnership
Chartered Accountants (SA)
Registered Auditors
J Barradas
Partner
Chartered Accountant (SA)
Registered Auditor
52 Corlett Drive
Illovo
2196
29 March 2016
MASTER DRILLING CONSOLIDATED ANNUAL FINANCIAL STATEMENTS 201510
DIRECTORS’ REPORT
NATURE OF BUSINESS Master Drilling Group Limited is an investment holding company, whose subsidiary companies provide specialised drilling services to blue chip, major and mid-tier companies in the mining, civil engineering, building construction and hydro energy sectors, across a number of commodities.
GOING CONCERN BASIS OF ACCOUNTINGThe annual financial statements have been prepared on the basis of accounting policies, applicable to a going concern. This basis presumes that funds will be available to finance future operations and that the realisation of assets and settlement of liabilities, contingent obligations and commitments will occur in the ordinary course of business.
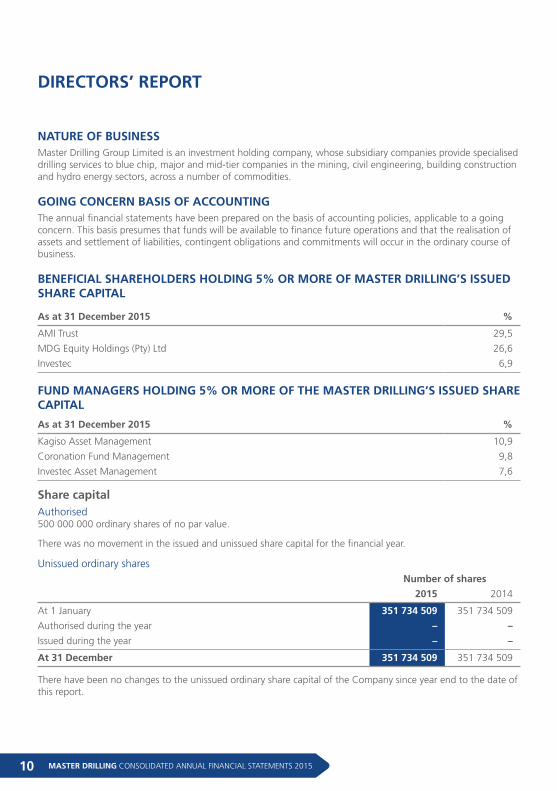
BENEFICIAL SHAREHOLDERS HOLDING 5% OR MORE OF MASTER DRILLING’S ISSUED SHARE CAPITAL
As at 31 December 2015 %
AMI Trust 29,5
MDG Equity Holdings (Pty) Ltd 26,6
Investec 6,9
FUND MANAGERS HOLDING 5% OR MORE OF THE MASTER DRILLING’S ISSUED SHARE CAPITAL
As at 31 December 2015 %
Kagiso Asset Management 10,9
Coronation Fund Management 9,8
Investec Asset Management 7,6
Share capitalAuthorised500 000 000 ordinary shares of no par value.
There was no movement in the issued and unissued share capital for the financial year.
Unissued ordinary shares Number of shares
2015 2014
At 1 January 351 734 509 351 734 509
Authorised during the year – –
Issued during the year – –
At 31 December 351 734 509 351 734 509
There have been no changes to the unissued ordinary share capital of the Company since year end to the date of this report.
11MASTER DRILLING CONSOLIDATED ANNUAL FINANCIAL STATEMENTS 2015
RIGHTS ATTACHING TO SHARESAll of the authorised and issued ordinary shares are of the same class, and rank pari passu with each other and are fully paid. Accordingly, no share has any special rights to dividends, capital or profits of the Company. No share has any preferential voting, exchange or conversion rights. The rights attaching to the shares may only be varied by a special resolution passed by the requisite majority of the Company’s shareholders at a general meeting.
CONTROL OF SHARE CAPITALIn accordance with the Memorandum of Incorporation, the authorised but unissued ordinary shares of the Company are under the control of the directors, subject to the provisions of the Companies Act and the JSE Listings Requirements.
In terms of the JSE Listings Requirements and as permitted by the Memorandum of Incorporation of the Company, the shareholders of the Company have authorised the directors to issue ordinary shares held under their control for cash, subject to certain restrictions as set out below:
1. This authority shall be limited to a maximum number of 7 413 275 ordinary shares (being 5% of the issued ordinary shares in the share capital of the Company);
2. This authority shall only be valid until the next annual general meeting of the Company but shall not extend beyond 15 months:
3. An announcement, in compliance with section 11.22 of the Listings Requirements of the JSE Limited, shall be published after any issue representing, on a cumulative basis within the period contemplated as in paragraph 2 above, 5% (7 413 275) of the number of ordinary shares in issue prior to the issue concerned excluding treasury shares; and
4. In the event of a sub-division or consolidation of issued ordinary shares during the period contemplated as per paragraph 2 above, this authority must be adjusted accordingly to represent the same allocation ratio.
5. In determining the price at which an issue of ordinary shares for cash shall be made in terms of this authority, the maximum discount permitted shall be 10% of the weighted average traded price of the ordinary shares on the JSE Limited over the 30 business days prior to the date that the price of the issue is agreed between the Company and the party subscribing for the securities; and
6. Any issue of ordinary shares under this authority shall be made only to a public shareholder, as defined in the Listings Requirements of the JSE Limited.
7. Any equity securities issued under the authority during the period contemplated in paragraph 2 above, must be deducted from such number in 5 above.
There were no repurchases of ordinary shares during the period under review.
MASTER DRILLING CONSOLIDATED ANNUAL FINANCIAL STATEMENTS 201512
DIRECTORS’ REPORT (CONTINUED)
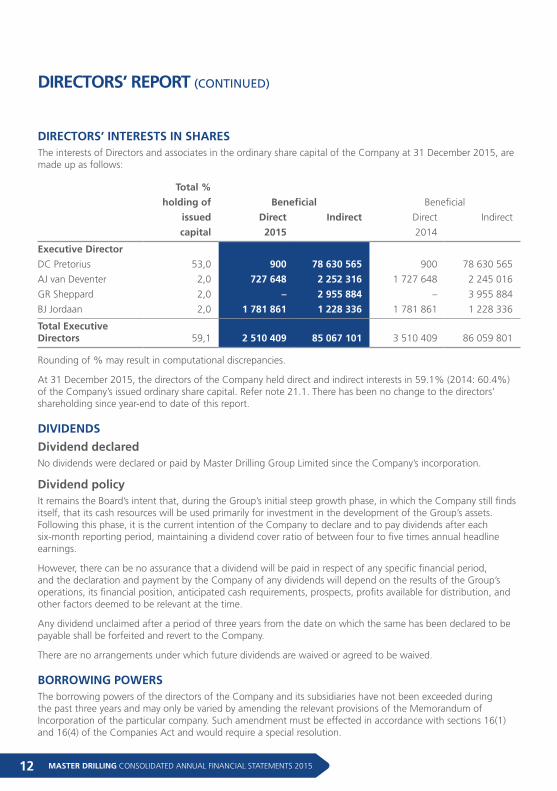
DIRECTORS’ INTERESTS IN SHARESThe interests of Directors and associates in the ordinary share capital of the Company at 31 December 2015, are made up as follows:
Total %
holding of Beneficial Beneficial
issued Direct Indirect Direct Indirect
capital 2015 2014
Executive Director
DC Pretorius 53,0 900 78 630 565 900 78 630 565
AJ van Deventer 2,0 727 648 2 252 316 1 727 648 2 245 016
GR Sheppard 2,0 – 2 955 884 – 3 955 884
BJ Jordaan 2,0 1 781 861 1 228 336 1 781 861 1 228 336
Total Executive Directors 59,1 2 510 409 85 067 101 3 510 409 86 059 801
Rounding of % may result in computational discrepancies.
At 31 December 2015, the directors of the Company held direct and indirect interests in 59.1% (2014: 60.4%) of the Company’s issued ordinary share capital. Refer note 21.1. There has been no change to the directors’ shareholding since year-end to date of this report.
DIVIDENDS
Dividend declaredNo dividends were declared or paid by Master Drilling Group Limited since the Company’s incorporation.
Dividend policyIt remains the Board’s intent that, during the Group’s initial steep growth phase, in which the Company still finds itself, that its cash resources will be used primarily for investment in the development of the Group’s assets. Following this phase, it is the current intention of the Company to declare and to pay dividends after each six-month reporting period, maintaining a dividend cover ratio of between four to five times annual headline earnings.
However, there can be no assurance that a dividend will be paid in respect of any specific financial period, and the declaration and payment by the Company of any dividends will depend on the results of the Group’s operations, its financial position, anticipated cash requirements, prospects, profits available for distribution, and other factors deemed to be relevant at the time.
Any dividend unclaimed after a period of three years from the date on which the same has been declared to be payable shall be forfeited and revert to the Company.
There are no arrangements under which future dividends are waived or agreed to be waived.
BORROWING POWERSThe borrowing powers of the directors of the Company and its subsidiaries have not been exceeded during the past three years and may only be varied by amending the relevant provisions of the Memorandum of Incorporation of the particular company. Such amendment must be effected in accordance with sections 16(1) and 16(4) of the Companies Act and would require a special resolution.
13MASTER DRILLING CONSOLIDATED ANNUAL FINANCIAL STATEMENTS 2015
The directors of Master Drilling Do Brasil Ltda are restricted from borrowing any amount equal or above US$300,000 without the approval of its majority shareholder, Master Drilling International. Other than this restriction, there are no restrictions on the borrowing powers of the Company or any of its other subsidiaries.
LEGAL PROCEEDINGSThere are no governmental, legal or arbitration proceedings, including any proceedings that are pending or threatened, of which Master Drilling is aware, that may have or have had in the recent past, being at least the previous 12 months, a material effect on the Group’s financial position.
The Company is not a party to unduly funding arrangements.
MATERIAL CHANGEThe financial and trading position of Master Drilling Group Limited has not materially changed for the financial year.
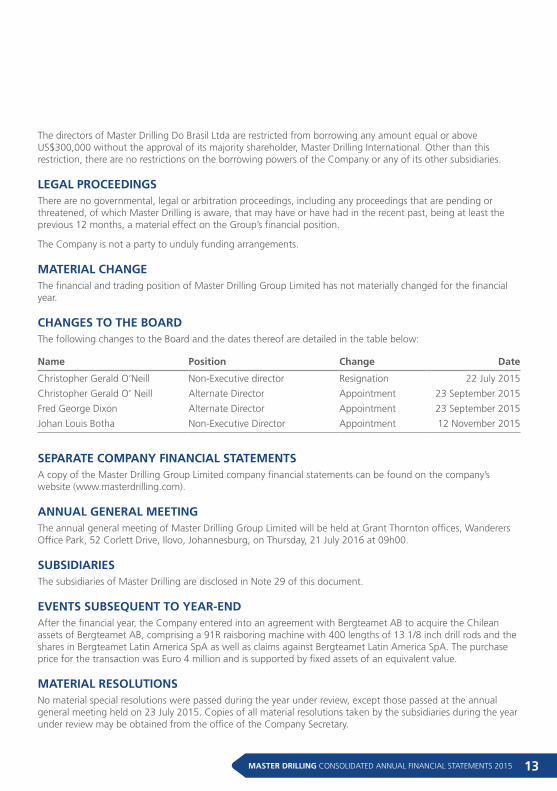
CHANGES TO THE BOARDThe following changes to the Board and the dates thereof are detailed in the table below:
Name Position Change Date
Christopher Gerald O’Neill Non-Executive director Resignation 22 July 2015
Christopher Gerald O’ Neill Alternate Director Appointment 23 September 2015
Fred George Dixon Alternate Director Appointment 23 September 2015
Johan Louis Botha Non-Executive Director Appointment 12 November 2015
SEPARATE COMPANY FINANCIAL STATEMENTSA copy of the Master Drilling Group Limited company financial statements can be found on the company’s website (www.masterdrilling.com).
ANNUAL GENERAL MEETINGThe annual general meeting of Master Drilling Group Limited will be held at Grant Thornton offices, Wanderers Office Park, 52 Corlett Drive, Ilovo, Johannesburg, on Thursday, 21 July 2016 at 09h00.
SUBSIDIARIESThe subsidiaries of Master Drilling are disclosed in Note 29 of this document.
EVENTS SUBSEQUENT TO YEAR-ENDAfter the financial year, the Company entered into an agreement with Bergteamet AB to acquire the Chilean assets of Bergteamet AB, comprising a 91R raisboring machine with 400 lengths of 13 1/8 inch drill rods and the shares in Bergteamet Latin America SpA as well as claims against Bergteamet Latin America SpA. The purchase price for the transaction was Euro 4 million and is supported by fixed assets of an equivalent value.
MATERIAL RESOLUTIONSNo material special resolutions were passed during the year under review, except those passed at the annual general meeting held on 23 July 2015. Copies of all material resolutions taken by the subsidiaries during the year under review may be obtained from the office of the Company Secretary.
MASTER DRILLING CONSOLIDATED ANNUAL FINANCIAL STATEMENTS 201514
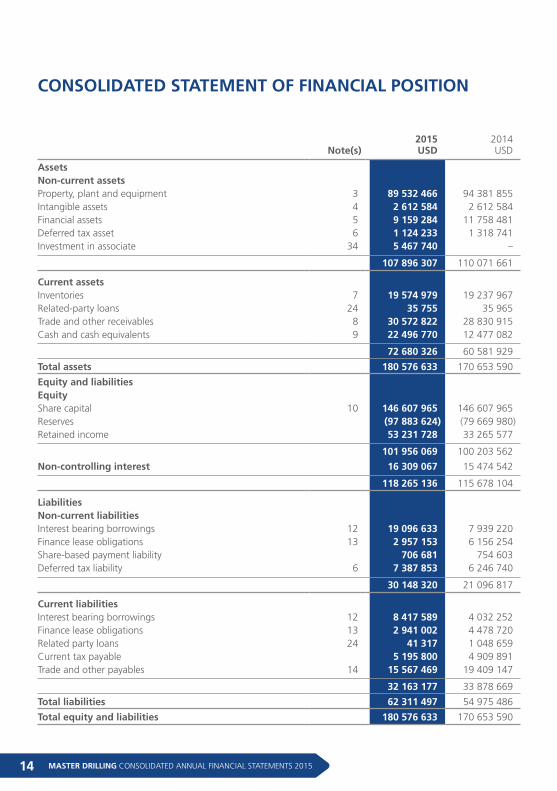
2015 2014 Note(s) USD USD
Assets Non-current assets Property, plant and equipment 3 89 532 466 94 381 855Intangible assets 4 2 612 584 2 612 584Financial assets 5 9 159 284 11 758 481Deferred tax asset 6 1 124 233 1 318 741Investment in associate 34 5 467 740 –
107 896 307 110 071 661
Current assets Inventories 7 19 574 979 19 237 967Related-party loans 24 35 755 35 965Trade and other receivables 8 30 572 822 28 830 915Cash and cash equivalents 9 22 496 770 12 477 082
72 680 326 60 581 929
Total assets 180 576 633 170 653 590
Equity and liabilities Equity Share capital 10 146 607 965 146 607 965Reserves (97 883 624) (79 669 980)Retained income 53 231 728 33 265 577
101 956 069 100 203 562
Non-controlling interest 16 309 067 15 474 542
118 265 136 115 678 104
Liabilities Non-current liabilities Interest bearing borrowings 12 19 096 633 7 939 220Finance lease obligations 13 2 957 153 6 156 254Share-based payment liability 706 681 754 603Deferred tax liability 6 7 387 853 6 246 740
30 148 320 21 096 817
Current liabilities Interest bearing borrowings 12 8 417 589 4 032 252Finance lease obligations 13 2 941 002 4 478 720Related party loans 24 41 317 1 048 659Current tax payable 5 195 800 4 909 891Trade and other payables 14 15 567 469 19 409 147
32 163 177 33 878 669
Total liabilities 62 311 497 54 975 486
Total equity and liabilities 180 576 633 170 653 590
CONSOLIDATED STATEMENT OF FINANCIAL POSITION
15MASTER DRILLING CONSOLIDATED ANNUAL FINANCIAL STATEMENTS 2015
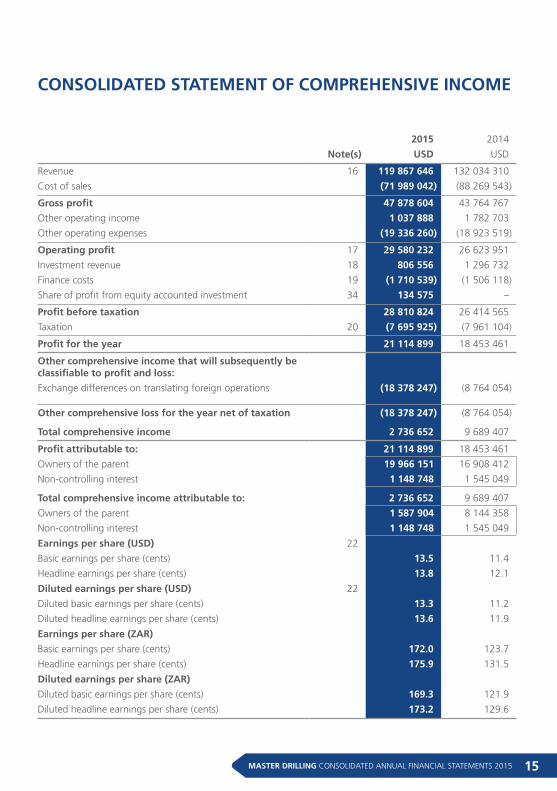
CONSOLIDATED STATEMENT OF COMPREHENSIVE INCOME
2015 2014
Note(s) USD USD
Revenue 16 119 867 646 132 034 310
Cost of sales (71 989 042) (88 269 543)
Gross profit 47 878 604 43 764 767
Other operating income 1 037 888 1 782 703
Other operating expenses (19 336 260) (18 923 519)
Operating profit 17 29 580 232 26 623 951
Investment revenue 18 806 556 1 296 732
Finance costs 19 (1 710 539) (1 506 118)
Share of profit from equity accounted investment 34 134 575 –
Profit before taxation 28 810 824 26 414 565
Taxation 20 (7 695 925) (7 961 104)
Profit for the year 21 114 899 18 453 461
Other comprehensive income that will subsequently be classifiable to profit and loss:
Exchange differences on translating foreign operations (18 378 247) (8 764 054)
Other comprehensive loss for the year net of taxation (18 378 247) (8 764 054)
Total comprehensive income 2 736 652 9 689 407
Profit attributable to: 21 114 899 18 453 461
Owners of the parent 19 966 151 16 908 412
Non-controlling interest 1 148 748 1 545 049
Total comprehensive income attributable to: 2 736 652 9 689 407
Owners of the parent 1 587 904 8 144 358
Non-controlling interest 1 148 748 1 545 049
Earnings per share (USD) 22
Basic earnings per share (cents) 13.5 11.4
Headline earnings per share (cents) 13.8 12.1
Diluted earnings per share (USD) 22
Diluted basic earnings per share (cents) 13.3 11.2
Diluted headline earnings per share (cents) 13.6 11.9
Earnings per share (ZAR)
Basic earnings per share (cents) 172.0 123.7
Headline earnings per share (cents) 175.9 131.5
Diluted earnings per share (ZAR)
Diluted basic earnings per share (cents) 169.3 121.9
Diluted headline earnings per share (cents) 173.2 129.6
MASTER DRILLING CONSOLIDATED ANNUAL FINANCIAL STATEMENTS 201516
USDShare
capital
Equity dueto change
in control ofinterests
Foreigncurrency
translationreserve
Share-basedpayments
reserveTotal
reservesRetained
income
Attributableto owners of
the parent
Non-controlling
interest
TotalShareholders'
equity
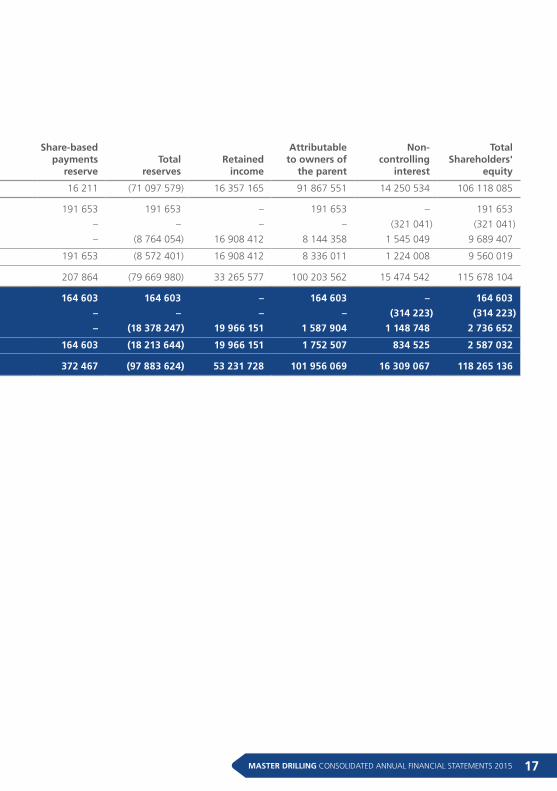
Balance as at 31 December 2013 146 607 965 (58 264 013) (12 849 777) 16 211 (71 097 579) 16 357 165 91 867 551 14 250 534 106 118 085
Share-based payments – – – 191 653 191 653 – 191 653 – 191 653
Dividends declared by subsidiaries – – – – – – – (321 041) (321 041)
Total comprehensive income for the year – – (8 764 054) – (8 764 054) 16 908 412 8 144 358 1 545 049 9 689 407
Total changes – – (8 764 054) 191 653 (8 572 401) 16 908 412 8 336 011 1 224 008 9 560 019
Balance as at 31 December 2014 146 607 965 (58 264 013) (21 613 831) 207 864 (79 669 980) 33 265 577 100 203 562 15 474 542 115 678 104
Share-based payments – – – 164 603 164 603 – 164 603 – 164 603
Dividends declared by subsidiaries – – – – – – – (314 223) (314 223)
Total comprehensive income for the year – – (18 378 247) – (18 378 247) 19 966 151 1 587 904 1 148 748 2 736 652
Total changes – – (18 378 247) 164 603 (18 213 644) 19 966 151 1 752 507 834 525 2 587 032
Balance as at 31 December 2015 146 607 965 (58 264 013) (39 992 078) 372 467 (97 883 624) 53 231 728 101 956 069 16 309 067 118 265 136
Note(s) 10 11
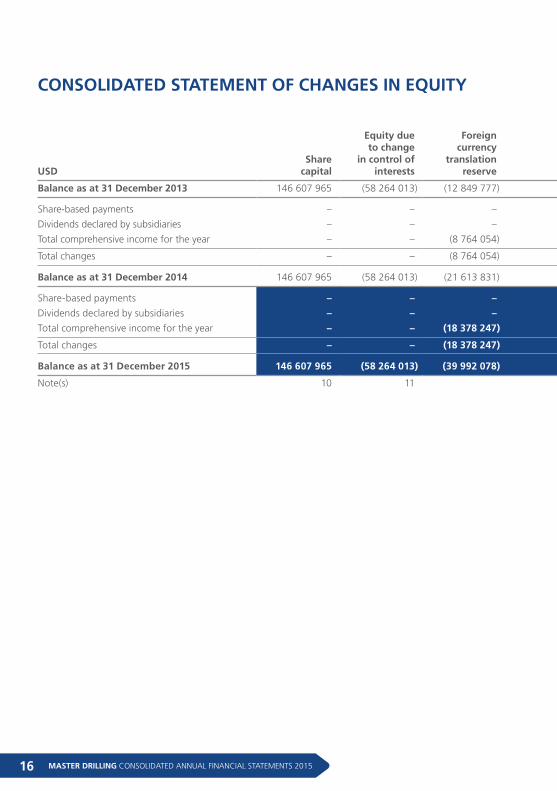
CONSOLIDATED STATEMENT OF CHANGES IN EQUITY
17MASTER DRILLING CONSOLIDATED ANNUAL FINANCIAL STATEMENTS 2015
USDShare
capital
Equity dueto change
in control ofinterests
Foreigncurrency
translationreserve
Share-basedpayments
reserveTotal
reservesRetained
income
Attributableto owners of
the parent
Non-controlling
interest
TotalShareholders'
equity
Balance as at 31 December 2013 146 607 965 (58 264 013) (12 849 777) 16 211 (71 097 579) 16 357 165 91 867 551 14 250 534 106 118 085
Share-based payments – – – 191 653 191 653 – 191 653 – 191 653
Dividends declared by subsidiaries – – – – – – – (321 041) (321 041)
Total comprehensive income for the year – – (8 764 054) – (8 764 054) 16 908 412 8 144 358 1 545 049 9 689 407
Total changes – – (8 764 054) 191 653 (8 572 401) 16 908 412 8 336 011 1 224 008 9 560 019
Balance as at 31 December 2014 146 607 965 (58 264 013) (21 613 831) 207 864 (79 669 980) 33 265 577 100 203 562 15 474 542 115 678 104
Share-based payments – – – 164 603 164 603 – 164 603 – 164 603
Dividends declared by subsidiaries – – – – – – – (314 223) (314 223)
Total comprehensive income for the year – – (18 378 247) – (18 378 247) 19 966 151 1 587 904 1 148 748 2 736 652
Total changes – – (18 378 247) 164 603 (18 213 644) 19 966 151 1 752 507 834 525 2 587 032
Balance as at 31 December 2015 146 607 965 (58 264 013) (39 992 078) 372 467 (97 883 624) 53 231 728 101 956 069 16 309 067 118 265 136
Note(s) 10 11
MASTER DRILLING CONSOLIDATED ANNUAL FINANCIAL STATEMENTS 201518
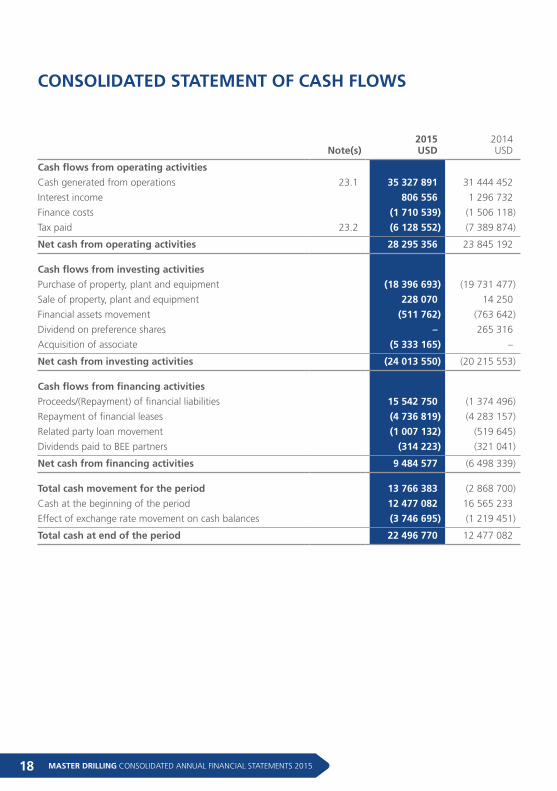
CONSOLIDATED STATEMENT OF CASH FLOWS
2015 2014 Note(s) USD USD
Cash flows from operating activities
Cash generated from operations 23.1 35 327 891 31 444 452
Interest income 806 556 1 296 732
Finance costs (1 710 539) (1 506 118)
Tax paid 23.2 (6 128 552) (7 389 874)
Net cash from operating activities 28 295 356 23 845 192 Cash flows from investing activities
Purchase of property, plant and equipment (18 396 693) (19 731 477)
Sale of property, plant and equipment 228 070 14 250
Financial assets movement (511 762) (763 642)
Dividend on preference shares – 265 316
Acquisition of associate (5 333 165) –
Net cash from investing activities (24 013 550) (20 215 553) Cash flows from financing activities
Proceeds/(Repayment) of financial liabilities 15 542 750 (1 374 496)
Repayment of financial leases (4 736 819) (4 283 157)
Related party loan movement (1 007 132) (519 645)
Dividends paid to BEE partners (314 223) (321 041)
Net cash from financing activities 9 484 577 (6 498 339) Total cash movement for the period 13 766 383 (2 868 700)
Cash at the beginning of the period 12 477 082 16 565 233
Effect of exchange rate movement on cash balances (3 746 695) (1 219 451)
Total cash at end of the period 22 496 770 12 477 082
19MASTER DRILLING CONSOLIDATED ANNUAL FINANCIAL STATEMENTS 2015
1. PRESENTATION OF FINANCIAL INFORMATIONThe Group’s consolidated annual financial statements have been prepared in accordance with International Financial Reporting Standards, the SAICA Financial reporting guides as issued by the Accounting Practices Committee and Financial Reporting Practice as issued the Financial Reporting Standards Council, the requirements of the Companies Act and the JSE Listings Requirements. The consolidated annual financial statements have been prepared on the historical cost basis, except for certain financial instruments at fair value or amortised cost, and incorporate the principal accounting policies set out below. They are presented in United States Dollar (“USD”).
The significant accounting policies are consistent in all material respects with those applied in the previous year. Below is a list of amendments to IFRSs that are mandatory and effective for the annual financial year ending 31 December 2015:
Amendments to IAS 19 Defined benefit plans: Employer contributions;
Amendments to IFRSs Annual improvements to IFRSs 2010-2012 cycle; and
Amendments to IFRSs Annual improvements to IFRSs 2011-2013 cycle.
Management has reviewed the above mentioned mandatory standards and has accommodated for these, where applicable, in the annual financial statements for the financial year ending 31 December 2015.
1.1 Functional and presentation currencyItems included in the financial statements of each of the group’s entities are measured using the currency of the primary environment in which the entity operates, i.e.”functional currency”. The consolidated annual financial statements are presented in USD (the “presentation currency”). Management believes that USD is more useful to the users of the consolidated financial statements, as this currency most reliably reflects the global business performance of the group as a whole.
1.2 ConsolidationBasis of consolidation
The Group annual financial statements incorporate all entities which are controlled by the Group.
(a) At inception the Group annual financial statements had been accounted for under the pooling of interest method as acquisition of entities under common control is excluded from IFRS 3. The entities had been accounted for at historical carrying values for the period presented.
Adjustments are made when necessary to the financial statements of subsidiaries to bring their accounting policies in line with those of the Group.
All inter-company transactions, balances, income and expenses are eliminated in full on consolidation/combination.
Non-controlling interests in the net assets of combined subsidiaries are identified and recognised separately from the Group’s interest therein, and are recognised within equity. Losses of subsidiaries attributable to non-controlling interests are allocated to the non-controlling interest even if this results in a debit balance being recognised for non-controlling interest.
ACCOUNTING POLICIES
MASTER DRILLING CONSOLIDATED ANNUAL FINANCIAL STATEMENTS 201520
ACCOUNTING POLICIES (CONTINUED)
Control is considered to exist if all of the factors below are satisfied.
– The investor has power over the investee, i.e. the investor has existing rights that give it the ability to direct the relevant activities;
– The investor has exposure, or rights to variable returns from its involvement with the investee; and
– The investor has the ability to use its power over the investee to affect the amount of the investors returns.
The Group assesses its control of an investee at the time of its initial investment and again if changes in facts and circumstances affect one or more of the control factors listed above. In assessing whether the Group has control over an investee, consideration is given to many factors including shareholding, voting rights and their impact on the Group’s ability to direct the management, operations and returns of the investee; contractual obligations; minority shareholder rights and whether these are protective or substantive in nature; and the financial position of the investee.
1.3 Business combinationsThe Group applies the acquisition method in accounting for business combinations. The consideration transferred by the Group to obtain control of a subsidiary is calculated as the sum of the acquisition-date fair values of assets transferred, liabilities incurred and the equity interests issued by the Group, which includes the fair value of any asset or liability arising from a contingent consideration arrangement. Acquisition costs are expensed as incurred.
The Group recognises identifiable assets acquired and liabilities assumed in a business combination regardless of whether they have been previously recognised in the acquiree’s financial statements prior to the acquisition. Assets acquired and liabilities assumed are generally measured at their acquisition-date fair values.
Goodwill is stated after separate recognition of identifiable intangible assets. It is calculated as the excess of the sum of
(a) fair value of consideration transferred;
(b) the recognised amount of any non-controlling interest in the acquiree; and
(c) acquisition-date fair value of any existing equity interest in the acquiree, over the acquisition-date fair values of identifiable net assets. If the fair values of identifiable net assets exceed the sum calculated above, the excess amount (i.e. gain on a bargain purchase) is recognised in profit of loss immediately.
1.4 Significant judgements and sources of estimation uncertaintyIn preparing the Group annual financial statements, management is required to make estimates and assumptions that affect the amounts represented in the financial information and related disclosures. Use of available information and the application of judgement are inherent in the formation of estimates. Actual results in the future could differ from these estimates which may be material to the financial information. Significant judgements include:
21MASTER DRILLING CONSOLIDATED ANNUAL FINANCIAL STATEMENTS 2015
(a) Trade receivables and loans and receivables
The group assesses its trade receivables and loans and receivables for impairment at the end of each reporting year. In determining whether an impairment loss should be recorded in profit or loss, the Group makes judgements as to whether there is observable data indicating a measurable decrease in the estimated future cash flows from a financial asset.
(b) Inventories
Management estimates the net realisable values of inventories, taking into account the most reliable evidence available at each reporting date. The future realisation of these inventories may be effected by future technology or other market-driven changes that may reduce future selling prices.
(c) Taxation
Judgement is required in determining the provision for income taxes due to the complexity of legislation. There are many transactions and calculations for which the ultimate tax determination is uncertain during the ordinary course of business. The Group recognises liabilities for anticipated tax audit issues based on estimates of whether additional taxes will be due. Where the final tax outcome of these matters is different from the amounts that were initially recorded, such differences will impact the income tax and deferred tax provisions in the year in which such determination is made.
The Group recognises the net future tax benefit related to deferred income tax assets to the extent that it is probable that the deductible temporary differences will reverse in the foreseeable future. Assessing the recoverability of deferred income tax assets requires the Group to make significant estimates related to expectations of future taxable income. Estimates of future taxable income are based on forecast cash flows from operations and the application of existing tax laws in each jurisdiction. To the extent that future cash flows and taxable income differ significantly from estimates, the ability of the Group to realise the net deferred tax assets recorded at the end of the reporting year could be impacted.
(d) Useful lives of depreciable assets
Management reviews its estimate of the useful lives of depreciable assets at each reporting date, based on the expected utility of the assets. Uncertainties in these estimates relate to technical obsolescence that may change the utility of certain assets.
1.5 GoodwillGoodwill arising on an acquisition of a business is carried at cost as established at the date of acquisition of the business (see note 4) less accumulated impairment losses, if any.
For the purposes of impairment testing, goodwill is allocated to each of the group’s cash-generating units (or groups of cash-generating units) that is expected to benefit from the synergies of the combination.
MASTER DRILLING CONSOLIDATED ANNUAL FINANCIAL STATEMENTS 201522
ACCOUNTING POLICIES (CONTINUED)
A cash-generating unit to which goodwill has been allocated is tested for impairment annually, or more frequently when there is an indication that the unit may be impaired. If the recoverable amount of the cash-generating unit is less than its carrying amount, the impairment loss is allocated first to reduce the carrying amount of any goodwill allocated to the unit and then to the other assets of the unit pro rata based on the carrying amount of each asset in the unit. Any impairment loss for goodwill is recognised directly in profit or loss. An impairment loss recognised for goodwill is not reversed in subsequent years.
On disposal of the relevant cash-generating unit, the attributable amount of goodwill is included in the determination of the profit or loss on disposal.
1.6 Investment in associateAn associate is an entity over which the Group has significant influence. Significant influence is the power to participate in the financial and operating policy decisions of the investee but is not control or joint control over those policies.
The results, assets and liabilities are incorporated in these consolidated annual financial statements using the equity method of accounting, except when the investment, or a portion thereof, is classified as held for sale, in which case it is accounted for in accordance with IFRS 5. Under the equity method, an investment in associate is initially recognised in the consolidated statement of financial position at cost and adjusted for thereafter to recognise the Group’s share of the profit or loss in associate and other comprehensive income of the associate. When the Group’s share of losses of an associate exceeds the Group’s interest in the associate, the Group discontinues recognising its share of further losses. Additional losses are recognised only to the extent that the Group has incurred legal or constructive obligations or made payments on behalf of the associate.
An investment in associate is accounted for using the equity method from the date on which the investee becomes an associate. On acquisition of the investment in an associate, any excess of the cost of the investment over the Group’s share of the net fair value of the identifiable assets and liabilities of the investee is recognised as goodwill, which is included in the carrying amount of the investment. Any excess of the Group’s share of the net fair value of the identifiable assets and liabilities over the cost of the investment, after reassessment, is recognised immediately in profit or loss in the period in the investment is acquired.
The requirements of IAS 39 are applied to determine whether it is necessary to recognise any impairment loss with respect to the Group’s investment in an associate. When necessary, the entire carrying amount of the investment (including goodwill) is tested for impairment in accordance with IAS 36 as a single asset by comparing its recoverable amount (higher of value in use and fair value less costs of disposal) with its carrying amount. Any impairment loss recognised forms part of the carrying amount of the investment. Any reversal of that impairment loss is recognised in accordance with IAS 36 to the extent that the recoverable amount in the investment subsequently increases.
The Group discontinues the use of the equity method from the date the investment ceases to be an associate or when the investment is classified as held for sale. When the Group retains an interest in the former associate and the retained interest is a financial asset, the Group measures the retained interest at fair value at that date and the fair value is regarded as its fair value on the initial recognition in accordance with IAS 39. The difference between the carrying amount of the associate at the date the equity method was discontinued, and the fair value of any retained interest and any proceeds from disposing of a part interest in the associate is included in the determination of the
23MASTER DRILLING CONSOLIDATED ANNUAL FINANCIAL STATEMENTS 2015
gain or loss on disposal of the associate. In addition, the Group accounts for all amounts previously recognised in other comprehensive income in relation to that associate on the same basis as would be required if that associate had directly disposed of the related assets or liabilities. Therefore, if a gain or loss previously recognised in other comprehensive income by that associate would be reclassified to profit or loss on the disposal of the related assets or liabilities, the Group reclassifies the gain or loss from equity to profit or loss when the equity method is discontinued.
When a Group entity transacts with an associate of the Group, profits and losses resulting from the transactions with the associate are recognised in the Group’s consolidated annual financial statements only to the extent of interest in the associate that is not related to the Group.
1.7 Property, plant and equipmentThe cost of an item of property, plant and equipment is recognised as an asset when:
(a) it is probable that future economic benefits associated with the item will flow to the Group; and
(b) the cost of the item can be measured reliably.
Property, plant and equipment are initially measured at cost and subsequently at cost less any accumulated depreciation and accumulated impairment losses. Patents are acquired by the Group and have an infinite useful live. Patents are carried at cost less accumulated impairment losses. Amortisation methods, useful lives and residual values are reviewed at each reporting date and adjusted if appropriate.
Costs include costs incurred initially to acquire or construct an item of property, plant and equipment. Cost associated with equipment upgrades that result in increased capabilities or performance enhancements of property and equipment are capitalised. If a replacement part is recognised in the carrying amount of an item of property, plant and equipment, the carrying amount of the replaced part is derecognised.
An asset under construction will be reclassified to the relevant asset category as soon as it is available for use.
The initial estimate of the costs of dismantling and removing the item and restoring the site on which it is located is also included in the cost of property, plant and equipment, where the Group is obligated to incur such expenditure, and where the obligation arises as a result of acquiring the asset or using it for purposes other than the production of inventories.
MASTER DRILLING CONSOLIDATED ANNUAL FINANCIAL STATEMENTS 201524
ACCOUNTING POLICIES (CONTINUED)
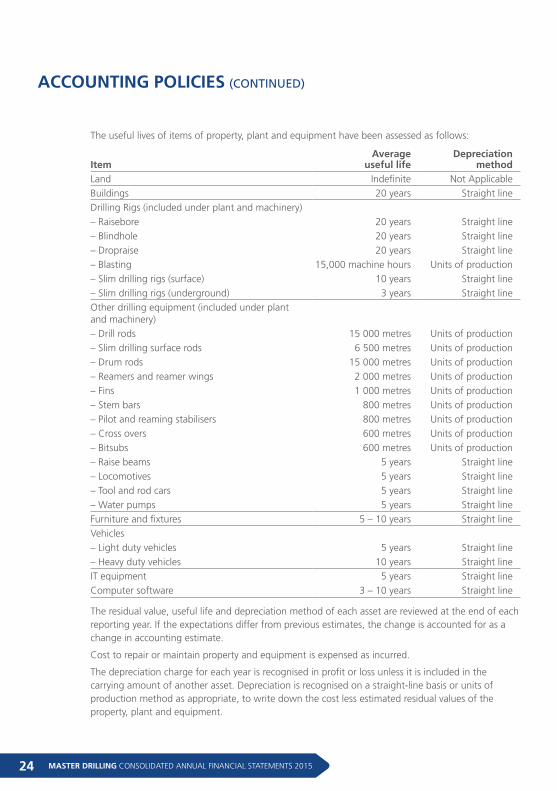
The useful lives of items of property, plant and equipment have been assessed as follows:
Average Depreciation Item useful life methodLand Indefinite Not ApplicableBuildings 20 years Straight lineDrilling Rigs (included under plant and machinery) – Raisebore 20 years Straight line– Blindhole 20 years Straight line– Dropraise 20 years Straight line– Blasting 15,000 machine hours Units of production– Slim drilling rigs (surface) 10 years Straight line– Slim drilling rigs (underground) 3 years Straight lineOther drilling equipment (included under plant and machinery)
– Drill rods 15 000 metres Units of production– Slim drilling surface rods 6 500 metres Units of production– Drum rods 15 000 metres Units of production– Reamers and reamer wings 2 000 metres Units of production– Fins 1 000 metres Units of production– Stem bars 800 metres Units of production– Pilot and reaming stabilisers 800 metres Units of production– Cross overs 600 metres Units of production– Bitsubs 600 metres Units of production– Raise beams 5 years Straight line– Locomotives 5 years Straight line– Tool and rod cars 5 years Straight line– Water pumps 5 years Straight lineFurniture and fixtures 5 – 10 years Straight lineVehicles – Light duty vehicles 5 years Straight line– Heavy duty vehicles 10 years Straight lineIT equipment 5 years Straight lineComputer software 3 – 10 years Straight line
The residual value, useful life and depreciation method of each asset are reviewed at the end of each reporting year. If the expectations differ from previous estimates, the change is accounted for as a change in accounting estimate.
Cost to repair or maintain property and equipment is expensed as incurred.
The depreciation charge for each year is recognised in profit or loss unless it is included in the carrying amount of another asset. Depreciation is recognised on a straight-line basis or units of production method as appropriate, to write down the cost less estimated residual values of the property, plant and equipment.
25MASTER DRILLING CONSOLIDATED ANNUAL FINANCIAL STATEMENTS 2015
The gain or loss arising from the derecognition of an item of property, plant and equipment is included in profit or loss when the item is derecognised. The gain or loss arising from the derecognition of an item of property, plant and equipment is determined as the difference between the net disposal proceeds, if any, and the carrying amount of the item.
1.8 Segment reportingAn operating segment is a component of the Group that engages in business activities from which it may earn revenues and incur expenses, including revenues and expenses that relate to transactions with any of the Group’s other components. All operating segments’ operating results are reviewed regularly by the chief operating decision-maker to make decisions about resources to be allocated to the segment and assess its performance, and for which discrete financial information is available.
1.9 Financial instruments (a) Classification
The Group classifies financial assets and financial liabilities into the following categories:
– loans and receivables;
– financial liabilities measured at amortised cost; and
– preference shares are classified as loans and receivables.
Classification depends on the purpose for which the financial instruments were obtained/incurred and takes place at initial recognition. Classification is assessed on an annual basis, except for derivatives and financial assets designated as at fair value through profit or loss, which shall not be classified out of the fair value through profit or loss category.
(b) Initial recognition and measurement
Financial instruments are recognised initially when the Group becomes a party to the contractual provisions of the instruments.
The Group classifies financial instruments, or their component parts, on initial recognition as a financial asset, a financial liability or an equity instrument in accordance with the substance of the contractual arrangement.
For financial instruments which are not at fair value through profit or loss, transaction costs are included in the initial measurement of the instrument.
(c) Subsequent measurement
Dividend income is recognised in profit or loss as part of other income when the Group’s right to receive payment is established.
Loans and receivables are subsequently measured at amortised cost, using the effective interest rate method, less accumulated impairment losses.
(d) Impairment of financial assets
At each reporting date the Group assesses all financial assets, to determine whether there is objective evidence that a financial asset or group of financial assets has been impaired.
For amounts due to the Group, significant financial difficulties of the debtor, probability that the debtor will enter bankruptcy and default of payments are all considered indicators of impairment.
MASTER DRILLING CONSOLIDATED ANNUAL FINANCIAL STATEMENTS 201526
ACCOUNTING POLICIES (CONTINUED)
Impairment losses are recognised in profit or loss.
Impairment losses are reversed when an increase in the financial asset’s recoverable amount can be related objectively to an event occurring after the impairment was recognised, subject to the restriction that the carrying amount of the financial asset at the date that the impairment is reversed shall not exceed what the carrying amount would have been had the impairment not been recognised.
Reversals of impairment losses are recognised in profit or loss.
Where financial assets are impaired through use of an allowance account, the amount of the loss is recognised in profit or loss within operating expenses. When such assets are written off, the write off is made against the relevant allowance account. Subsequent recoveries of amounts previously written off are credited against operating expenses.
(e) Loans to/(from) related parties
These include loans to and from related parties and are recognised initially at fair value plus direct transaction costs.
Loans to related parties are classified as loans and receivables.
Loans from related parties are classified as financial liabilities measured at amortised cost.
(f) Loans to employees
These financial assets are classified as loans and receivables.
(g) Trade and other receivables
Trade receivables are measured at initial recognition at fair value including transaction costs, and are subsequently measured at amortised cost using the effective interest rate method. Appropriate allowances for estimated irrecoverable amounts are recognised in profit or loss when there is objective evidence that the asset is impaired. Significant financial difficulties of the trade receivable, probability that the trade receivable will enter bankruptcy or financial reorganisation, and default or delinquency in payments are considered indicators that the trade receivable is impaired. The allowance recognised is measured as the difference between the asset’s carrying amount and the present value of estimated future cash flows discounted at the effective interest rate computed at initial recognition.
The carrying amount of the asset is reduced through the use of an allowance account, and the amount of the loss is recognised in profit or loss within operating expenses. When a trade receivable is uncollectable, it is written off against the allowance account for trade receivables. Subsequent recoveries of amounts previously written off are credited against operating expenses in profit or loss.
Trade and other receivables are classified as loans and receivables.
(h) Trade and other payables
Trade payables are initially measured at fair value including transaction costs, and are subsequently measured at amortised cost, using the effective interest rate method. Trade and other payables are classified as financial liabilities.
27MASTER DRILLING CONSOLIDATED ANNUAL FINANCIAL STATEMENTS 2015
(i) Cash and cash equivalents
Cash and cash equivalents comprise cash on hand and demand deposits, and other short-term highly liquid investments that are readily convertible to a known amount of cash and are subject to an insignificant risk of changes in value. Cash and cash equivalents are classified as loans and receivables.
(j) Bank overdrafts and borrowings
Bank overdrafts and borrowings are initially measured at fair value including transaction costs, and are subsequently measured at amortised cost, using the effective interest rate method. Any difference between the proceeds (net of transaction costs) and the settlement or redemption of borrowings is recognised over the term of the borrowings in accordance with the Group’s accounting policy for borrowing costs.
Bank overdraft and borrowings are classified as financial liabilities at amortised cost.
1.10 Tax(a) Current tax assets and liabilities
Current tax for current and prior years is, to the extent unpaid, recognised as a liability. If the amount already paid in respect of current and prior years exceeds the amount due for those years, the excess is recognised as an asset.
Current tax liabilities (assets) for the current and prior years are measured at the amount expected to be paid to (recovered from) the tax authorities, using the tax rates (and tax laws) that have been enacted or substantively enacted by the end of the reporting year.
(b) Deferred tax assets and liabilities
A deferred tax liability is recognised for all taxable temporary differences, except to the extent that the deferred tax liability arises from the initial recognition of an asset or liability in a transaction which at the time of the transaction, affects neither accounting profit nor taxable profit (tax loss).
A deferred tax asset is recognised for all deductible temporary differences to the extent that it is probable that taxable profit will be available against which the deductible temporary difference can be utilised. A deferred tax asset is not recognised when it arises from the initial recognition of an asset or liability in a transaction at the time of the transaction, affects neither accounting profit nor taxable profit (tax loss).
A deferred tax asset is recognised for the carry forward of unused tax losses to the extent that it is probable that future taxable profit will be available against which the unused tax losses can be utilised.
Deferred tax assets and liabilities are measured at the tax rates that are expected to apply to the year when the asset is realised or the liability is settled, based on tax rates (and tax laws) that have been enacted or substantively enacted by the end of the reporting year.
MASTER DRILLING CONSOLIDATED ANNUAL FINANCIAL STATEMENTS 201528
ACCOUNTING POLICIES (CONTINUED)
(c) Tax expenses
Current and deferred taxes are recognised as income or an expense and included in profit or loss for the year, except to the extent that the tax arises from:
– a transaction or event which is recognised, in the same or a different year, to other comprehensive income; or
– a business combination.
Current tax and deferred taxes are charged or credited to other comprehensive income if the tax relates to items that are credited or charged, in the same or a different year, to other comprehensive income.
1.11 LeasesA lease is classified as a finance lease if it transfers substantially all the risks and rewards incidental to ownership. A lease is classified as an operating lease if it does not transfer substantially all the risks and rewards incidental to ownership.
(a) Finance leases
Finance leases are recognised as assets and liabilities in the statement of financial position at amounts equal to the fair value of the leased property or, if lower, the present value of the minimum lease payments. The corresponding liability to the lessor is included in the statement of financial position as a finance lease obligation.
The lease payments are apportioned between the finance charge and reduction of the outstanding liability. The finance charge is allocated to each year during the lease term so as to produce a constant periodic rate of return on the remaining balance of the liability.
(b) Operating leases
Operating lease payments are recognised as an expense on a straightline basis over the lease term. The difference between the amounts recognised as an expense and the contractual payments are recognised as an operating lease liability. This liability is not discounted.
Any contingent rents are expensed in the year in which they are incurred.
1.12 InventoriesInventories are measured at the lower of cost and net realisable value.
The cost of inventories are assigned using the weighted average cost formula. The same cost formula is used for all inventories having a similar nature and use to the entity.
Net realisable value is the estimated selling price in the ordinary course of business less the estimated costs of completion and the estimated costs necessary to make the sale.
The cost of inventories comprises all costs of purchase, costs of conversion and other costs incurred in bringing the inventories to their present location and condition.
The cost of inventories of items that are not ordinarily interchangeable and goods or services produced and segregated for specific projects is assigned using specific identification of the individual costs.
29MASTER DRILLING CONSOLIDATED ANNUAL FINANCIAL STATEMENTS 2015
When inventories are utilised, the carrying amount of those inventories are recognised as an expense in the year in which the related revenue is recognised. The amount of any write-down of inventories to net realisable value and all losses of inventories are recognised as an expense in the year the write-down or loss occurs. The amount of any reversal of any write-down of inventories, arising from an increase in net realisable value, are recognised as a reduction in the amount of inventories recognised as an expense in the year in which the reversal occurs.
1.13 Impairment of goodwill and property, plant and equipmentFor impairment assessment purposes, assets are grouped at the lowest levels for which there are largely independent cash inflows (cash-generating units). As a result, some assets are tested individually for impairment and some are tested at cash-generating unit level. Goodwill is allocated to those cash-generating units that are expected to benefit from synergies of the related business combination and represent the lowest level within the group at which Management monitors goodwill.
Cash-generating units to which goodwill has been allocated (determined by the Group’s management as equivalent to its operating segments) are tested for impairment at least annually. All other individual assets or cash-generating units are tested for impairment whenever events or changes in circumstance indicate that the carrying amount may not be recoverable.
An impairment loss is recognised for the amount by which the asset’s or cash-generating units carrying amount exceeds its recoverable amount, which is the higher of fair value less costs of disposal and value-in-use. To determine the value-in-use, management estimates expected future cash flows from each cash-generating unit and determines a suitable interest rate in order to calculate the present value of those cash flows. The data used for impairment testing procedures are directly linked to the group’s latest approved budget, adjusted as necessary to exclude the effects of future reorganisations and asset enhancements. Discount factors are determined individually for each cash-generating unit and reflect management’s assessment of respective risk profiles, such as market and asset-specific risks factors.
Impairment losses for cash-generating units reduce first the carrying amount of any goodwill allocated to that cash-generating unit. Any remaining impairment loss is charged pro rata to the other assets in the cash-generating unit. With the exception of goodwill, all assets are subsequently reassessed for indications that an impairment loss previously recognised may no longer exist. An impairment loss is reversed if the asset’s or cash-generating unit’s recoverable amount exceeds its carrying amount.
1.14 Share capital and equityAn equity instrument is any contract that evidences a residual interest in the assets of an entity after deducting all of its liabilities.
1.15 Employee benefits(a) Short-term employee benefits
The cost of short-term employee benefits (those payable within 12 months after the service is rendered, such as paid vacation leave and sick leave, bonuses, and non-monetary benefits such as medical care), are recognised as an expense in the year in which the service is rendered and are not discounted.
MASTER DRILLING CONSOLIDATED ANNUAL FINANCIAL STATEMENTS 201530
ACCOUNTING POLICIES (CONTINUED)
The expected cost of compensated absences is recognised as an expense as the employees render services that increase their entitlement or, in the case of non-accumulating absences, when the absence occurs.
The expected cost of profit-sharing and bonus payments is recognised as an expense when there is a legal or constructive obligation to make such payments as a result of past performance.
(b) Defined contribution plans
Payments to defined contribution retirement benefit plans are charged as an expense as they fall due.
Payments made to industry-managed (or state plans) retirement benefit schemes are dealt with as defined contribution plans where the group’s obligation under the schemes is equivalent to those arising in a defined contribution retirement benefit plan.
1.16 ContingenciesContingent assets are recognised when it is virtually certain there will be an inflow of future economic benefits. Contingent liabilities are recognised when it is probable that there will be outflow of economic resources.
1.17 RevenueWhen the outcome of a transaction involving the rendering of services can be estimated reliably, revenue associated with the transaction is recognised by reference to the stage of completion of the transaction at the end of the reporting year. The outcome of a transaction can be estimated reliably when all the following conditions are satisfied:
– the amount of revenue can be measured reliably;
– it is probable that the economic benefits associated with the transaction will flow to the group;
– the stage of completion of the transaction at the end of the reporting year can be measured reliably; and
– the costs incurred for the transaction and the costs to complete the transaction can be measured reliably.
When the outcome of the transaction involving the rendering of services cannot be estimated reliably, revenue shall be recognised only to the extent of the expenses recognised that are recoverable.
Service revenue is recognised by reference to the stage of completion of the transaction at the end of the reporting year. Stage of completion is determined by services performed to date as a percentage of total services to be performed.
Contract revenue comprises:
– the initial amount of revenue agreed in the contract;
– variations in contract work, claims and incentive payments;
– to the extent that it is probable that they will result in revenue; and
– they are capable of being reliably measured.
31MASTER DRILLING CONSOLIDATED ANNUAL FINANCIAL STATEMENTS 2015
Revenue is measured at the fair value of the consideration received or receivable and represents the amounts receivable for services provided in the normal course of business, net of trade discounts and volume rebates, and value added tax.
Interest is recognised, in profit or loss, using the effective interest rate method.
Dividends are recognised, in profit or loss, when the group’s right to receive payment has been established.
Service fees included in the price of the product are recognised as revenue over the year during which the service is performed.
1.18 Cost of salesThe related cost of providing services recognised as revenue in the current year is included in cost of sales.
Contract costs comprise:
– costs that relate directly to the specific contract;
– costs that are attributable to contract activity in general and can be allocated to the contract; and
– such other costs as are specifically chargeable to the customer under the terms of the contract.
1.19 Translation on foreign currencies (a) Foreign currency translation
A foreign currency transaction is translated into the functional currency of the respective group entity, using the exchange rates prevailing at the dates of the transactions (spot exchange rate).
At the end of the reporting year:
– foreign currency monetary items are translated using the closing rate;
– non-monetary items that are measured in terms of historical cost in a foreign currency are translated using the exchange rate at the date of the transaction; and
– non-monetary items that are measured at fair value in a foreign currency are translated using the exchange rates at the date when the fair value was determined.
Exchange differences arising on the settlement of monetary items or on translating monetary items at rates different from those at which they were translated on initial recognition during the year or in previous financial statements are recognised in profit or loss in the year in which they arise.
When a gain or loss on a non-monetary item is recognised in other comprehensive income and accumulated in equity, any exchange component of that gain or loss is recognised in other comprehensive income and accumulated in equity. When a gain or loss on a non-monetary item is recognised in profit or loss, any exchange component of that gain or loss is recognised in profit or loss.
MASTER DRILLING CONSOLIDATED ANNUAL FINANCIAL STATEMENTS 201532
ACCOUNTING POLICIES (CONTINUED)
(b) Translation to presentation currency
The results and financial position of a foreign operation are translated into the presentation currency using the following procedures:
– assets and liabilities for each statement of financial position presented are translated at the closing rate at the date of that statement of financial position;
– income and expenses for each item of profit or loss are translated at exchange rates at the dates of the transactions; and
– all resulting exchange differences are recognised in other comprehensive income and accumulated as a separate component of equity.
Exchange differences arising on a monetary item that forms part of a net investment in a foreign operation are recognised initially to other comprehensive income and accumulated in the translation reserve. They are recognised in profit or loss as a reclassification adjustment through to other comprehensive income on disposal of net investment.
Any goodwill arising on the acquisition of a foreign operation and any fair value adjustments to the carrying amounts of assets and liabilities arising on the acquisition of that foreign operation are treated as assets and liabilities of the foreign operation.
The cash flows of a foreign subsidiary are translated at the exchange rates between the functional currency and the foreign currency at the dates of the cash flows.
1.20 Related partiesRelated parties are considered to be related if one party has the ability to control or jointly control the other party or exercise significant influence over the other party in making financial and operating decisions. Key management personnel are also regarded as related parties. Key management personnel are those persons having authority and responsibility for planning, directing and controlling the activities of the group, directly or indirectly, including all executive and non-executive directors.
Related party transactions are those where a transfer of resources or obligations between related parties occur, regardless of whether or not a price is charged.
1.21 Borrowing costsBorrowing costs that are directly attributable to the acquisition, construction or production of a qualifying asset are capitalised as part of the cost of that asset until such time as the asset is ready for its intended use. The amount of borrowing costs eligible for capitalisation is determined as follows:
– actual borrowing costs on funds specifically borrowed for the purpose of obtaining a qualifying asset less any temporary investment of those borrowings; and
– weighted average of the borrowing costs applicable to the entity on funds generally borrowed for the purpose of obtaining a qualifying asset. The borrowing costs capitalised do not exceed the total borrowing costs incurred.
33MASTER DRILLING CONSOLIDATED ANNUAL FINANCIAL STATEMENTS 2015
The capitalisation of borrowing costs begins when:
– expenditures for the asset have occurred;
– borrowing costs have been incurred; and
– activities that are necessary to prepare the asset for its intended use or sale are in progress.
Capitalisation is suspended during extended years in which active development is interrupted.
Capitalisation ceases when substantially all the activities necessary to prepare the qualifying asset for its intended use or sale are complete.
All other borrowing costs are recognised as an expense in the year in which they are incurred.
1.22 Share-based paymentsEligible employees of the Group receive remuneration in the form of share-based payments, whereby employees render services as consideration for equity instruments.
(a) Equity-settled transactions
The cost of equity-settled transactions is determined by the fair value at the date when the grant is made using an appropriate valuation model. That cost is recognised, together with a corresponding increase in other capital reserves in equity, over the year in which the performance and/or service conditions are fulfilled in employee benefits expense. The cumulative expense recognised for equity-settled transactions at each reporting date until the vesting date reflects the extent to which the vesting year has expired and the Group’s best estimate of the number of equity instruments that will ultimately vest.
The statement of profit or loss expense or credit for a year represents the movement in cumulative expense recognised as at the beginning and end of that year and is recognised in employee benefits expense. No expense is recognised for awards that do not ultimately vest, except for equity-settled transactions for which vesting is conditional upon a market or non-vesting condition. These are treated as vesting irrespective of whether or not the market or non-vesting condition is satisfied, provided that all other performance and/or service conditions are satisfied.
When the terms of an equity-settled award are modified, the minimum expense recognised is the expense had the terms not been modified, if the original terms of the award are met. An additional expense is recognised for any modification that increases the total fair value of the share-based payment transaction, or is otherwise beneficial to the employee as measured at the date of modification. The dilutive effect of outstanding options is reflected as additional share dilution in the computation of diluted earnings per share.
(b) Cash-settled transactions
The cost of cash-settled transactions is measured initially at fair value at the grant date using a Black-Scholes Option Pricing Model. This fair value is expensed over the year until the vesting date with recognition of a corresponding liability. The liability is re-measured to fair value at each reporting date up to, and including the settlement date, with changes in fair value recognised in employee benefits expense.
MASTER DRILLING CONSOLIDATED ANNUAL FINANCIAL STATEMENTS 201534
ACCOUNTING POLICIES (CONTINUED)
2. STANDARDS, AMENDMENTS AND INTERPRETATIONS TO EXISTING STANDARDS THAT ARE NOT YET EFFECTIVE AND HAVE NOT BEEN ADOPTED EARLY BY THE GROUPAt the date of authorisation of these annual financial statements, certain new standards, amendments and interpretations to existing standards have been published by the International Accounting Standards Board but are not yet effective, and have not been early adopted by the Group. Management anticipates that all of the relevant pronouncements will be adopted in the Group’s accounting policies for the first year beginning after the effective date of the pronouncement. Information on new standards, amendments and interpretations that are expected to be relevant to the Group’s annual financial statements is provided below. Certain other new standards and interpretations have been issued but are not expected to have a material impact on the Group’s annual financial statements.
2.1 IFRS 9 Financial instrumentsIFRS 9 Financial instruments (2014) replaces IAS 39 Financial instruments: Recognition and measurement.
The standard is effective for annual years beginning or after 1 January 2018.
The Group’s management has yet to assess the impact of this new standard on the Group’s annual financial statements. Management does not expect to implement IFRS 9 until it becomes effective.
2.2 IFRS 15 Revenue from contracts with customersGuidance on recognition of revenue that requires recognition of revenue in a manner that depicts the transfer of goods or services to customer at an amount that reflects the consideration the entity expects to be entitles to in exchange for those goods or services.
This is effective for annual years beginning or after 1 November 2018.
2.3 IAS 1 Presentation of financial statementsAmendments clarifying IAS 1 specified line items on the statement(s) of profit and loss and the other comprehensive income and the statement of financial position can be disaggregated.
Additional requirements of how entities should present subtotal in the statement(s) of profit and loss and other comprehensive income and the statement of financial position.
Clarification that entities have flexibility as to the order in which they present their notes to the financial statements, but also emphasising the need to consider fundamental principles of comparability and understandability in the determining the order.
This is effective for annual years beginning or after 1 January 2016.
2.4 IAS 34 Interim financial reportingAmendments clarify the meaning of disclosure of information elsewhere in the interim financial report and require the inclusion of a cross-reference from the interim financial statements to the location of this information. Amendments specify that this information must be available to users of the interim financial statements on the same terms as the interim financial statements and at the same time, or the interim financial statements will be incomplete.
This is effective for annual years beginning or after 1 July 2016.
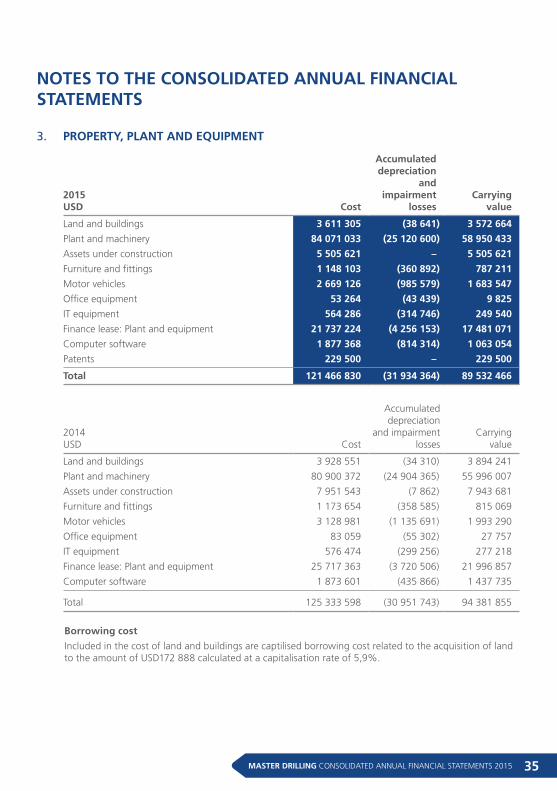
35MASTER DRILLING CONSOLIDATED ANNUAL FINANCIAL STATEMENTS 2015
2015USD Cost
Accumulated depreciation
and impairment
lossesCarrying
value
Land and buildings 3 611 305 (38 641) 3 572 664
Plant and machinery 84 071 033 (25 120 600) 58 950 433
Assets under construction 5 505 621 – 5 505 621
Furniture and fittings 1 148 103 (360 892) 787 211
Motor vehicles 2 669 126 (985 579) 1 683 547
Office equipment 53 264 (43 439) 9 825
IT equipment 564 286 (314 746) 249 540
Finance lease: Plant and equipment 21 737 224 (4 256 153) 17 481 071
Computer software 1 877 368 (814 314) 1 063 054
Patents 229 500 – 229 500
Total 121 466 830 (31 934 364) 89 532 466
2014USD Cost
Accumulated depreciation
and impairment losses
Carrying value
Land and buildings 3 928 551 (34 310) 3 894 241
Plant and machinery 80 900 372 (24 904 365) 55 996 007
Assets under construction 7 951 543 (7 862) 7 943 681
Furniture and fittings 1 173 654 (358 585) 815 069
Motor vehicles 3 128 981 (1 135 691) 1 993 290
Office equipment 83 059 (55 302) 27 757
IT equipment 576 474 (299 256) 277 218
Finance lease: Plant and equipment 25 717 363 (3 720 506) 21 996 857
Computer software 1 873 601 (435 866) 1 437 735
Total 125 333 598 (30 951 743) 94 381 855
NOTES TO THE CONSOLIDATED ANNUAL FINANCIAL STATEMENTS
3. PROPERTY, PLANT AND EQUIPMENT
Borrowing cost
Included in the cost of land and buildings are captilised borrowing cost related to the acquisition of land to the amount of USD172 888 calculated at a capitalisation rate of 5,9%.
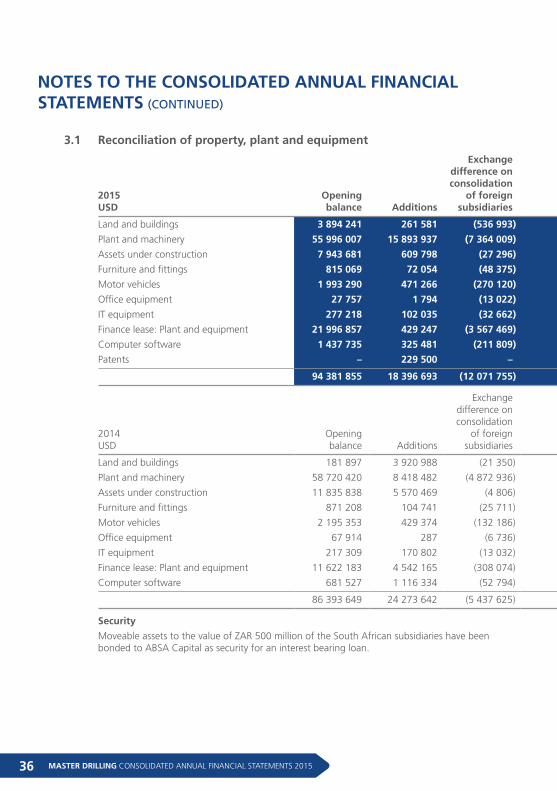
MASTER DRILLING CONSOLIDATED ANNUAL FINANCIAL STATEMENTS 201536
NOTES TO THE CONSOLIDATED ANNUAL FINANCIAL STATEMENTS (CONTINUED)
3.1 Reconciliation of property, plant and equipment
2015USD
Opening balance Additions
Exchange difference on consolidation
of foreign subsidiaries
Reclassifications and transfer to
inventory Disposals DepreciationImpairment of
fixed assets Total
Land and buildings 3 894 241 261 581 (536 993) – (26 545) (19 620) – 3 572 664
Plant and machinery 55 996 007 15 893 937 (7 364 009) 435 994 (529 625) (5 481 871) – 58 950 433
Assets under construction 7 943 681 609 798 (27 296) (3 020 562) – – – 5 505 621
Furniture and fittings 815 069 72 054 (48 375) – (8 999) (42 538) – 787 211
Motor vehicles 1 993 290 471 266 (270 120) 116 537 (323 726) (303 700) – 1 683 547
Office equipment 27 757 1 794 (13 022) – – (6 704) – 9 825
IT equipment 277 218 102 035 (32 662) (138) (5 024) (91 889) – 249 540
Finance lease: Plant and equipment 21 996 857 429 247 (3 567 469) (116 537) (12 049) (1 248 978) – 17 481 071
Computer software 1 437 735 325 481 (211 809) – – (488 353) – 1 063 054
Patents – 229 500 – – – – – 229 500
94 381 855 18 396 693 (12 071 755) (2 584 706) (905 968) (7 683 653) – 89 532 466
2014USD
Opening balance Additions
Exchange difference on consolidation
of foreign subsidiaries
Reclassifications and transfer to
inventory Disposals DepreciationImpairment of
fixed assets Total
Land and buildings 181 897 3 920 988 (21 350) (124 449) (40 563) (22 282) – 3 894 241
Plant and machinery 58 720 420 8 418 482 (4 872 936) 1 480 819 – (6 552 037) (1 198 741) 55 996 007
Assets under construction 11 835 838 5 570 469 (4 806) (9 457 820) – – – 7 943 681
Furniture and fittings 871 208 104 741 (25 711) (31 064) (50 013) (54 092) – 815 069
Motor vehicles 2 195 353 429 374 (132 186) (26 301) (150 889) (322 061) – 1 993 290
Office equipment 67 914 287 (6 736) (17 898) (4 944) (10 866) – 27 757
IT equipment 217 309 170 802 (13 032) 27 449 (34 323) (90 987) – 277 218
Finance lease: Plant and equipment 11 622 183 4 542 165 (308 074) 7 667 398 – (1 526 815) – 21 996 857
Computer software 681 527 1 116 334 (52 794) – (18 045) (289 287) – 1 437 735
86 393 649 24 273 642 (5 437 625) (481 866) (298 777) (8 868 427) (1 198 741) 94 381 855
Security
Moveable assets to the value of ZAR 500 million of the South African subsidiaries have been bonded to ABSA Capital as security for an interest bearing loan.
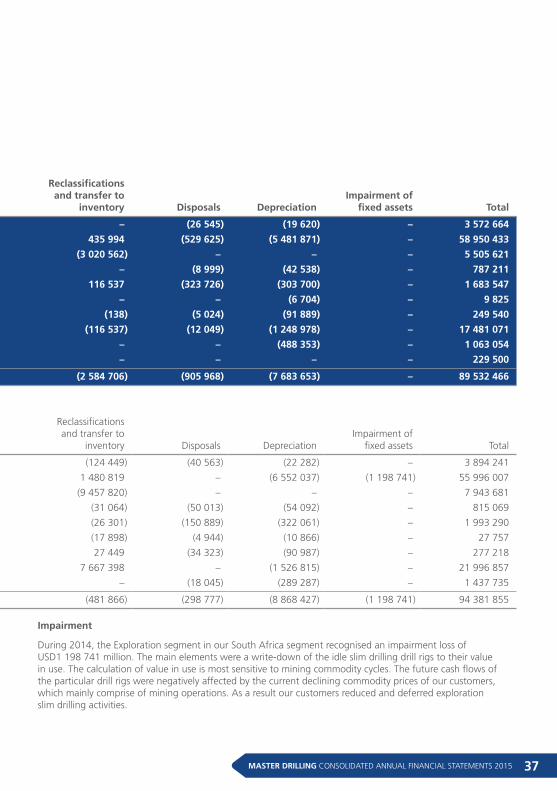
37MASTER DRILLING CONSOLIDATED ANNUAL FINANCIAL STATEMENTS 2015
3.1 Reconciliation of property, plant and equipment
2015USD
Opening balance Additions
Exchange difference on consolidation
of foreign subsidiaries
Reclassifications and transfer to
inventory Disposals DepreciationImpairment of
fixed assets Total
Land and buildings 3 894 241 261 581 (536 993) – (26 545) (19 620) – 3 572 664
Plant and machinery 55 996 007 15 893 937 (7 364 009) 435 994 (529 625) (5 481 871) – 58 950 433
Assets under construction 7 943 681 609 798 (27 296) (3 020 562) – – – 5 505 621
Furniture and fittings 815 069 72 054 (48 375) – (8 999) (42 538) – 787 211
Motor vehicles 1 993 290 471 266 (270 120) 116 537 (323 726) (303 700) – 1 683 547
Office equipment 27 757 1 794 (13 022) – – (6 704) – 9 825
IT equipment 277 218 102 035 (32 662) (138) (5 024) (91 889) – 249 540
Finance lease: Plant and equipment 21 996 857 429 247 (3 567 469) (116 537) (12 049) (1 248 978) – 17 481 071
Computer software 1 437 735 325 481 (211 809) – – (488 353) – 1 063 054
Patents – 229 500 – – – – – 229 500
94 381 855 18 396 693 (12 071 755) (2 584 706) (905 968) (7 683 653) – 89 532 466
2014USD
Opening balance Additions
Exchange difference on consolidation
of foreign subsidiaries
Reclassifications and transfer to
inventory Disposals DepreciationImpairment of
fixed assets Total
Land and buildings 181 897 3 920 988 (21 350) (124 449) (40 563) (22 282) – 3 894 241
Plant and machinery 58 720 420 8 418 482 (4 872 936) 1 480 819 – (6 552 037) (1 198 741) 55 996 007
Assets under construction 11 835 838 5 570 469 (4 806) (9 457 820) – – – 7 943 681
Furniture and fittings 871 208 104 741 (25 711) (31 064) (50 013) (54 092) – 815 069
Motor vehicles 2 195 353 429 374 (132 186) (26 301) (150 889) (322 061) – 1 993 290
Office equipment 67 914 287 (6 736) (17 898) (4 944) (10 866) – 27 757
IT equipment 217 309 170 802 (13 032) 27 449 (34 323) (90 987) – 277 218
Finance lease: Plant and equipment 11 622 183 4 542 165 (308 074) 7 667 398 – (1 526 815) – 21 996 857
Computer software 681 527 1 116 334 (52 794) – (18 045) (289 287) – 1 437 735
86 393 649 24 273 642 (5 437 625) (481 866) (298 777) (8 868 427) (1 198 741) 94 381 855
Security
Moveable assets to the value of ZAR 500 million of the South African subsidiaries have been bonded to ABSA Capital as security for an interest bearing loan.
Impairment
During 2014, the Exploration segment in our South Africa segment recognised an impairment loss of USD1 198 741 million. The main elements were a write-down of the idle slim drilling drill rigs to their value in use. The calculation of value in use is most sensitive to mining commodity cycles. The future cash flows of the particular drill rigs were negatively affected by the current declining commodity prices of our customers, which mainly comprise of mining operations. As a result our customers reduced and deferred exploration slim drilling activities.
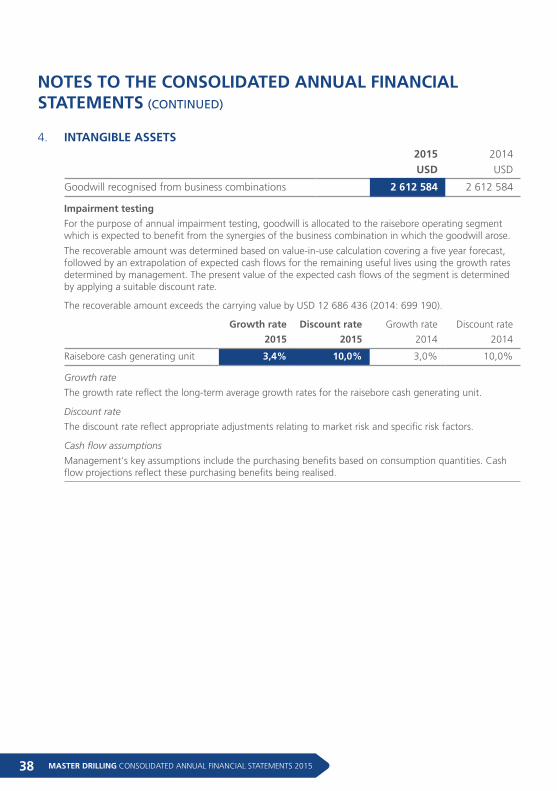
MASTER DRILLING CONSOLIDATED ANNUAL FINANCIAL STATEMENTS 201538
NOTES TO THE CONSOLIDATED ANNUAL FINANCIAL STATEMENTS (CONTINUED)
4. INTANGIBLE ASSETS 2015 2014
USD USD
Goodwill recognised from business combinations 2 612 584 2 612 584
Impairment testing
For the purpose of annual impairment testing, goodwill is allocated to the raisebore operating segment which is expected to benefit from the synergies of the business combination in which the goodwill arose.
The recoverable amount was determined based on value-in-use calculation covering a five year forecast, followed by an extrapolation of expected cash flows for the remaining useful lives using the growth rates determined by management. The present value of the expected cash flows of the segment is determined by applying a suitable discount rate.
The recoverable amount exceeds the carrying value by USD 12 686 436 (2014: 699 190).
Growth rate Discount rate Growth rate Discount rate
2015 2015 2014 2014
Raisebore cash generating unit 3,4% 10,0% 3,0% 10,0%
Growth rate
The growth rate reflect the long-term average growth rates for the raisebore cash generating unit.
Discount rate
The discount rate reflect appropriate adjustments relating to market risk and specific risk factors.
Cash flow assumptions
Management's key assumptions include the purchasing benefits based on consumption quantities. Cash flow projections reflect these purchasing benefits being realised.
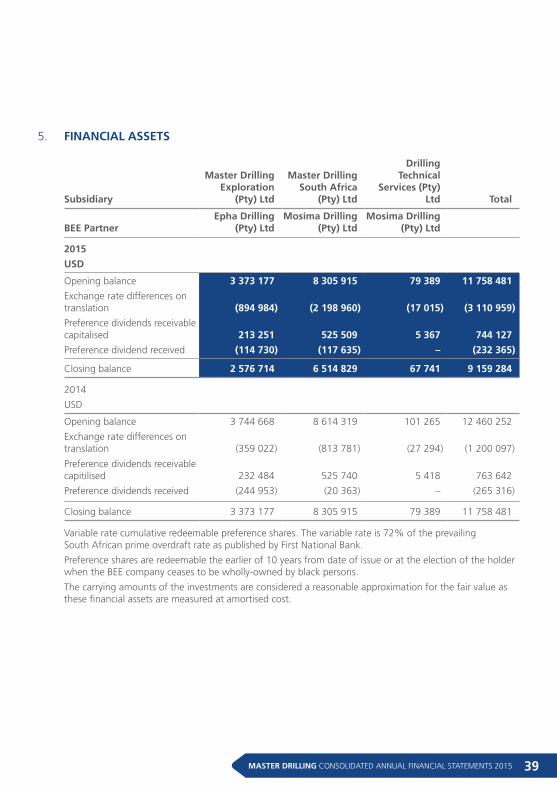
39MASTER DRILLING CONSOLIDATED ANNUAL FINANCIAL STATEMENTS 2015
5. FINANCIAL ASSETS5. Financial assets
Subsidiary
Master Drilling Exploration
(Pty) Ltd
Master Drilling South Africa
(Pty) Ltd
Drilling Technical
Services (Pty) Ltd Total
BEE PartnerEpha Drilling
(Pty) LtdMosima Drilling
(Pty) LtdMosima Drilling
(Pty) Ltd
2015
USD
Opening balance 3 373 177 8 305 915 79 389 11 758 481
Exchange rate differences on translation (894 984) (2 198 960) (17 015) (3 110 959)
Preference dividends receivable capitalised 213 251 525 509 5 367 744 127
Preference dividend received (114 730) (117 635) – (232 365)
Closing balance 2 576 714 6 514 829 67 741 9 159 284
2014
USD
Opening balance 3 744 668 8 614 319 101 265 12 460 252
Exchange rate differences on translation (359 022) (813 781) (27 294) (1 200 097)
Preference dividends receivable capitilised 232 484 525 740 5 418 763 642
Preference dividends received (244 953) (20 363) – (265 316)
Closing balance 3 373 177 8 305 915 79 389 11 758 481
Variable rate cumulative redeemable preference shares. The variable rate is 72% of the prevailing South African prime overdraft rate as published by First National Bank.
Preference shares are redeemable the earlier of 10 years from date of issue or at the election of the holder when the BEE company ceases to be wholly-owned by black persons.
The carrying amounts of the investments are considered a reasonable approximation for the fair value as these financial assets are measured at amortised cost.
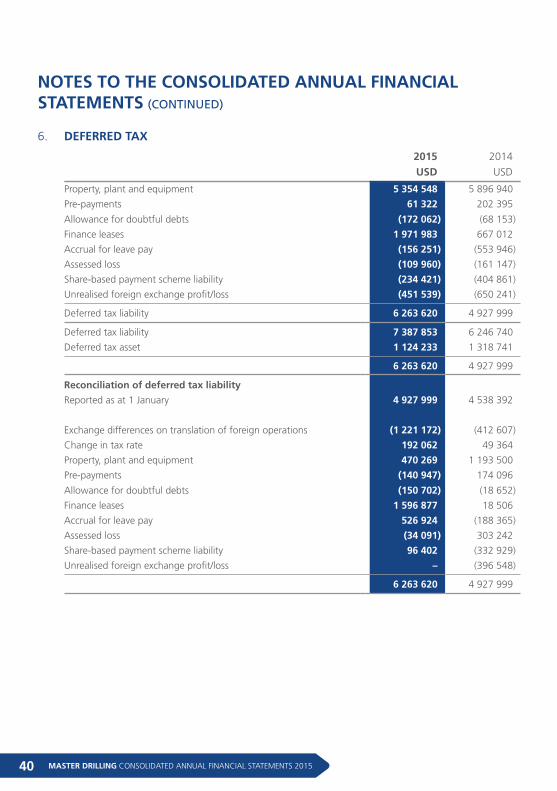
MASTER DRILLING CONSOLIDATED ANNUAL FINANCIAL STATEMENTS 201540
NOTES TO THE CONSOLIDATED ANNUAL FINANCIAL STATEMENTS (CONTINUED)
6. DEFERRED TAX
Property, plant and equipment 5 354 548 5 896 940
Pre-payments 61 322 202 395
Allowance for doubtful debts (172 062) (68 153)
Finance leases 1 971 983 667 012
Accrual for leave pay (156 251) (553 946)
Assessed loss (109 960) (161 147)
Share-based payment scheme liability (234 421) (404 861)
Unrealised foreign exchange profit/loss (451 539) (650 241)
Deferred tax liability 6 263 620 4 927 999
Deferred tax liability 7 387 853 6 246 740
Deferred tax asset 1 124 233 1 318 741
6 263 620 4 927 999
Reconciliation of deferred tax liability
Reported as at 1 January 4 927 999 4 538 392
Exchange differences on translation of foreign operations (1 221 172) (412 607)
Change in tax rate 192 062 49 364
Property, plant and equipment 470 269 1 193 500
Pre-payments (140 947) 174 096
Allowance for doubtful debts (150 702) (18 652)
Finance leases 1 596 877 18 506
Accrual for leave pay 526 924 (188 365)
Assessed loss (34 091) 303 242
Share-based payment scheme liability 96 402 (332 929)
Unrealised foreign exchange profit/loss – (396 548)
6 263 620 4 927 999
2015 2014
USD USD
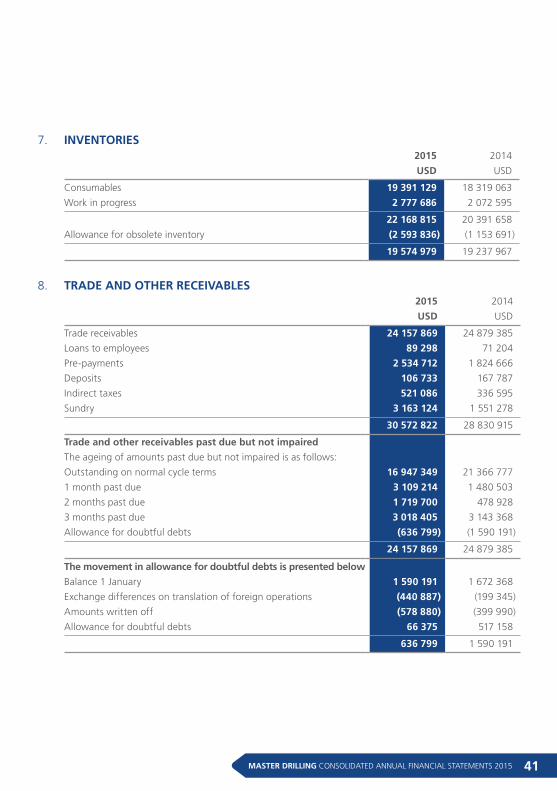
41MASTER DRILLING CONSOLIDATED ANNUAL FINANCIAL STATEMENTS 2015
8. TRADE AND OTHER RECEIVABLES
2015 2014
USD USD
Trade receivables 24 157 869 24 879 385
Loans to employees 89 298 71 204
Pre-payments 2 534 712 1 824 666
Deposits 106 733 167 787
Indirect taxes 521 086 336 595
Sundry 3 163 124 1 551 278
30 572 822 28 830 915
Trade and other receivables past due but not impaired
The ageing of amounts past due but not impaired is as follows:
Outstanding on normal cycle terms 16 947 349 21 366 777
1 month past due 3 109 214 1 480 503
2 months past due 1 719 700 478 928
3 months past due 3 018 405 3 143 368
Allowance for doubtful debts (636 799) (1 590 191)
24 157 869 24 879 385
The movement in allowance for doubtful debts is presented below
Balance 1 January 1 590 191 1 672 368
Exchange differences on translation of foreign operations (440 887) (199 345)
Amounts written off (578 880) (399 990)
Allowance for doubtful debts 66 375 517 158
636 799 1 590 191
7. INVENTORIES
2015 2014
USD USD
Consumables 19 391 129 18 319 063
Work in progress 2 777 686 2 072 595
22 168 815 20 391 658
Allowance for obsolete inventory (2 593 836) (1 153 691)
19 574 979 19 237 967
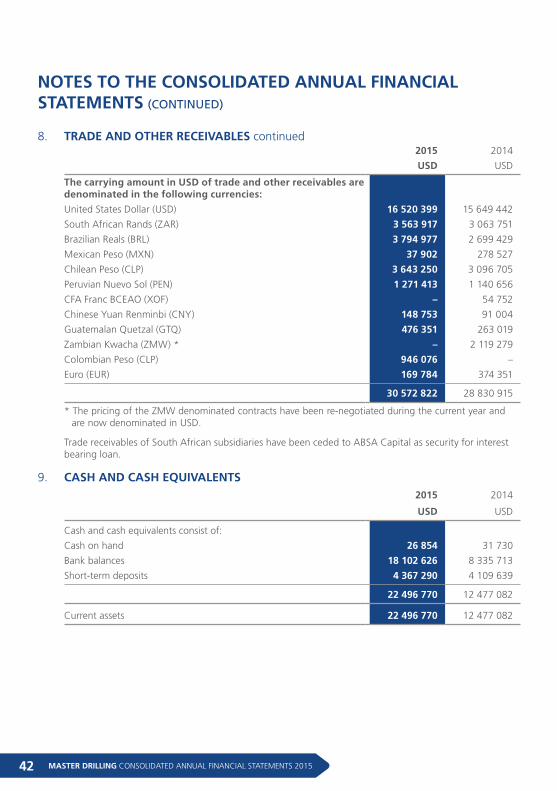
MASTER DRILLING CONSOLIDATED ANNUAL FINANCIAL STATEMENTS 201542
NOTES TO THE CONSOLIDATED ANNUAL FINANCIAL STATEMENTS (CONTINUED)
The carrying amount in USD of trade and other receivables are denominated in the following currencies:
United States Dollar (USD) 16 520 399 15 649 442
South African Rands (ZAR) 3 563 917 3 063 751
Brazilian Reals (BRL) 3 794 977 2 699 429
Mexican Peso (MXN) 37 902 278 527
Chilean Peso (CLP) 3 643 250 3 096 705
Peruvian Nuevo Sol (PEN) 1 271 413 1 140 656
CFA Franc BCEAO (XOF) – 54 752
Chinese Yuan Renminbi (CNY) 148 753 91 004
Guatemalan Quetzal (GTQ) 476 351 263 019
Zambian Kwacha (ZMW) * – 2 119 279
Colombian Peso (CLP) 946 076 –
Euro (EUR) 169 784 374 351
30 572 822 28 830 915
* The pricing of the ZMW denominated contracts have been re-negotiated during the current year and are now denominated in USD.
Trade receivables of South African subsidiaries have been ceded to ABSA Capital as security for interest bearing loan.
8. TRADE AND OTHER RECEIVABLES continued
9. CASH AND CASH EQUIVALENTS 2015 2014
USD USD
Cash and cash equivalents consist of:
Cash on hand 26 854 31 730
Bank balances 18 102 626 8 335 713
Short-term deposits 4 367 290 4 109 639
22 496 770 12 477 082
Current assets 22 496 770 12 477 082
2015 2014
USD USD
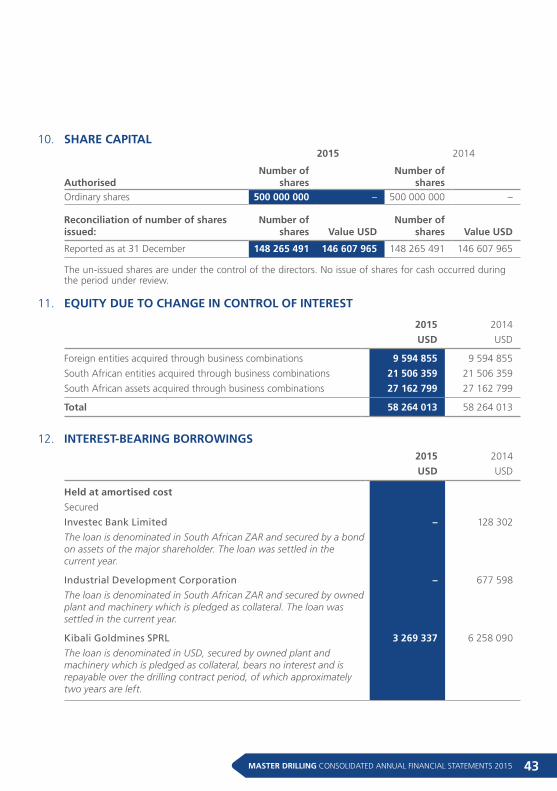
43MASTER DRILLING CONSOLIDATED ANNUAL FINANCIAL STATEMENTS 2015
11. EQUITY DUE TO CHANGE IN CONTROL OF INTEREST
2015 2014
USD USD
Foreign entities acquired through business combinations 9 594 855 9 594 855
South African entities acquired through business combinations 21 506 359 21 506 359
South African assets acquired through business combinations 27 162 799 27 162 799
Total 58 264 013 58 264 013
ww
10. SHARE CAPITAL 2015 2014
AuthorisedNumber of
shares Number of
shares Ordinary shares 500 000 000 – 500 000 000 –
Reconciliation of number of shares issued:
Number of shares Value USD
Number of shares Value USD
Reported as at 31 December 148 265 491 146 607 965 148 265 491 146 607 965
The un-issued shares are under the control of the directors. No issue of shares for cash occurred during the period under review.
12. INTEREST-BEARING BORROWINGS 2015 2014
USD USD
Held at amortised cost
Secured
Investec Bank Limited – 128 302
The loan is denominated in South African ZAR and secured by a bond on assets of the major shareholder. The loan was settled in the current year.
Industrial Development Corporation – 677 598
The loan is denominated in South African ZAR and secured by owned plant and machinery which is pledged as collateral. The loan was settled in the current year.
Kibali Goldmines SPRL 3 269 337 6 258 090
The loan is denominated in USD, secured by owned plant and machinery which is pledged as collateral, bears no interest and is repayable over the drilling contract period, of which approximately two years are left.
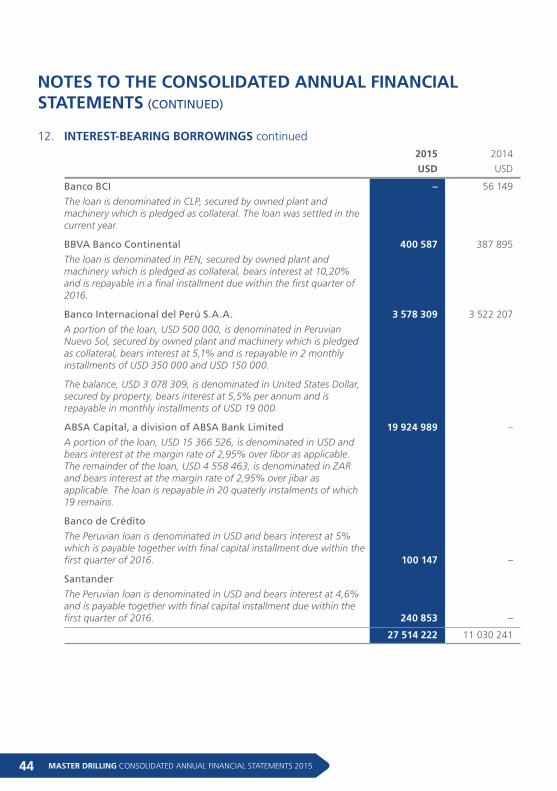
MASTER DRILLING CONSOLIDATED ANNUAL FINANCIAL STATEMENTS 201544
NOTES TO THE CONSOLIDATED ANNUAL FINANCIAL STATEMENTS (CONTINUED)
12. INTEREST-BEARING BORROWINGS continued2015 2014
USD USD
Banco BCI – 56 149
The loan is denominated in CLP, secured by owned plant and machinery which is pledged as collateral. The loan was settled in the current year.
BBVA Banco Continental 400 587 387 895
The loan is denominated in PEN, secured by owned plant and machinery which is pledged as collateral, bears interest at 10,20% and is repayable in a final installment due within the first quarter of 2016.
Banco Internacional del Perú S.A.A. 3 578 309 3 522 207
A portion of the loan, USD 500 000, is denominated in Peruvian Nuevo Sol, secured by owned plant and machinery which is pledged as collateral, bears interest at 5,1% and is repayable in 2 monthly installments of USD 350 000 and USD 150 000.
The balance, USD 3 078 309, is denominated in United States Dollar, secured by property, bears interest at 5,5% per annum and is repayable in monthly installments of USD 19 000.
ABSA Capital, a division of ABSA Bank Limited 19 924 989 –
A portion of the loan, USD 15 366 526, is denominated in USD and bears interest at the margin rate of 2,95% over libor as applicable. The remainder of the loan, USD 4 558 463, is denominated in ZAR and bears interest at the margin rate of 2,95% over jibar as applicable. The loan is repayable in 20 quaterly instalments of which 19 remains.
Banco de Crédito
The Peruvian loan is denominated in USD and bears interest at 5% which is payable together with final capital installment due within the first quarter of 2016. 100 147 –
Santander
The Peruvian loan is denominated in USD and bears interest at 4,6% and is payable together with final capital installment due within the first quarter of 2016. 240 853 –
27 514 222 11 030 241
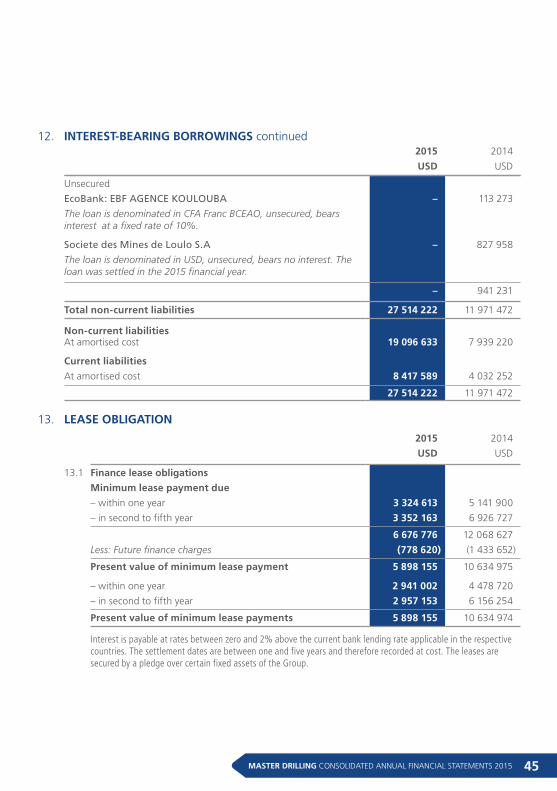
45MASTER DRILLING CONSOLIDATED ANNUAL FINANCIAL STATEMENTS 2015
12. INTEREST-BEARING BORROWINGS continued
Unsecured
EcoBank: EBF AGENCE KOULOUBA – 113 273
The loan is denominated in CFA Franc BCEAO, unsecured, bears interest at a fixed rate of 10%.
Societe des Mines de Loulo S.A – 827 958
The loan is denominated in USD, unsecured, bears no interest. The loan was settled in the 2015 financial year.
– 941 231
Total non-current liabilities 27 514 222 11 971 472
Non-current liabilities At amortised cost 19 096 633 7 939 220 w
Current liabilities
At amortised cost 8 417 589 4 032 252
27 514 222 11 971 472
2015 2014
USD USD
13. LEASE OBLIGATION
2015 2014
USD USD
13.1 Finance lease obligations
Minimum lease payment due
– within one year 3 324 613 5 141 900
– in second to fifth year 3 352 163 6 926 727
6 676 776 12 068 627
Less: Future finance charges (778 620) (1 433 652)
Present value of minimum lease payment 5 898 155 10 634 975
– within one year 2 941 002 4 478 720
– in second to fifth year 2 957 153 6 156 254
Present value of minimum lease payments 5 898 155 10 634 974
Interest is payable at rates between zero and 2% above the current bank lending rate applicable in the respective countries. The settlement dates are between one and five years and therefore recorded at cost. The leases are secured by a pledge over certain fixed assets of the Group.
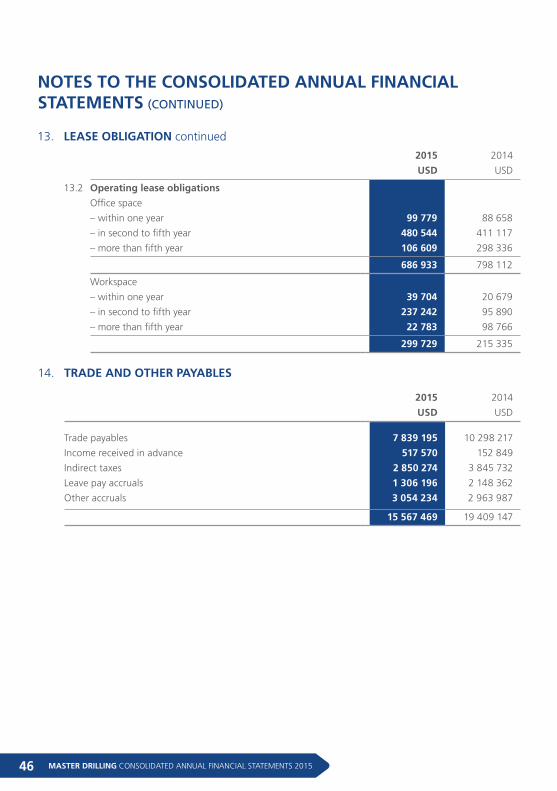
MASTER DRILLING CONSOLIDATED ANNUAL FINANCIAL STATEMENTS 201546
NOTES TO THE CONSOLIDATED ANNUAL FINANCIAL STATEMENTS (CONTINUED)
2015 2014
USD USD14. Trade and other payables
Trade payables 7 839 195 10 298 217
Income received in advance 517 570 152 849
Indirect taxes 2 850 274 3 845 732
Leave pay accruals 1 306 196 2 148 362
Other accruals 3 054 234 2 963 987
15 567 469 19 409 147
13. LEASE OBLIGATION continued
14. TRADE AND OTHER PAYABLES
2015 2014
USD USD
13.2 Operating lease obligations
Office space
– within one year 99 779 88 658
– in second to fifth year 480 544 411 117
– more than fifth year 106 609 298 336
686 933 798 112
Workspace
– within one year 39 704 20 679
– in second to fifth year 237 242 95 890
– more than fifth year 22 783 98 766
299 729 215 335
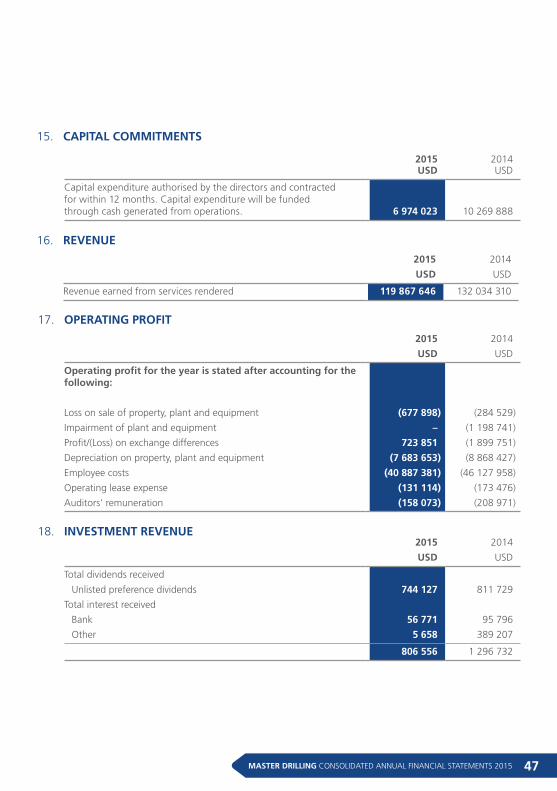
47MASTER DRILLING CONSOLIDATED ANNUAL FINANCIAL STATEMENTS 2015
2015 2014
USD USD
Total dividends received
Unlisted preference dividends 744 127 811 729
Total interest received
Bank 56 771 95 796
Other 5 658 389 207
806 556 1 296 732
18. INVESTMENT REVENUE
17. OPERATING PROFIT
16. REVENUE
15. CAPITAL COMMITMENTS
2015 2014 USD USD
Capital expenditure authorised by the directors and contracted for within 12 months. Capital expenditure will be funded through cash generated from operations. 6 974 023 10 269 888
2015 2014
16.
Revenue USD USD
Revenue earned from services rendered 119 867 646 132 034 310
2015 2014
USD USD
Operating profit for the year is stated after accounting for the following:
Loss on sale of property, plant and equipment (677 898) (284 529)
Impairment of plant and equipment – (1 198 741)
Profit/(Loss) on exchange differences 723 851 (1 899 751)
Depreciation on property, plant and equipment (7 683 653) (8 868 427)
Employee costs (40 887 381) (46 127 958)
Operating lease expense (131 114) (173 476)
Auditors' remuneration (158 073) (208 971)
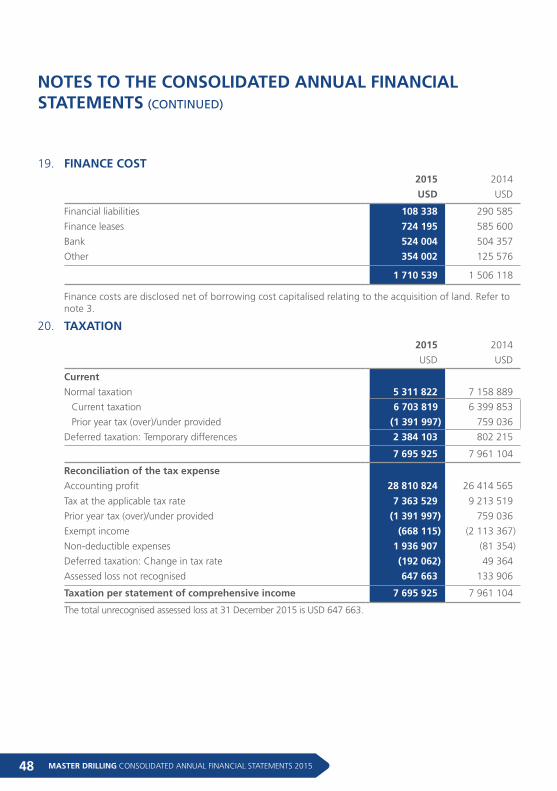
MASTER DRILLING CONSOLIDATED ANNUAL FINANCIAL STATEMENTS 201548
NOTES TO THE CONSOLIDATED ANNUAL FINANCIAL STATEMENTS (CONTINUED)
19. FINANCE COST
2015 2014
USD USD
Financial liabilities 108 338 290 585
Finance leases 724 195 585 600
Bank 524 004 504 357
Other 354 002 125 576
1 710 539 1 506 118
Finance costs are disclosed net of borrowing cost capitalised relating to the acquisition of land. Refer to note 3.
20. TAXATION
2015 2014
USD USD
Current
Normal taxation 5 311 822 7 158 889
Current taxation 6 703 819 6 399 853
Prior year tax (over)/under provided (1 391 997) 759 036
Deferred taxation: Temporary differences 2 384 103 802 215
7 695 925 7 961 104
Reconciliation of the tax expense
Accounting profit 28 810 824 26 414 565
Tax at the applicable tax rate 7 363 529 9 213 519
Prior year tax (over)/under provided (1 391 997) 759 036
Exempt income (668 115) (2 113 367)
Non-deductible expenses 1 936 907 (81 354)
Deferred taxation: Change in tax rate (192 062) 49 364
Assessed loss not recognised 647 663 133 906
Taxation per statement of comprehensive income 7 695 925 7 961 104
The total unrecognised assessed loss at 31 December 2015 is USD 647 663.
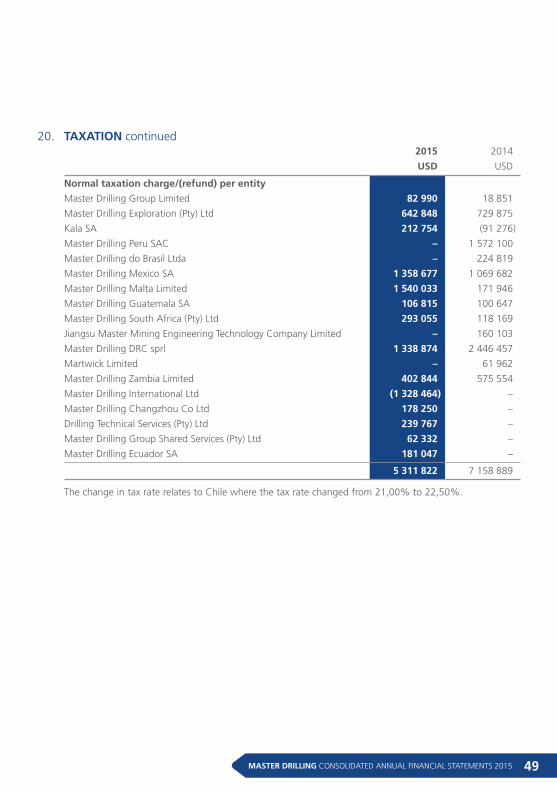
49MASTER DRILLING CONSOLIDATED ANNUAL FINANCIAL STATEMENTS 2015
Normal taxation charge/(refund) per entity
Master Drilling Group Limited 82 990 18 851
Master Drilling Exploration (Pty) Ltd 642 848 729 875
Kala SA 212 754 (91 276)
Master Drilling Peru SAC – 1 572 100
Master Drilling do Brasil Ltda – 224 819
Master Drilling Mexico SA 1 358 677 1 069 682
Master Drilling Malta Limited 1 540 033 171 946
Master Drilling Guatemala SA 106 815 100 647
Master Drilling South Africa (Pty) Ltd 293 055 118 169
Jiangsu Master Mining Engineering Technology Company Limited – 160 103
Master Drilling DRC sprl 1 338 874 2 446 457
Martwick Limited – 61 962
Master Drilling Zambia Limited 402 844 575 554
Master Drilling International Ltd (1 328 464) –
Master Drilling Changzhou Co Ltd 178 250 –
Drilling Technical Services (Pty) Ltd 239 767 –
Master Drilling Group Shared Services (Pty) Ltd 62 332 –
Master Drilling Ecuador SA 181 047 –
5 311 822 7 158 889
The change in tax rate relates to Chile where the tax rate changed from 21,00% to 22,50%.
20. TAXATION continued2015 2014
USD USD
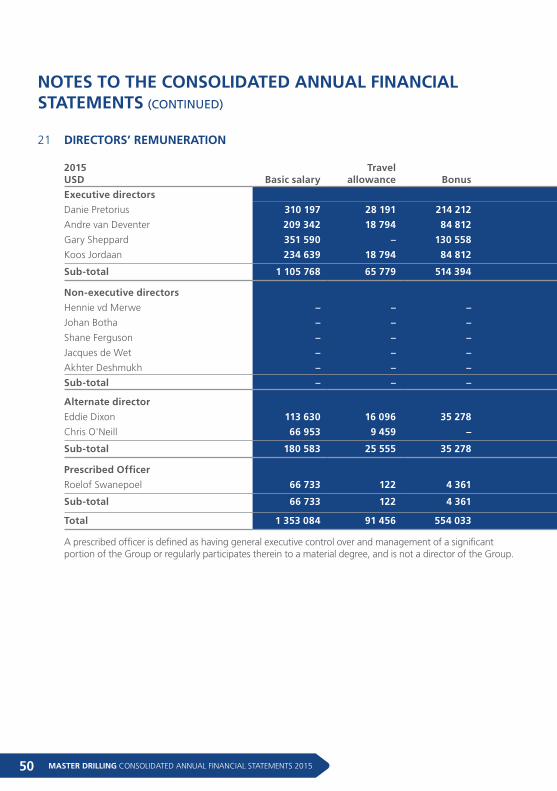
MASTER DRILLING CONSOLIDATED ANNUAL FINANCIAL STATEMENTS 201550
NOTES TO THE CONSOLIDATED ANNUAL FINANCIAL STATEMENTS (CONTINUED)
21 DIRECTORS’ REMUNERATION
2015USD Basic salary
Travel allowance Bonus
Fringe benefits
Provident/Pension fund contributions
Director's fees
Consulting and legal fees
Gains on exercise of
options Total
Executive directors
Danie Pretorius 310 197 28 191 214 212 5 634 13 052 – – – 571 286
Andre van Deventer 209 342 18 794 84 812 3 105 9 070 – – – 325 123
Gary Sheppard 351 590 – 130 558 12 411 11 491 – – – 506 050
Koos Jordaan 234 639 18 794 84 812 3 209 9 049 – – – 350 503
Sub-total 1 105 768 65 779 514 394 24 359 42 662 – – – 1 752 962
Non-executive directors
Hennie vd Merwe – – – – – 41 313 – – 41 313
Johan Botha – – – – – 3 306 – – 3 306
Shane Ferguson – – – – – 26 294 83 337 – 109 631
Jacques de Wet – – – – – 26 294 – – 26 294
Akhter Deshmukh – – – – – 32 884 – – 32 884
Sub-total – – – – – 130 091 83 337 – 213 428
Alternate director
Eddie Dixon 113 630 16 096 35 278 1 764 20 844 – – – 187 612
Chris O'Neill 66 953 9 459 – 792 – 11 197 – – 88 401
Sub-total 180 583 25 555 35 278 2 556 20 844 11 197 – – 276 013
Prescribed Officer
Roelof Swanepoel 66 733 122 4 361 754 7 741 – 79 711
Sub-total 66 733 122 4 361 754 7 741 – – – 79 711
Total 1 353 084 91 456 554 033 27 669 71 247 141 288 83 337 – 2 322 114
A prescribed officer is defined as having general executive control over and management of a significant portion of the Group or regularly participates therein to a material degree, and is not a director of the Group.
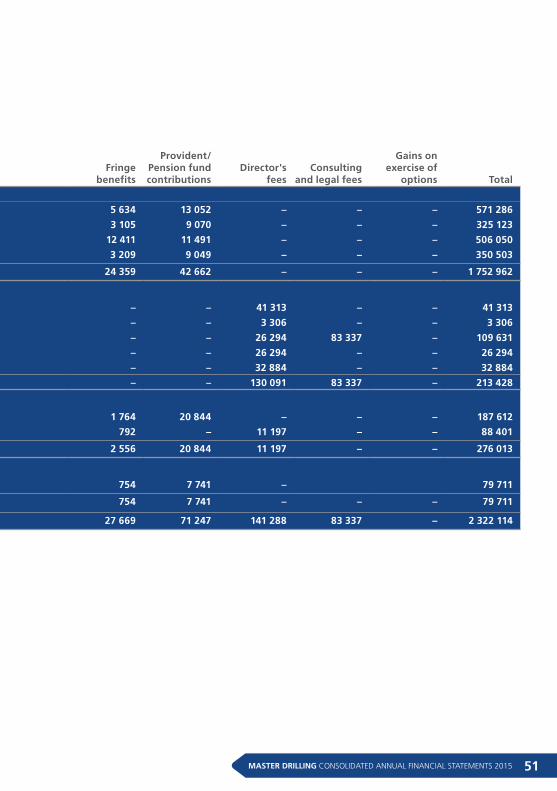
51MASTER DRILLING CONSOLIDATED ANNUAL FINANCIAL STATEMENTS 2015
21 DIRECTORS’ REMUNERATION
2015USD Basic salary
Travel allowance Bonus
Fringe benefits
Provident/Pension fund contributions
Director's fees
Consulting and legal fees
Gains on exercise of
options Total
Executive directors
Danie Pretorius 310 197 28 191 214 212 5 634 13 052 – – – 571 286
Andre van Deventer 209 342 18 794 84 812 3 105 9 070 – – – 325 123
Gary Sheppard 351 590 – 130 558 12 411 11 491 – – – 506 050
Koos Jordaan 234 639 18 794 84 812 3 209 9 049 – – – 350 503
Sub-total 1 105 768 65 779 514 394 24 359 42 662 – – – 1 752 962
Non-executive directors
Hennie vd Merwe – – – – – 41 313 – – 41 313
Johan Botha – – – – – 3 306 – – 3 306
Shane Ferguson – – – – – 26 294 83 337 – 109 631
Jacques de Wet – – – – – 26 294 – – 26 294
Akhter Deshmukh – – – – – 32 884 – – 32 884
Sub-total – – – – – 130 091 83 337 – 213 428
Alternate director
Eddie Dixon 113 630 16 096 35 278 1 764 20 844 – – – 187 612
Chris O'Neill 66 953 9 459 – 792 – 11 197 – – 88 401
Sub-total 180 583 25 555 35 278 2 556 20 844 11 197 – – 276 013
Prescribed Officer
Roelof Swanepoel 66 733 122 4 361 754 7 741 – 79 711
Sub-total 66 733 122 4 361 754 7 741 – – – 79 711
Total 1 353 084 91 456 554 033 27 669 71 247 141 288 83 337 – 2 322 114
A prescribed officer is defined as having general executive control over and management of a significant portion of the Group or regularly participates therein to a material degree, and is not a director of the Group.
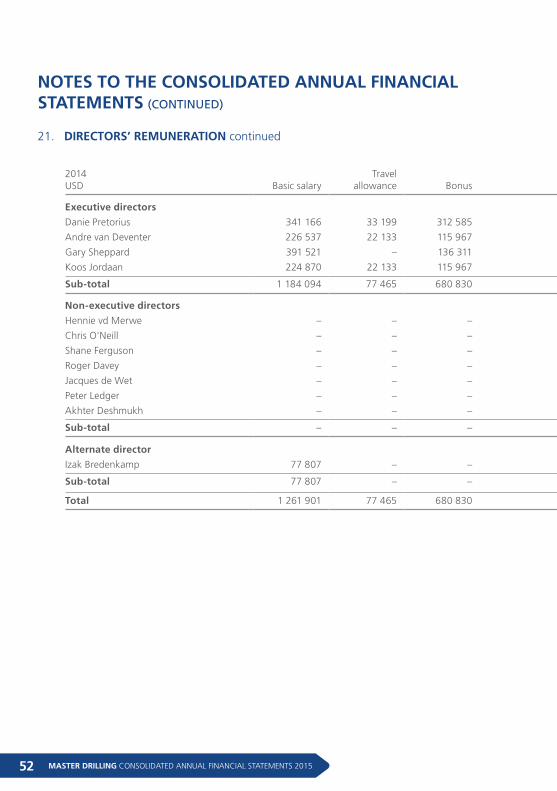
MASTER DRILLING CONSOLIDATED ANNUAL FINANCIAL STATEMENTS 201552
NOTES TO THE CONSOLIDATED ANNUAL FINANCIAL STATEMENTS (CONTINUED)
2014USD Basic salary
Travel allowance Bonus Fringe benefits
Provident/ Pension fund contributions Directors’ fees
Consulting and legal fees
Gains on exercise of
options Total
Executive directors
Danie Pretorius 341 166 33 199 312 585 18 448 – – – – 705 398
Andre van Deventer 226 537 22 133 115 967 12 471 – – – – 377 108
Gary Sheppard 391 521 – 136 311 – 29 196 – – – 557 028
Koos Jordaan 224 870 22 133 115 967 12 516 – – – – 375 486
Sub-total 1 184 094 77 465 680 830 43 435 29 196 – – – 2 015 020
Non-executive directors
Hennie vd Merwe – – – – – 20 335 – – 20 335
Chris O'Neill – – – – – 13 153 – – 13 153
Shane Ferguson – – – – – 23 192 112 719 – 135 911
Roger Davey – – – – – 6 285 – – 6 285
Jacques de Wet – – – – – 26 985 – – 26 985
Peter Ledger – – – – – 27 543 – – 27 543
Akhter Deshmukh – – – – – 26 187 – – 26 187
Sub-total – – – – – 143 680 112 719 – 256 399
Alternate director
Izak Bredenkamp 77 807 – – 5 953 1 962 – – – 85 722
Sub-total 77 807 – – 5 953 1 962 – – – 85 722
Total 1 261 901 77 465 680 830 49 388 31 158 143 680 112 719 – 2 357 141
21. DIRECTORS’ REMUNERATION continued
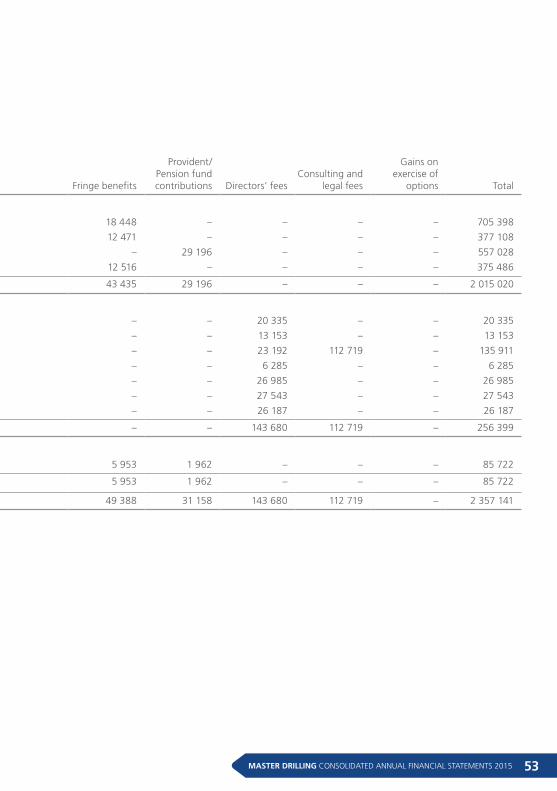
53MASTER DRILLING CONSOLIDATED ANNUAL FINANCIAL STATEMENTS 2015
2014USD Basic salary
Travel allowance Bonus Fringe benefits
Provident/ Pension fund contributions Directors’ fees
Consulting and legal fees
Gains on exercise of
options Total
Executive directors
Danie Pretorius 341 166 33 199 312 585 18 448 – – – – 705 398
Andre van Deventer 226 537 22 133 115 967 12 471 – – – – 377 108
Gary Sheppard 391 521 – 136 311 – 29 196 – – – 557 028
Koos Jordaan 224 870 22 133 115 967 12 516 – – – – 375 486
Sub-total 1 184 094 77 465 680 830 43 435 29 196 – – – 2 015 020
Non-executive directors
Hennie vd Merwe – – – – – 20 335 – – 20 335
Chris O'Neill – – – – – 13 153 – – 13 153
Shane Ferguson – – – – – 23 192 112 719 – 135 911
Roger Davey – – – – – 6 285 – – 6 285
Jacques de Wet – – – – – 26 985 – – 26 985
Peter Ledger – – – – – 27 543 – – 27 543
Akhter Deshmukh – – – – – 26 187 – – 26 187
Sub-total – – – – – 143 680 112 719 – 256 399
Alternate director
Izak Bredenkamp 77 807 – – 5 953 1 962 – – – 85 722
Sub-total 77 807 – – 5 953 1 962 – – – 85 722
Total 1 261 901 77 465 680 830 49 388 31 158 143 680 112 719 – 2 357 141
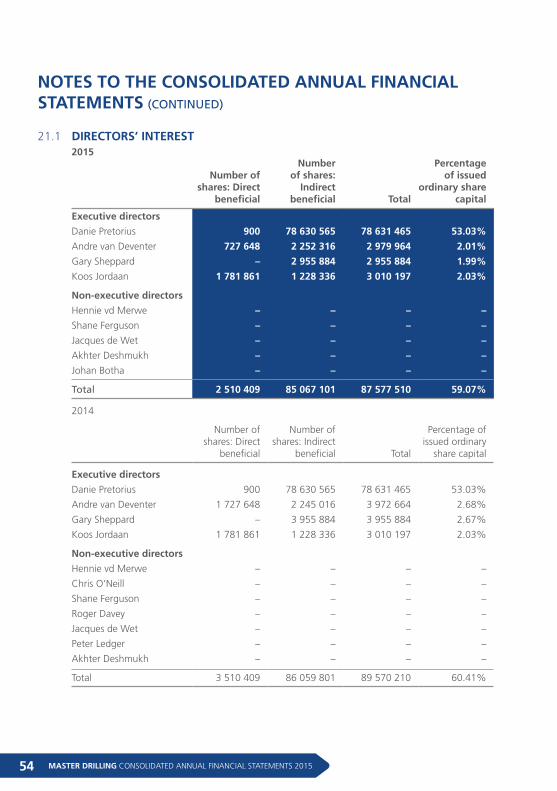
MASTER DRILLING CONSOLIDATED ANNUAL FINANCIAL STATEMENTS 201554
NOTES TO THE CONSOLIDATED ANNUAL FINANCIAL STATEMENTS (CONTINUED)
21.1 DIRECTORS’ INTEREST 2015
Number of shares: Direct
beneficial
Number of shares:
Indirect beneficial Total
Percentage of issued
ordinary share capital
Executive directors
Danie Pretorius 900 78 630 565 78 631 465 53.03%
Andre van Deventer 727 648 2 252 316 2 979 964 2.01%
Gary Sheppard – 2 955 884 2 955 884 1.99%
Koos Jordaan 1 781 861 1 228 336 3 010 197 2.03%
Non-executive directors
Hennie vd Merwe – – – –
Shane Ferguson – – – –
Jacques de Wet – – – –
Akhter Deshmukh – – – –
Johan Botha – – – – – – – –
Total 2 510 409 85 067 101 87 577 510 59.07%
2014
Number of shares: Direct
beneficial
Number of shares: Indirect
beneficial Total
Percentage of issued ordinary
share capital
Executive directors
Danie Pretorius 900 78 630 565 78 631 465 53.03%
Andre van Deventer 1 727 648 2 245 016 3 972 664 2.68%
Gary Sheppard – 3 955 884 3 955 884 2.67%
Koos Jordaan 1 781 861 1 228 336 3 010 197 2.03%
Non-executive directors
Hennie vd Merwe – – – –
Chris O'Neill – – – –
Shane Ferguson – – – –
Roger Davey – – – –
Jacques de Wet – – – –
Peter Ledger – – – –
Akhter Deshmukh – – – –
– – – –
Total 3 510 409 86 059 801 89 570 210 60.41%
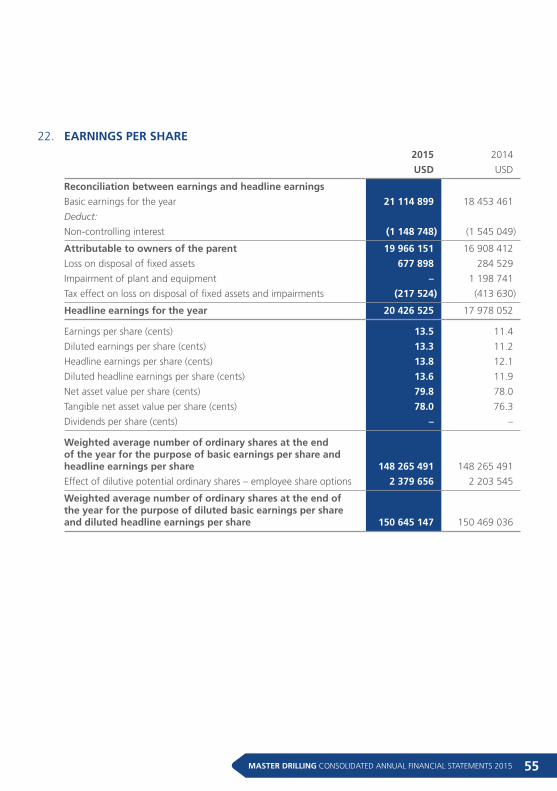
55MASTER DRILLING CONSOLIDATED ANNUAL FINANCIAL STATEMENTS 2015
2015 2014
USD USD
Reconciliation between earnings and headline earnings
Basic earnings for the year 21 114 899 18 453 461
Deduct:
Non-controlling interest (1 148 748) (1 545 049)
Attributable to owners of the parent 19 966 151 16 908 412
Loss on disposal of fixed assets 677 898 284 529
Impairment of plant and equipment – 1 198 741
Tax effect on loss on disposal of fixed assets and impairments (217 524) (413 630)
Headline earnings for the year 20 426 525 17 978 052
Earnings per share (cents) 13.5 11.4
Diluted earnings per share (cents) 13.3 11.2
Headline earnings per share (cents) 13.8 12.1
Diluted headline earnings per share (cents) 13.6 11.9
Net asset value per share (cents) 79.8 78.0
Tangible net asset value per share (cents) 78.0 76.3
Dividends per share (cents) – –
Weighted average number of ordinary shares at the end of the year for the purpose of basic earnings per share and headline earnings per share 148 265 491 148 265 491
Effect of dilutive potential ordinary shares – employee share options 2 379 656 2 203 545
Weighted average number of ordinary shares at the end of the year for the purpose of diluted basic earnings per share and diluted headline earnings per share 150 645 147 150 469 036
22. EARNINGS PER SHARE
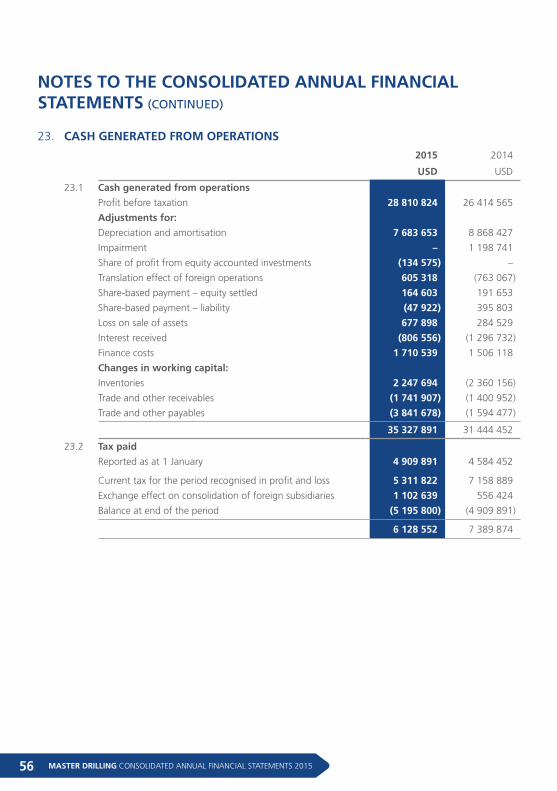
MASTER DRILLING CONSOLIDATED ANNUAL FINANCIAL STATEMENTS 201556
NOTES TO THE CONSOLIDATED ANNUAL FINANCIAL STATEMENTS (CONTINUED)
23.2 Tax paid
Reported as at 1 January 4 909 891 4 584 452
Current tax for the period recognised in profit and loss 5 311 822 7 158 889
Exchange effect on consolidation of foreign subsidiaries 1 102 639 556 424
Balance at end of the period (5 195 800) (4 909 891)
6 128 552 7 389 874
23. CASH GENERATED FROM OPERATIONS
2015 2014
USD USD
23.1 Cash generated from operations
Profit before taxation 28 810 824 26 414 565
Adjustments for:
Depreciation and amortisation 7 683 653 8 868 427
Impairment – 1 198 741
Share of profit from equity accounted investments (134 575) –
Translation effect of foreign operations 605 318 (763 067)
Share-based payment – equity settled 164 603 191 653
Share-based payment – liability (47 922) 395 803
Loss on sale of assets 677 898 284 529
Interest received (806 556) (1 296 732)
Finance costs 1 710 539 1 506 118
Changes in working capital:
Inventories 2 247 694 (2 360 156)
Trade and other receivables (1 741 907) (1 400 952)
Trade and other payables (3 841 678) (1 594 477)
35 327 891 31 444 452
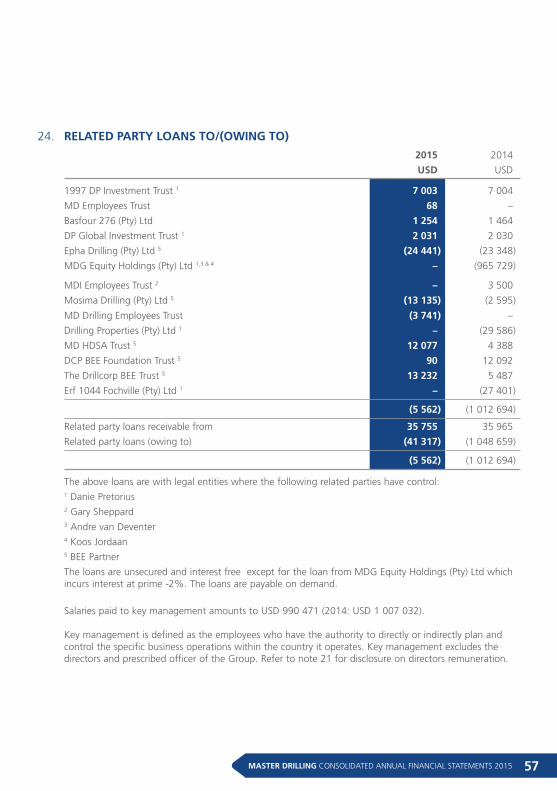
57MASTER DRILLING CONSOLIDATED ANNUAL FINANCIAL STATEMENTS 2015
2015 2014
USD USD
1997 DP Investment Trust 1 7 003 7 004
MD Employees Trust 68 –
Basfour 276 (Pty) Ltd 1 254 1 464
DP Global Investment Trust 1 2 031 2 030
Epha Drilling (Pty) Ltd 5 (24 441) (23 348)
MDG Equity Holdings (Pty) Ltd 1,3 & 4 – (965 729)
MDI Employees Trust 2 – 3 500
Mosima Drilling (Pty) Ltd 5 (13 135) (2 595)
MD Drilling Employees Trust (3 741) –
Drilling Properties (Pty) Ltd 1 – (29 586)
MD HDSA Trust 5 12 077 4 388
DCP BEE Foundation Trust 5 90 12 092
The Drillcorp BEE Trust 5 13 232 5 487
Erf 1044 Fochville (Pty) Ltd 1 – (27 401)
(5 562) (1 012 694)
Related party loans receivable from 35 755 35 965
Related party loans (owing to) (41 317) (1 048 659)
(5 562) (1 012 694)
The above loans are with legal entities where the following related parties have control:
1 Danie Pretorius
2 Gary Sheppard
3 Andre van Deventer
4 Koos Jordaan
5 BEE Partner
The loans are unsecured and interest free except for the loan from MDG Equity Holdings (Pty) Ltd which incurs interest at prime -2%. The loans are payable on demand.
Salaries paid to key management amounts to USD 990 471 (2014: USD 1 007 032).
Key management is defined as the employees who have the authority to directly or indirectly plan and control the specific business operations within the country it operates. Key management excludes the directors and prescribed officer of the Group. Refer to note 21 for disclosure on directors remuneration.
24. RELATED PARTY LOANS TO/(OWING TO)
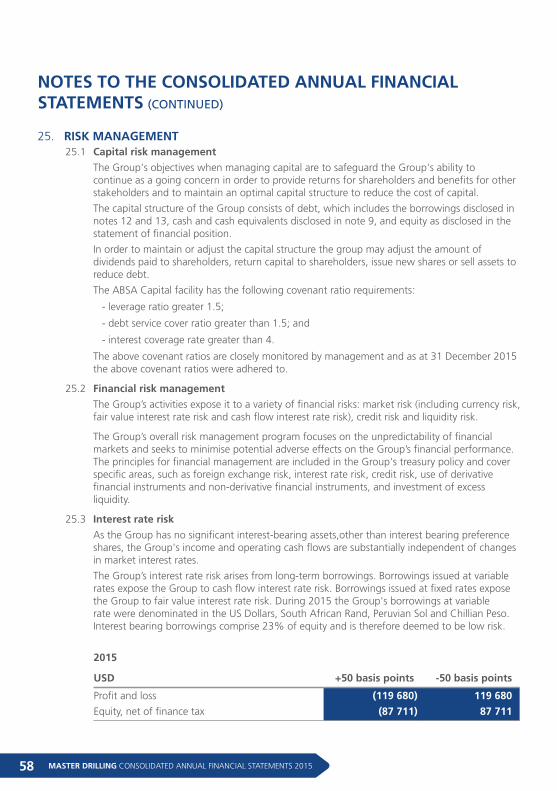
MASTER DRILLING CONSOLIDATED ANNUAL FINANCIAL STATEMENTS 201558
NOTES TO THE CONSOLIDATED ANNUAL FINANCIAL STATEMENTS (CONTINUED)
25. RISK MANAGEMENT
25.1 Capital risk management
The Group's objectives when managing capital are to safeguard the Group's ability to continue as a going concern in order to provide returns for shareholders and benefits for other stakeholders and to maintain an optimal capital structure to reduce the cost of capital.
The capital structure of the Group consists of debt, which includes the borrowings disclosed in notes 12 and 13, cash and cash equivalents disclosed in note 9, and equity as disclosed in the statement of financial position.
In order to maintain or adjust the capital structure the group may adjust the amount of dividends paid to shareholders, return capital to shareholders, issue new shares or sell assets to reduce debt.
The ABSA Capital facility has the following covenant ratio requirements:
- leverage ratio greater 1.5;
- debt service cover ratio greater than 1.5; and
- interest coverage rate greater than 4.
The above covenant ratios are closely monitored by management and as at 31 December 2015 the above covenant ratios were adhered to.
25.2 Financial risk management
The Group’s activities expose it to a variety of financial risks: market risk (including currency risk, fair value interest rate risk and cash flow interest rate risk), credit risk and liquidity risk.
The Group’s overall risk management program focuses on the unpredictability of financial markets and seeks to minimise potential adverse effects on the Group’s financial performance. The principles for financial management are included in the Group's treasury policy and cover specific areas, such as foreign exchange risk, interest rate risk, credit risk, use of derivative financial instruments and non-derivative financial instruments, and investment of excess liquidity.
25.3 Interest rate risk
As the Group has no significant interest-bearing assets,other than interest bearing preference shares, the Group's income and operating cash flows are substantially independent of changes in market interest rates.
The Group’s interest rate risk arises from long-term borrowings. Borrowings issued at variable rates expose the Group to cash flow interest rate risk. Borrowings issued at fixed rates expose the Group to fair value interest rate risk. During 2015 the Group's borrowings at variable rate were denominated in the US Dollars, South African Rand, Peruvian Sol and Chillian Peso. Interest bearing borrowings comprise 23% of equity and is therefore deemed to be low risk.
2015
USD +50 basis points -50 basis points
Profit and loss (119 680) 119 680
Equity, net of finance tax (87 711) 87 711
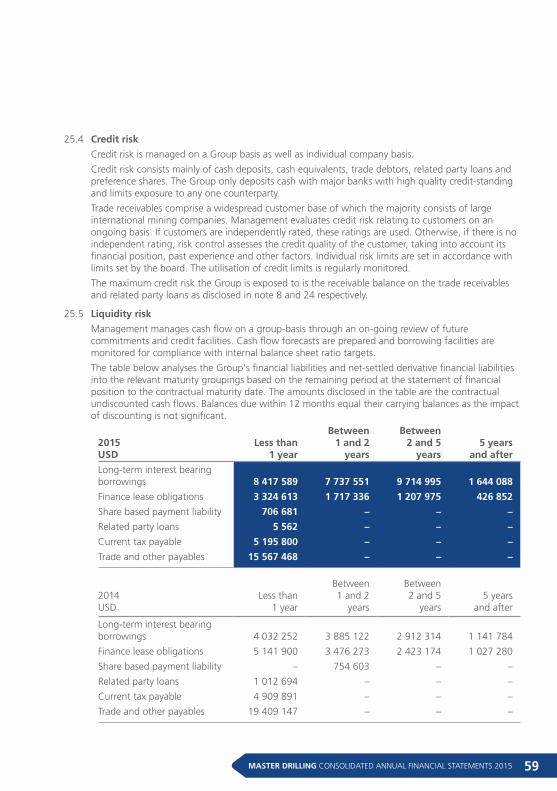
59MASTER DRILLING CONSOLIDATED ANNUAL FINANCIAL STATEMENTS 2015
25.4 Credit risk
Credit risk is managed on a Group basis as well as individual company basis.
Credit risk consists mainly of cash deposits, cash equivalents, trade debtors, related party loans and preference shares. The Group only deposits cash with major banks with high quality credit-standing and limits exposure to any one counterparty.
Trade receivables comprise a widespread customer base of which the majority consists of large international mining companies. Management evaluates credit risk relating to customers on an ongoing basis. If customers are independently rated, these ratings are used. Otherwise, if there is no independent rating, risk control assesses the credit quality of the customer, taking into account its financial position, past experience and other factors. Individual risk limits are set in accordance with limits set by the board. The utilisation of credit limits is regularly monitored.
The maximum credit risk the Group is exposed to is the receivable balance on the trade receivables and related party loans as disclosed in note 8 and 24 respectively.
25.5 Liquidity risk
Management manages cash flow on a group-basis through an on-going review of future commitments and credit facilities. Cash flow forecasts are prepared and borrowing facilities are monitored for compliance with internal balance sheet ratio targets.
The table below analyses the Group's financial liabilities and net-settled derivative financial liabilities into the relevant maturity groupings based on the remaining period at the statement of financial position to the contractual maturity date. The amounts disclosed in the table are the contractual undiscounted cash flows. Balances due within 12 months equal their carrying balances as the impact of discounting is not significant.
2015USD
Less than 1 year
Between 1 and 2
years
Between 2 and 5
years5 years
and after
Long-term interest bearing borrowings 8 417 589 7 737 551 9 714 995 1 644 088
Finance lease obligations 3 324 613 1 717 336 1 207 975 426 852
Share based payment liability 706 681 – – –
Related party loans 5 562 – – –
Current tax payable 5 195 800 – – –
Trade and other payables 15 567 468 – – –
2014USD
Less than 1 year
Between 1 and 2
years
Between 2 and 5
years5 years
and after
Long-term interest bearing borrowings 4 032 252 3 885 122 2 912 314 1 141 784
Finance lease obligations 5 141 900 3 476 273 2 423 174 1 027 280
Share based payment liability – 754 603 – –
Related party loans 1 012 694 – – –
Current tax payable 4 909 891 – – –
Trade and other payables 19 409 147 – – –
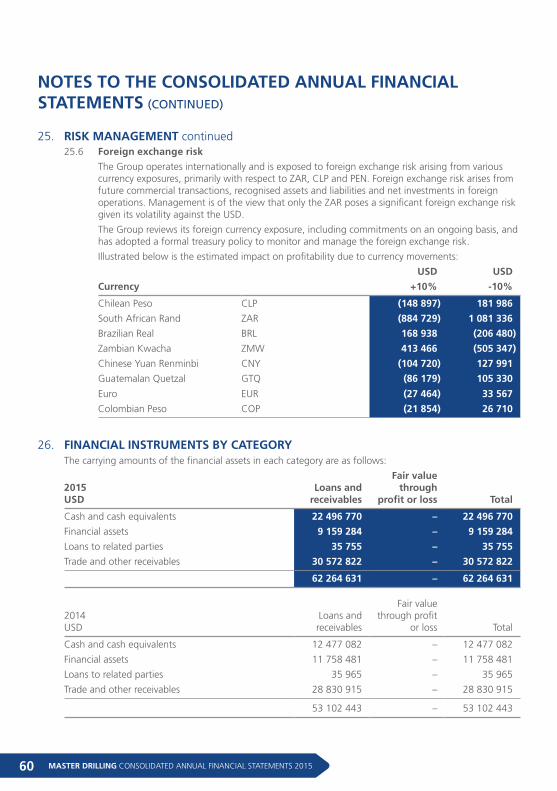
MASTER DRILLING CONSOLIDATED ANNUAL FINANCIAL STATEMENTS 201560
NOTES TO THE CONSOLIDATED ANNUAL FINANCIAL STATEMENTS (CONTINUED)
26. FINANCIAL INSTRUMENTS BY CATEGORY The carrying amounts of the financial assets in each category are as follows:
2015USD
Loans and receivables
Fair value through
profit or loss Total
Cash and cash equivalents 22 496 770 – 22 496 770
Financial assets 9 159 284 – 9 159 284
Loans to related parties 35 755 – 35 755
Trade and other receivables 30 572 822 – 30 572 822
62 264 631 – 62 264 631
2014USD
Loans and receivables
Fair value through profit
or loss Total
Cash and cash equivalents 12 477 082 – 12 477 082
Financial assets 11 758 481 – 11 758 481
Loans to related parties 35 965 – 35 965
Trade and other receivables 28 830 915 – 28 830 915
53 102 443 – 53 102 443
25.6 Foreign exchange risk
The Group operates internationally and is exposed to foreign exchange risk arising from various currency exposures, primarily with respect to ZAR, CLP and PEN. Foreign exchange risk arises from future commercial transactions, recognised assets and liabilities and net investments in foreign operations. Management is of the view that only the ZAR poses a significant foreign exchange risk given its volatility against the USD.
The Group reviews its foreign currency exposure, including commitments on an ongoing basis, and has adopted a formal treasury policy to monitor and manage the foreign exchange risk.
Illustrated below is the estimated impact on profitability due to currency movements:
USD USD
Currency +10% -10%
Chilean Peso CLP (148 897) 181 986
South African Rand ZAR (884 729) 1 081 336
Brazilian Real BRL 168 938 (206 480)
Zambian Kwacha ZMW 413 466 (505 347)
Chinese Yuan Renminbi CNY (104 720) 127 991
Guatemalan Quetzal GTQ (86 179) 105 330
Euro EUR (27 464) 33 567
Colombian Peso COP (21 854) 26 710
25. RISK MANAGEMENT continued
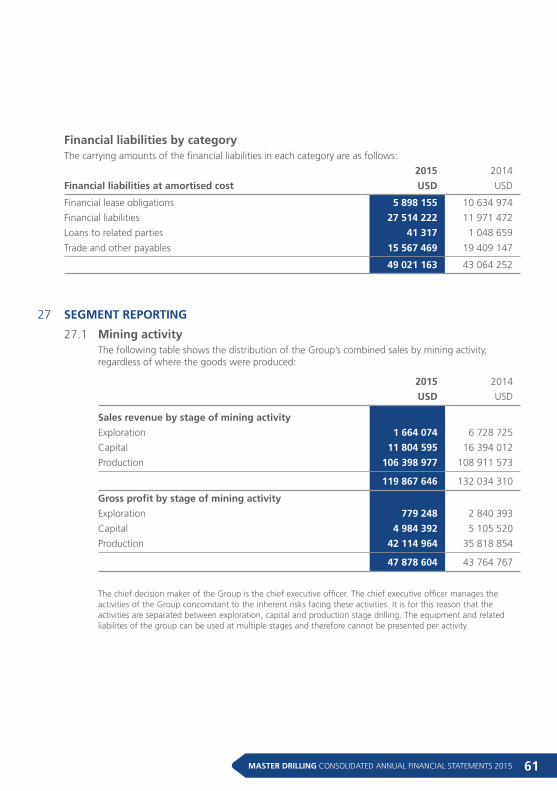
61MASTER DRILLING CONSOLIDATED ANNUAL FINANCIAL STATEMENTS 2015
Financial liabilities by categoryThe carrying amounts of the financial liabilities in each category are as follows:
2015 2014
Financial liabilities at amortised cost USD USD
Financial lease obligations 5 898 155 10 634 974
Financial liabilities 27 514 222 11 971 472
Loans to related parties 41 317 1 048 659
Trade and other payables 15 567 469 19 409 147
49 021 163 43 064 252
27 SEGMENT REPORTING 27.1 Mining activity
The following table shows the distribution of the Group’s combined sales by mining activity, regardless of where the goods were produced:
Sales revenue by stage of mining activity
Exploration 1 664 074 6 728 725
Capital 11 804 595 16 394 012
Production 106 398 977 108 911 573
119 867 646 132 034 310
Gross profit by stage of mining activity
Exploration 779 248 2 840 393
Capital 4 984 392 5 105 520
Production 42 114 964 35 818 854
47 878 604 43 764 767
The chief decision maker of the Group is the chief executive officer. The chief executive officer manages the activities of the Group concomitant to the inherent risks facing these activities. It is for this reason that the activities are separated between exploration, capital and production stage drilling. The equipment and related liabilites of the group can be used at multiple stages and therefore cannot be presented per activity.
2015 2014
USD USD
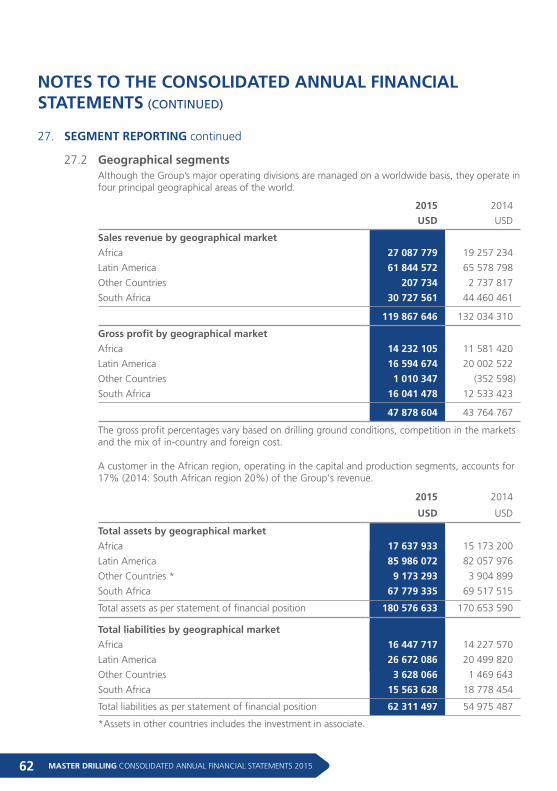
MASTER DRILLING CONSOLIDATED ANNUAL FINANCIAL STATEMENTS 201562
NOTES TO THE CONSOLIDATED ANNUAL FINANCIAL STATEMENTS (CONTINUED)
27. SEGMENT REPORTING continued
27.2 Geographical segments
Although the Group’s major operating divisions are managed on a worldwide basis, they operate in four principal geographical areas of the world.
Sales revenue by geographical market
Africa 27 087 779 19 257 234
Latin America 61 844 572 65 578 798
Other Countries 207 734 2 737 817
South Africa 30 727 561 44 460 461
119 867 646 132 034 310
Gross profit by geographical market
Africa 14 232 105 11 581 420
Latin America 16 594 674 20 002 522
Other Countries 1 010 347 (352 598)
South Africa 16 041 478 12 533 423
47 878 604 43 764 767
The gross profit percentages vary based on drilling ground conditions, competition in the markets and the mix of in-country and foreign cost.
A customer in the African region, operating in the capital and production segments, accounts for 17% (2014: South African region 20%) of the Group's revenue.
2015 2014
USD USD
Total assets by geographical market
Africa 17 637 933 15 173 200
Latin America 85 986 072 82 057 976
Other Countries * 9 173 293 3 904 899
South Africa 67 779 335 69 517 515
Total assets as per statement of financial position 180 576 633 170 653 590
Total liabilities by geographical market
Africa 16 447 717 14 227 570
Latin America 26 672 086 20 499 820
Other Countries 3 628 066 1 469 643
South Africa 15 563 628 18 778 454
Total liabilities as per statement of financial position 62 311 497 54 975 487
*Assets in other countries includes the investment in associate.
2015 2014
USD USD
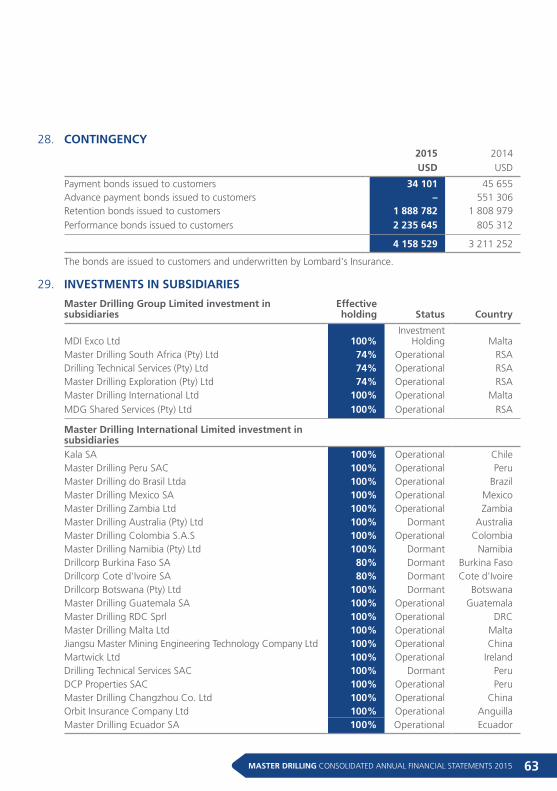
63MASTER DRILLING CONSOLIDATED ANNUAL FINANCIAL STATEMENTS 2015
28. CONTINGENCY 2015 2014
USD USD
Payment bonds issued to customers 34 101 45 655 Advance payment bonds issued to customers – 551 306 Retention bonds issued to customers 1 888 782 1 808 979
Performance bonds issued to customers 2 235 645 805 312
4 158 529 3 211 252
The bonds are issued to customers and underwritten by Lombard's Insurance.
29. INVESTMENTS IN SUBSIDIARIES
Master Drilling Group Limited investment in subsidiaries
Effective holding Status Country
MDI Exco Ltd 100%Investment
Holding Malta Master Drilling South Africa (Pty) Ltd 74% Operational RSA Drilling Technical Services (Pty) Ltd 74% Operational RSA Master Drilling Exploration (Pty) Ltd 74% Operational RSA Master Drilling International Ltd 100% Operational Malta
MDG Shared Services (Pty) Ltd 100% Operational RSA
Master Drilling International Limited investment in subsidiaries
Kala SA 100% Operational Chile Master Drilling Peru SAC 100% Operational Peru Master Drilling do Brasil Ltda 100% Operational Brazil Master Drilling Mexico SA 100% Operational Mexico Master Drilling Zambia Ltd 100% Operational Zambia Master Drilling Australia (Pty) Ltd 100% Dormant Australia Master Drilling Colombia S.A.S 100% Operational Colombia Master Drilling Namibia (Pty) Ltd 100% Dormant Namibia Drillcorp Burkina Faso SA 80% Dormant Burkina Faso Drillcorp Cote d'Ivoire SA 80% Dormant Cote d'Ivoire Drillcorp Botswana (Pty) Ltd 100% Dormant Botswana Master Drilling Guatemala SA 100% Operational Guatemala Master Drilling RDC Sprl 100% Operational DRC Master Drilling Malta Ltd 100% Operational Malta Jiangsu Master Mining Engineering Technology Company Ltd 100% Operational China Martwick Ltd 100% Operational Ireland Drilling Technical Services SAC 100% Dormant Peru DCP Properties SAC 100% Operational Peru Master Drilling Changzhou Co. Ltd 100% Operational China Orbit Insurance Company Ltd 100% Operational Anguilla Master Drilling Ecuador SA 100% Operational Ecuador
MASTER DRILLING CONSOLIDATED ANNUAL FINANCIAL STATEMENTS 201564
NOTES TO THE CONSOLIDATED ANNUAL FINANCIAL STATEMENTS (CONTINUED)
30. RELATED PARTIES
Relationships
Subsidiaries Refer to note 29
Shareholder with significant influence AMI Trust
MDG Equity Holdings (Pty) Ltd
Companies controlled by directors Refer to note 24
Related party balances Refer to note 24
Associate Refer to note 34
31. SHARE OPTION SCHEME
General
The Group adopted the plan on 15 November 2012. The plan will be administered by its compliance officer under the direction of the remuneration committee (the "RemCo"). The plan will allow the grant of options to acquire fully paid ordinary shares to eligible employees after admission. An eligible employee is any employee (including any executive director) of any member of the group, but shall not include any non-executive director of the group, any member of the RemCo or any trustee of an employee benefit trust.
Any eligible employee selected at the discretion of the RemCo shall be eligible to receive grants under the plan. In making this selection, the RemCo shall take into account the contribution of the eligible employee's division to the Group and his/her individual performance measured in the context of the applicable internal performance appraisal process, amongst other factors.
Form of option
The Plan will allow for the grant of options in such form as the RemCo may consider appropriate, including to allow for options to be granted to individuals in jurisdictions outside the Republic of South Africa, subject to appropriate regulatory approvals. The plan will allow for the grant of options with an exercise price determined by the RemCo at the date of grant, being 85% of the market value of a share on that date. Options will be granted for no consideration and will be non-transferable, except to the option holder's heirs or executors on death.
Plan limits
Overall
The maximum number of shares in respect of which options can be granted under the plan is five million shares. Options may be settled by existing shares purchased through the market, newly issued shares or shares held in treasury. Shares purchased through the market will not count towards this plan limit.
Individual
The maximum number of shares in respect of which options can be granted to any one option holder under the Plan is 500 000 shares in any three year cycle. Subject to this, the maximum value of shares subject to an option to be awarded to an option holder will not usually exceed 200% of his/her base salary per financial year of the Group.
Vesting and exercise
Options will vest no earlier than the third anniversary of the date of grant. Options can be exercised in whole or in part once they have vested up to the tenth anniversary of the date of grant.
65MASTER DRILLING CONSOLIDATED ANNUAL FINANCIAL STATEMENTS 2015
32. SHARE-BASED PAYMENTS Long term incentive scheme
The long term incentive is granted to eligible employees of the parent. The incentive comprises of the issue of either shares in the company, phantom shares based on the company shares or cash settlement. Vesting are dependant on the performance conditions which include annual compound growth in profit after tax as well as the annual compound growth in the share price of Master Drilling Group Limited.
The eligible employee must remain in service of the Group until terminal date, 31 December 2015.
The expense recognised for employee services received during the year is as follows:
2015 2014
USD USD
Expense arising from cash-settled share-based payment transactions 878 241 419 295
Cessation of employment or office
In the event that an option holder ceases to be an employee or officer of the Group or a Group company, their options will generally lapse. Where the reason for leaving is death, disability, retirement (with agreement of the RemCo) or retrenchment, options will vest and become exercisable for a limited period following the date of cessation, as they will for any other reason determined at the sole discretion of the RemCo.
Corporate transactions
On a change of control of the Group, a takeover, merger or on a voluntary winding up, unvested options will vest and become exercisable for a limited period, subject a pro rata reduction of the option to reflect the period between grant and change of control. Vested options remain exercisable for a limited period. However, no subsisting option may be rolled over, i.e. released in consideration of the grant of a new option in the acquiring company (including the arrangement that assumes equity securities which have already vested and been issued in terms of the plan, and which usually revert back to the overall plan limits referred to above.
Variation of share capital
In the event of any sub-division or consolidation, the RemCo shall, and in the event of a capitalisation issue, special dividend, rights issue or reduction of capital, it may, vary the number of shares subject to options and their exercise price, as well as the plan and individual limits in such manner as it considers appropriate, in accordance with the JSE listings requirements, having first obtained auditor confirmation.
Voting and dividend rights
Option holders will have no right to voting or dividends until the acquisition of the shares following exercise of the option.
Amendments
The rules of the plan may be amended from time to time by the RemCo, except to the extent the JSE listings requirements requires such amendment to be approved by an ordinary resolution passed at a general meeting of the Group with a 75% majority (excluding shares held by option holders).
Options issued
During 2015, 195 000 options have been granted as at 31 December 2015 and the date of this report. Refer to note 32.
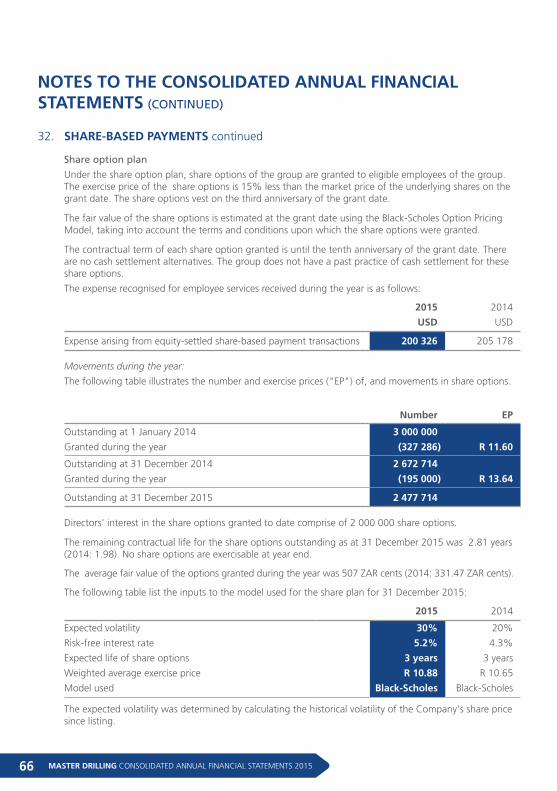
MASTER DRILLING CONSOLIDATED ANNUAL FINANCIAL STATEMENTS 201566
NOTES TO THE CONSOLIDATED ANNUAL FINANCIAL STATEMENTS (CONTINUED)
Share option plan
Under the share option plan, share options of the group are granted to eligible employees of the group. The exercise price of the share options is 15% less than the market price of the underlying shares on the grant date. The share options vest on the third anniversary of the grant date.
The fair value of the share options is estimated at the grant date using the Black-Scholes Option Pricing Model, taking into account the terms and conditions upon which the share options were granted.
The contractual term of each share option granted is until the tenth anniversary of the grant date. There are no cash settlement alternatives. The group does not have a past practice of cash settlement for these share options.
The expense recognised for employee services received during the year is as follows:
2015 2014
USD USD
Expense arising from equity-settled share-based payment transactions 200 326 205 178
Movements during the year:
The following table illustrates the number and exercise prices ("EP") of, and movements in share options.
Number EP
Outstanding at 1 January 2014 3 000 000
Granted during the year (327 286) R 11.60
Outstanding at 31 December 2014 2 672 714
Granted during the year (195 000) R 13.64
Outstanding at 31 December 2015 2 477 714
Directors' interest in the share options granted to date comprise of 2 000 000 share options.
The remaining contractual life for the share options outstanding as at 31 December 2015 was 2.81 years (2014: 1.98). No share options are exercisable at year end.
The average fair value of the options granted during the year was 507 ZAR cents (2014: 331.47 ZAR cents).
The following table list the inputs to the model used for the share plan for 31 December 2015:
2015 2014
Expected volatility 30% 20%
Risk-free interest rate 5.2% 4.3%
Expected life of share options 3 years 3 years
Weighted average exercise price R 10.88 R 10.65
Model used Black-Scholes Black-Scholes
The expected volatility was determined by calculating the historical volatility of the Company's share price since listing.
32. SHARE-BASED PAYMENTS continued
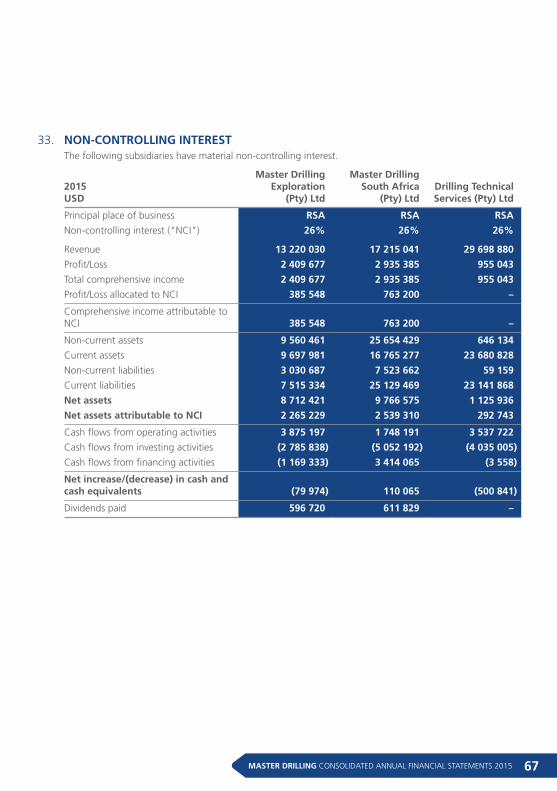
67MASTER DRILLING CONSOLIDATED ANNUAL FINANCIAL STATEMENTS 2015
33. NON-CONTROLLING INTEREST The following subsidiaries have material non-controlling interest.
2015USD
Master Drilling Exploration
(Pty) Ltd
Master Drilling South Africa
(Pty) LtdDrilling Technical Services (Pty) Ltd
Principal place of business RSA RSA RSA
Non-controlling interest ("NCI") 26% 26% 26%
Revenue 13 220 030 17 215 041 29 698 880
Profit/Loss 2 409 677 2 935 385 955 043
Total comprehensive income 2 409 677 2 935 385 955 043
Profit/Loss allocated to NCI 385 548 763 200 –
Comprehensive income attributable to NCI 385 548 763 200 –
Non-current assets 9 560 461 25 654 429 646 134
Current assets 9 697 981 16 765 277 23 680 828
Non-current liabilities 3 030 687 7 523 662 59 159
Current liabilities 7 515 334 25 129 469 23 141 868
Net assets 8 712 421 9 766 575 1 125 936
Net assets attributable to NCI 2 265 229 2 539 310 292 743
Cash flows from operating activities 3 875 197 1 748 191 3 537 722
Cash flows from investing activities (2 785 838) (5 052 192) (4 035 005)
Cash flows from financing activities (1 169 333) 3 414 065 (3 558)
Net increase/(decrease) in cash and cash equivalents (79 974) 110 065 (500 841)
Dividends paid 596 720 611 829 –
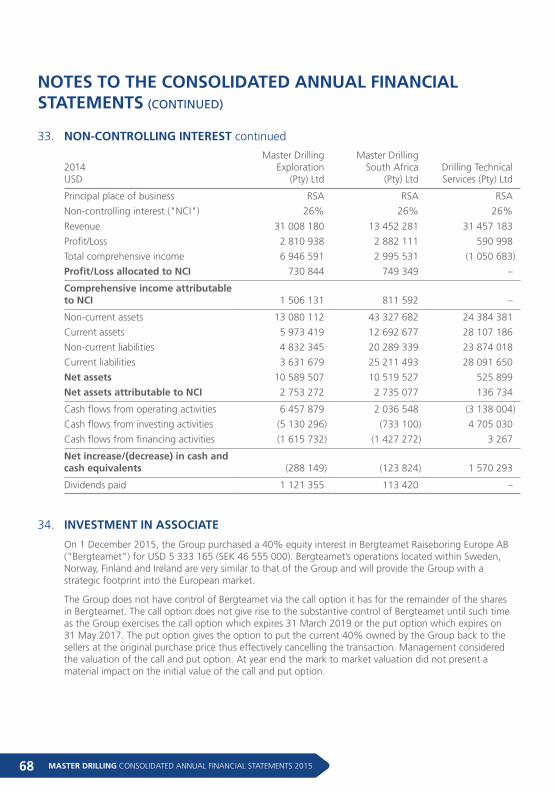
MASTER DRILLING CONSOLIDATED ANNUAL FINANCIAL STATEMENTS 201568
NOTES TO THE CONSOLIDATED ANNUAL FINANCIAL STATEMENTS (CONTINUED)
2014USD
Master Drilling Exploration
(Pty) Ltd
Master Drilling South Africa
(Pty) LtdDrilling Technical Services (Pty) Ltd
Principal place of business RSA RSA RSA
Non-controlling interest ("NCI") 26% 26% 26%
Revenue 31 008 180 13 452 281 31 457 183
Profit/Loss 2 810 938 2 882 111 590 998
Total comprehensive income 6 946 591 2 995 531 (1 050 683)
Profit/Loss allocated to NCI 730 844 749 349 –
Comprehensive income attributable to NCI 1 506 131 811 592 –
Non-current assets 13 080 112 43 327 682 24 384 381
Current assets 5 973 419 12 692 677 28 107 186
Non-current liabilities 4 832 345 20 289 339 23 874 018
Current liabilities 3 631 679 25 211 493 28 091 650
Net assets 10 589 507 10 519 527 525 899
Net assets attributable to NCI 2 753 272 2 735 077 136 734
Cash flows from operating activities 6 457 879 2 036 548 (3 138 004)
Cash flows from investing activities (5 130 296) (733 100) 4 705 030
Cash flows from financing activities (1 615 732) (1 427 272) 3 267
Net increase/(decrease) in cash and cash equivalents (288 149) (123 824) 1 570 293
Dividends paid 1 121 355 113 420 –
33. NON-CONTROLLING INTEREST continued
34. INVESTMENT IN ASSOCIATE
On 1 December 2015, the Group purchased a 40% equity interest in Bergteamet Raiseboring Europe AB ("Bergteamet") for USD 5 333 165 (SEK 46 555 000). Bergteamet’s operations located within Sweden, Norway, Finland and Ireland are very similar to that of the Group and will provide the Group with a strategic footprint into the European market.
The Group does not have control of Bergteamet via the call option it has for the remainder of the shares in Bergteamet. The call option does not give rise to the substantive control of Bergteamet until such time as the Group exercises the call option which expires 31 March 2019 or the put option which expires on 31 May 2017. The put option gives the option to put the current 40% owned by the Group back to the sellers at the original purchase price thus effectively cancelling the transaction. Management considered the valuation of the call and put option. At year end the mark to market valuation did not present a material impact on the initial value of the call and put option.
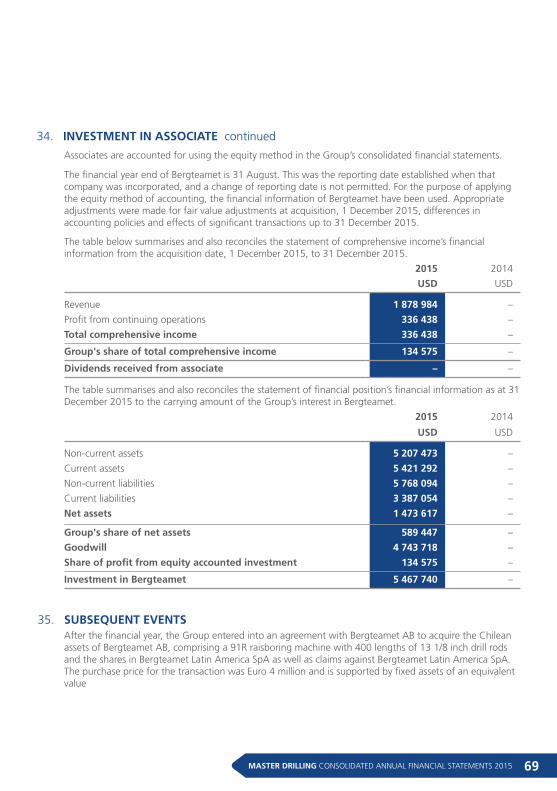
69MASTER DRILLING CONSOLIDATED ANNUAL FINANCIAL STATEMENTS 2015
34. INVESTMENT IN ASSOCIATE continued
Associates are accounted for using the equity method in the Group’s consolidated financial statements.
The financial year end of Bergteamet is 31 August. This was the reporting date established when that company was incorporated, and a change of reporting date is not permitted. For the purpose of applying the equity method of accounting, the financial information of Bergteamet have been used. Appropriate adjustments were made for fair value adjustments at acquisition, 1 December 2015, differences in accounting policies and effects of significant transactions up to 31 December 2015.
The table below summarises and also reconciles the statement of comprehensive income’s financial information from the acquisition date, 1 December 2015, to 31 December 2015.
2015 2014
USD USD
Revenue 1 878 984 –
Profit from continuing operations 336 438 –
Total comprehensive income 336 438 –
Group's share of total comprehensive income 134 575 –
Dividends received from associate – –
The table summarises and also reconciles the statement of financial position’s financial information as at 31 December 2015 to the carrying amount of the Group’s interest in Bergteamet.
2015
USD
2014
USD
Non-current assets 5 207 473 –
Current assets 5 421 292 –
Non-current liabilities 5 768 094 –
Current liabilities 3 387 054 –
Net assets 1 473 617 –
Group's share of net assets 589 447 –
Goodwill 4 743 718 –
Share of profit from equity accounted investment 134 575 –
Investment in Bergteamet 5 467 740 –
35. SUBSEQUENT EVENTS
After the financial year, the Group entered into an agreement with Bergteamet AB to acquire the Chilean assets of Bergteamet AB, comprising a 91R raisboring machine with 400 lengths of 13 1/8 inch drill rods and the shares in Bergteamet Latin America SpA as well as claims against Bergteamet Latin America SpA. The purchase price for the transaction was Euro 4 million and is supported by fixed assets of an equivalent value
35. Analysis of shareholdings
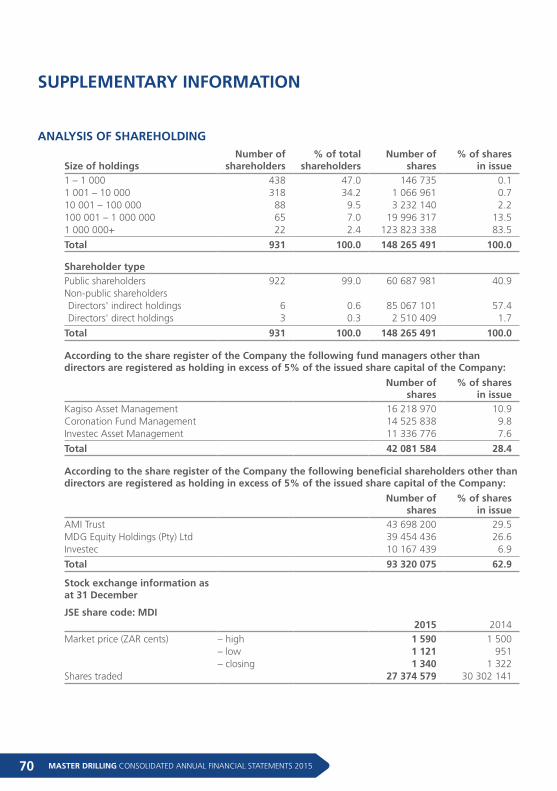
MASTER DRILLING CONSOLIDATED ANNUAL FINANCIAL STATEMENTS 201570
SUPPLEMENTARY INFORMATION
Size of holdingsNumber of
shareholders% of total
shareholdersNumber of
shares% of shares
in issue 1 – 1 000 438 47.0 146 735 0.1 1 001 – 10 000 318 34.2 1 066 961 0.7 10 001 – 100 000 88 9.5 3 232 140 2.2 100 001 – 1 000 000 65 7.0 19 996 317 13.5 1 000 000+ 22 2.4 123 823 338 83.5
Total 931 100.0 148 265 491 100.0
Shareholder type Public shareholders 922 99.0 60 687 981 40.9 Non-public shareholders Directors' indirect holdings 6 0.6 85 067 101 57.4 Directors' direct holdings 3 0.3 2 510 409 1.7
Total 931 100.0 148 265 491 100.0
According to the share register of the Company the following fund managers other than directors are registered as holding in excess of 5% of the issued share capital of the Company:
Number of
shares% of shares
in issue Kagiso Asset Management 16 218 970 10.9 Coronation Fund Management 14 525 838 9.8 Investec Asset Management 11 336 776 7.6
Total 42 081 584 28.4
According to the share register of the Company the following beneficial shareholders other than directors are registered as holding in excess of 5% of the issued share capital of the Company:
Number of
shares% of shares
in issue AMI Trust 43 698 200 29.5 MDG Equity Holdings (Pty) Ltd 39 454 436 26.6
Investec 10 167 439 6.9
Total 93 320 075 62.9
Stock exchange information as at 31 December
JSE share code: MDI
2015 2014 Market price (ZAR cents) – high 1 590 1 500 – low 1 121 951 – closing 1 340 1 322 Shares traded 27 374 579 30 302 141
ANALYSIS OF SHAREHOLDING
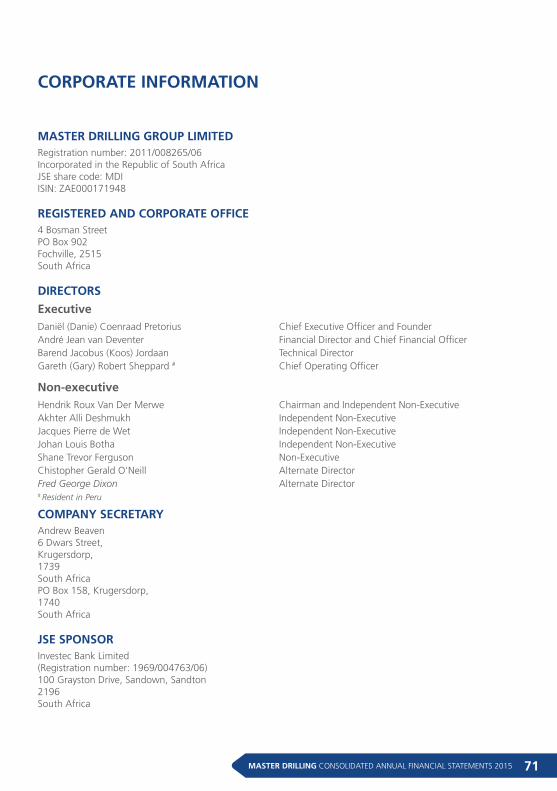
71MASTER DRILLING CONSOLIDATED ANNUAL FINANCIAL STATEMENTS 2015
CORPORATE INFORMATION
MASTER DRILLING GROUP LIMITEDRegistration number: 2011/008265/06 Incorporated in the Republic of South AfricaJSE share code: MDIISIN: ZAE000171948
REGISTERED AND CORPORATE OFFICE4 Bosman StreetPO Box 902Fochville, 2515South Africa
DIRECTORS
ExecutiveDaniël (Danie) Coenraad Pretorius Chief Executive Officer and FounderAndré Jean van Deventer Financial Director and Chief Financial OfficerBarend Jacobus (Koos) Jordaan Technical DirectorGareth (Gary) Robert Sheppard # Chief Operating Officer
Non-executiveHendrik Roux Van Der Merwe Chairman and Independent Non-ExecutiveAkhter Alli Deshmukh Independent Non-ExecutiveJacques Pierre de Wet Independent Non-ExecutiveJohan Louis Botha Independent Non-ExecutiveShane Trevor Ferguson Non-ExecutiveChistopher Gerald O'Neill Alternate DirectorFred George Dixon Alternate Director# Resident in Peru
COMPANY SECRETARYAndrew Beaven6 Dwars Street,Krugersdorp,1739South AfricaPO Box 158, Krugersdorp,1740South Africa
JSE SPONSORInvestec Bank Limited(Registration number: 1969/004763/06)100 Grayston Drive, Sandown, Sandton2196South Africa
MASTER DRILLING CONSOLIDATED ANNUAL FINANCIAL STATEMENTS 201572
INDEPENDENT AUDITORSGrant Thornton Johannesburg PartnershipSouth African member of Grant Thornton International Limited52 Corlett DriveIllovo2196South Africa
SHARE TRANSFER SECRETARIESComputershare Investor Services (Pty) Limited(Registration number: 2004/003647/07)Ground Floor, 70 Marshall StreetJohannesburg, 2001(PO Box 61051, Marshalltown, 2107South Africa
INVESTOR RELATIONS CONTACTSSu-Marie LemmerMaster Drilling Group LtdTelephone: +27 18 771 8100Mobile: +27 82 570 3451E-mail: [email protected]
GENERAL E-MAIL [email protected]
Master Drilling websitewww.masterdrilling.com
Company Secretarial [email protected]
Master Drilling posts information that is important to investors on the main page of its website at www.masterdrilling.com and under the “investors” tab on the main page. The information is updated regularly and investors should visit the website to obtain important information about Master Drilling.
CORPORATE INFORMATION (CONTINUED)

www.masterdrilling.com