Embed Size (px)
Citation preview
JANUARY 2017
Monthly Report
Bulgaria and Romania: Ten Years of EU Membership
Is there an Economic Rationale for Poland – and other EU-CEE Countries – to Join the Euro Area?
Bulgaria in the EU, 2007–2016: Expectations and Outcomes
Romania: Ten Years of EU Membership
Bulgaria and Romania – Part of the Central European Manufacturing Core?
The Vienna Institute for International Economic Studies Wiener Institut für Internationale Wirtschaftsvergleiche

Is there an Economic Rationale for Poland – and other EU-CEE Countries – to Join the Euro Area?
Bulgaria in the EU, 2007–2016: Expectations and Outcomes
Romania: Ten Years of EU Membership
Bulgaria and Romania – Part of the Central European Manufacturing Core?
RUMEN DOBRINSKY DORIS HANZL-WEISS GÁBOR HUNYA LEON PODKAMINER

CONTENTS
Graph of the month: Monthly minimum gross wage in selected countries, in EUR, mid-year 2016 ................................................................................................................................................................ 1
Opinion Corner: Is there an economic rationale for Poland – and other EU-CEE countries – to join the euro area? ...................................................................................................... 2
Bulgaria in the EU, 2007–2016: expectations and outcomes ................................................................. 4
Romania: ten years of EU membership ........................................................................................................... 9
Bulgaria and Romania – part of the Central European manufacturing core? ............................. 14
The editors recommend for further reading ............................................................................................... 21
Monthly and quarterly statistics for Central, East and Southeast Europe .................................... 22
Index of subjects – January 2016 to January 2017 ..................................................................................... 45

GRAPH OF THE MONTH
1 Monthly Report 2017/01
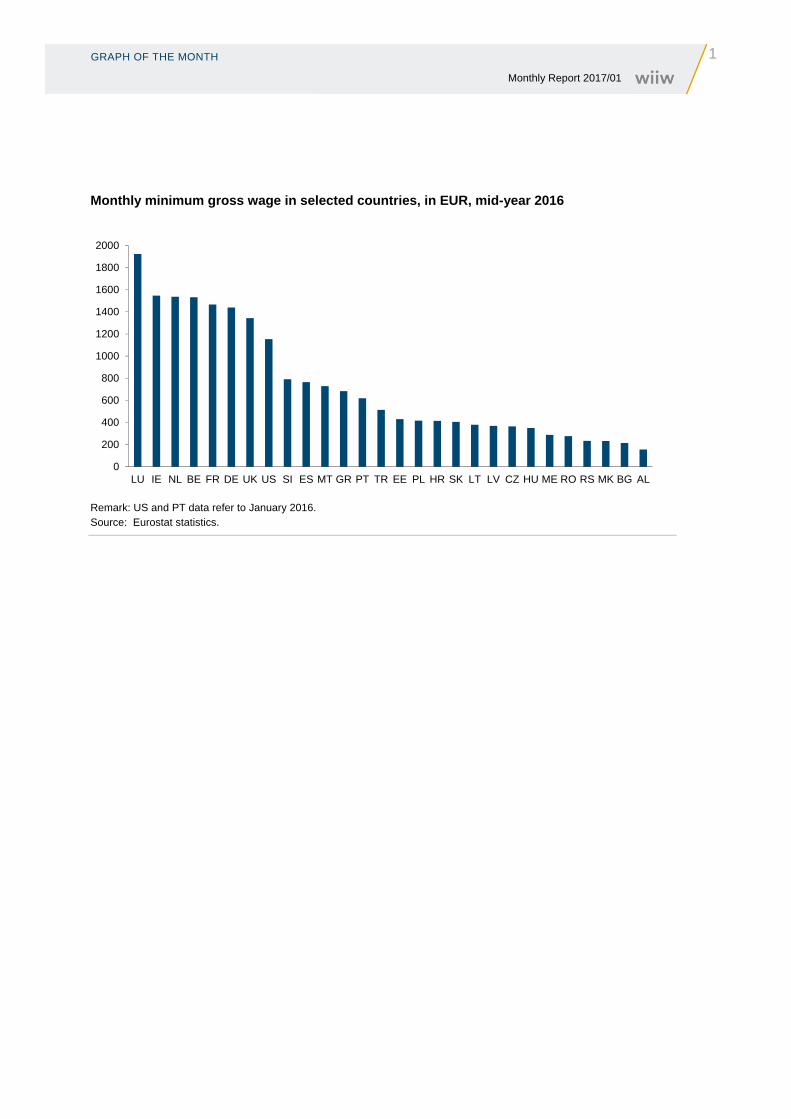
Monthly minimum gross wage in selected countries, in EUR, mid-year 2016
Remark: US and PT data refer to January 2016. Source: Eurostat statistics.
0
200
400
600
800
1000
1200
1400
1600
1800
2000
LU IE NL BE FR DE UK US SI ES MT GR PT TR EE PL HR SK LT LV CZ HU ME RO RS MK BG AL
2 OPINION CORNER Monthly Report 2017/01
Opinion Corner: Is there an economic rationale for Poland – and other EU-CEE countries – to join the euro area?
ANSWERED BY LEON PODKAMINER
Professor Grzegorz W. Kołodko, twice Poland’s Deputy Prime Minister and Finance Minister
(1994-1997 and 2002–2003), has recently published a pamphlet appealing for Poland’s speedy
adoption of the euro. The pamphlet titled ‘Will Poland Save Europe?’ appeared in the influential Polish
daily Rzeczpospolita on 3 January 2017. It rightly stressed the importance – for Poland – of stopping the
creeping disintegration of the European Union and expressed the opinion that Poland’s accession to the
euro area would somehow reinvigorate the forces keeping the euro area (and thus Europe) united. Apart
from serving Poland’s vital long-term geopolitical interest (preservation of a strong, cohesive EU), the
switchover would – so Kołodko – bring the country numerous economic benefits, both in the short- and
long-term perspectives.
On 5 January 2017, Rzeczpospolita published a polemic with Kołodko’s theses, authored by Leon
Podkaminer (wiiw).
The polemic, titled ‘Who Will Save Europe?’, first disputes the economic advantages Poland was
supposed to enjoy on adopting the euro, as claimed by Kołodko. The most essential of these
advantages would follow the elimination of transaction costs necessitated by the exchanges of euros
into Polish zlotys (and vice versa) on foreign trade transactions. Kołodko believes these costs total
‘dozen or so billion zlotys’ (equivalent to some EUR 4–5 billion) per year. In my opinion this estimate is
grossly exaggerated. The whole Polish banking sector makes profits totalling about a dozen or so billion
zlotys.
The elimination of the exchange rate risk was to bring another benefit: faster growth of capital formation
which – according to Kołodko – has been depressed on account of uncertain profitability of production
dependent on foreign trade. However, facts do not seem to support that argumentation. Investment
dynamics (and levels) do not have any obvious links to the possession (or not) of an own currency.
Gross fixed capital formation accounts for over 25% of GDP in Romania and the Czech Republic – two
countries that have retained their own currencies. For Lithuania and Slovenia (both euro area members)
the shares of investment in GDP are relatively low, about 20% (as in Poland). Moreover, the GDP
investment shares in countries that have switched to the euro have fallen perceptibly: in Slovenia from
over 28% in 2005 to 20% in 2015; in Slovakia from 29.7% to 23.2% respectively; in Lithuania from
23.4% to 19.3%; in Latvia from 31.3% to 22.6%; and in Estonia from 32.9% to 23.7%. In Poland,
investments were seen to both rise at double-digit rates (as in 2014) or decline (as in 2013) – with
unchanged national currency. Similarly, investment volatility is observed in the euro area. For instance,
in Slovenia investment fell 13% in 2010. According to provisional estimates, in 2016 investment fell by
10% also in Latvia.
OPINION CORNER
3 Monthly Report 2017/01
The supposition that euro adoption would accelerate Poland’s GDP growth by ‘approximately 0.5%
yearly’ is wishful thinking not supported by any solid calculation. (Ironically, in the Czech Republic one
hears the opinion that euro adoption is likely to slow down growth by 0.5%.)
The last more important argument for an adoption of the euro would consist of lowered (‘by about 2% of
GDP’) burden of servicing Poland’s foreign (public) debt. However, right now the servicing of Poland’s
whole (domestic plus foreign) public debt costs the country 1.7% of GDP. This is much less than is the
case for Slovenia (2.8%), not to mention Portugal (4.3%). Moreover, one has to bear in mind that the
countries overburdened by the costs of servicing their public debts (Slovenia, Portugal, Greece etc.)
have found themselves in their pitiable situation just because of their accession to the euro area. In 2000
the Slovenian public debt stood at 26% of GDP, Portugal’s at 50% and Greece’s at 105%. By 2016
these ratios had risen to over 80%, 130% and 180% respectively.
That much on the benefits which Poland and other countries of the EU-CEE region could gain: Romania,
Hungary and the Czech Republic could gain from giving up their own currencies. (Interestingly, the
Czech National Bank and Finance Ministry have recently found it fit to issue a joint statement on not
setting a target date for initiating euro accession negotiations.)
Two other questions remain: on the costs of countries’ giving up their own money, and on whether their
giving up their own money would ‘strengthen Europe’.
In my opinion the switchover to the euro carries a risk – bordering on certainty – of secular (or even
irreversible) stagnation which is right now experienced by the South European euro area member states
(as well as Slovenia). It is hard to imagine that the euro area would strengthen economically (and also
politically) by having been joined by another lame national economy – another Portugal (or, in a
perspective, another Greece).
There is one point on which I fully agree with Professor Kołodko: In economic terms the European Union
drifts towards disintegration. For Poland the EU’s disintegration would have fatal economic and political
consequences. But right now Poland has no real bearing on what is happening to the EU. Poland could
have influenced – rather marginally – the events during Donald Tusk’s premiership, especially during
Poland’s EU Presidency (Poland’s international standing was quite high then, unlike at present). But the
possibility of influencing the course of economic policy in the EU remained unutilised. Poland has not
saved Europe – and is not going to save it in the future, either.
Europe can be saved only and exclusively via a radical change of Germany’s economic policy. German
economic policy is a direct cause of the fatal tendencies observed in the euro area – and thus in the EU
at large. First, the Maastricht Treaty ordering the fiscal and monetary policies in the euro area countries
is an embodiment of German economic phobias and superstitions. Second, Germany’s internal policy
boils down to running aggressive mercantilism. Germany runs gigantic trade surpluses which directly or
indirectly destabilise the economies of its West European partners. Moreover, these surpluses drive
Germany’s partners into rising debts vs. German banks. The policy has to be called aggressive because
the trade surpluses are achieved at a cost of repressed German domestic wages, consumption and
investment. Success on the ‘export front’ is the prevailing objective of that policy.
4 BULGARIA IN THE EU, 2007–2016: EXPECTATIONS AND OUTCOMES Monthly Report 2017/01
Bulgaria in the EU, 2007–2016: expectations and outcomes
BY RUMEN DOBRINSKY
Bulgaria and Romania, two poor countries in the European periphery, managed to catch one of the last
trains of the big EU Eastern Enlargement at a time which still was dominated by post-communist
euphoria and a somewhat idyllic vision of a united Europe. Also, the 1990s and the first half of the 2000s
were a period of growing prosperity in Europe as well as in most parts of the world. In such an
environment it was not uncommon for the incumbent EU members to assign higher priority in
enlargement decisions to benign political arguments over conservative economic logic and dry economic
facts.
For Bulgaria, which experienced a grave transition crisis in the 1990s, the decade leading to EU
accession was both a period of difficult economic transformation but also a time of great expectations of
a new era of prosperity that was about to materialise with EU membership. The realistic prospect of EU
membership was for Bulgaria – as for the other Central and East Europe countries – the single most
important driver and catalyst of reforms, providing a powerful impetus to the economic and political
transformation of these countries.
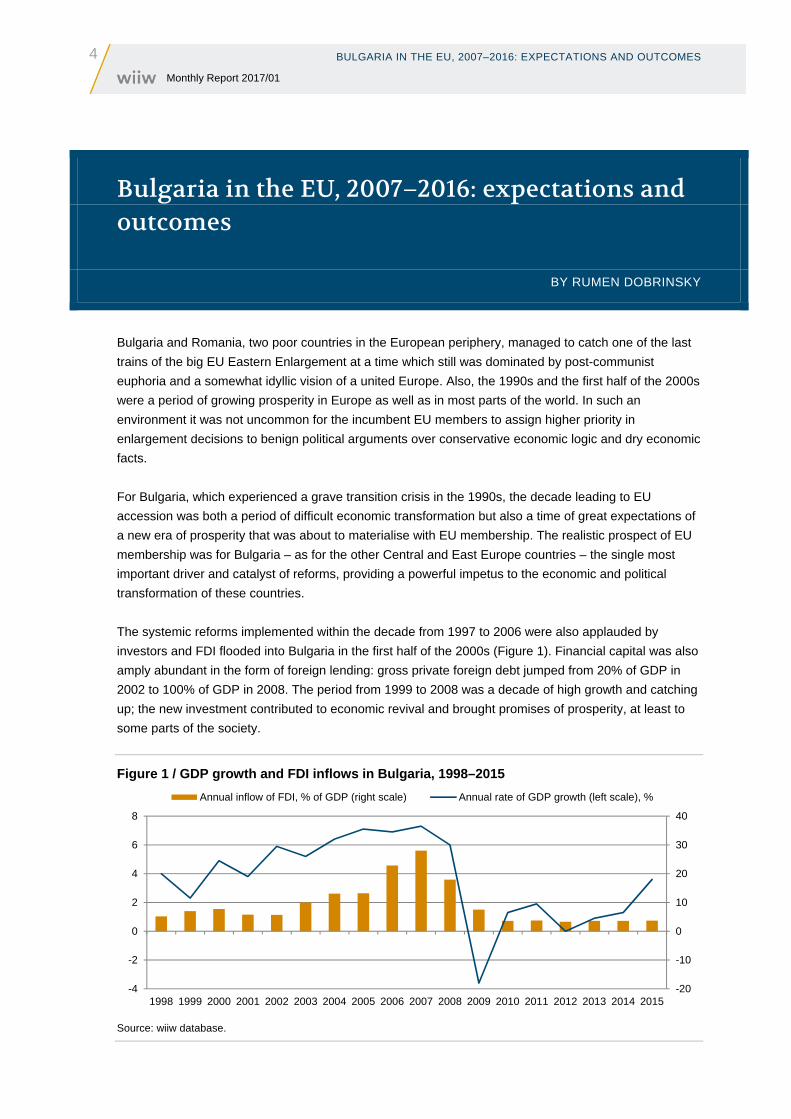
The systemic reforms implemented within the decade from 1997 to 2006 were also applauded by
investors and FDI flooded into Bulgaria in the first half of the 2000s (Figure 1). Financial capital was also
amply abundant in the form of foreign lending: gross private foreign debt jumped from 20% of GDP in
2002 to 100% of GDP in 2008. The period from 1999 to 2008 was a decade of high growth and catching
up; the new investment contributed to economic revival and brought promises of prosperity, at least to
some parts of the society.
Figure 1 / GDP growth and FDI inflows in Bulgaria, 1998–2015
Source: wiiw database.
-20
-10
0
10
20
30
40
-4
-2
0
2
4
6
8
1998 1999 2000 2001 2002 2003 2004 2005 2006 2007 2008 2009 2010 2011 2012 2013 2014 2015
Annual inflow of FDI, % of GDP (right scale) Annual rate of GDP growth (left scale), %

BULGARIA IN THE EU, 2007–2016: EXPECTATIONS AND OUTCOMES
5 Monthly Report 2017/01
FDI has been a key driver of economic restructuring and the modernisation of the Bulgarian economy
ever since. While Bulgaria lost most of its inherited Soviet-type industry that did not manage to adjust to
the new market environment, a process of gradual re-industrialisation and integration into EU and global
value chains has been under way, driven by FDI. The ICT industry also saw a revival and the country
became an attractive destination for the outsourcing of such services.
However, Bulgaria’s first steps in the EU coincided with the global economic and financial crisis of
2008-2009 and the prolonged stagnation in many parts of the world that followed. Being small and
open, Bulgaria’s economy was highly susceptible to external shocks such as the sudden drop in external
demand. But probably the most severe external shock was the drying up of capital inflows and their
reversal after 2009: the annual FDI inflows in the period 2009–2015 averaged 4.1% of GDP, down from
an average of 17.5% of GDP in the period 2003–2008 (Figure 1); gross private foreign debt dropped to
62% of GDP at the end of 2015, reflecting the process of deleveraging by the private sector which was
triggered by the crisis.
In terms of macroeconomic stability, Bulgaria weathered the global crisis relatively successfully and with
damage contained. One of the main factors for this was the prudent fiscal policy stance over a prolonged
period after the establishment of a currency board in 1997. A second key factor was the relative flexibility
of the labour market which helped to preserve competitiveness under the conditions of a currency board
during and after the crisis.
However, the currency board has been both a blessing and a curse for the Bulgarian economy due the
limited degree of policy freedom associated with it: under this arrangement monetary policy is absent
altogether whereas the conduct of fiscal policy is severely restrained by sustainability considerations.
Under these conditions, the economy becomes a hostage of the tidal movements of capital flows:
periods of continuous inflows are generally benign for the economy, mobilising additional resources for
domestic use; however, when capital inflows stop or change direction, policy-makers have virtually no
instruments to offset the damaging effects caused by sudden reversals. The graphs in Figure 1 provide
an illustration of the close statistical association between economic growth and capital (in this case FDI)
flows in Bulgaria during the past two decades.
The irony in the case of Bulgaria is in the pure coincidence of the timing of the capital reversal with the
country’s accession to the EU. In consequence, the first years of Bulgaria’s EU membership turned out
to be a period of recession or near-stagnation and lack of visible catching up. The successful enclaves
of the economy (the new manufacturing sectors and the ICT industry) were not sufficient to offset the
overall economic sluggishness. Thus during the first decade as part of the EU, the Bulgarian economy
was not delivering, or not delivering sufficiently, on one of the main expectations of the population
associated with EU membership, that of increasing prosperity.
Bulgaria’s cohabitation in the club with some of the old EU members has been somewhat awkward and
uneasy. Some of the old members preserved – and still preserve – the reservations they had had
towards Bulgaria’s accession to the Union as there was no unanimous EU view at the time whether the
country had met all provision of the acquis communautaire, in particular, in the areas of judicial reform
as well as the fight against corruption and organised crime. The most conspicuous sign of these
reservations is the regular monitoring mechanism which is still being applied to Bulgaria and Romania to
assess progress under the Cooperation and Verification Mechanism in the above areas. Another sign of
6 BULGARIA IN THE EU, 2007–2016: EXPECTATIONS AND OUTCOMES Monthly Report 2017/01
persistent scepticism is the stubborn reluctance by some members of the Schengen Area to admit
Bulgaria and Romania into the Area although, even according to the EC’s rigorous assessment, the two
countries have already met the technical criteria for membership.
However, the lingering hesitancy towards Bulgaria has been partly substantiated by the lack of visible
progress in some key reform areas which had been part of the country’s EU accession deal. In the first
place this concerns the judiciary system, which remains highly inefficient and is perceived as corrupt.
Once Bulgaria’s accession to the EU was a fact, the reform zeal of Bulgarian politicians of all colour
evaporated instantaneously and further progress has been next to nil. On the other hand, the EU’s
Cooperation and Verification Mechanism applied in the monitoring process has proved to be inefficient
as an external anchor in that its critical conclusions have not been sufficient to instigate relevant
response actions on the ground.
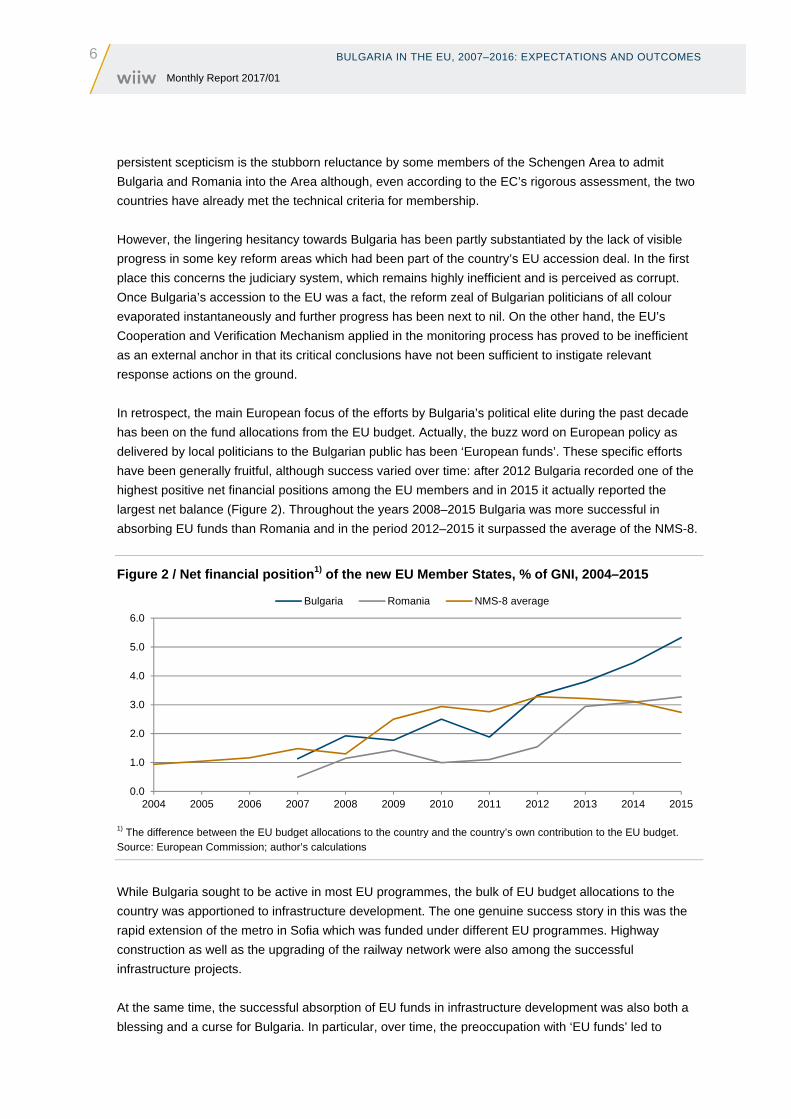
In retrospect, the main European focus of the efforts by Bulgaria’s political elite during the past decade
has been on the fund allocations from the EU budget. Actually, the buzz word on European policy as
delivered by local politicians to the Bulgarian public has been ‘European funds’. These specific efforts
have been generally fruitful, although success varied over time: after 2012 Bulgaria recorded one of the
highest positive net financial positions among the EU members and in 2015 it actually reported the
largest net balance (Figure 2). Throughout the years 2008–2015 Bulgaria was more successful in
absorbing EU funds than Romania and in the period 2012–2015 it surpassed the average of the NMS-8.
Figure 2 / Net financial position1) of the new EU Member States, % of GNI, 2004–2015
1) The difference between the EU budget allocations to the country and the country’s own contribution to the EU budget. Source: European Commission; author’s calculations
While Bulgaria sought to be active in most EU programmes, the bulk of EU budget allocations to the
country was apportioned to infrastructure development. The one genuine success story in this was the
rapid extension of the metro in Sofia which was funded under different EU programmes. Highway
construction as well as the upgrading of the railway network were also among the successful
infrastructure projects.
At the same time, the successful absorption of EU funds in infrastructure development was also both a
blessing and a curse for Bulgaria. In particular, over time, the preoccupation with ‘EU funds’ led to
0.0
1.0
2.0
3.0
4.0
5.0
6.0
2004 2005 2006 2007 2008 2009 2010 2011 2012 2013 2014 2015
Bulgaria Romania NMS-8 average
BULGARIA IN THE EU, 2007–2016: EXPECTATIONS AND OUTCOMES
7 Monthly Report 2017/01
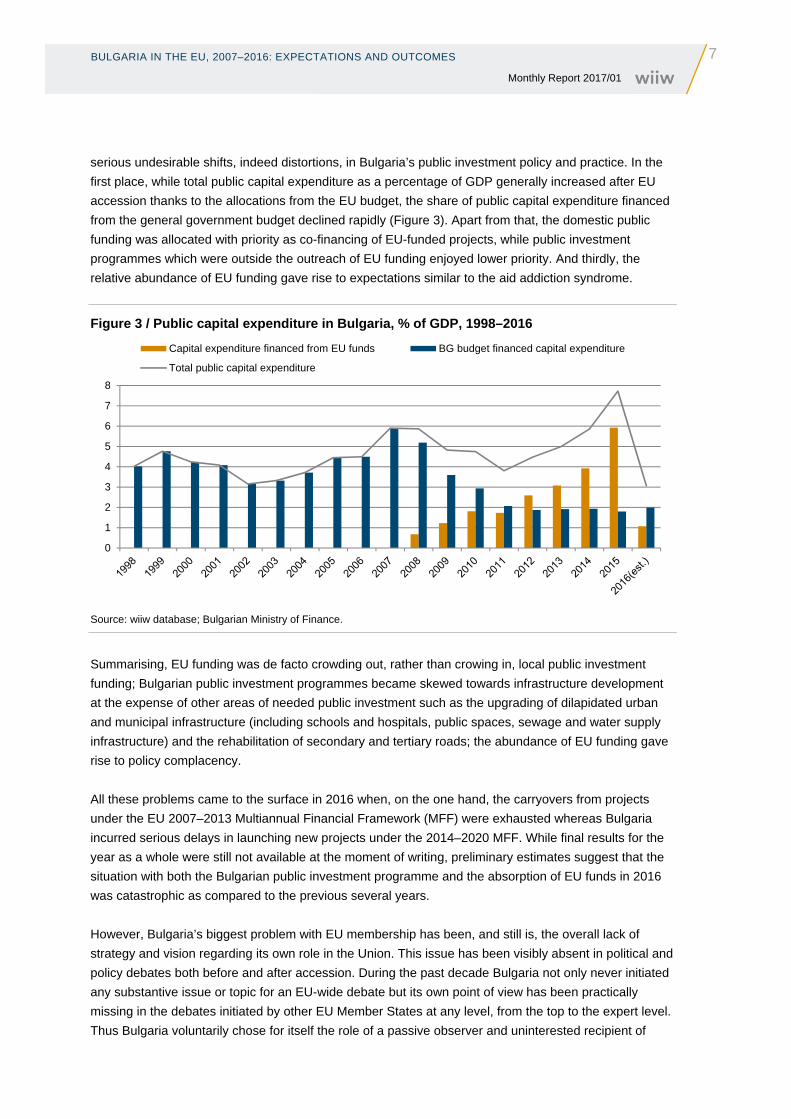
serious undesirable shifts, indeed distortions, in Bulgaria’s public investment policy and practice. In the
first place, while total public capital expenditure as a percentage of GDP generally increased after EU
accession thanks to the allocations from the EU budget, the share of public capital expenditure financed
from the general government budget declined rapidly (Figure 3). Apart from that, the domestic public
funding was allocated with priority as co-financing of EU-funded projects, while public investment
programmes which were outside the outreach of EU funding enjoyed lower priority. And thirdly, the
relative abundance of EU funding gave rise to expectations similar to the aid addiction syndrome.
Figure 3 / Public capital expenditure in Bulgaria, % of GDP, 1998–2016
Source: wiiw database; Bulgarian Ministry of Finance.
Summarising, EU funding was de facto crowding out, rather than crowing in, local public investment
funding; Bulgarian public investment programmes became skewed towards infrastructure development
at the expense of other areas of needed public investment such as the upgrading of dilapidated urban
and municipal infrastructure (including schools and hospitals, public spaces, sewage and water supply
infrastructure) and the rehabilitation of secondary and tertiary roads; the abundance of EU funding gave
rise to policy complacency.
All these problems came to the surface in 2016 when, on the one hand, the carryovers from projects
under the EU 2007–2013 Multiannual Financial Framework (MFF) were exhausted whereas Bulgaria
incurred serious delays in launching new projects under the 2014–2020 MFF. While final results for the
year as a whole were still not available at the moment of writing, preliminary estimates suggest that the
situation with both the Bulgarian public investment programme and the absorption of EU funds in 2016
was catastrophic as compared to the previous several years.
However, Bulgaria’s biggest problem with EU membership has been, and still is, the overall lack of
strategy and vision regarding its own role in the Union. This issue has been visibly absent in political and
policy debates both before and after accession. During the past decade Bulgaria not only never initiated
any substantive issue or topic for an EU-wide debate but its own point of view has been practically
missing in the debates initiated by other EU Member States at any level, from the top to the expert level.
Thus Bulgaria voluntarily chose for itself the role of a passive observer and uninterested recipient of
0
1
2
3
4
5
6
7
8
Capital expenditure financed from EU funds BG budget financed capital expenditure
Total public capital expenditure
8 BULGARIA IN THE EU, 2007–2016: EXPECTATIONS AND OUTCOMES Monthly Report 2017/01
important decisions with an EU-wide outreach that do affect the country, its economy and society. More
fundamentally, Bulgaria’s facelessness in the international arena reflects a general absence of vision
and strategy both in the domestic policy and political debates in recent years and in the agendas of the
main actors on the Bulgarian political scene.
Summing up, Bulgaria’s decade as part of the EU has been one of mixed outcomes. On the one hand, in
terms of macroeconomic stability, the economy proved to be resilient to turbulence and withstood
successfully the shocks of the global financial crisis. On the other hand, economic performance during
the past ten years was generally mediocre and the expected fast catching up with the more advanced
EU economies did not materialise. One can clearly observe the dynamic sprouts of a modern new
economy, closely integrated with global value chains and competitive in the international markets. But
these are still not sufficient to shape the face of the economy in general and act as its genuine engines.
Bulgaria managed to join successfully many EU programmes and benefited from considerable funding
from the EU budget. However, the strategy targeting the mobilisation of large allocations from the EU
budget did not always result in overall efficiency of public investment in the country.
Overall, if it is to become a full-fledged, reliable and self-confident EU member contributing
constructively and comprehensively to common EU objectives as part of its own strategic goals, Bulgaria
still faces a challenging learning process.
ROMANIA: TEN YEARS OF EU MEMBERSHIP
9 Monthly Report 2017/01
Romania: ten years of EU membership
BY GÁBOR HUNYA
A STORY OF MIXED SUCCESS
Ten years after its accession to the EU, Romanians keep showing a high rate of confidence in the
European Union (68% tend to trust1). They see the benefits of EU membership primarily in the freedom
to travel and work abroad. ‘Enthusiasm’ was especially upbeat in the first two years of membership
when more than 600,000 people left the country; another almost 300,000 emigrated in the following
seven years (net migration balance, Eurostat). The number of those working or studying abroad
temporarily is estimated at an additional 2.5 million.
Despite large emigration, Romania’s economic growth has been remarkable: the volume of GDP grew
by 30% between 2005 and 2015, which is the third highest rate among the EU-CEE countries after
Poland and Slovakia.2 Reflecting the effects of migration and economic growth, per capita GDP at PPP
rose from 34% to 57% of the EU average in the same period. This is an important catch-up especially
compared with the previous ten years (from 32% in 1995 to not more than 34% in 2005). But closing the
development gap to the EU cannot take place overnight, not even in a decade or two. In the EU-wide
ranking, Romania has overtaken only Bulgaria, making it the second least developed Member State.
Although we lack a precise calculation of the contribution of EU membership to the improved
macroeconomic performance, it is most likely that improved legal stability, FDI inflow and financial
transfers from Brussels have decisively contributed to Romania’s economic growth. When going into
detail, however, one discovers several shortcomings in economic policy, doing business conditions and
the rule of law. Many of these have to do with the pre-mature EU accession and the slowdown of the
pace of reforms thereafter. Romania’s institutions and administration are still not functioning well enough
for the country to benefit in full from EU membership.
PRE-MATURE EU ACCESSION
The negotiations between 2000 and 2004 were spent with the implantation of the community rules and
standards into the Romanian legal system and there was neither time nor capacity for their proper
implementation. In the 2006 monitoring report3, the European Commission (EC) stated that ‘the country
made sufficient progress and would not put at risk the EU's core policies and its regulatory framework’.
This reflected the interest of the EC being in an enlargement-friendly mood similar to the EU Member
States ratifying Romania’s accession treaty. When the European Court of Auditors (ECA) opposed the
1 Standard Eurobarometer 83, Spring 2015. 2 We do not stick to the 2007-2016 period in this analysis as most of the processes related to EU accession started earlier
when the decision about membership was made, and also because no final data for 2016 are available at the time of writing.
3 Communication from the Commission – Monitoring report on the state of preparedness for EU membership of Bulgaria and Romania, Brussels, 26.9.2006, COM(2006) 549 final.
10 ROMANIA: TEN YEARS OF EU MEMBERSHIP Monthly Report 2017/01
accession of Romania and Bulgaria on the grounds that EU money would not be spent efficiently, it was
seen inopportune to change the process.4
The concern that Romania needed more time to prepare for accession, so that EU transfers could be
absorbed in a more efficient way, has proved right. Lack of institutional capacity and wide-spread
corruption has hindered the country to fully benefit from the EU funds. Of the EUR 15.5 billion allocated
to Romania under the EU cohesion policy in 2007–2013 (to be supplemented by EUR 3.4 billion national
co-funding), only 75% could be spent as of April 2016.5 The total sum amounted to 1.5% of the
cumulative GDP, one of the lowest shares among EU members. There have been some remarkable
results nevertheless, including the expansion of water and sewage infrastructure and the modernisation
of public heating systems, while the huge funds spent on motorway construction resulted only in a
fragmented network.
BOOM AND BUST ECONOMIC CYCLE OVERSHADOWS THE BENEFITS OF EU MEMBERSHIP
An overarching account of Romania’s economic development since 2007 is primarily the story of
managing the impact of the global financial crisis amid recurring political crises and only to a lesser
extent an impact assessment of EU membership itself. The Romanian economy underwent a full-fledged
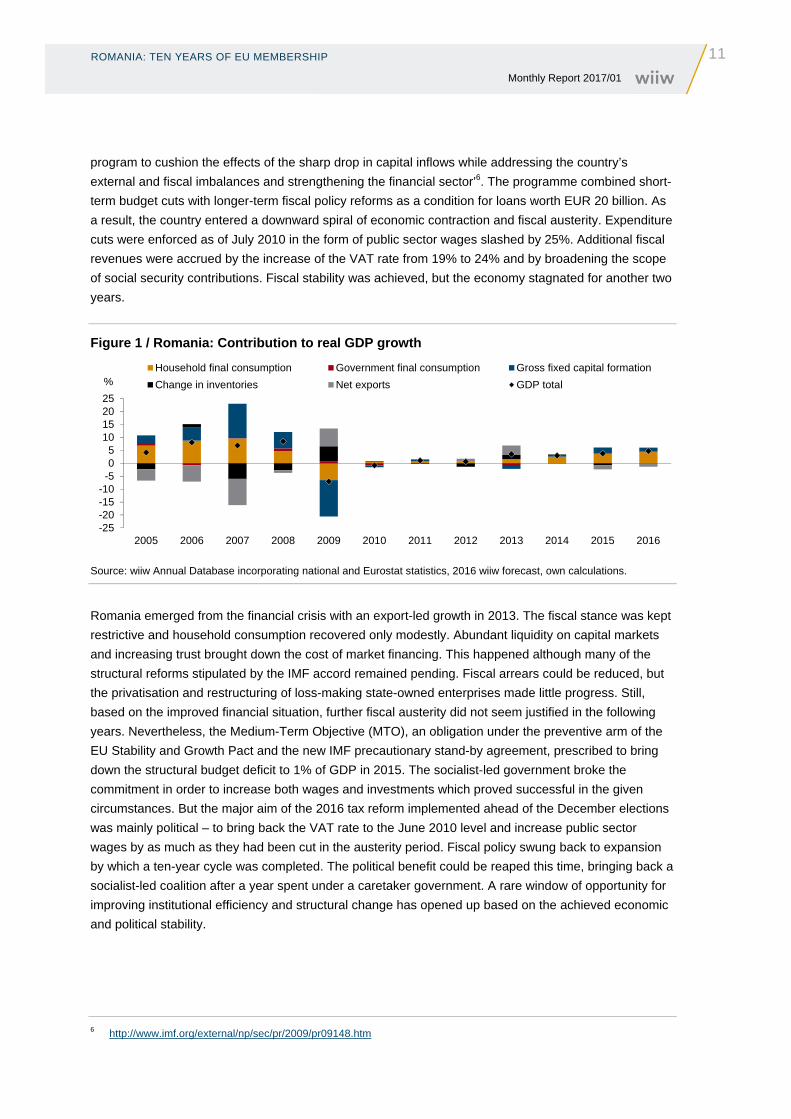
boom-bust-boom cycle in the past ten years (Figure 1). Rapid capital inflows and pro-cyclical fiscal
spending resulted in consumption booms both in 2006–2008 and in 2015–2016. Increasing instability in
the first boom period triggered high inflation and currency devaluation, making the country highly
vulnerable to the global financial crisis. That growth trajectory proved unsustainable thus GDP
contracted in 2009 and 2010, then stagnated in 2011 and 2012. The modest but balanced post-crisis
recovery of 2013–2014 was followed by an expansionary fiscal policy in 2015 leading to rapid growth
especially in 2016. The difference between the two boom periods is that this time inflation is negative on
account of VAT cuts and low international commodity prices and the external balance is in much better
shape than in the earlier period. In other words, capital inflows have become more cautious and do not
finance excessive current account deficits. As a result, the rate of economic growth in 2015–2016 has
been only about half of what it used to be in 2006–2008.
A more detailed account reveals that economic policy aggravated the impact of the global financial
crisis. In 2008 Romania was heading towards unsustainable current account deficits – already before
the financial crisis. Also fiscal deficits were on the increase on account of high public sector wage
increases that the national liberal government handed out to win the 2008 elections. It failed to win
despite a rise of fiscal expenditures on wages by 87% in nominal terms over two years. In 2009, fiscal
deficits expanded to 7.5% of GDP, also on account of recession. The government had no credible
economic policy of its own; none of the three governments in office during 2009–2010 had been able to
come up with a fiscal programme that could be trusted and implemented. The authorities shifted the bulk
of the uneasy task of economic policy-making to the IMF. In order to forestall a further deterioration of
the situation, the government called the EC-IMF-WB troika for help. On 4 May 2009, the Executive
Board of the IMF approved a ‘24-month Stand-By Arrangement for Romania to support an economic
4 http://www.euractiv.com/section/enlargement/news/auditors-romania-and-bulgaria-were-not-ready-for-accession/ 5 Applica, Ismeri Europa and Cambridge Economic Associates, ‘Country report Romania – Work Package 1 Ex post
evaluation of Cohesion Policy programmes 2007–2013, focusing on the European Regional Development Fund (ERDF) and the Cohesion Fund (CF)’, September 2016.
ROMANIA: TEN YEARS OF EU MEMBERSHIP
11 Monthly Report 2017/01
program to cushion the effects of the sharp drop in capital inflows while addressing the country’s
external and fiscal imbalances and strengthening the financial sector’6. The programme combined short-
term budget cuts with longer-term fiscal policy reforms as a condition for loans worth EUR 20 billion. As
a result, the country entered a downward spiral of economic contraction and fiscal austerity. Expenditure
cuts were enforced as of July 2010 in the form of public sector wages slashed by 25%. Additional fiscal
revenues were accrued by the increase of the VAT rate from 19% to 24% and by broadening the scope
of social security contributions. Fiscal stability was achieved, but the economy stagnated for another two
years.
Figure 1 / Romania: Contribution to real GDP growth
Source: wiiw Annual Database incorporating national and Eurostat statistics, 2016 wiiw forecast, own calculations.
Romania emerged from the financial crisis with an export-led growth in 2013. The fiscal stance was kept
restrictive and household consumption recovered only modestly. Abundant liquidity on capital markets
and increasing trust brought down the cost of market financing. This happened although many of the
structural reforms stipulated by the IMF accord remained pending. Fiscal arrears could be reduced, but
the privatisation and restructuring of loss-making state-owned enterprises made little progress. Still,
based on the improved financial situation, further fiscal austerity did not seem justified in the following
years. Nevertheless, the Medium-Term Objective (MTO), an obligation under the preventive arm of the
EU Stability and Growth Pact and the new IMF precautionary stand-by agreement, prescribed to bring
down the structural budget deficit to 1% of GDP in 2015. The socialist-led government broke the
commitment in order to increase both wages and investments which proved successful in the given
circumstances. But the major aim of the 2016 tax reform implemented ahead of the December elections
was mainly political – to bring back the VAT rate to the June 2010 level and increase public sector
wages by as much as they had been cut in the austerity period. Fiscal policy swung back to expansion
by which a ten-year cycle was completed. The political benefit could be reaped this time, bringing back a
socialist-led coalition after a year spent under a caretaker government. A rare window of opportunity for
improving institutional efficiency and structural change has opened up based on the achieved economic
and political stability.
6 http://www.imf.org/external/np/sec/pr/2009/pr09148.htm
-25-20-15-10
-505
10152025
2005 2006 2007 2008 2009 2010 2011 2012 2013 2014 2015 2016
%Household final consumption Government final consumption Gross fixed capital formation
Change in inventories Net exports GDP total
12 ROMANIA: TEN YEARS OF EU MEMBERSHIP Monthly Report 2017/01
STRUCTURAL CHANGE GENERATED BY FDI
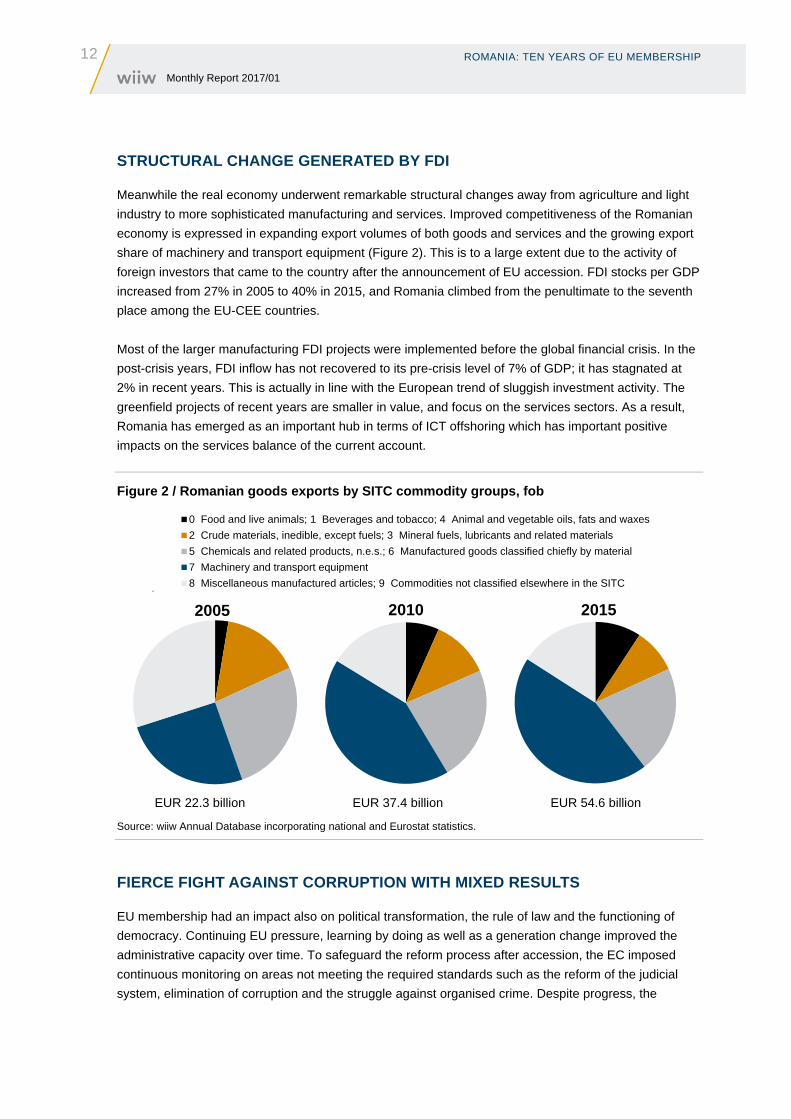
Meanwhile the real economy underwent remarkable structural changes away from agriculture and light
industry to more sophisticated manufacturing and services. Improved competitiveness of the Romanian
economy is expressed in expanding export volumes of both goods and services and the growing export
share of machinery and transport equipment (Figure 2). This is to a large extent due to the activity of
foreign investors that came to the country after the announcement of EU accession. FDI stocks per GDP
increased from 27% in 2005 to 40% in 2015, and Romania climbed from the penultimate to the seventh
place among the EU-CEE countries.
Most of the larger manufacturing FDI projects were implemented before the global financial crisis. In the
post-crisis years, FDI inflow has not recovered to its pre-crisis level of 7% of GDP; it has stagnated at
2% in recent years. This is actually in line with the European trend of sluggish investment activity. The
greenfield projects of recent years are smaller in value, and focus on the services sectors. As a result,
Romania has emerged as an important hub in terms of ICT offshoring which has important positive
impacts on the services balance of the current account.
Figure 2 / Romanian goods exports by SITC commodity groups, fob
EUR 22.3 billion EUR 37.4 billion EUR 54.6 billion
Source: wiiw Annual Database incorporating national and Eurostat statistics.
FIERCE FIGHT AGAINST CORRUPTION WITH MIXED RESULTS
EU membership had an impact also on political transformation, the rule of law and the functioning of
democracy. Continuing EU pressure, learning by doing as well as a generation change improved the
administrative capacity over time. To safeguard the reform process after accession, the EC imposed
continuous monitoring on areas not meeting the required standards such as the reform of the judicial
system, elimination of corruption and the struggle against organised crime. Despite progress, the
0 Food and live animals; 1 Beverages and tobacco; 4 Animal and vegetable oils, fats and waxes
2 Crude materials, inedible, except fuels; 3 Mineral fuels, lubricants and related materials
5 Chemicals and related products, n.e.s.; 6 Manufactured goods classified chiefly by material
7 Machinery and transport equipment
8 Miscellaneous manufactured articles; 9 Commodities not classified elsewhere in the SITC
2005 2010 2015
ROMANIA: TEN YEARS OF EU MEMBERSHIP
13 Monthly Report 2017/01
Cooperation and Verification Mechanism (CVM) is still in place. Its recent report7 finds several issues
pending including transparency and professionality of public institutions.
The fight against corruption received much lip-service in the country also on account of the CVM reports,
but policies and attitudes hardly changed for years. The turning point was marked when Adrian Nastase,
Romania’s prime minister between 2000 and 2004, was sentenced to prison for corruption in 2012. The
decisive step was that the activity of the National Anticorruption Directorate (DNA), founded in 2003, was
upgraded in 2013. Since then, this institution has been very actively investigating and prosecuting
corruption-related offences such as bribery, graft, patronage and embezzlement. In 2015 the DNA
finalised investigations concerning over 1,250 private and legal persons, including five ministers,
16 members of the chamber of deputies and five senators.8 In addition, Prime Minister Victor Ponta was
indicted on charges of forgery and money-laundering which indirectly led to his abdication in November
2015.9 In 2016 the DNA’s activity took on a more nation-wide character, expanding to the regional
administration. Still it remains intransparent how the target persons of investigations are selected10 and
how far the whole process will extend11. The anti-corruption fight remains one-sided as long as
transparency and coordination of legislation and jurisdiction is not provided. Under the current fuzzy
system it is hardly possible for decision-makers to act in full accordance with the law and public interest
which has a paralysing effect. In practice these problems can be fixed by coordinated efforts with the
support of the CVM. Attention is all the more necessary as the new government does not have the fight
against corruption on its agenda and the political attack of Socialist politicians (many of whom have been
put under investigation) against the DNA has intensified.
ROMANIA SHOULD BE MORE ACTIVE IN SUPPORTING EU INTEGRATION
Finally, Romania may need a mobilising strategy and policy beyond the direct benefits provided by the
EU, one that also contributes to the success of the European integration. Going beyond the position of a
policy-taker is especially necessary under the current lack of orientation in the EU as a whole.
Romania’s role has not been destructive; the country has denied policy coordination with the Visegrad
countries and does not support the nationalist line of Hungary and Poland. But even if not outspokenly,
Romania’s policy has never gone beyond nationalist self-interest. It would be in the interest of a less
developed EU member to become active in shaping the European agenda if it wants to enjoy the
benefits of the cohesion policy beyond 2020. Despite all the shortcoming and losses, EU transfers and
policies benefiting Romania have not been in vain. By most indicators Romania is now a better place to
live than before EU accession and the country offers good business opportunities to foreign investors.
7 Report from the Commission to the European Parliament and the Council – On Progress in Romania under the Cooperation and Verification Mechanism, Brussels, 27.1.2016, COM(2016) 41 final.
8 http://www.pna.ro/results.xhtml 9 See for details https://www.theguardian.com/world/2015/nov/04/woman-leading-war-on-corruption-romania 10 http://globalriskinsights.com/2016/07/romanias-anti-corruption-fight-sends-mixed-messages/ 11 The political scientist Alina Mungiu-Pippidi, president of the Romanian Academic Society, hailed the DNA for
prosecuting the corrupt political class what she called the trans-party mafia; http://www.bbc.com/news/blogs-eu-31537338. The historian Stefano Bottoni warned that Romania may become similar to Italy in the early 1990s, when the anti-mafia fight wiped out the former political class, destabilised the party system and gave rise to the rule of Berlusconi. Bottoni concludes that corruption and economic interests ruling in politics has not changed in its intensity but in its form; http://www.miscareaderezistenta.ro/actualitate/36389-dna-critici-kovesi-bottoni
14 BULGARIA AND ROMANIA – PART OF THE CENTRAL EUROPEAN MANUFACTURING CORE? Monthly Report 2017/01
Bulgaria and Romania – part of the Central European manufacturing core?
BY DORIS HANZL-WEISS
INTRODUCTION
Bulgaria and Romania joined the European Union in 2007, three years after their regional peers.
Slovakia, Hungary, the Czech Republic and Poland have been integrated into the so-called Central
European manufacturing core, under the auspices of Germany and also comprising Austria. The
manufacturing core countries share a range of common characteristics: a large share of manufacturing
in the economy, a pivotal role of Germany in organising production networks and a focus on certain
manufacturing sectors with strong international value chain participation, including foremost transport
equipment, but also electrical equipment, metals, machinery and the chemicals industry (IMF, 2013;
Stöllinger, 2013). This paper wants to shed light on the question whether Bulgaria and Romania have
also become part of the Central European manufacturing core and looks at manufacturing specialisation
patterns in these two countries in comparison to the above-mentioned four Central and East European
countries (CEE-4).
THE ROLE OF MANUFACTURING OVER TIME
Overall, the share of manufacturing in GDP is declining worldwide (with some few exceptions), whereas
the share of services is increasing (see Hanzl-Weiss and Stehrer, 2015). The CEE-4 as well as Bulgaria
and Romania were strongly specialised in manufacturing after the fall of communism, due to the latter’s
favouring heavy industry over services. Between 1989 and 1993, these countries suffered from a severe
transitional recession, leading to a strong de-industrialisation process. Thereafter, from 1995 to 2015,
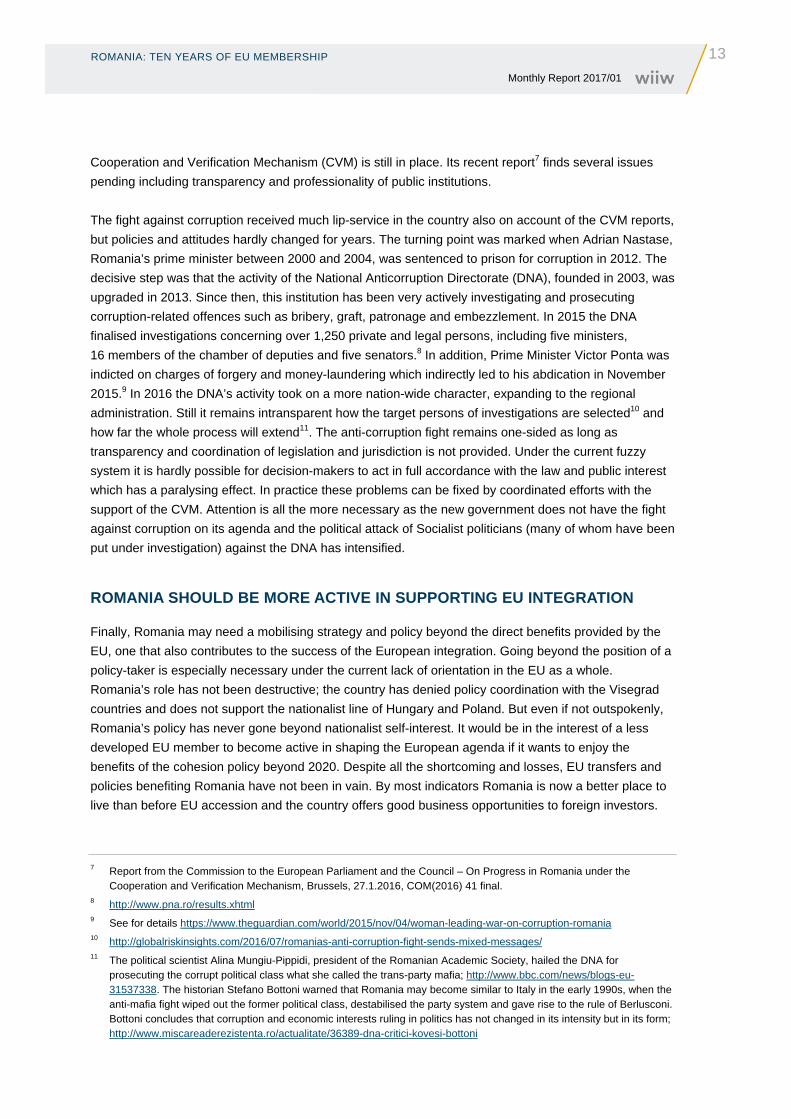
the share of manufacturing value added in GDP declined from 20%1 to 13% in Bulgaria and from 24% to
20% in Romania (see Figure 1; Bulgaria 1996 is not included due to a different classification scheme,
see footnote 1). However, most of the decline took place between 1995 and 2000, whereas shares have
remained broadly constant since 2000. The decline of manufacturing was even more pronounced in
terms of employment (see Figure 2).
In the CEE-4, manufacturing shares also declined in terms of employment and, in the case of Poland
and Slovakia, also in terms of value added. In the Czech Republic and Hungary, however,
manufacturing could expand its value added share and increased between 1995 and 2015. In these two
countries, manufacturing accounted, respectively, for about 24% and 20% of GDP in 2015, whereas in
Poland for 17.5% and in Slovakia for 19%. Thus, the share of manufacturing value added in the Central
European manufacturing core countries ranges around 20% of GDP, in the case of the Czech Republic
above that. Comparing the Bulgarian and Romanian shares with this figure, Romania also appears as a
1 Data for 1996 and based on NACE Rev. 1, thus not fully comparable with Figure 1, which is based on the NACE Rev. 2 classification system. Manufacturing shares tend to be larger under the NACE Rev. 1 classification system and differences may make up as much as 4 percentage points (for instance, this was the case in Bulgaria for the year 2000).
BULGARIA AND ROMANIA – PART OF THE CENTRAL EUROPEAN MANUFACTURING CORE?
15 Monthly Report 2017/01
country strongly focused on manufacturing, whereas this is less the case for Bulgaria. Bulgaria shows
the largest difference between value added and employment shares (6.5 percentage points), suggesting
a more labour-intensive manufacturing structure.
Figure 1 / Manufacturing value added in %
of GDP
Source: wiiw Annual Database, Eurostat.
Figure 2 / Manufacturing employment
(LFS) in % of total employment
Source: wiiw Annual Database, Eurostat.
MANUFACTURING SPECIALISATION PATTERNS
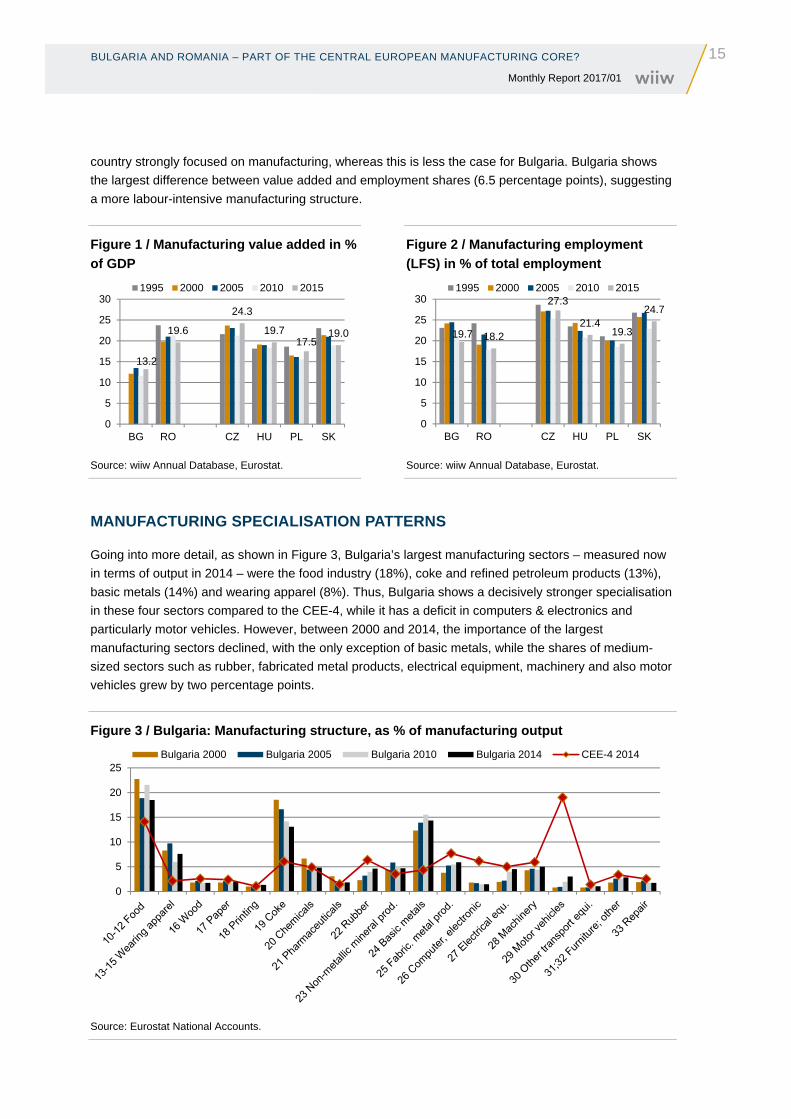
Going into more detail, as shown in Figure 3, Bulgaria’s largest manufacturing sectors – measured now
in terms of output in 2014 – were the food industry (18%), coke and refined petroleum products (13%),
basic metals (14%) and wearing apparel (8%). Thus, Bulgaria shows a decisively stronger specialisation
in these four sectors compared to the CEE-4, while it has a deficit in computers & electronics and
particularly motor vehicles. However, between 2000 and 2014, the importance of the largest
manufacturing sectors declined, with the only exception of basic metals, while the shares of medium-
sized sectors such as rubber, fabricated metal products, electrical equipment, machinery and also motor
vehicles grew by two percentage points.
Figure 3 / Bulgaria: Manufacturing structure, as % of manufacturing output
Source: Eurostat National Accounts.
13.2
19.6
24.3
19.717.5
19.0
0
5
10
15
20
25
30
BG RO CZ HU PL SK
1995 2000 2005 2010 2015
19.7 18.2
27.3
21.419.3
24.7
0
5
10
15
20
25
30
BG RO CZ HU PL SK
1995 2000 2005 2010 2015
0
5
10
15
20
25Bulgaria 2000 Bulgaria 2005 Bulgaria 2010 Bulgaria 2014 CEE-4 2014
16 BULGARIA AND ROMANIA – PART OF THE CENTRAL EUROPEAN MANUFACTURING CORE? Monthly Report 2017/01
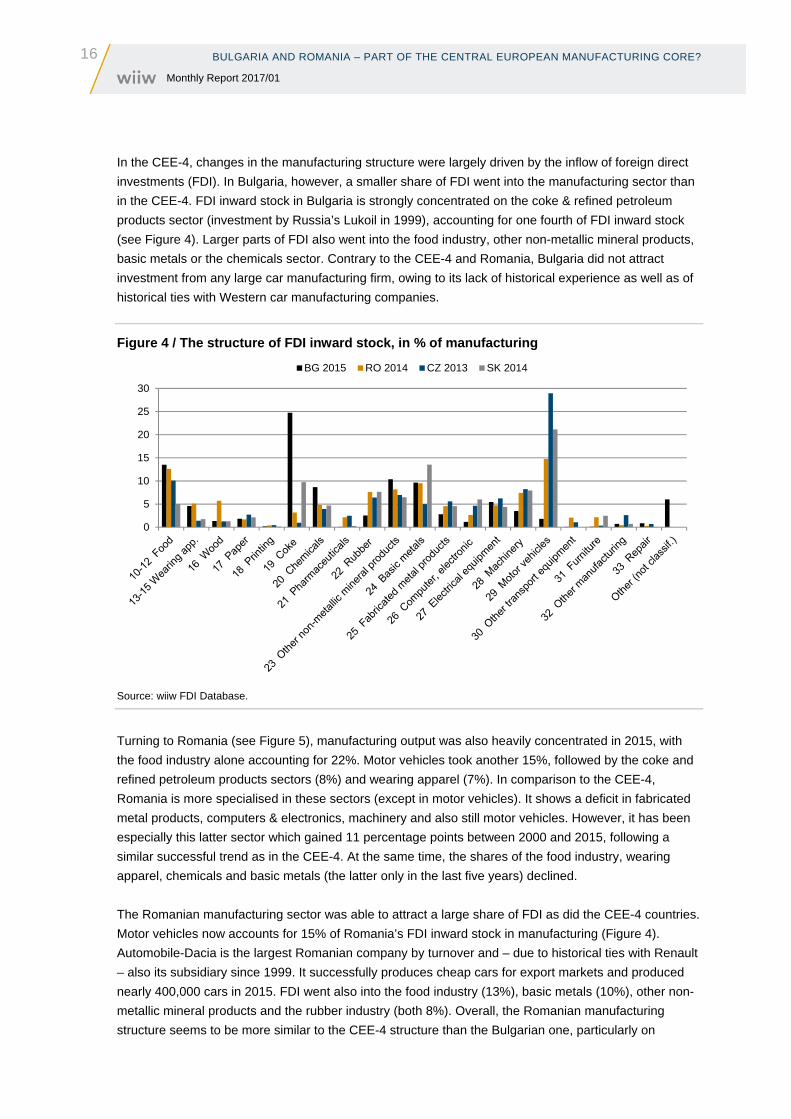
In the CEE-4, changes in the manufacturing structure were largely driven by the inflow of foreign direct
investments (FDI). In Bulgaria, however, a smaller share of FDI went into the manufacturing sector than
in the CEE-4. FDI inward stock in Bulgaria is strongly concentrated on the coke & refined petroleum
products sector (investment by Russia’s Lukoil in 1999), accounting for one fourth of FDI inward stock
(see Figure 4). Larger parts of FDI also went into the food industry, other non-metallic mineral products,
basic metals or the chemicals sector. Contrary to the CEE-4 and Romania, Bulgaria did not attract
investment from any large car manufacturing firm, owing to its lack of historical experience as well as of
historical ties with Western car manufacturing companies.
Figure 4 / The structure of FDI inward stock, in % of manufacturing
Source: wiiw FDI Database.
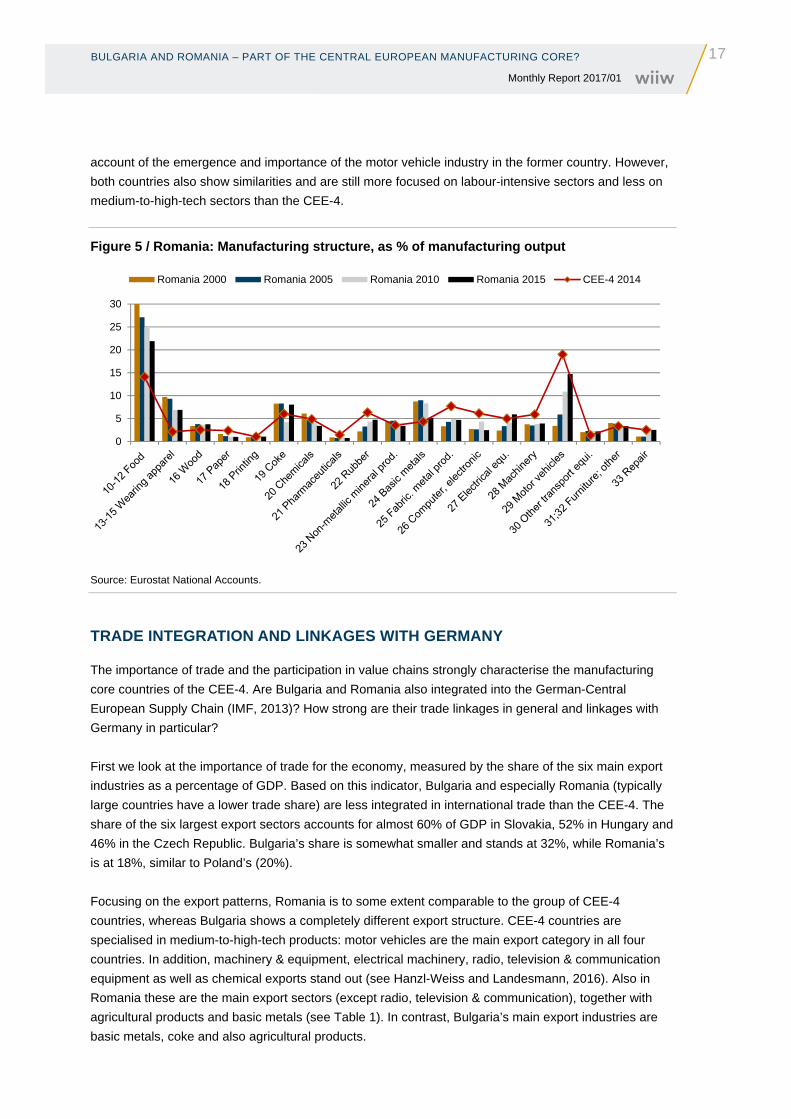
Turning to Romania (see Figure 5), manufacturing output was also heavily concentrated in 2015, with
the food industry alone accounting for 22%. Motor vehicles took another 15%, followed by the coke and
refined petroleum products sectors (8%) and wearing apparel (7%). In comparison to the CEE-4,
Romania is more specialised in these sectors (except in motor vehicles). It shows a deficit in fabricated
metal products, computers & electronics, machinery and also still motor vehicles. However, it has been
especially this latter sector which gained 11 percentage points between 2000 and 2015, following a
similar successful trend as in the CEE-4. At the same time, the shares of the food industry, wearing
apparel, chemicals and basic metals (the latter only in the last five years) declined.
The Romanian manufacturing sector was able to attract a large share of FDI as did the CEE-4 countries.
Motor vehicles now accounts for 15% of Romania’s FDI inward stock in manufacturing (Figure 4).
Automobile-Dacia is the largest Romanian company by turnover and – due to historical ties with Renault
– also its subsidiary since 1999. It successfully produces cheap cars for export markets and produced
nearly 400,000 cars in 2015. FDI went also into the food industry (13%), basic metals (10%), other non-
metallic mineral products and the rubber industry (both 8%). Overall, the Romanian manufacturing
structure seems to be more similar to the CEE-4 structure than the Bulgarian one, particularly on
0
5
10
15
20
25
30
BG 2015 RO 2014 CZ 2013 SK 2014
BULGARIA AND ROMANIA – PART OF THE CENTRAL EUROPEAN MANUFACTURING CORE?
17 Monthly Report 2017/01
account of the emergence and importance of the motor vehicle industry in the former country. However,
both countries also show similarities and are still more focused on labour-intensive sectors and less on
medium-to-high-tech sectors than the CEE-4.
Figure 5 / Romania: Manufacturing structure, as % of manufacturing output
Source: Eurostat National Accounts.
TRADE INTEGRATION AND LINKAGES WITH GERMANY
The importance of trade and the participation in value chains strongly characterise the manufacturing
core countries of the CEE-4. Are Bulgaria and Romania also integrated into the German-Central
European Supply Chain (IMF, 2013)? How strong are their trade linkages in general and linkages with
Germany in particular?
First we look at the importance of trade for the economy, measured by the share of the six main export
industries as a percentage of GDP. Based on this indicator, Bulgaria and especially Romania (typically
large countries have a lower trade share) are less integrated in international trade than the CEE-4. The
share of the six largest export sectors accounts for almost 60% of GDP in Slovakia, 52% in Hungary and
46% in the Czech Republic. Bulgaria’s share is somewhat smaller and stands at 32%, while Romania’s
is at 18%, similar to Poland’s (20%).
Focusing on the export patterns, Romania is to some extent comparable to the group of CEE-4
countries, whereas Bulgaria shows a completely different export structure. CEE-4 countries are
specialised in medium-to-high-tech products: motor vehicles are the main export category in all four
countries. In addition, machinery & equipment, electrical machinery, radio, television & communication
equipment as well as chemical exports stand out (see Hanzl-Weiss and Landesmann, 2016). Also in
Romania these are the main export sectors (except radio, television & communication), together with
agricultural products and basic metals (see Table 1). In contrast, Bulgaria’s main export industries are
basic metals, coke and also agricultural products.
0
5
10
15
20
25
30
Romania 2000 Romania 2005 Romania 2010 Romania 2015 CEE-4 2014
18 BULGARIA AND ROMANIA – PART OF THE CENTRAL EUROPEAN MANUFACTURING CORE? Monthly Report 2017/01
Table 1 / Main six export industries in Bulgaria and Romania, 2013, million USD
(NACE Rev. 1)
BULGARIA: Exports, million USD in % of
GDP
ROMANIA: Exports, million USD in % of
GDP
Main 6 export industries 17342 31.8 Main 6 export industries 33867 17.7
27 Basic metals 4342 34 Motor vehicles, trailers and semi-trailers 10039
23 Coke, refined petroleum products and nuclear fuel 3878 31 Electrical machinery and apparatus n.e.c. 6714
01 Products of agriculture, hunting and related services 2990 29 Machinery and equipment n.e.c. 5709
24 Chemicals, chemical products and man-made fibres 2116 01 Products of agriculture, hunting and related services 4293
29 Machinery and equipment n.e.c. 2032 24 Chemicals, chemical products and man-made fibres 3705
15 Food products and beverages 1985 27 Basic metals 3406
Source: UN COMTRADE, wiiw calculations.
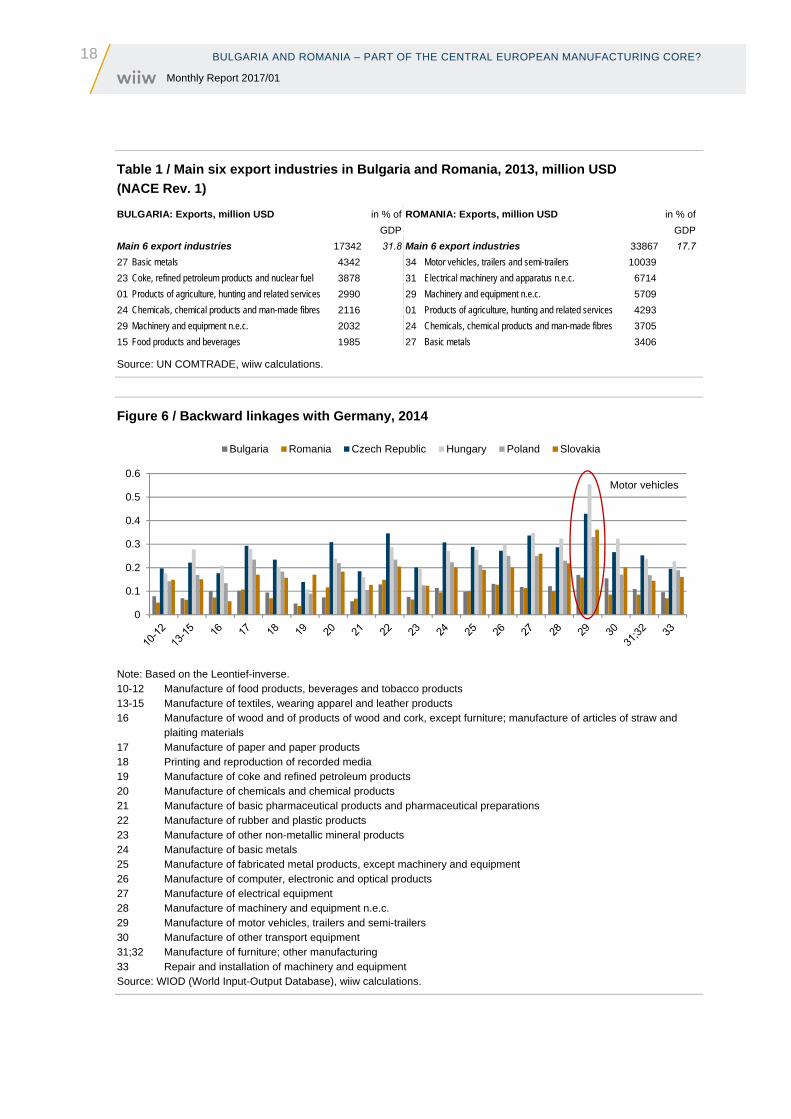
Figure 6 / Backward linkages with Germany, 2014
Note: Based on the Leontief-inverse. 10-12 Manufacture of food products, beverages and tobacco products 13-15 Manufacture of textiles, wearing apparel and leather products 16 Manufacture of wood and of products of wood and cork, except furniture; manufacture of articles of straw and
plaiting materials 17 Manufacture of paper and paper products 18 Printing and reproduction of recorded media 19 Manufacture of coke and refined petroleum products 20 Manufacture of chemicals and chemical products 21 Manufacture of basic pharmaceutical products and pharmaceutical preparations 22 Manufacture of rubber and plastic products 23 Manufacture of other non-metallic mineral products 24 Manufacture of basic metals 25 Manufacture of fabricated metal products, except machinery and equipment 26 Manufacture of computer, electronic and optical products 27 Manufacture of electrical equipment 28 Manufacture of machinery and equipment n.e.c. 29 Manufacture of motor vehicles, trailers and semi-trailers 30 Manufacture of other transport equipment 31;32 Manufacture of furniture; other manufacturing 33 Repair and installation of machinery and equipment Source: WIOD (World Input-Output Database), wiiw calculations.
0
0.1
0.2
0.3
0.4
0.5
0.6
Bulgaria Romania Czech Republic Hungary Poland Slovakia
Motor vehicles
BULGARIA AND ROMANIA – PART OF THE CENTRAL EUROPEAN MANUFACTURING CORE?
19 Monthly Report 2017/01
Focusing more on the role of Germany in supply chains, these are often cited in the context of the motor
vehicles industry (Hanzl-Weiss and Stehrer, 2014). German car manufacturers were among the front
runners in Eastern Europe after the fall of communism and acquired existing car companies or set up
new ones in the CEE-4 countries. In this way the CEE-4 developed strong trade ties with Germany,
sourcing intermediates from Germany for the assembly of cars (backward linkages) and producing
intermediates as well (forward linkages). Figure 6 shows that backward linkages are especially
pronounced for the CEE-4 in motor vehicles, while for Bulgaria and Romania they are decisively smaller.
However, this pattern is also evident in the other manufacturing sectors.
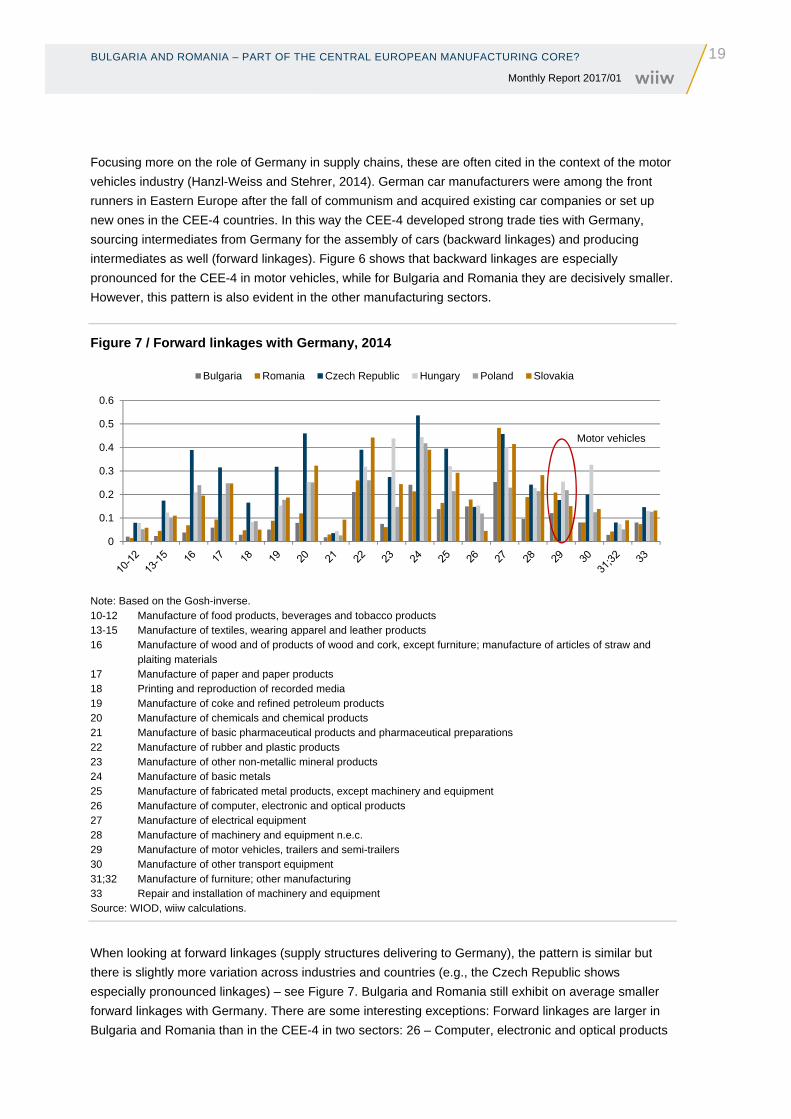
Figure 7 / Forward linkages with Germany, 2014
Note: Based on the Gosh-inverse. 10-12 Manufacture of food products, beverages and tobacco products 13-15 Manufacture of textiles, wearing apparel and leather products 16 Manufacture of wood and of products of wood and cork, except furniture; manufacture of articles of straw and
plaiting materials 17 Manufacture of paper and paper products 18 Printing and reproduction of recorded media 19 Manufacture of coke and refined petroleum products 20 Manufacture of chemicals and chemical products 21 Manufacture of basic pharmaceutical products and pharmaceutical preparations 22 Manufacture of rubber and plastic products 23 Manufacture of other non-metallic mineral products 24 Manufacture of basic metals 25 Manufacture of fabricated metal products, except machinery and equipment 26 Manufacture of computer, electronic and optical products 27 Manufacture of electrical equipment 28 Manufacture of machinery and equipment n.e.c. 29 Manufacture of motor vehicles, trailers and semi-trailers 30 Manufacture of other transport equipment 31;32 Manufacture of furniture; other manufacturing 33 Repair and installation of machinery and equipment Source: WIOD, wiiw calculations.
When looking at forward linkages (supply structures delivering to Germany), the pattern is similar but
there is slightly more variation across industries and countries (e.g., the Czech Republic shows
especially pronounced linkages) – see Figure 7. Bulgaria and Romania still exhibit on average smaller
forward linkages with Germany. There are some interesting exceptions: Forward linkages are larger in
Bulgaria and Romania than in the CEE-4 in two sectors: 26 – Computer, electronic and optical products
0
0.1
0.2
0.3
0.4
0.5
0.6
Bulgaria Romania Czech Republic Hungary Poland Slovakia
Motor vehicles
20 BULGARIA AND ROMANIA – PART OF THE CENTRAL EUROPEAN MANUFACTURING CORE? Monthly Report 2017/01
and in 27 – electrical equipment (in Romania). Linkages are similar in 29 – motor vehicles and in
28 – machinery (Romania). Linkages are smaller than in the CEE-4 but larger than in other sectors of
manufacturing in 22 – rubber and 24 – basic metals. Overall, because of different patterns of FDI, links
between Bulgaria and Romania on the one hand and Germany on the other hand are generally smaller
than those between the CEE-4 and Germany.
CONCLUSIONS
Are Bulgaria and Romania part of the Central European manufacturing core? Using the narrow definition
(specified by a large share of manufacturing in the economy, a pivotal role of Germany in organising
production networks and a focus on certain manufacturing sectors with strong international value chain
participation), the answer is no. Bulgaria and Romania have smaller linkages with Germany than the
CEE-4 countries. However, if leaving aside the German focus and thus broadening the definition,
Romania is also a country strongly focused on manufacturing, and has already shifted in the direction of
the CEE manufacturing structure (on the account of motor vehicles). As such, Romania can now also be
regarded as part of the manufacturing core. Bulgaria, by contrast, has a smaller manufacturing share,
and its manufacturing output structure and export structure differ widely from those of the CEE-4
average; thus, it can hardly be considered as being part of the Central European manufacturing core.
LITERATURE
Hanzl-Weiss, D. and R. Stehrer (2014), ‘Cars “Made in Europe” ’, Croatian Economic Survey, No. 16, April,
pp. 49–74.
Hanzl-Weiss, D. and R. Stehrer (2015), ‘Manufacturing and Business Services in the EU, with a particular
focus on the new Member States’, wiiw Monthly Report No. 3, March.
Hanzl-Weiss, D. and M. Landesmann (2016), ‘Correcting External Imbalances in the European Economy’,
wiiw Research Report No. 410, April.
IMF (2013), ‘IMF Multi-Country Report. German-Central European Supply Chain – Cluster Report’, IMF
Country Report No. 13/263, August.
Stöllinger, R. (2013), ‘The Central European Manufacturing Core: What is Driving Regional Production
Sharing?’, FIW Research Paper.
BULGARIA AND ROMANIA – PART OF THE CENTRAL EUROPEAN MANUFACTURING CORE?
21 Monthly Report 2017/01
The editors recommend for further reading
Donald Trump and US policies
Economics and policy advice in Donald Trump’s upcoming administration:
http://baselinescenario.com/2016/12/23/larry-kudlow-and-economics-in-the-trump-administration/
On the decline of US manufacturing: https://www.brookings.edu/blog/order-from-
chaos/2016/12/29/global-economic-forces-conspire-to-stymie-u-s-manufacturing/
Why Trump’s tariffs on Mexican cars probably won’t stop job flight:
https://www.bloomberg.com/graphics/2017-trump-mexico-auto-jobs/
Paul Krugman on trade and tariffs:
http://krugman.blogs.nytimes.com/2016/12/27/tariffs-and-the-trade-balance-wonkish/?_r=0
Henry Kissinger is back:
https://www.bloomberg.com/view/articles/2017-01-04/kissinger-s-washington-is-coming-back-around
Migration
Branko Milanovic on migration:
http://glineq.blogspot.co.at/2016/12/should-some-countries-cease-to-exist.html
Rethinking labour mobility: https://www.project-syndicate.org/commentary/displaced-workers-
globalization-mobility-by-harold-james-2017-01
Miscellaneous
Sergei Guriev on Putin’s popularity:
http://www.nytimes.com/2016/12/25/opinion/in-russia-its-not-the-economy-stupid.html
On Turkish divisions: http://www.the-tls.co.uk/articles/public/why-is-turkey-so-divided/
On Polish developments: https://newleftreview.org/II/102/leszek-koczanowicz-the-polish-case
Recommendation is not necessarily endorsement. The editors are grateful to Vladimir Gligorov, Philipp Heimberger and Gábor Hunya for their valuable contributions to this section.
22 MONTHLY AND QUARTERLY STATISTICS Monthly Report 2017/01
Monthly and quarterly statistics for Central, East and Southeast Europe
The monthly and quarterly statistics cover 20 countries of the CESEE region. The graphical form
of presenting statistical data is intended to facilitate the analysis of short-term macroeconomic
developments. The set of indicators captures tendencies in the real sector, pictures the situation in the
labour market and inflation, reflects fiscal and monetary policy changes, and depicts external sector
development.
Baseline data and a variety of other monthly and quarterly statistics, country-specific definitions
of indicators and methodological information on particular time series are available in the wiiw
Monthly Database under: http://data.wiiw.ac.at/monthly-database.html. Users regularly interested in
a certain set of indicators may create a personalised query which can then be quickly downloaded for
updates each month.
Conventional signs and abbreviations used
% per cent
GDP Gross Domestic Product
LFS Labour Force Survey
HICP Harmonized Index of Consumer Prices (for new EU Member States)
PPI Producer Price Index
M1 Currency outside banks + demand deposits / narrow money (ECB definition)
M2 M1 + quasi-money / intermediate money (ECB definition)
p.a. per annum
mn million (106)
bn billion (109)
The following national currencies are used:
ALL Albanian lek HUF Hungarian forint RSD Serbian dinar
BAM Bosnian convertible mark KZT Kazakh tenge RUB Russian rouble
BGN Bulgarian lev MKD Macedonian denar TRY Turkish lira
CZK Czech koruna PLN Polish zloty UAH Ukrainian hryvnia
HRK Croatian kuna RON Romanian leu
EUR euro – national currency for Montenegro and for the euro-area countries Estonia (from
January 2011, euro-fixed before), Latvia (from January 2014, euro-fixed before), Lithuania
(from January 2015, euro-fixed before), Slovakia (from January 2009, euro-fixed before) and
Slovenia (from January 2007, euro-fixed before).
Sources of statistical data: Eurostat, National Statistical Offices, Central Banks and Public Employment
Services; wiiw estimates.
MONTHLY AND QUARTERLY STATISTICS
23 Monthly Report 2017/01
Online database access
wiiw Annual Database wiiw Monthly Database wiiw FDI Database
The wiiw databases are accessible via a simple web interface, with only one password needed to
access all databases (and all wiiw publications).
You may access the databases here: http://data.wiiw.ac.at.
If you have not yet registered, you can do so here: http://wiiw.ac.at/register.html.
Service package available
We offer an additional service package that allows you to access all databases – a Premium
Membership, at a price of € 2,300 (instead of € 2,000 as for the Basic Membership). Your usual package
will, of course, remain available as well.
For more information on database access for Members and on Membership conditions, please contract
Ms. Gabriele Stanek ([email protected]), phone: (+43-1) 533 66 10-10.
24 MONTHLY AND QUARTERLY STATISTICS Monthly Report 2017/01
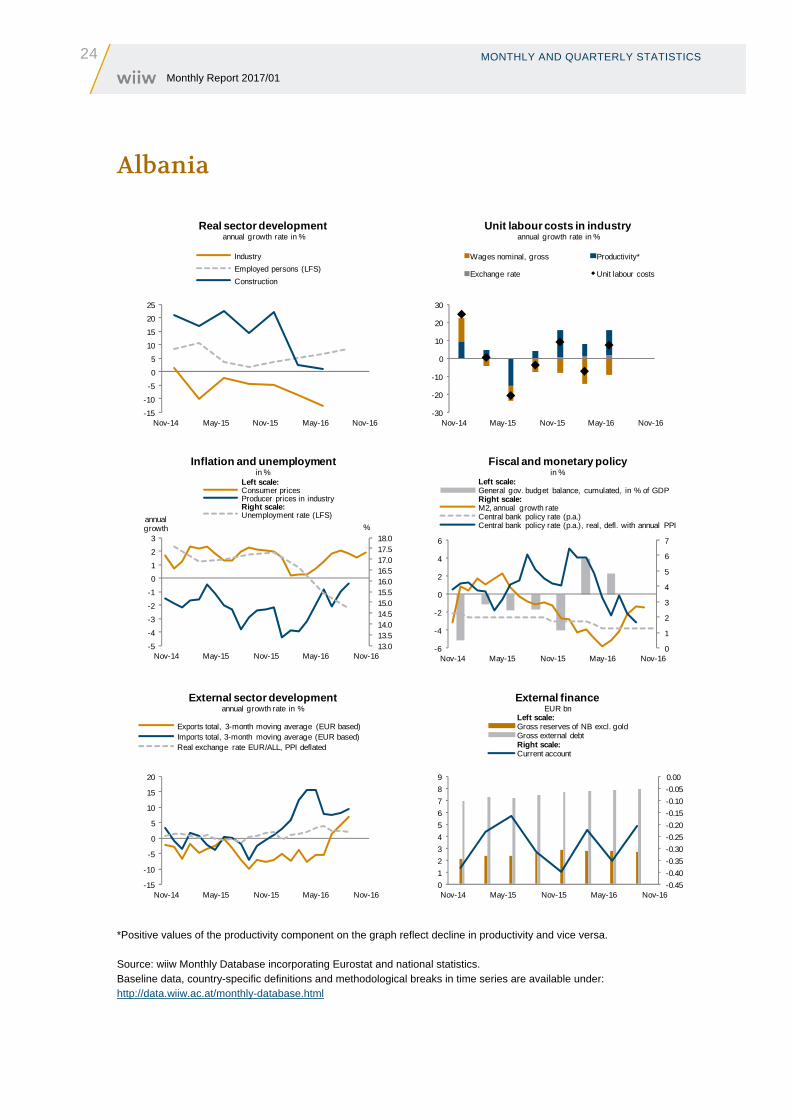
Albania
*Positive values of the productivity component on the graph reflect decline in productivity and vice versa. Source: wiiw Monthly Database incorporating Eurostat and national statistics. Baseline data, country-specific definitions and methodological breaks in time series are available under: http://data.wiiw.ac.at/monthly-database.html
-15
-10
-5
0
5
10
15
20
25
Nov-14 May-15 Nov-15 May-16 Nov-16
Real sector developmentannual growth rate in %
Industry
Employed persons (LFS)
Construction
-30
-20
-10
0
10
20
30
Nov-14 May-15 Nov-15 May-16 Nov-16
Unit labour costs in industryannual growth rate in %
Wages nominal, gross Productivity*
Exchange rate Unit labour costs
13.013.514.014.515.015.516.016.517.017.518.0
-5
-4
-3
-2
-1
0
1
2
3
Nov-14 May-15 Nov-15 May-16 Nov-16
%annual growth
Inflation and unemploymentin %
Left scale:Consumer pricesProducer prices in industryRight scale:Unemployment rate (LFS)
0
1
2
3
4
5
6
7
-6
-4
-2
0
2
4
6
Nov-14 May-15 Nov-15 May-16 Nov-16
Fiscal and monetary policyin %
Left scale:General gov. budget balance, cumulated, in % of GDPRight scale:M2, annual growth rateCentral bank policy rate (p.a.)Central bank policy rate (p.a.), real, defl. with annual PPI
-15
-10
-5
0
5
10
15
20
Nov-14 May-15 Nov-15 May-16 Nov-16
External sector developmentannual growth rate in %
Exports total, 3-month moving average (EUR based)Imports total, 3-month moving average (EUR based)Real exchange rate EUR/ALL, PPI deflated
-0.45
-0.40
-0.35
-0.30
-0.25
-0.20
-0.15
-0.10
-0.05
0.00
0
1
2
3
4
5
6
7
8
9
Nov-14 May-15 Nov-15 May-16 Nov-16
External finance EUR bn
Left scale:Gross reserves of NB excl. goldGross external debtRight scale:Current account
MONTHLY AND QUARTERLY STATISTICS
25 Monthly Report 2017/01
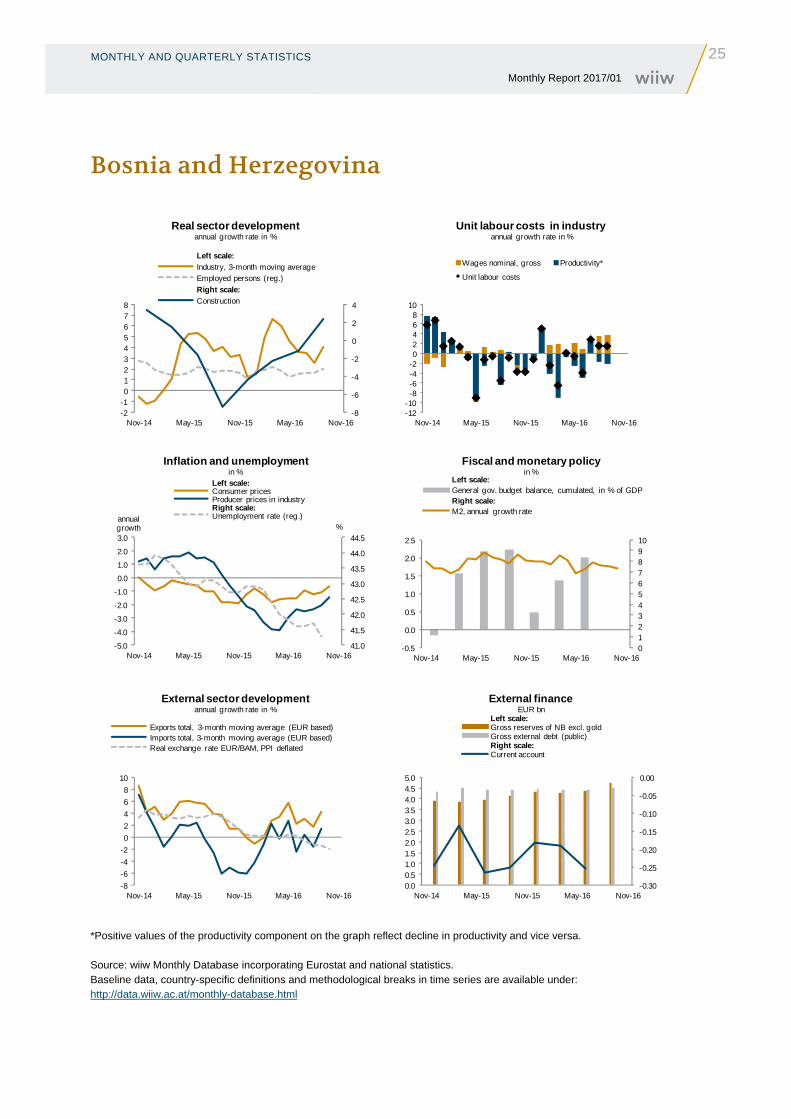
Bosnia and Herzegovina
*Positive values of the productivity component on the graph reflect decline in productivity and vice versa. Source: wiiw Monthly Database incorporating Eurostat and national statistics. Baseline data, country-specific definitions and methodological breaks in time series are available under: http://data.wiiw.ac.at/monthly-database.html
-8
-6
-4
-2
0
2
4
-2-1012345678
Nov-14 May-15 Nov-15 May-16 Nov-16
Real sector developmentannual growth rate in %
Left scale:
Industry, 3-month moving average
Employed persons (reg.)
Right scale:
Construction
-12-10-8-6-4-202468
10
Nov-14 May-15 Nov-15 May-16 Nov-16
Unit labour costs in industryannual growth rate in %
Wages nominal, gross Productivity*
Unit labour costs
41.0
41.5
42.0
42.5
43.0
43.5
44.0
44.5
-5.0
-4.0
-3.0
-2.0
-1.0
0.0
1.0
2.0
3.0
Nov-14 May-15 Nov-15 May-16 Nov-16
%annual growth
Inflation and unemploymentin %
Left scale:Consumer pricesProducer prices in industryRight scale:Unemployment rate (reg.)
012345678910
-0.5
0.0
0.5
1.0
1.5
2.0
2.5
Nov-14 May-15 Nov-15 May-16 Nov-16
Fiscal and monetary policyin %
Left scale:General gov. budget balance, cumulated, in % of GDPRight scale:M2, annual growth rate
-8
-6
-4
-2
0
2
4
6
8
10
Nov-14 May-15 Nov-15 May-16 Nov-16
External sector developmentannual growth rate in %
Exports total, 3-month moving average (EUR based)Imports total, 3-month moving average (EUR based)Real exchange rate EUR/BAM, PPI deflated
-0.30
-0.25
-0.20
-0.15
-0.10
-0.05
0.00
0.00.51.01.52.02.53.03.54.04.55.0
Nov-14 May-15 Nov-15 May-16 Nov-16
External finance EUR bn
Left scale:Gross reserves of NB excl. goldGross external debt (public)Right scale:Current account
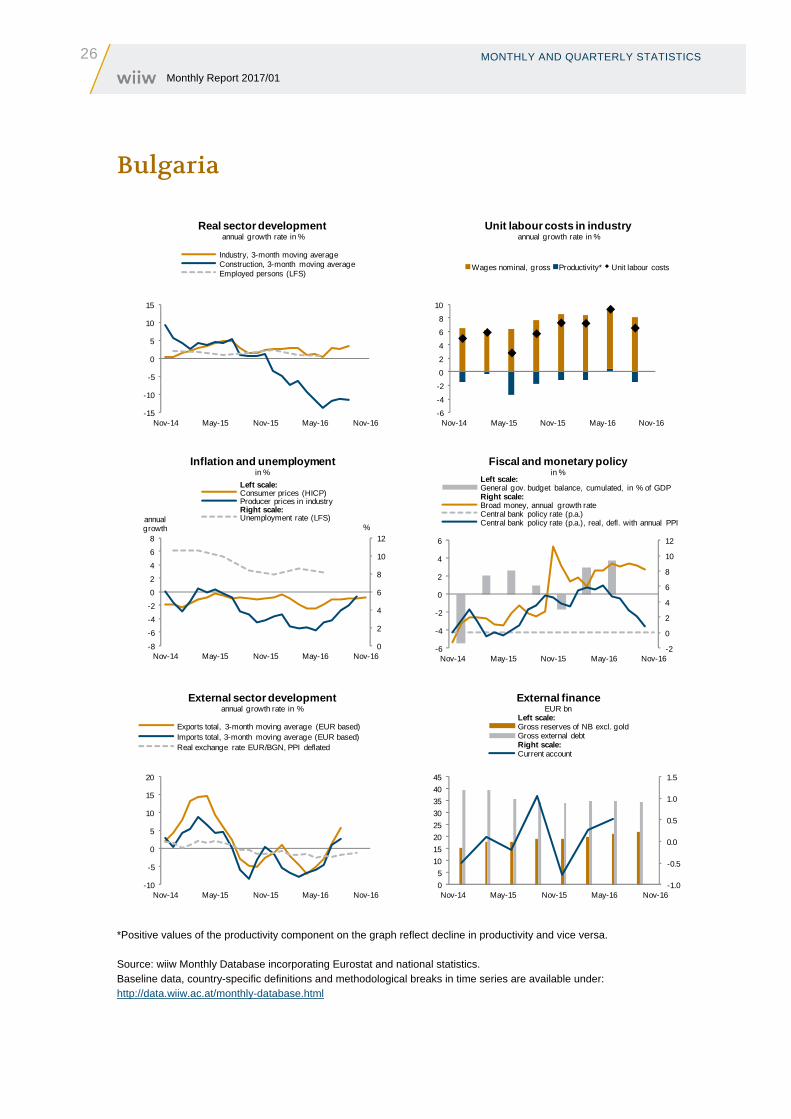
26 MONTHLY AND QUARTERLY STATISTICS Monthly Report 2017/01
Bulgaria
*Positive values of the productivity component on the graph reflect decline in productivity and vice versa. Source: wiiw Monthly Database incorporating Eurostat and national statistics. Baseline data, country-specific definitions and methodological breaks in time series are available under: http://data.wiiw.ac.at/monthly-database.html
-15
-10
-5
0
5
10
15
Nov-14 May-15 Nov-15 May-16 Nov-16
Real sector developmentannual growth rate in %
Industry, 3-month moving average Construction, 3-month moving average Employed persons (LFS)
-6
-4
-2
0
2
4
6
8
10
Nov-14 May-15 Nov-15 May-16 Nov-16
Unit labour costs in industryannual growth rate in %
Wages nominal, gross Productivity* Unit labour costs
0
2
4
6
8
10
12
-8
-6
-4
-2
0
2
4
6
8
Nov-14 May-15 Nov-15 May-16 Nov-16
%annual growth
Inflation and unemploymentin %
Left scale:Consumer prices (HICP)Producer prices in industryRight scale:Unemployment rate (LFS)
-2
0
2
4
6
8
10
12
-6
-4
-2
0
2
4
6
Nov-14 May-15 Nov-15 May-16 Nov-16
Fiscal and monetary policyin %
Left scale:General gov. budget balance, cumulated, in % of GDPRight scale:Broad money, annual growth rateCentral bank policy rate (p.a.)Central bank policy rate (p.a.), real, defl. with annual PPI
-10
-5
0
5
10
15
20
Nov-14 May-15 Nov-15 May-16 Nov-16
External sector developmentannual growth rate in %
Exports total, 3-month moving average (EUR based)Imports total, 3-month moving average (EUR based)Real exchange rate EUR/BGN, PPI deflated
-1.0
-0.5
0.0
0.5
1.0
1.5
0
5
10
15
20
25
30
35
40
45
Nov-14 May-15 Nov-15 May-16 Nov-16
External finance EUR bn
Left scale:Gross reserves of NB excl. goldGross external debtRight scale:Current account
MONTHLY AND QUARTERLY STATISTICS
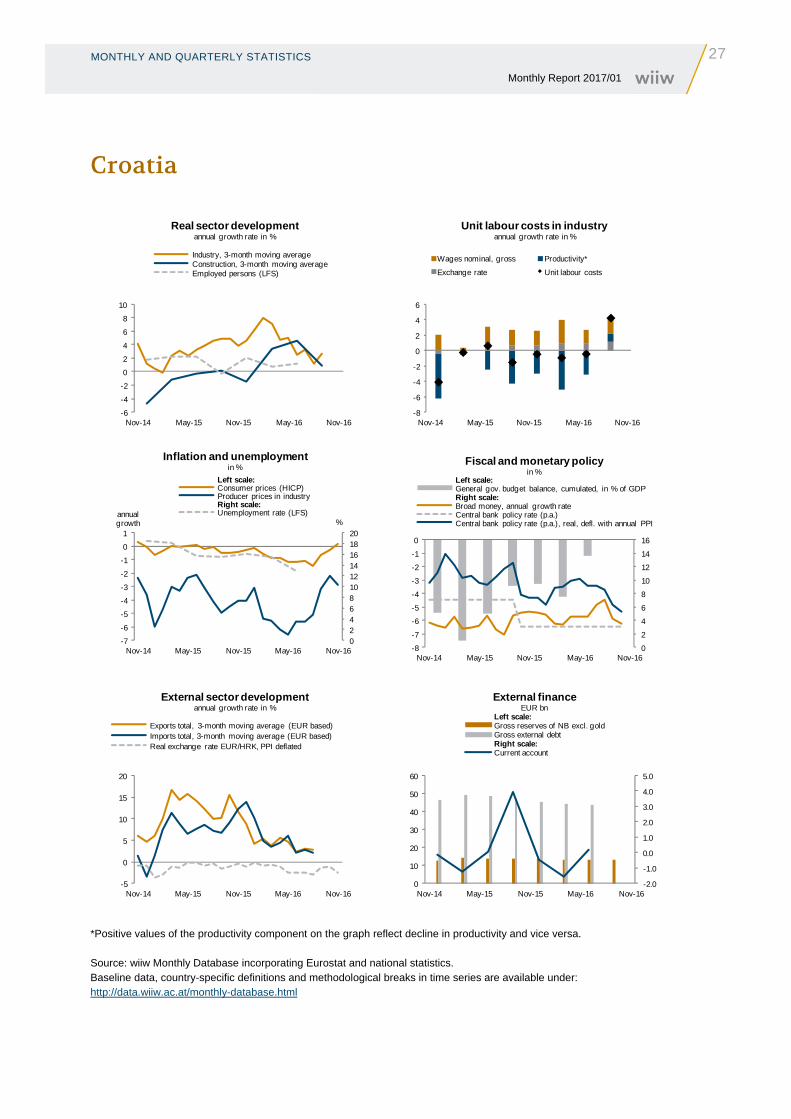
27 Monthly Report 2017/01
Croatia
*Positive values of the productivity component on the graph reflect decline in productivity and vice versa. Source: wiiw Monthly Database incorporating Eurostat and national statistics. Baseline data, country-specific definitions and methodological breaks in time series are available under: http://data.wiiw.ac.at/monthly-database.html
-6
-4
-2
0
2
4
6
8
10
Nov-14 May-15 Nov-15 May-16 Nov-16
Real sector developmentannual growth rate in %
Industry, 3-month moving average Construction, 3-month moving average Employed persons (LFS)
-8
-6
-4
-2
0
2
4
6
Nov-14 May-15 Nov-15 May-16 Nov-16
Unit labour costs in industryannual growth rate in %
Wages nominal, gross Productivity*
Exchange rate Unit labour costs
02468101214161820
-7
-6
-5
-4
-3
-2
-1
0
1
Nov-14 May-15 Nov-15 May-16 Nov-16
%annual growth
Inflation and unemploymentin %
Left scale:Consumer prices (HICP)Producer prices in industryRight scale:Unemployment rate (LFS)
0
2
4
6
8
10
12
14
16
-8
-7
-6
-5
-4
-3
-2
-1
0
Nov-14 May-15 Nov-15 May-16 Nov-16
Fiscal and monetary policyin %
Left scale:General gov. budget balance, cumulated, in % of GDPRight scale:Broad money, annual growth rateCentral bank policy rate (p.a.)Central bank policy rate (p.a.), real, defl. with annual PPI
-5
0
5
10
15
20
Nov-14 May-15 Nov-15 May-16 Nov-16
External sector developmentannual growth rate in %
Exports total, 3-month moving average (EUR based)Imports total, 3-month moving average (EUR based)Real exchange rate EUR/HRK, PPI deflated
-2.0
-1.0
0.0
1.0
2.0
3.0
4.0
5.0
0
10
20
30
40
50
60
Nov-14 May-15 Nov-15 May-16 Nov-16
External finance EUR bn
Left scale:Gross reserves of NB excl. goldGross external debtRight scale:Current account
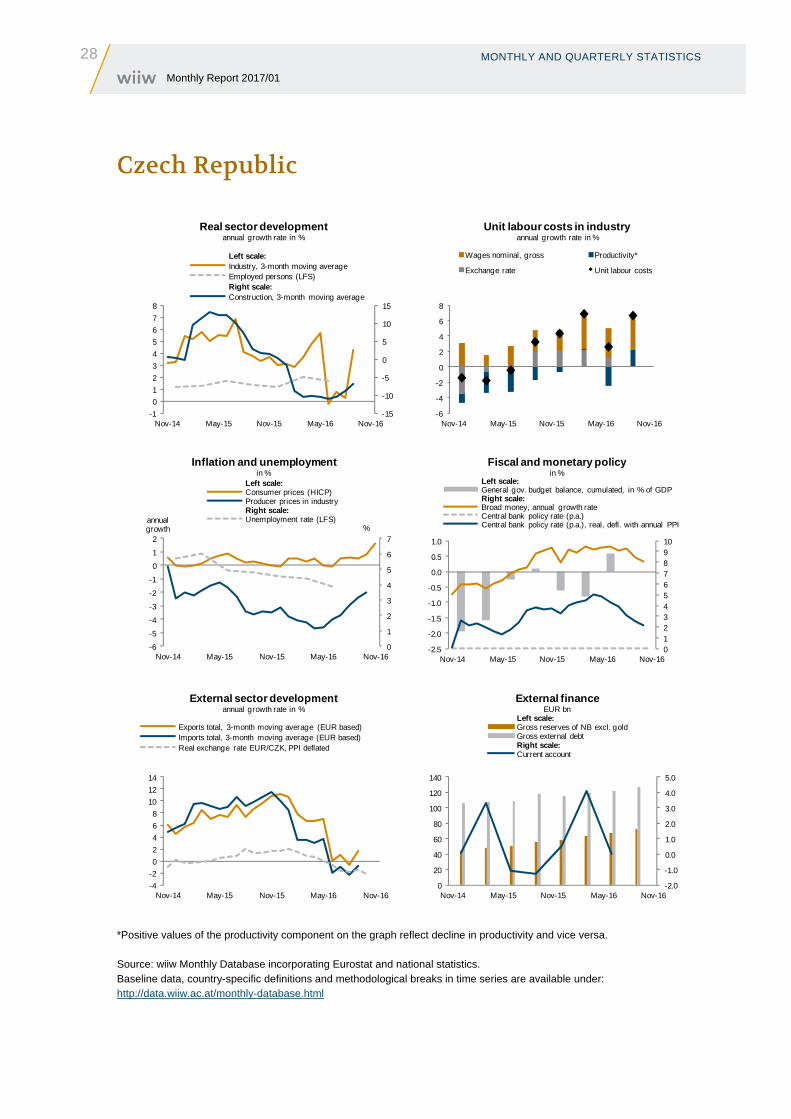
28 MONTHLY AND QUARTERLY STATISTICS Monthly Report 2017/01
Czech Republic
*Positive values of the productivity component on the graph reflect decline in productivity and vice versa. Source: wiiw Monthly Database incorporating Eurostat and national statistics. Baseline data, country-specific definitions and methodological breaks in time series are available under: http://data.wiiw.ac.at/monthly-database.html
-15
-10
-5
0
5
10
15
-1
0
1
2
3
4
5
6
7
8
Nov-14 May-15 Nov-15 May-16 Nov-16
Real sector developmentannual growth rate in %
Left scale:Industry, 3-month moving average Employed persons (LFS)Right scale:Construction, 3-month moving average
-6
-4
-2
0
2
4
6
8
Nov-14 May-15 Nov-15 May-16 Nov-16
Unit labour costs in industryannual growth rate in %
Wages nominal, gross Productivity*
Exchange rate Unit labour costs
0
1
2
3
4
5
6
7
-6
-5
-4
-3
-2
-1
0
1
2
Nov-14 May-15 Nov-15 May-16 Nov-16
%annual growth
Inflation and unemploymentin %
Left scale:Consumer prices (HICP)Producer prices in industryRight scale:Unemployment rate (LFS)
012345678910
-2.5
-2.0
-1.5
-1.0
-0.5
0.0
0.5
1.0
Nov-14 May-15 Nov-15 May-16 Nov-16
Fiscal and monetary policyin %
Left scale:General gov. budget balance, cumulated, in % of GDPRight scale:Broad money, annual growth rateCentral bank policy rate (p.a.)Central bank policy rate (p.a.), real, defl. with annual PPI
-4
-2
0
2
4
6
8
10
12
14
Nov-14 May-15 Nov-15 May-16 Nov-16
External sector developmentannual growth rate in %
Exports total, 3-month moving average (EUR based)Imports total, 3-month moving average (EUR based)Real exchange rate EUR/CZK, PPI deflated
-2.0
-1.0
0.0
1.0
2.0
3.0
4.0
5.0
0
20
40
60
80
100
120
140
Nov-14 May-15 Nov-15 May-16 Nov-16
External finance EUR bn
Left scale:Gross reserves of NB excl. goldGross external debtRight scale:Current account
MONTHLY AND QUARTERLY STATISTICS
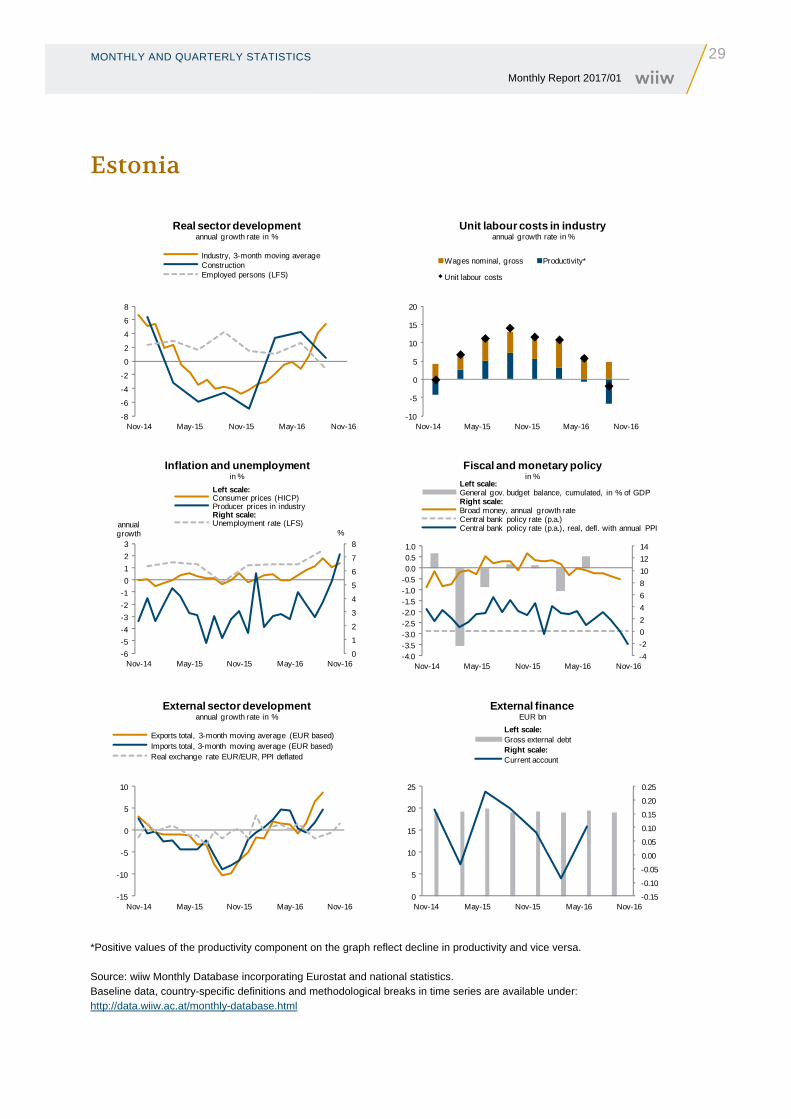
29 Monthly Report 2017/01
Estonia
*Positive values of the productivity component on the graph reflect decline in productivity and vice versa. Source: wiiw Monthly Database incorporating Eurostat and national statistics. Baseline data, country-specific definitions and methodological breaks in time series are available under: http://data.wiiw.ac.at/monthly-database.html
-8
-6
-4
-2
0
2
4
6
8
Nov-14 May-15 Nov-15 May-16 Nov-16
Real sector developmentannual growth rate in %
Industry, 3-month moving average ConstructionEmployed persons (LFS)
-10
-5
0
5
10
15
20
Nov-14 May-15 Nov-15 May-16 Nov-16
Unit labour costs in industryannual growth rate in %
Wages nominal, gross Productivity*
Unit labour costs
0
1
2
3
4
5
6
7
8
-6
-5
-4
-3
-2
-1
0
1
2
3
Nov-14 May-15 Nov-15 May-16 Nov-16
%annual growth
Inflation and unemploymentin %
Left scale:Consumer prices (HICP)Producer prices in industryRight scale:Unemployment rate (LFS)
-4
-2
0
2
4
6
8
10
12
14
-4.0-3.5-3.0-2.5-2.0-1.5-1.0-0.50.00.51.0
Nov-14 May-15 Nov-15 May-16 Nov-16
Fiscal and monetary policyin %
Left scale:General gov. budget balance, cumulated, in % of GDPRight scale:Broad money, annual growth rateCentral bank policy rate (p.a.)Central bank policy rate (p.a.), real, defl. with annual PPI
-15
-10
-5
0
5
10
Nov-14 May-15 Nov-15 May-16 Nov-16
External sector developmentannual growth rate in %
Exports total, 3-month moving average (EUR based)Imports total, 3-month moving average (EUR based)Real exchange rate EUR/EUR, PPI deflated
-0.15
-0.10
-0.05
0.00
0.05
0.10
0.15
0.20
0.25
0
5
10
15
20
25
Nov-14 May-15 Nov-15 May-16 Nov-16
External finance EUR bn
Left scale:Gross external debtRight scale:Current account
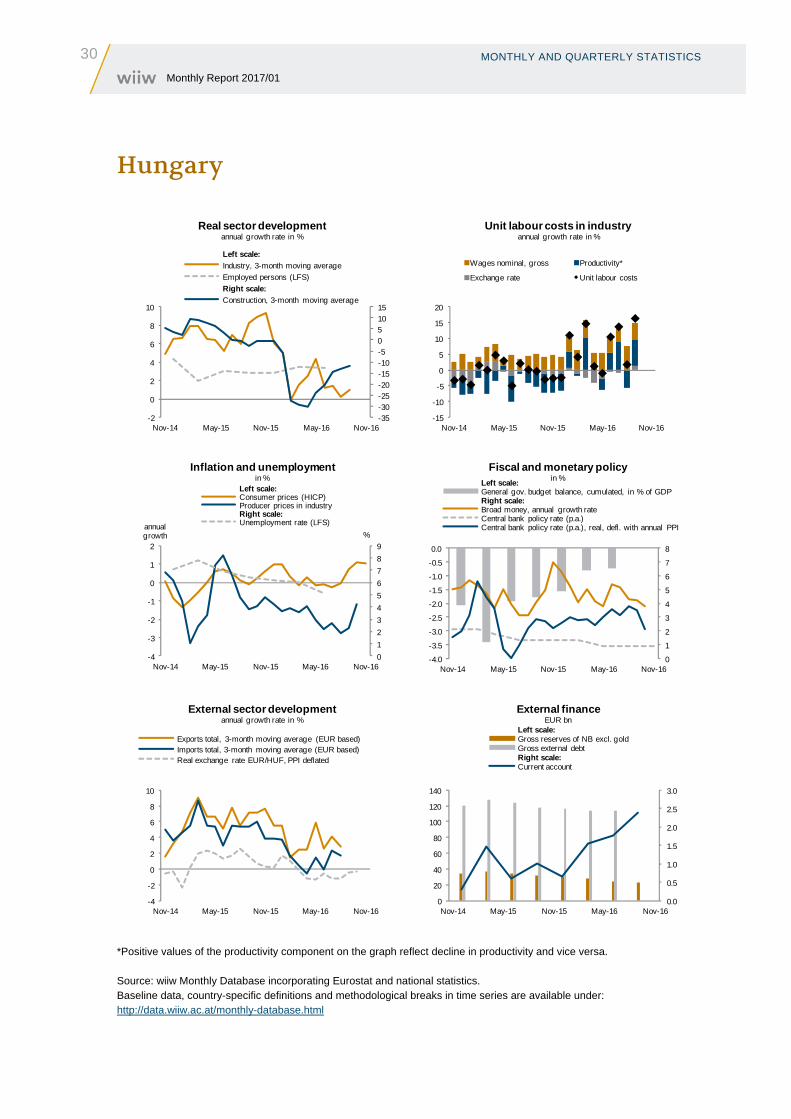
30 MONTHLY AND QUARTERLY STATISTICS Monthly Report 2017/01
Hungary
*Positive values of the productivity component on the graph reflect decline in productivity and vice versa. Source: wiiw Monthly Database incorporating Eurostat and national statistics. Baseline data, country-specific definitions and methodological breaks in time series are available under: http://data.wiiw.ac.at/monthly-database.html
-35-30-25-20-15-10-5051015
-2
0
2
4
6
8
10
Nov-14 May-15 Nov-15 May-16 Nov-16
Real sector developmentannual growth rate in %
Left scale:
Industry, 3-month moving average
Employed persons (LFS)
Right scale:
Construction, 3-month moving average
-15
-10
-5
0
5
10
15
20
Nov-14 May-15 Nov-15 May-16 Nov-16
Unit labour costs in industryannual growth rate in %
Wages nominal, gross Productivity*
Exchange rate Unit labour costs
0
1
2
3
4
5
6
7
8
9
-4
-3
-2
-1
0
1
2
Nov-14 May-15 Nov-15 May-16 Nov-16
%annual growth
Inflation and unemploymentin %
Left scale:Consumer prices (HICP)Producer prices in industryRight scale:Unemployment rate (LFS)
0
1
2
3
4
5
6
7
8
-4.0
-3.5
-3.0
-2.5
-2.0
-1.5
-1.0
-0.5
0.0
Nov-14 May-15 Nov-15 May-16 Nov-16
Fiscal and monetary policyin %
Left scale:General gov. budget balance, cumulated, in % of GDPRight scale:Broad money, annual growth rateCentral bank policy rate (p.a.)Central bank policy rate (p.a.), real, defl. with annual PPI
-4
-2
0
2
4
6
8
10
Nov-14 May-15 Nov-15 May-16 Nov-16
External sector developmentannual growth rate in %
Exports total, 3-month moving average (EUR based)Imports total, 3-month moving average (EUR based)Real exchange rate EUR/HUF, PPI deflated
0.0
0.5
1.0
1.5
2.0
2.5
3.0
0
20
40
60
80
100
120
140
Nov-14 May-15 Nov-15 May-16 Nov-16
External finance EUR bn
Left scale:Gross reserves of NB excl. goldGross external debtRight scale:Current account
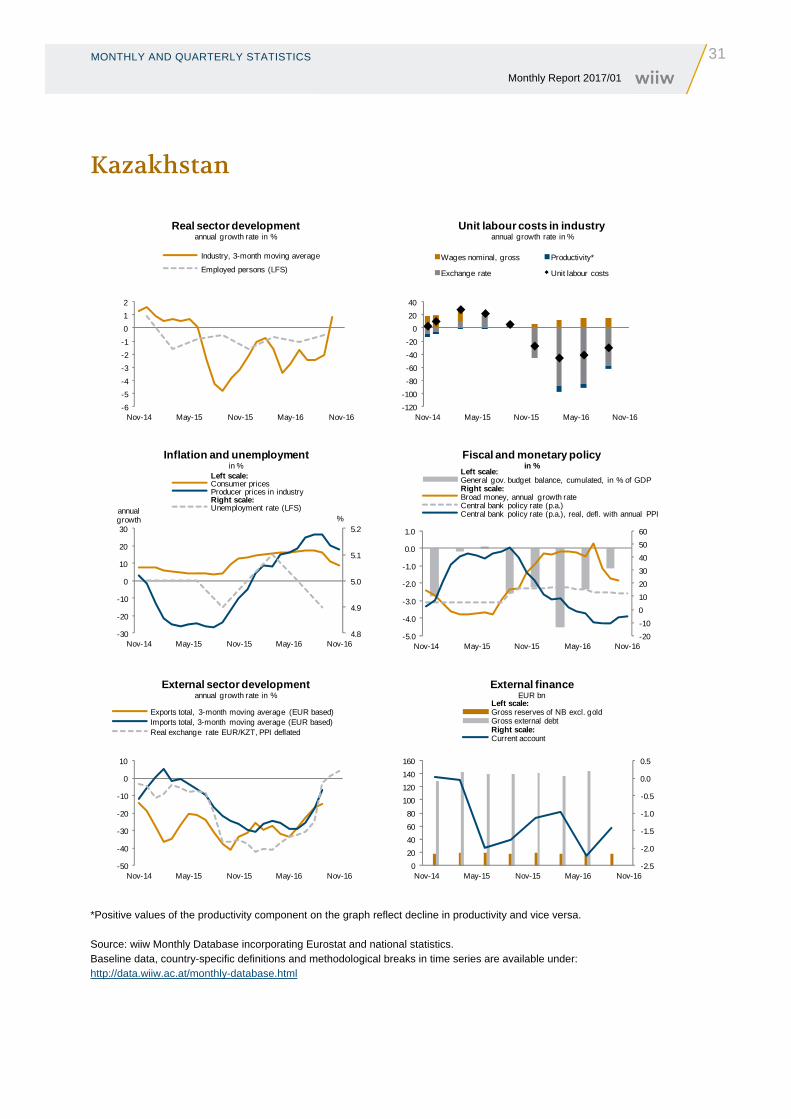
MONTHLY AND QUARTERLY STATISTICS
31 Monthly Report 2017/01
Kazakhstan
*Positive values of the productivity component on the graph reflect decline in productivity and vice versa. Source: wiiw Monthly Database incorporating Eurostat and national statistics. Baseline data, country-specific definitions and methodological breaks in time series are available under: http://data.wiiw.ac.at/monthly-database.html
-6
-5
-4
-3
-2
-1
0
1
2
Nov-14 May-15 Nov-15 May-16 Nov-16
Real sector developmentannual growth rate in %
Industry, 3-month moving average
Employed persons (LFS)
-120
-100
-80
-60
-40
-20
0
20
40
Nov-14 May-15 Nov-15 May-16 Nov-16
Unit labour costs in industryannual growth rate in %
Wages nominal, gross Productivity*
Exchange rate Unit labour costs
4.8
4.9
5.0
5.1
5.2
-30
-20
-10
0
10
20
30
Nov-14 May-15 Nov-15 May-16 Nov-16
%annual growth
Inflation and unemploymentin %
Left scale:Consumer pricesProducer prices in industryRight scale:Unemployment rate (LFS)
-20
-10
0
10
20
30
40
50
60
-5.0
-4.0
-3.0
-2.0
-1.0
0.0
1.0
Nov-14 May-15 Nov-15 May-16 Nov-16
Fiscal and monetary policyin %
Left scale:General gov. budget balance, cumulated, in % of GDPRight scale:Broad money, annual growth rateCentral bank policy rate (p.a.)Central bank policy rate (p.a.), real, defl. with annual PPI
-50
-40
-30
-20
-10
0
10
Nov-14 May-15 Nov-15 May-16 Nov-16
External sector developmentannual growth rate in %
Exports total, 3-month moving average (EUR based)Imports total, 3-month moving average (EUR based)Real exchange rate EUR/KZT, PPI deflated
-2.5
-2.0
-1.5
-1.0
-0.5
0.0
0.5
0
20
40
60
80
100
120
140
160
Nov-14 May-15 Nov-15 May-16 Nov-16
External finance EUR bn
Left scale:Gross reserves of NB excl. goldGross external debtRight scale:Current account
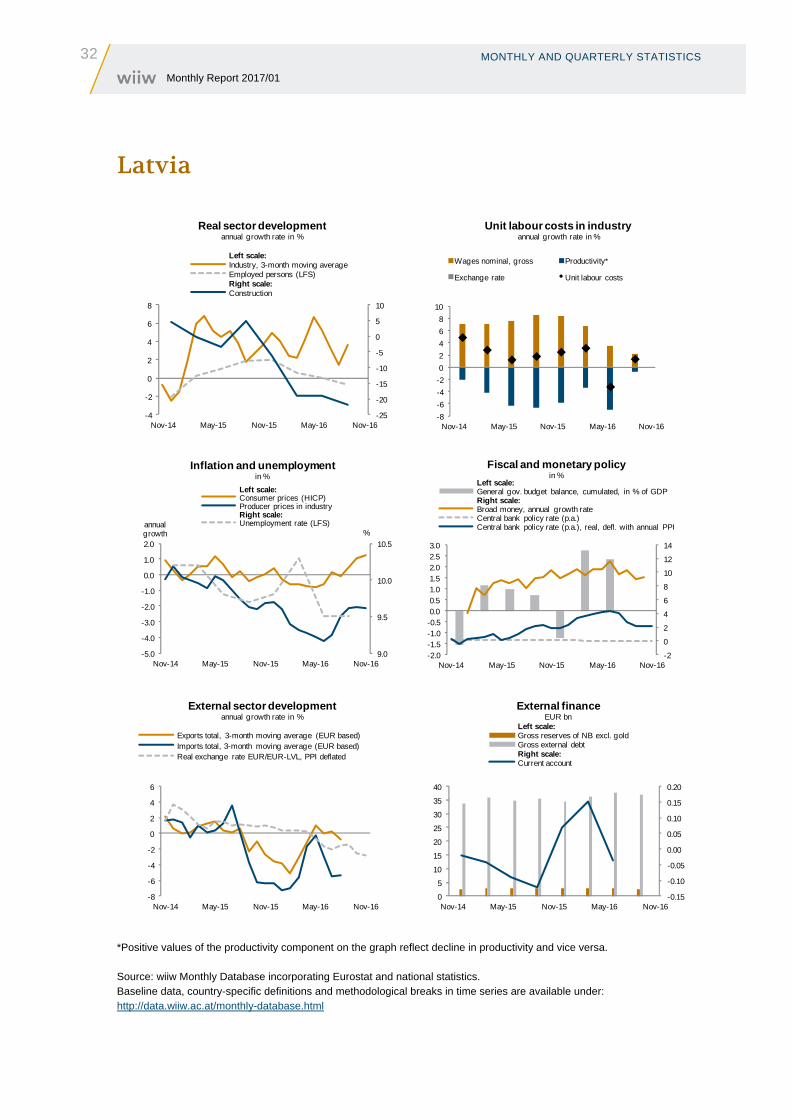
32 MONTHLY AND QUARTERLY STATISTICS Monthly Report 2017/01
Latvia
*Positive values of the productivity component on the graph reflect decline in productivity and vice versa. Source: wiiw Monthly Database incorporating Eurostat and national statistics. Baseline data, country-specific definitions and methodological breaks in time series are available under: http://data.wiiw.ac.at/monthly-database.html
-25
-20
-15
-10
-5
0
5
10
-4
-2
0
2
4
6
8
Nov-14 May-15 Nov-15 May-16 Nov-16
Real sector developmentannual growth rate in %
Left scale:Industry, 3-month moving average Employed persons (LFS)Right scale:Construction
-8
-6
-4
-2
0
2
4
6
8
10
Nov-14 May-15 Nov-15 May-16 Nov-16
Unit labour costs in industryannual growth rate in %
Wages nominal, gross Productivity*
Exchange rate Unit labour costs
9.0
9.5
10.0
10.5
-5.0
-4.0
-3.0
-2.0
-1.0
0.0
1.0
2.0
Nov-14 May-15 Nov-15 May-16 Nov-16
%annual growth
Inflation and unemploymentin %
Left scale:Consumer prices (HICP)Producer prices in industryRight scale:Unemployment rate (LFS)
-2
0
2
4
6
8
10
12
14
-2.0-1.5-1.0-0.50.00.51.01.52.02.53.0
Nov-14 May-15 Nov-15 May-16 Nov-16
Fiscal and monetary policyin %
Left scale:General gov. budget balance, cumulated, in % of GDPRight scale:Broad money, annual growth rateCentral bank policy rate (p.a.)Central bank policy rate (p.a.), real, defl. with annual PPI
-8
-6
-4
-2
0
2
4
6
Nov-14 May-15 Nov-15 May-16 Nov-16
External sector developmentannual growth rate in %
Exports total, 3-month moving average (EUR based)Imports total, 3-month moving average (EUR based)Real exchange rate EUR/EUR-LVL, PPI deflated
-0.15
-0.10
-0.05
0.00
0.05
0.10
0.15
0.20
0
5
10
15
20
25
30
35
40
Nov-14 May-15 Nov-15 May-16 Nov-16
External finance EUR bn
Left scale:Gross reserves of NB excl. goldGross external debtRight scale:Current account
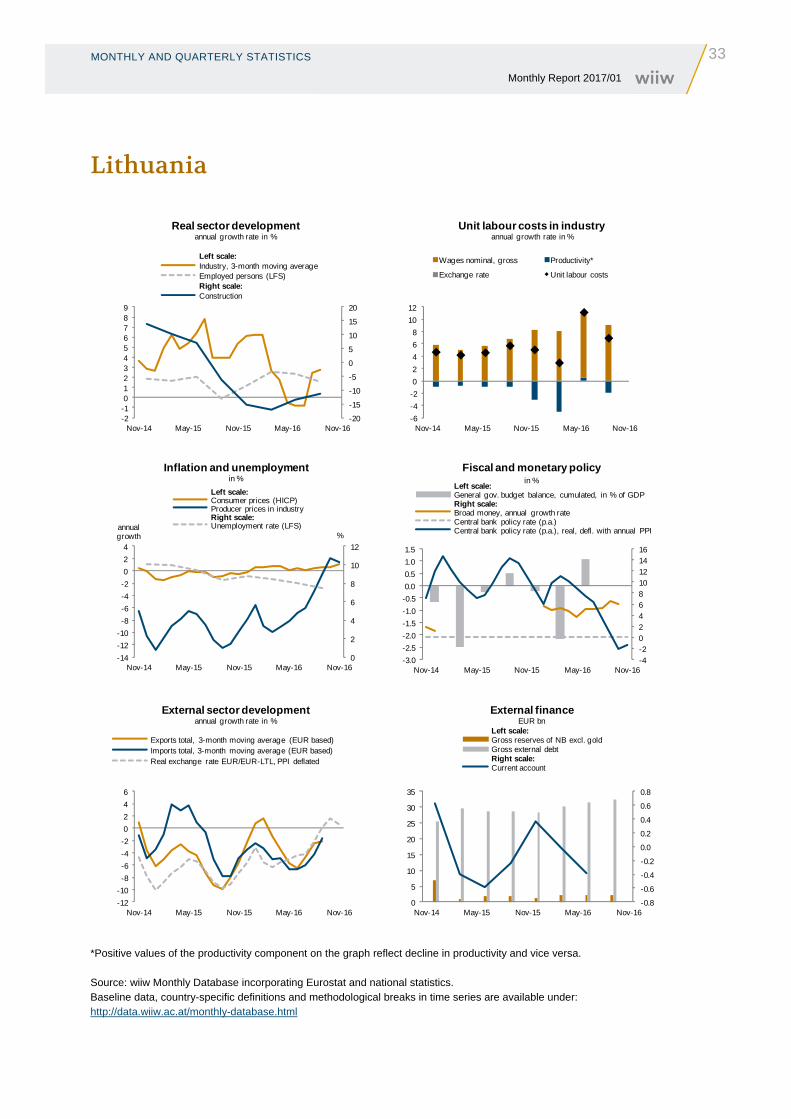
MONTHLY AND QUARTERLY STATISTICS
33 Monthly Report 2017/01
Lithuania
*Positive values of the productivity component on the graph reflect decline in productivity and vice versa. Source: wiiw Monthly Database incorporating Eurostat and national statistics. Baseline data, country-specific definitions and methodological breaks in time series are available under: http://data.wiiw.ac.at/monthly-database.html
-20
-15
-10
-5
0
5
10
15
20
-2-10123456789
Nov-14 May-15 Nov-15 May-16 Nov-16
Real sector developmentannual growth rate in %
Left scale:Industry, 3-month moving average Employed persons (LFS)Right scale:Construction
-6
-4
-2
0
2
4
6
8
10
12
Nov-14 May-15 Nov-15 May-16 Nov-16
Unit labour costs in industryannual growth rate in %
Wages nominal, gross Productivity*
Exchange rate Unit labour costs
0
2
4
6
8
10
12
-14
-12
-10
-8
-6
-4
-2
0
2
4
Nov-14 May-15 Nov-15 May-16 Nov-16
%annual growth
Inflation and unemploymentin %
Left scale:Consumer prices (HICP)Producer prices in industryRight scale:Unemployment rate (LFS)
-4-20246810121416
-3.0
-2.5
-2.0
-1.5
-1.0
-0.5
0.0
0.5
1.0
1.5
Nov-14 May-15 Nov-15 May-16 Nov-16
Fiscal and monetary policyin %
Left scale:General gov. budget balance, cumulated, in % of GDPRight scale:Broad money, annual growth rateCentral bank policy rate (p.a.)Central bank policy rate (p.a.), real, defl. with annual PPI
-12
-10
-8
-6
-4
-2
0
2
4
6
Nov-14 May-15 Nov-15 May-16 Nov-16
External sector developmentannual growth rate in %
Exports total, 3-month moving average (EUR based)Imports total, 3-month moving average (EUR based)Real exchange rate EUR/EUR-LTL, PPI deflated
-0.8
-0.6
-0.4
-0.2
0.0
0.2
0.4
0.6
0.8
0
5
10
15
20
25
30
35
Nov-14 May-15 Nov-15 May-16 Nov-16
External finance EUR bn
Left scale:Gross reserves of NB excl. goldGross external debtRight scale:Current account
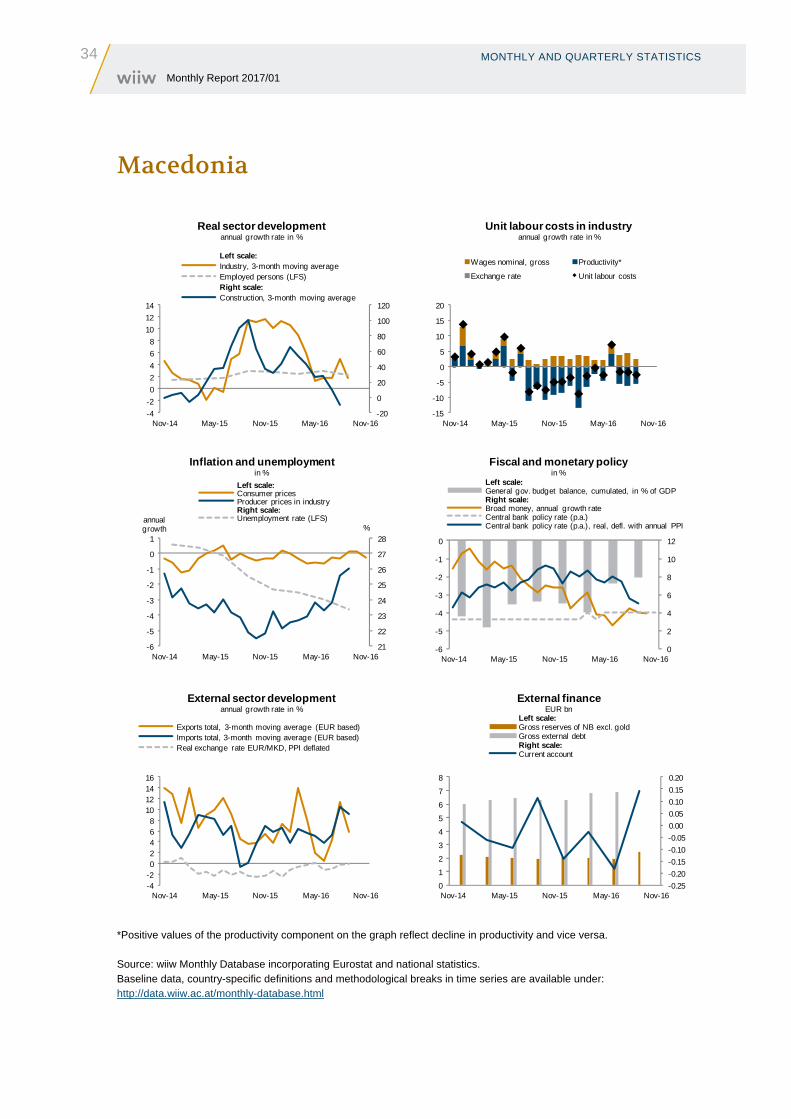
34 MONTHLY AND QUARTERLY STATISTICS Monthly Report 2017/01
Macedonia
*Positive values of the productivity component on the graph reflect decline in productivity and vice versa. Source: wiiw Monthly Database incorporating Eurostat and national statistics. Baseline data, country-specific definitions and methodological breaks in time series are available under: http://data.wiiw.ac.at/monthly-database.html
-20
0
20
40
60
80
100
120
-4
-2
0
2
4
6
8
10
12
14
Nov-14 May-15 Nov-15 May-16 Nov-16
Real sector developmentannual growth rate in %
Left scale:Industry, 3-month moving average Employed persons (LFS)Right scale:Construction, 3-month moving average
-15
-10
-5
0
5
10
15
20
Nov-14 May-15 Nov-15 May-16 Nov-16
Unit labour costs in industryannual growth rate in %
Wages nominal, gross Productivity*
Exchange rate Unit labour costs
21
22
23
24
25
26
27
28
-6
-5
-4
-3
-2
-1
0
1
Nov-14 May-15 Nov-15 May-16 Nov-16
%annual growth
Inflation and unemploymentin %
Left scale:Consumer pricesProducer prices in industryRight scale:Unemployment rate (LFS)
0
2
4
6
8
10
12
-6
-5
-4
-3
-2
-1
0
Nov-14 May-15 Nov-15 May-16 Nov-16
Fiscal and monetary policyin %
Left scale:General gov. budget balance, cumulated, in % of GDPRight scale:Broad money, annual growth rateCentral bank policy rate (p.a.)Central bank policy rate (p.a.), real, defl. with annual PPI
-4-202468
10121416
Nov-14 May-15 Nov-15 May-16 Nov-16
External sector developmentannual growth rate in %
Exports total, 3-month moving average (EUR based)Imports total, 3-month moving average (EUR based)Real exchange rate EUR/MKD, PPI deflated
-0.25
-0.20
-0.15
-0.10
-0.05
0.00
0.05
0.10
0.15
0.20
0
1
2
3
4
5
6
7
8
Nov-14 May-15 Nov-15 May-16 Nov-16
External finance EUR bn
Left scale:Gross reserves of NB excl. goldGross external debtRight scale:Current account
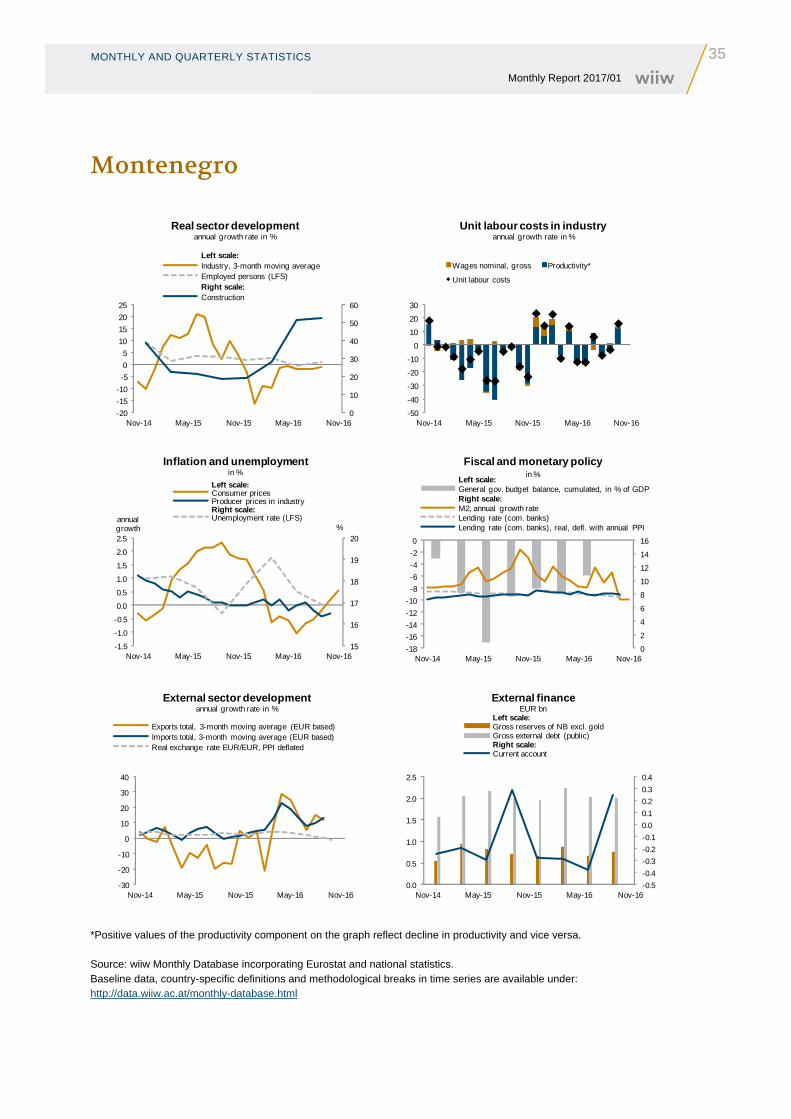
MONTHLY AND QUARTERLY STATISTICS
35 Monthly Report 2017/01
Montenegro
*Positive values of the productivity component on the graph reflect decline in productivity and vice versa. Source: wiiw Monthly Database incorporating Eurostat and national statistics. Baseline data, country-specific definitions and methodological breaks in time series are available under: http://data.wiiw.ac.at/monthly-database.html
-50
-40
-30
-20
-10
0
10
20
30
Nov-14 May-15 Nov-15 May-16 Nov-16
Unit labour costs in industryannual growth rate in %
Wages nominal, gross Productivity*
Unit labour costs
15
16
17
18
19
20
-1.5
-1.0
-0.5
0.0
0.5
1.0
1.5
2.0
2.5
Nov-14 May-15 Nov-15 May-16 Nov-16
%annual growth
Inflation and unemploymentin %
Left scale:Consumer pricesProducer prices in industryRight scale:Unemployment rate (LFS)
0
2
4
6
8
10
12
14
16
-18
-16
-14
-12
-10
-8
-6
-4
-2
0
Nov-14 May-15 Nov-15 May-16 Nov-16
Fiscal and monetary policyin %
Left scale:General gov. budget balance, cumulated, in % of GDPRight scale:M2, annual growth rateLending rate (com. banks)Lending rate (com. banks), real, defl. with annual PPI
-30
-20
-10
0
10
20
30
40
Nov-14 May-15 Nov-15 May-16 Nov-16
External sector developmentannual growth rate in %
Exports total, 3-month moving average (EUR based)Imports total, 3-month moving average (EUR based)Real exchange rate EUR/EUR, PPI deflated
-0.5
-0.4
-0.3
-0.2
-0.1
0.0
0.1
0.2
0.3
0.4
0.0
0.5
1.0
1.5
2.0
2.5
Nov-14 May-15 Nov-15 May-16 Nov-16
External finance EUR bn
Left scale:Gross reserves of NB excl. goldGross external debt (public)Right scale:Current account
0
10
20
30
40
50
60
-20
-15
-10
-5
0
5
10
15
20
25
Nov-14 May-15 Nov-15 May-16 Nov-16
Real sector developmentannual growth rate in %
Left scale:Industry, 3-month moving average Employed persons (LFS)Right scale:Construction
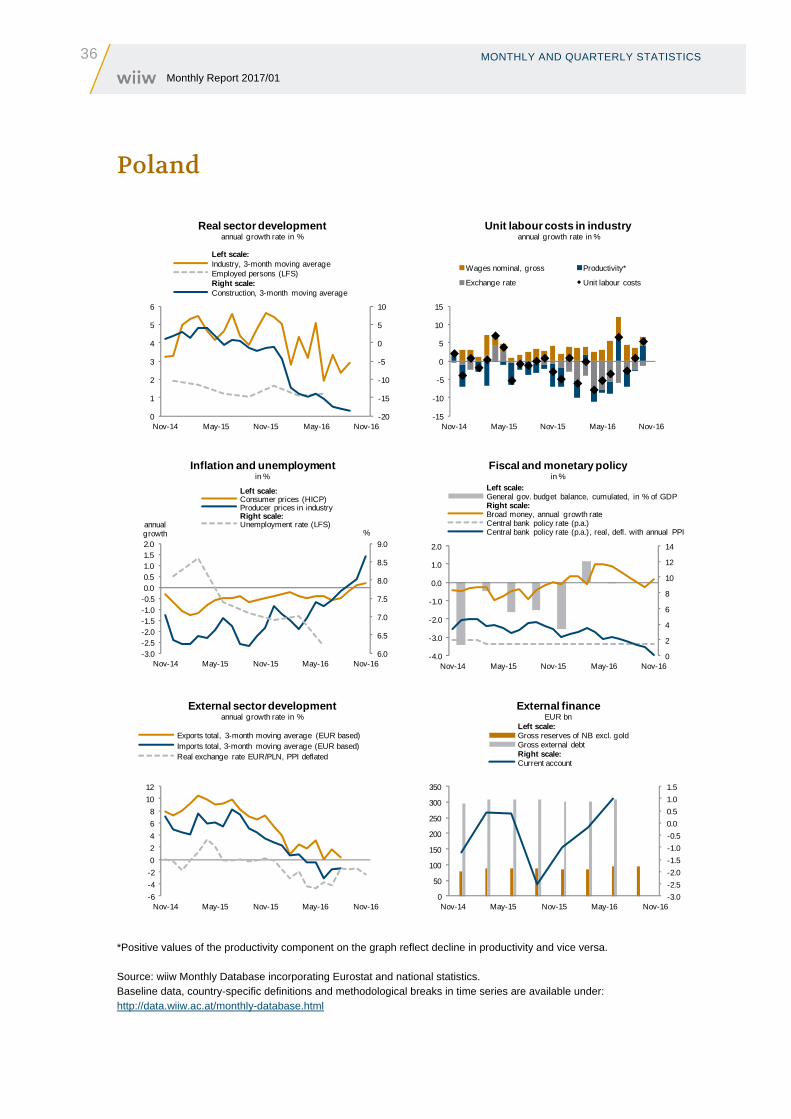
36 MONTHLY AND QUARTERLY STATISTICS Monthly Report 2017/01
Poland
*Positive values of the productivity component on the graph reflect decline in productivity and vice versa. Source: wiiw Monthly Database incorporating Eurostat and national statistics. Baseline data, country-specific definitions and methodological breaks in time series are available under: http://data.wiiw.ac.at/monthly-database.html
-20
-15
-10
-5
0
5
10
0
1
2
3
4
5
6
Nov-14 May-15 Nov-15 May-16 Nov-16
Real sector developmentannual growth rate in %
Left scale:Industry, 3-month moving average Employed persons (LFS)Right scale:Construction, 3-month moving average
-15
-10
-5
0
5
10
15
Nov-14 May-15 Nov-15 May-16 Nov-16
Unit labour costs in industryannual growth rate in %
Wages nominal, gross Productivity*
Exchange rate Unit labour costs
6.0
6.5
7.0
7.5
8.0
8.5
9.0
-3.0-2.5-2.0-1.5-1.0-0.50.00.51.01.52.0
Nov-14 May-15 Nov-15 May-16 Nov-16
%annual growth
Inflation and unemploymentin %
Left scale:Consumer prices (HICP)Producer prices in industryRight scale:Unemployment rate (LFS)
0
2
4
6
8
10
12
14
-4.0
-3.0
-2.0
-1.0
0.0
1.0
2.0
Nov-14 May-15 Nov-15 May-16 Nov-16
Fiscal and monetary policy in %
Left scale:General gov. budget balance, cumulated, in % of GDPRight scale:Broad money, annual growth rateCentral bank policy rate (p.a.)Central bank policy rate (p.a.), real, defl. with annual PPI
-6
-4
-2
0
2
4
6
8
10
12
Nov-14 May-15 Nov-15 May-16 Nov-16
External sector developmentannual growth rate in %
Exports total, 3-month moving average (EUR based)Imports total, 3-month moving average (EUR based)Real exchange rate EUR/PLN, PPI deflated
-3.0
-2.5
-2.0
-1.5
-1.0
-0.5
0.0
0.5
1.0
1.5
0
50
100
150
200
250
300
350
Nov-14 May-15 Nov-15 May-16 Nov-16
External finance EUR bn
Left scale:Gross reserves of NB excl. goldGross external debtRight scale:Current account
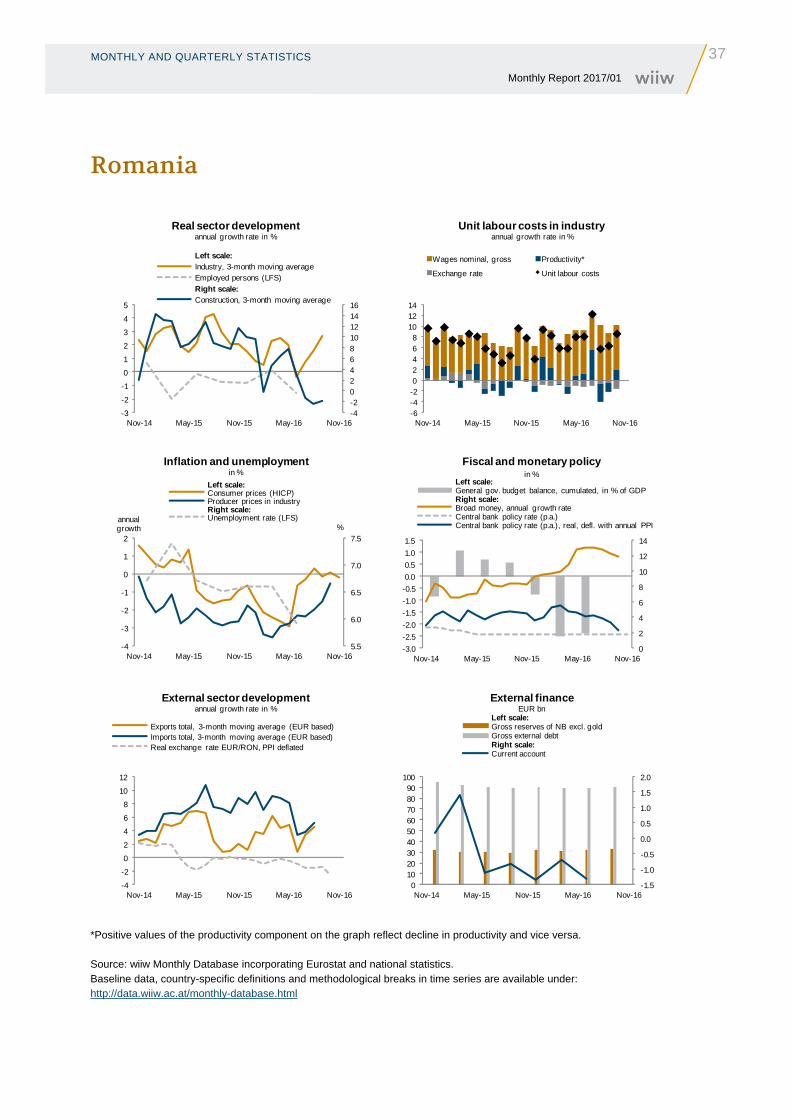
MONTHLY AND QUARTERLY STATISTICS
37 Monthly Report 2017/01
Romania
*Positive values of the productivity component on the graph reflect decline in productivity and vice versa. Source: wiiw Monthly Database incorporating Eurostat and national statistics. Baseline data, country-specific definitions and methodological breaks in time series are available under: http://data.wiiw.ac.at/monthly-database.html
-4-20246810121416
-3
-2
-1
0
1
2
3
4
5
Nov-14 May-15 Nov-15 May-16 Nov-16
Real sector developmentannual growth rate in %
Left scale:Industry, 3-month moving average Employed persons (LFS)Right scale:Construction, 3-month moving average
-6-4-202468
101214
Nov-14 May-15 Nov-15 May-16 Nov-16
Unit labour costs in industryannual growth rate in %
Wages nominal, gross Productivity*
Exchange rate Unit labour costs
5.5
6.0
6.5
7.0
7.5
-4
-3
-2
-1
0
1
2
Nov-14 May-15 Nov-15 May-16 Nov-16
%annual growth
Inflation and unemploymentin %
Left scale:Consumer prices (HICP)Producer prices in industryRight scale:Unemployment rate (LFS)
0
2
4
6
8
10
12
14
-3.0
-2.5
-2.0
-1.5
-1.0
-0.5
0.0
0.5
1.0
1.5
Nov-14 May-15 Nov-15 May-16 Nov-16
Fiscal and monetary policy in %
Left scale:General gov. budget balance, cumulated, in % of GDPRight scale:Broad money, annual growth rateCentral bank policy rate (p.a.)Central bank policy rate (p.a.), real, defl. with annual PPI
-4
-2
0
2
4
6
8
10
12
Nov-14 May-15 Nov-15 May-16 Nov-16
External sector developmentannual growth rate in %
Exports total, 3-month moving average (EUR based)Imports total, 3-month moving average (EUR based)Real exchange rate EUR/RON, PPI deflated
-1.5
-1.0
-0.5
0.0
0.5
1.0
1.5
2.0
0102030405060708090
100
Nov-14 May-15 Nov-15 May-16 Nov-16
External finance EUR bn
Left scale:Gross reserves of NB excl. goldGross external debtRight scale:Current account
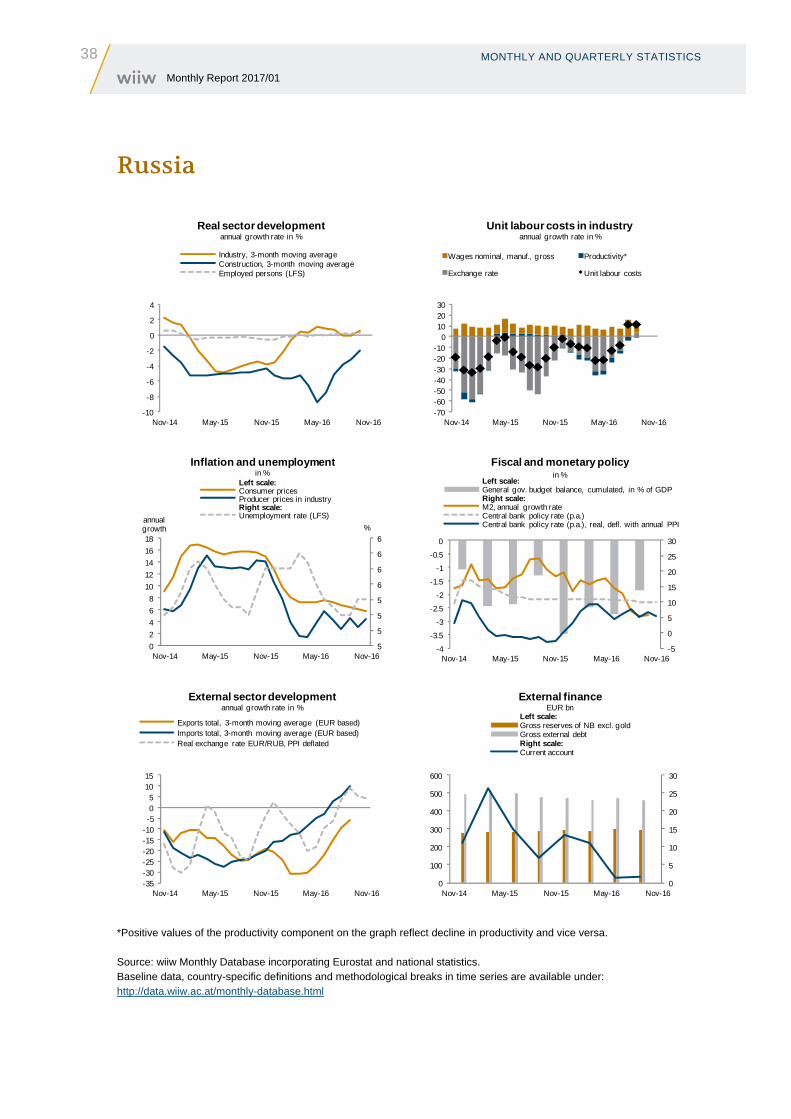
38 MONTHLY AND QUARTERLY STATISTICS Monthly Report 2017/01
Russia
*Positive values of the productivity component on the graph reflect decline in productivity and vice versa. Source: wiiw Monthly Database incorporating Eurostat and national statistics. Baseline data, country-specific definitions and methodological breaks in time series are available under: http://data.wiiw.ac.at/monthly-database.html
-10
-8
-6
-4
-2
0
2
4
Nov-14 May-15 Nov-15 May-16 Nov-16
Real sector developmentannual growth rate in %
Industry, 3-month moving average Construction, 3-month moving average Employed persons (LFS)
5
5
5
5
6
6
6
6
0
2
4
6
8
10
12
14
16
18
Nov-14 May-15 Nov-15 May-16 Nov-16
%annual growth
Inflation and unemploymentin %
Left scale:Consumer pricesProducer prices in industryRight scale:Unemployment rate (LFS)
-5
0
5
10
15
20
25
30
-4
-3.5
-3
-2.5
-2
-1.5
-1
-0.5
0
Nov-14 May-15 Nov-15 May-16 Nov-16
Fiscal and monetary policyin %
Left scale:General gov. budget balance, cumulated, in % of GDPRight scale:M2, annual growth rateCentral bank policy rate (p.a.)Central bank policy rate (p.a.), real, defl. with annual PPI
-35-30-25-20-15-10-505
1015
Nov-14 May-15 Nov-15 May-16 Nov-16
External sector developmentannual growth rate in %
Exports total, 3-month moving average (EUR based)Imports total, 3-month moving average (EUR based)Real exchange rate EUR/RUB, PPI deflated
0
5
10
15
20
25
30
0
100
200
300
400
500
600
Nov-14 May-15 Nov-15 May-16 Nov-16
External finance EUR bn
Left scale:Gross reserves of NB excl. goldGross external debtRight scale:Current account
-70-60-50-40-30-20-10
0102030
Nov-14 May-15 Nov-15 May-16 Nov-16
Unit labour costs in industryannual growth rate in %
Wages nominal, manuf., gross Productivity*
Exchange rate Unit labour costs
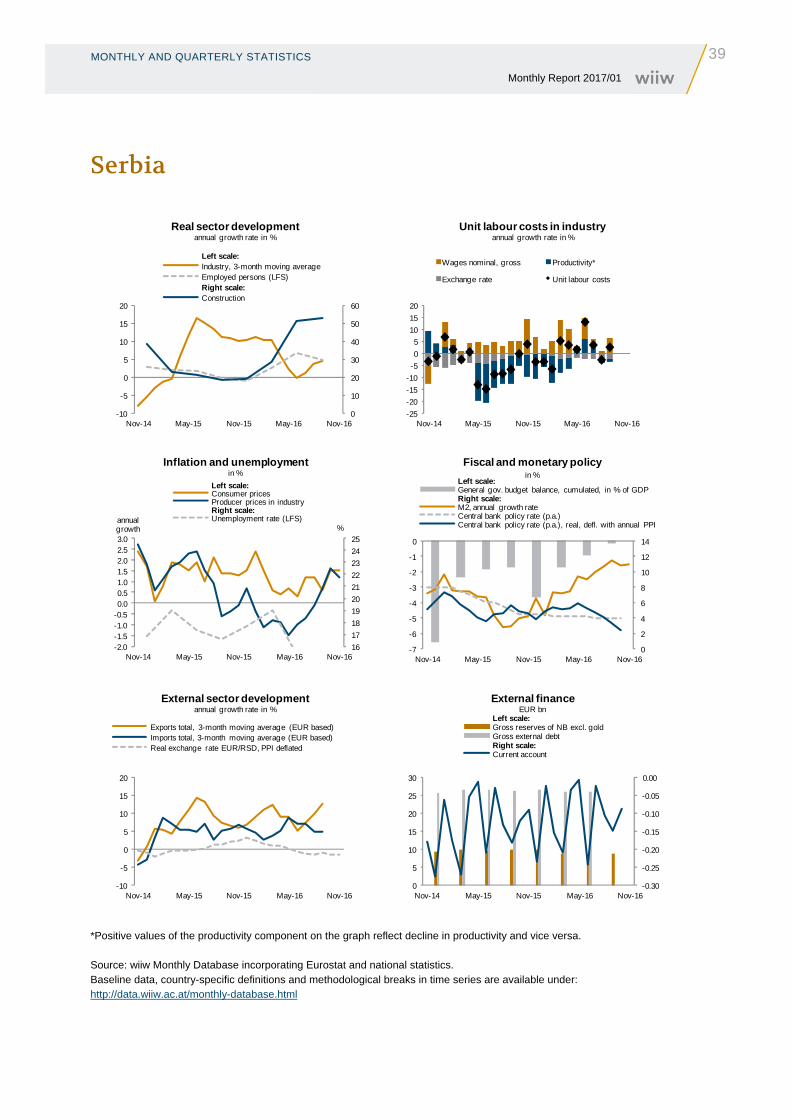
MONTHLY AND QUARTERLY STATISTICS
39 Monthly Report 2017/01
Serbia
*Positive values of the productivity component on the graph reflect decline in productivity and vice versa. Source: wiiw Monthly Database incorporating Eurostat and national statistics. Baseline data, country-specific definitions and methodological breaks in time series are available under: http://data.wiiw.ac.at/monthly-database.html
-25
-20
-15
-10
-5
0
5
10
15
20
Nov-14 May-15 Nov-15 May-16 Nov-16
Unit labour costs in industryannual growth rate in %
Wages nominal, gross Productivity*
Exchange rate Unit labour costs
16
17
18
19
20
21
22
23
24
25
-2.0-1.5-1.0-0.50.00.51.01.52.02.53.0
Nov-14 May-15 Nov-15 May-16 Nov-16
%annual growth
Inflation and unemploymentin %
Left scale:Consumer pricesProducer prices in industryRight scale:Unemployment rate (LFS)
0
2
4
6
8
10
12
14
-7
-6
-5
-4
-3
-2
-1
0
Nov-14 May-15 Nov-15 May-16 Nov-16
Fiscal and monetary policyin %
Left scale:General gov. budget balance, cumulated, in % of GDPRight scale:M2, annual growth rateCentral bank policy rate (p.a.)Central bank policy rate (p.a.), real, defl. with annual PPI
-10
-5
0
5
10
15
20
Nov-14 May-15 Nov-15 May-16 Nov-16
External sector developmentannual growth rate in %
Exports total, 3-month moving average (EUR based)Imports total, 3-month moving average (EUR based)Real exchange rate EUR/RSD, PPI deflated
-0.30
-0.25
-0.20
-0.15
-0.10
-0.05
0.00
0
5
10
15
20
25
30
Nov-14 May-15 Nov-15 May-16 Nov-16
External finance EUR bn
Left scale:Gross reserves of NB excl. goldGross external debtRight scale:Current account
0
10
20
30
40
50
60
-10
-5
0
5
10
15
20
Nov-14 May-15 Nov-15 May-16 Nov-16
Real sector developmentannual growth rate in %
Left scale:Industry, 3-month moving average Employed persons (LFS)Right scale:Construction
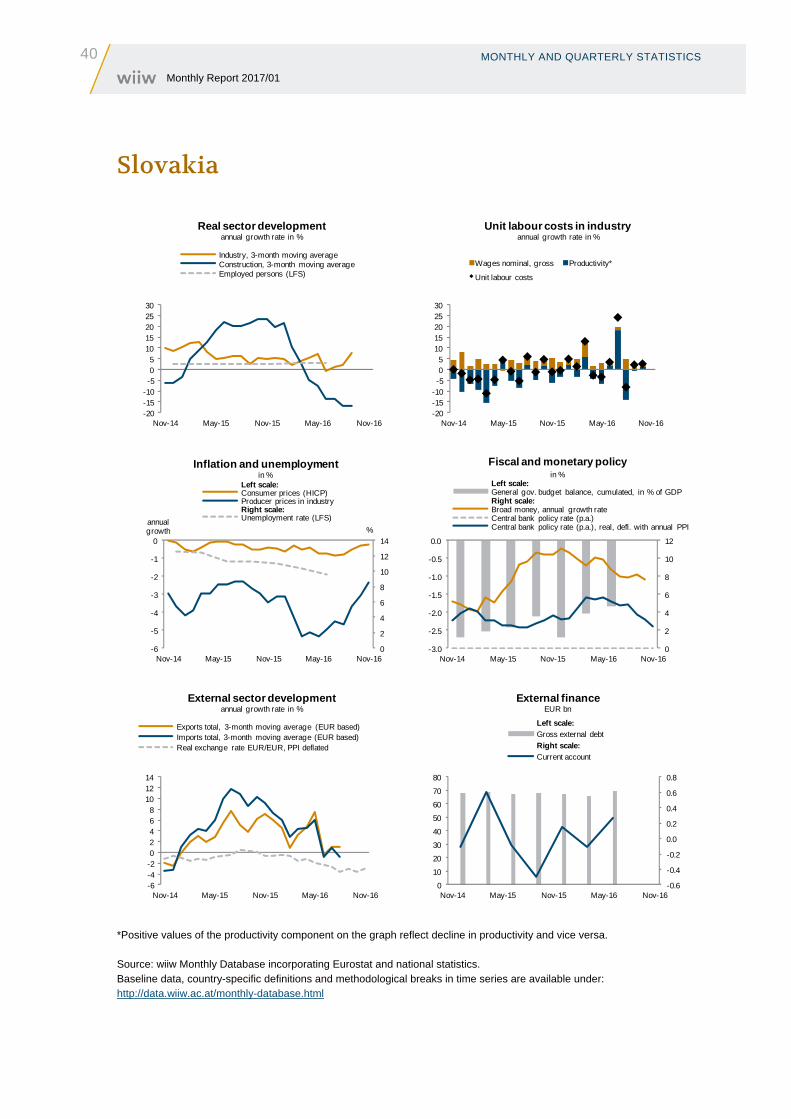
40 MONTHLY AND QUARTERLY STATISTICS Monthly Report 2017/01
Slovakia
*Positive values of the productivity component on the graph reflect decline in productivity and vice versa. Source: wiiw Monthly Database incorporating Eurostat and national statistics. Baseline data, country-specific definitions and methodological breaks in time series are available under: http://data.wiiw.ac.at/monthly-database.html
-20-15-10-505
1015202530
Nov-14 May-15 Nov-15 May-16 Nov-16
Real sector developmentannual growth rate in %
Industry, 3-month moving average Construction, 3-month moving average Employed persons (LFS)
-20-15-10-505
1015202530
Nov-14 May-15 Nov-15 May-16 Nov-16
Unit labour costs in industryannual growth rate in %
Wages nominal, gross Productivity*
Unit labour costs
0
2
4
6
8
10
12
14
-6
-5
-4
-3
-2
-1
0
Nov-14 May-15 Nov-15 May-16 Nov-16
%annual growth
Inflation and unemploymentin %
Left scale:Consumer prices (HICP)Producer prices in industryRight scale:Unemployment rate (LFS)
0
2
4
6
8
10
12
-3.0
-2.5
-2.0
-1.5
-1.0
-0.5
0.0
Nov-14 May-15 Nov-15 May-16 Nov-16
Fiscal and monetary policyin %
Left scale:General gov. budget balance, cumulated, in % of GDPRight scale:Broad money, annual growth rateCentral bank policy rate (p.a.)Central bank policy rate (p.a.), real, defl. with annual PPI
-6-4-202468
101214
Nov-14 May-15 Nov-15 May-16 Nov-16
External sector developmentannual growth rate in %
Exports total, 3-month moving average (EUR based)Imports total, 3-month moving average (EUR based)Real exchange rate EUR/EUR, PPI deflated
-0.6
-0.4
-0.2
0.0
0.2
0.4
0.6
0.8
0
10
20
30
40
50
60
70
80
Nov-14 May-15 Nov-15 May-16 Nov-16
External finance EUR bn
Left scale:
Gross external debt
Right scale:
Current account
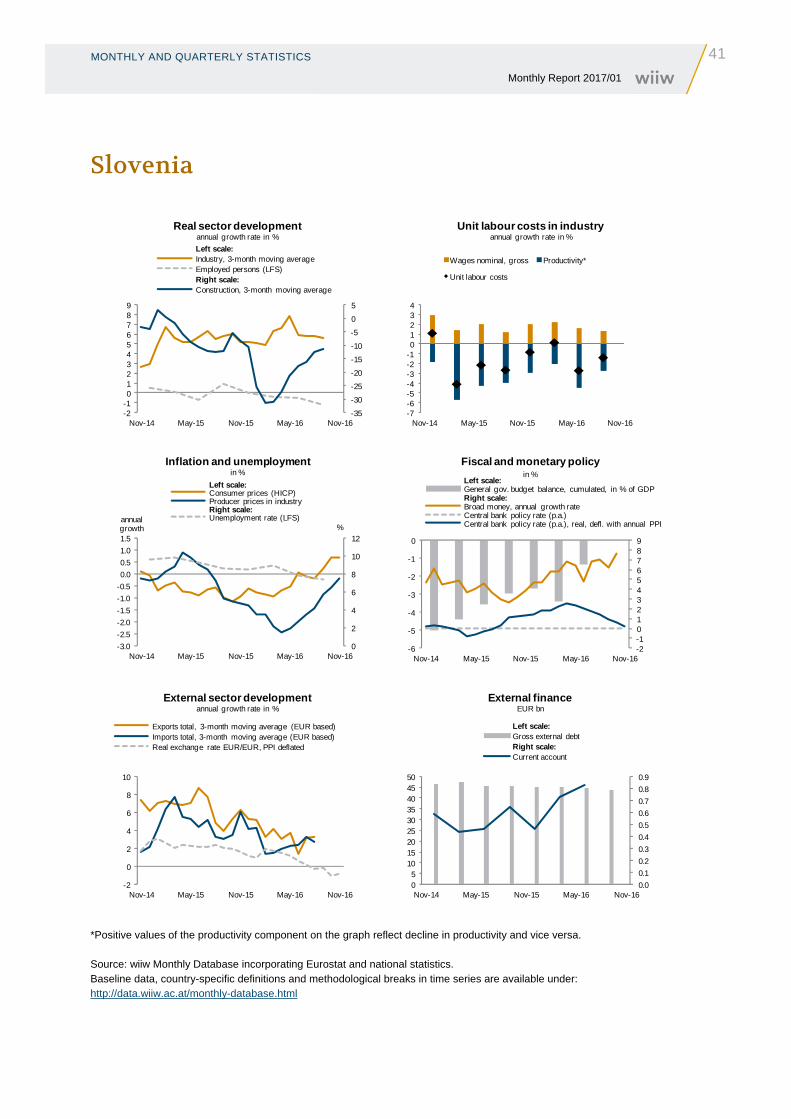
MONTHLY AND QUARTERLY STATISTICS
41 Monthly Report 2017/01
Slovenia
*Positive values of the productivity component on the graph reflect decline in productivity and vice versa. Source: wiiw Monthly Database incorporating Eurostat and national statistics. Baseline data, country-specific definitions and methodological breaks in time series are available under: http://data.wiiw.ac.at/monthly-database.html
-35
-30
-25
-20
-15
-10
-5
0
5
-2-10123456789
Nov-14 May-15 Nov-15 May-16 Nov-16
Real sector developmentannual growth rate in %
Left scale:Industry, 3-month moving average Employed persons (LFS)Right scale:Construction, 3-month moving average
-7-6-5-4-3-2-101234
Nov-14 May-15 Nov-15 May-16 Nov-16
Unit labour costs in industryannual growth rate in %
Wages nominal, gross Productivity*
Unit labour costs
0
2
4
6
8
10
12
-3.0
-2.5
-2.0
-1.5
-1.0
-0.5
0.0
0.5
1.0
1.5
Nov-14 May-15 Nov-15 May-16 Nov-16
%annual growth
Inflation and unemploymentin %
Left scale:Consumer prices (HICP)Producer prices in industryRight scale:Unemployment rate (LFS)
-2-10123456789
-6
-5
-4
-3
-2
-1
0
Nov-14 May-15 Nov-15 May-16 Nov-16
Fiscal and monetary policyin %
Left scale:General gov. budget balance, cumulated, in % of GDPRight scale:Broad money, annual growth rateCentral bank policy rate (p.a.)Central bank policy rate (p.a.), real, defl. with annual PPI
-2
0
2
4
6
8
10
Nov-14 May-15 Nov-15 May-16 Nov-16
External sector developmentannual growth rate in %
Exports total, 3-month moving average (EUR based)Imports total, 3-month moving average (EUR based)Real exchange rate EUR/EUR, PPI deflated
0.0
0.1
0.2
0.3
0.4
0.5
0.6
0.7
0.8
0.9
05
101520253035404550
Nov-14 May-15 Nov-15 May-16 Nov-16
External finance EUR bn
Left scale:Gross external debtRight scale:Current account
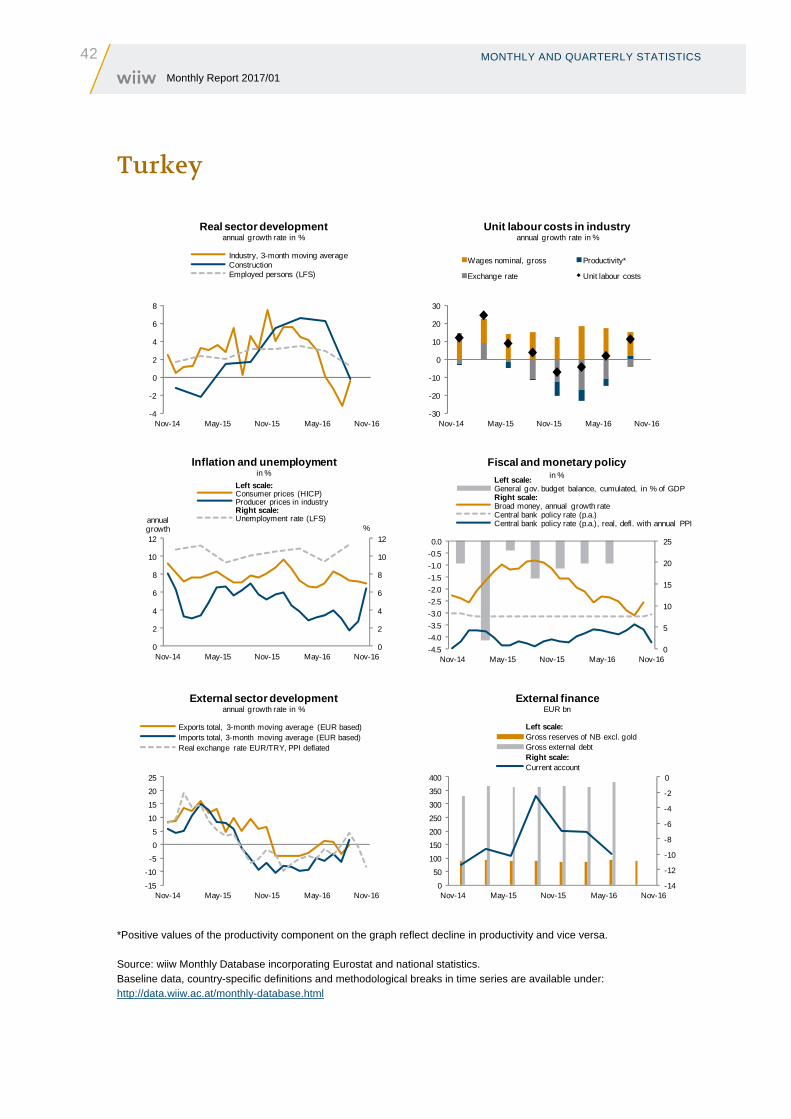
42 MONTHLY AND QUARTERLY STATISTICS Monthly Report 2017/01
Turkey
*Positive values of the productivity component on the graph reflect decline in productivity and vice versa. Source: wiiw Monthly Database incorporating Eurostat and national statistics. Baseline data, country-specific definitions and methodological breaks in time series are available under: http://data.wiiw.ac.at/monthly-database.html
0
5
10
15
20
25
-4.5
-4.0
-3.5
-3.0
-2.5
-2.0
-1.5
-1.0
-0.5
0.0
Nov-14 May-15 Nov-15 May-16 Nov-16
Fiscal and monetary policy in %
Left scale:General gov. budget balance, cumulated, in % of GDPRight scale:Broad money, annual growth rateCentral bank policy rate (p.a.)Central bank policy rate (p.a.), real, defl. with annual PPI
-4
-2
0
2
4
6
8
Nov-14 May-15 Nov-15 May-16 Nov-16
Real sector developmentannual growth rate in %
Industry, 3-month moving average ConstructionEmployed persons (LFS)
-30
-20
-10
0
10
20
30
Nov-14 May-15 Nov-15 May-16 Nov-16
Unit labour costs in industryannual growth rate in %
Wages nominal, gross Productivity*
Exchange rate Unit labour costs
0
2
4
6
8
10
12
0
2
4
6
8
10
12
Nov-14 May-15 Nov-15 May-16 Nov-16
%annual growth
Inflation and unemploymentin %
Left scale:Consumer prices (HICP)Producer prices in industryRight scale:Unemployment rate (LFS)
-15
-10
-5
0
5
10
15
20
25
Nov-14 May-15 Nov-15 May-16 Nov-16
External sector developmentannual growth rate in %
Exports total, 3-month moving average (EUR based)Imports total, 3-month moving average (EUR based)Real exchange rate EUR/TRY, PPI deflated
-14
-12
-10
-8
-6
-4
-2
0
0
50
100
150
200
250
300
350
400
Nov-14 May-15 Nov-15 May-16 Nov-16
External finance EUR bn
Left scale:Gross reserves of NB excl. goldGross external debtRight scale:Current account
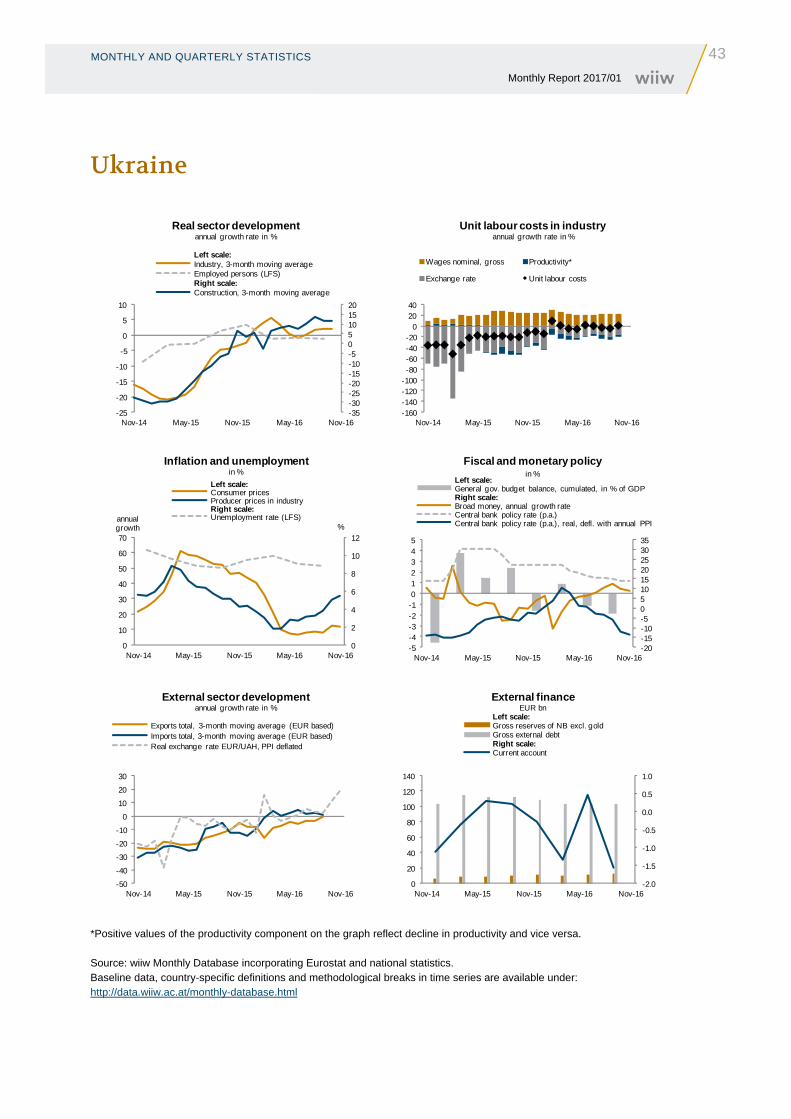
MONTHLY AND QUARTERLY STATISTICS
43 Monthly Report 2017/01
Ukraine
*Positive values of the productivity component on the graph reflect decline in productivity and vice versa. Source: wiiw Monthly Database incorporating Eurostat and national statistics. Baseline data, country-specific definitions and methodological breaks in time series are available under: http://data.wiiw.ac.at/monthly-database.html
-35-30-25-20-15-10-505101520
-25
-20
-15
-10
-5
0
5
10
Nov-14 May-15 Nov-15 May-16 Nov-16
Real sector developmentannual growth rate in %
Left scale:Industry, 3-month moving average Employed persons (LFS)Right scale:Construction, 3-month moving average
-160-140-120-100-80-60-40-20
02040
Nov-14 May-15 Nov-15 May-16 Nov-16
Unit labour costs in industryannual growth rate in %
Wages nominal, gross Productivity*
Exchange rate Unit labour costs
0
2
4
6
8
10
12
0
10
20
30
40
50
60
70
Nov-14 May-15 Nov-15 May-16 Nov-16
%annual growth
Inflation and unemploymentin %
Left scale:Consumer pricesProducer prices in industryRight scale:Unemployment rate (LFS)
-20-15-10-505101520253035
-5-4-3-2-1012345
Nov-14 May-15 Nov-15 May-16 Nov-16
Fiscal and monetary policyin %
Left scale:General gov. budget balance, cumulated, in % of GDPRight scale:Broad money, annual growth rateCentral bank policy rate (p.a.)Central bank policy rate (p.a.), real, defl. with annual PPI
-50
-40
-30
-20
-10
0
10
20
30
Nov-14 May-15 Nov-15 May-16 Nov-16
External sector developmentannual growth rate in %
Exports total, 3-month moving average (EUR based)Imports total, 3-month moving average (EUR based)Real exchange rate EUR/UAH, PPI deflated
-2.0
-1.5
-1.0
-0.5
0.0
0.5
1.0
0
20
40
60
80
100
120
140
Nov-14 May-15 Nov-15 May-16 Nov-16
External finance EUR bn
Left scale:Gross reserves of NB excl. goldGross external debtRight scale:Current account

44 MONTHLY AND QUARTERLY STATISTICS Monthly Report 2017/01
INDEX OF SUBJECTS
45 Monthly Report 2017/01
Index of subjects – January 2016 to January 2017
Albania economic situation ........................................................................ 2016/7-8 Austria car parts industry .............................................................................. 2016/9 FDI in CESEE ................................................................................... 2016/9 position in the EU Strategy for the Danube Region ......................... 2016/9 Belarus economic situation ........................................................................ 2016/7-8 Bosnia and Herzegovina economic situation ........................................................................ 2016/7-8 Bulgaria economic situation ........................................................................ 2016/7-8 car industry ....................................................................................... 2017/1 ten years of EU membership ............................................................ 2017/1 presidential elections ...................................................................... 2016/12 China Silk Road initiative .......................................................................... 2016/10 Croatia economic situation ........................................................................ 2016/7-8 labour market .................................................................................... 2016/4 Czech Republic economic situation ........................................................................ 2016/7-8 Estonia economic situation ........................................................................ 2016/7-8 Hungary economic situation ........................................................................ 2016/7-8 outmigration of medical doctors ....................................................... 2016/4 Iran Silk Road initiative .......................................................................... 2016/10 Kazakhstan economic situation ........................................................................ 2016/7-8 Kosovo economic situation ........................................................................ 2016/7-8 Latvia economic situation ........................................................................ 2016/7-8 Lithuania economic situation ........................................................................ 2016/7-8 Macedonia economic situation ........................................................................ 2016/7-8 Montenegro economic situation ........................................................................ 2016/7-8 Poland economic situation ........................................................................ 2016/7-8 euro introduction ............................................................................... 2017/1 Romania economic situation ........................................................................ 2016/7-8 car industry ....................................................................................... 2017/1 ten years of EU membership ............................................................ 2017/1 Russia economic situation ........................................................................ 2016/7-8 economic policy .............................................................................. 2016/12 Silk Road initiative .......................................................................... 2016/10 Serbia economic situation ........................................................................ 2016/7-8 Slovakia economic situation ........................................................................ 2016/7-8 credit growth ..................................................................................... 2016/5 elections ............................................................................................ 2016/3 Slovenia economic situation ........................................................................ 2016/7-8 Turkey economic conundrum ................................................................... 2016/7-8 Ukraine economic situation ........................................................................ 2016/7-8 multi-country articles 25 years of transition ........................................................................ 2016/1 and statistical overviews financing constraints, firm growth, M&E investment, innovation ..... 2016/2 health and migration ........................................................................ 2016/3 history and economic development (Habsburg example) ............. 2016/11 immigrants’ labour market integration, access to education ............ 2016/4 inflation and unit labour costs ......................................................... 2016/12 intra-EU mobility ............................................................................... 2016/3 non-tariff measures ........................................................................... 2016/6 price sensitivity and the effects of trade policy instruments ........... 2016/12 public social expenditures in EU Member States........................... 2016/11 refugees and labour market integration ........................................... 2016/3 services sector competitiveness Western Balkans .......................... 2016/5 services trade Central Asia ............................................................... 2016/5 Silk Road ......................................................................................... 2016/10 sustainable development in CESEE .............................................. 2016/11 US elections and their implications ................................................ 2016/11

The wiiw Monthly Report summarises wiiw's major research topics and provides current statistics and
analyses exclusively to subscribers to the wiiw Service Package. This information is for the subscribers'
internal use only and may not be quoted except with the respective author's permission and express
authorisation. Unless otherwise indicated, all authors are members of the Vienna Institute's research
staff or research associates of wiiw.
Economics editors: Vasily Astrov, Sándor Richter
IMPRESSUM
Herausgeber, Verleger, Eigentümer und Hersteller:
Verein „Wiener Institut für Internationale Wirtschaftsvergleiche“ (wiiw),
Wien 6, Rahlgasse 3
ZVR-Zahl: 329995655
Postanschrift: A 1060 Wien, Rahlgasse 3, Tel: [+431] 533 66 10, Telefax: [+431] 533 66 10 50
Internet Homepage: www.wiiw.ac.at
Nachdruck nur auszugsweise und mit genauer Quellenangabe gestattet.
Offenlegung nach § 25 Mediengesetz: Medieninhaber (Verleger): Verein "Wiener Institut für
Internationale Wirtschaftsvergleiche", A 1060 Wien, Rahlgasse 3. Vereinszweck: Analyse der
wirtschaftlichen Entwicklung der zentral- und osteuropäischen Länder sowie anderer
Transformationswirtschaften sowohl mittels empirischer als auch theoretischer Studien und ihre
Veröffentlichung; Erbringung von Beratungsleistungen für Regierungs- und Verwaltungsstellen,
Firmen und Institutionen.

wiiw.ac.at