Embed Size (px)
Citation preview

Working Papers|049| June 2004
Maja Micevska
Unemployment and Labour Market Rigidities in Southeast Europe
The wiiw Balkan Observatory
www.balkan-observatory.net
About Shortly after the end of the Kosovo war, the last of the Yugoslav dissolution wars, theBalkan Reconstruction Observatory was set up jointly by the Hellenic Observatory, theCentre for the Study of Global Governance, both institutes at the London School ofEconomics (LSE), and the Vienna Institute for International Economic Studies (wiiw).A brainstorming meeting on Reconstruction and Regional Co-operation in the Balkanswas held in Vouliagmeni on 8-10 July 1999, covering the issues of security,democratisation, economic reconstruction and the role of civil society. It was attendedby academics and policy makers from all the countries in the region, from a number ofEU countries, from the European Commission, the USA and Russia. Based on ideas anddiscussions generated at this meeting, a policy paper on Balkan Reconstruction andEuropean Integration was the product of a collaborative effort by the two LSE institutesand the wiiw. The paper was presented at a follow-up meeting on Reconstruction andIntegration in Southeast Europe in Vienna on 12-13 November 1999, which focused onthe economic aspects of the process of reconstruction in the Balkans. It is this policypaper that became the very first Working Paper of the wiiw Balkan ObservatoryWorking Papers series. The Working Papers are published online at www.balkan-observatory.net, the internet portal of the wiiw Balkan Observatory. It is a portal forresearch and communication in relation to economic developments in Southeast Europemaintained by the wiiw since 1999. Since 2000 it also serves as a forum for the GlobalDevelopment Network Southeast Europe (GDN-SEE) project, which is based on aninitiative by The World Bank with financial support from the Austrian Ministry ofFinance and the Oesterreichische Nationalbank. The purpose of the GDN-SEE projectis the creation of research networks throughout Southeast Europe in order to enhancethe economic research capacity in Southeast Europe, to build new research capacities bymobilising young researchers, to promote knowledge transfer into the region, tofacilitate networking between researchers within the region, and to assist in securingknowledge transfer from researchers to policy makers. The wiiw Balkan ObservatoryWorking Papers series is one way to achieve these objectives.
The wiiw Balkan Observatory

Global Development Network Southeast Europe
This study has been developed in the framework of research networks initiated and monitored by wiiwunder the premises of the GDN–SEE partnership. The Global Development Network, initiated by The World Bank, is a global network ofresearch and policy institutes working together to address the problems of national andregional development. It promotes the generation of local knowledge in developing andtransition countries and aims at building research capacities in the different regions. The Vienna Institute for International Economic Studies is a GDN Partner Institute andacts as a hub for Southeast Europe. The GDN–wiiw partnership aims to support theenhancement of economic research capacity in Southeast Europe, to promoteknowledge transfer to SEE, to facilitate networking among researchers within SEE andto assist in securing knowledge transfer from researchers to policy makers. The GDN–SEE programme is financed by the Global Development Network, theAustrian Ministry of Finance and the Jubiläumsfonds der OesterreichischenNationalbank. For additional information see www.balkan-observatory.net, www.wiiw.ac.at andwww.gdnet.org
The wiiw Balkan Observatory

UNEMPLOYMENT AND LABOR MARKET RIGIDITIES IN SOUTHEAST EUROPE
Maja Micevska* University of Bonn
Abstract This paper presents new data that describe employment protection legislation (EPL) and other labor market institutions and policies preva iling in seven Southeast European (SEE) countries in the late 1990s and the early 2000s. The main contribution has been the construction of EPL indices for the SEE countries. The paper finds that, despite significant liberalization efforts, the SEE countries still stand out for having relatively strict EPL. However, this rigidity mainly stems from their strict legislation on temporary employment and collective dismissals, while the SEE legislation on regular employment is quite flexible. Preliminary empirical results indicate that stricter temporary employment legislation is associated with higher unemployment for women and youths as well as with lower employment and labor force participation rates.
* Center for Development Research, University of Bonn, Walter-Flex-Str. 3, 53113 Bonn, Germany. Email: [email protected]. I am grateful to Vladimir Gligorov, Edward Christie and other participants at the Vienna Institute for International Economic Studies (WIIW) Workshop on Enterprise Development, the Informal Economy and Labour Markets in Southeast Europe for helpful comments.

1
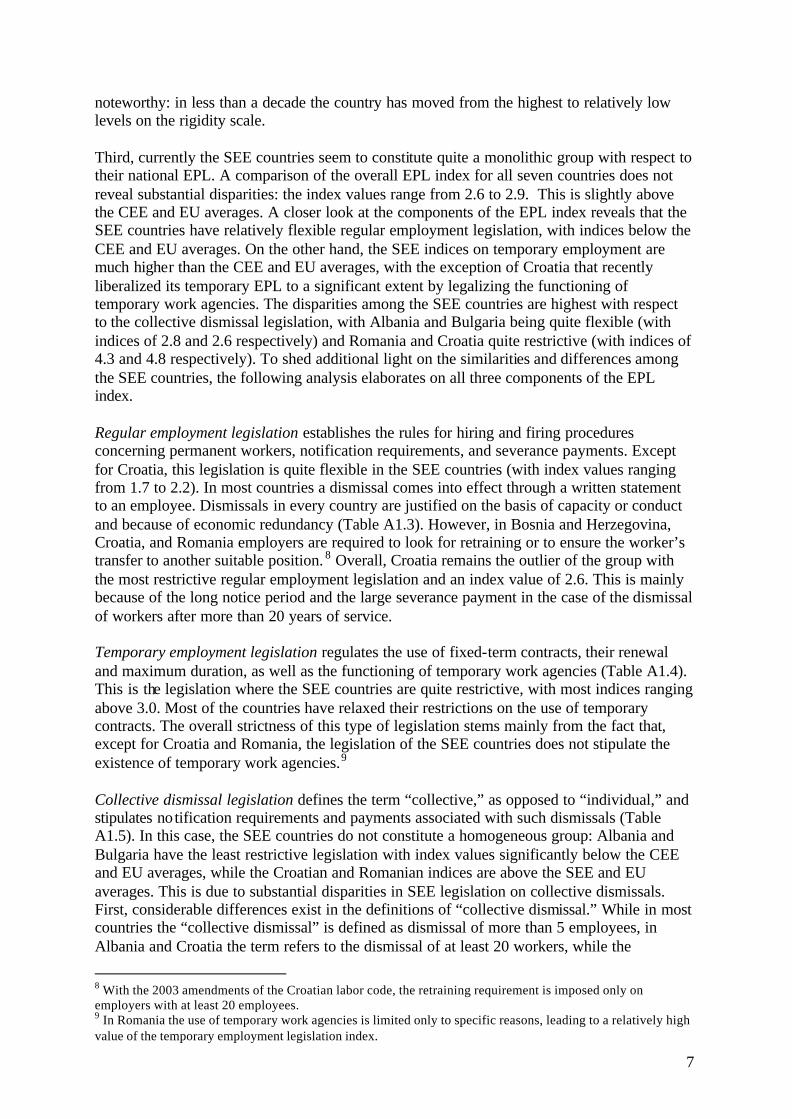
1. Introduction The past decade has been a time of dramatic transformation in Southeast Europe. The transformation from command to market economy produced remarkable changes in the social, political and economic infrastructure of Southeast European (SEE) countries. From an economic point of view, these changes were most important in real output and factor markets, particularly in labor allocations. As the old socialist economic model was breaking apart, real output collapsed in every formerly communist country, albeit with different intensity. While in the Central European countries the output has recovered after the initial decline and by 1996 reached and exceeded the 1990 level, the transition process in the SEE countries has been associated with a longer-lasting recession (Figure 1). Except for Albania, the real GDP in the SEE countries still had not reached the 1990 level by 2001.
Figure 1. Evolution of GDP in Eastern European countries, 1990-2001
0
20
40
60
80
100
120
140
1989 1991 1993 1995 1997 1999 2001
Year
GD
P in
dex
, 199
0=10
0
AlbaniaBulgaria
CroatiaMacedoniaRomaniaCEE
Note: CEE is an averaged index for the following Central European countries: Czech Republic, Hungary, Poland, Slovak Republic and Slovenia. Source: World Development Indicators, 2003. In addition to changes in the level of GDP, the restructuring process involved a significant shift in economic activity across sectors. The contribution of agriculture to the total GDP had fallen in the region (with the exception of Albania and Macedonia). A decline also occurred in the industrial sector. As a result of these changes the service sector share of GDP grew in all SEE countries (Table 1). At the same time, the worsening economic conditions have pushed many into subsistence types of agricultural activity, leading to an increasing share of employment in agriculture. The share of employment in industry declined while employment in the service sector increased (Table 2).

2
Table 1. Output per Sector in SEE countries (% of GDP)
Agriculture Industry Services 1990 2001 1990 2001 1990 2001
Albania 35.9 50.2 48.2 23.4 15.9 26.4 Bosnia and Herzegovina 35.91) 14.8 25.91) 30.6 38.31) 54.6 Bulgaria 17.0 14.0 49.2 29.0 33.8 57.1 Croatia 10.3 9.3 33.8 32.7 55.9 58.0 Macedonia 8.5 10.9 45.6 31.1 45.9 58.0 Romania 23.7 15.0 49.9 34.6 26.3 50.4 Serbia and Montenegro - 15.02) - 32.02) - 53.02 - Data not available. 1) Data for 1994. 2) Data for 2000. Source: World Development Indicators database (2003).
Table 2. Employment per Sector in SEE countries (% of total employment)
Agriculture Industry Services 1991 1999 1991 1999 1991 1999
Albania 24.1 - 44.7 - 31.2 - Bosnia and Herzegovina 11.31) 18.8 47.51) 36.2 41.21) 45.0 Bulgaria 19.5 26.6 41.1 29.1 39.3 44.3 Croatia 5.3 16.6 44.8 30.6 50.0 52.8 Macedonia 8.3 21.9 50.0 31.8 38.9 46.3 Romania 29.8 41.8 39.9 27.6 30.3 30.7
- Data not available. 1) Data for 1990. Sources: World Development Indicators database (2003), Macedonian LFS (1999), and World Bank (2002) for Bosnia and Herzegovina.
The transition had significant repercussions on labor market outcomes, in terms of both level and composition. Labor markets adjusted to the new economic environment by reducing employment and labor force participation and by increasing unemployment rates drastically. As shown in Figure 2, Romania is the only country in which the unemployment rates have increased only moderately to levels comparable to those of the Central European, EU and OECD countries. All the other SEE countries have experienced dramatic increases in unemployment rates.1 The situation has been particularly alarming in Macedonia, with an overall unemployment rate of more than 30 percent and the youth unemployment rate reaching over 60 percent. While the social and economic context considered above has certainly contributed to the rise of the unemployment rates, there are certain characteristics of the composition of unemployment in the SEE countries which indicate that labor market rigidities might have as well played a major role. First, the youth unemployment rates are particularly high in SEE (Figure 2). Past research suggests that youths tend to be the most adversely affected group by labor market rigidities, especially in a context of wage compression (e.g., Scarpetta, 1996).
1 It should be noted, however, that the countries that constituted former Yugoslavia (Bosnia and Herzegovina, Croatia, Macedonia, and Serbia and Montenegro) experienced open unemployment during the previous system. Reliable data on the extent of unemployment during socialism do not exist.

3
Second, the unemployment pool is more stagnant in the presence of labor market rigidities (e.g., Bentolila and Bertola, 1990; Nickell and Layard, 1999; Blanchard and Portugal, 2001) due to lower inflows and outflows and longer duration of unemployment spells. In most SEE countries the long-term unemployment rates have been increasing steadily. The share of long-term unemployed (unemployed for more than one year) has soared to alarming levels in Bosnia and Herzegovina (76 percent), Serbia and Montenegro (82 percent), and Macedonia (83 percent).
Figure 2. Unemployment Rates (late 1990s)
0.0
10.0
20.0
30.0
40.0
50.0
60.0
70.0
Alban
ia
Bulgari
a
Croatia
Macedo
nia
Roman
ia
Bosni
a and
Herzeg
ovina
Serbia
and M
onten
egro CEE
OECD EU
UR
UR_YUR_FUR_M
Notes: The youth unemployment rate (UR_Y) denotes % of labor force aged 15-24. UR_F denotes the female unemployment rate, while UR_M denotes the male unemployment rate. CEE is an averaged index for the following Central European countries: Czech Republic, Hungary, Poland, Slovak Republic, and Slovenia. The unemployment rates are averaged using available data over the period 1995-2000, except for the figure for Bosnia and Herzegovina which is based on the 2001 LSMS. Sources: World Development Indicators database (2003), TransMONEE database (2002) for youth unemployment in the SEE countries, and World Bank (2002) for Bosnia and Herzegovina. Third, labor market rigidities may also result in a more “sclerotic” labor market which is unable to achieve quickly the volume of workforce adjustment that is required in response to rapid changes in technologies and product market conditions. Lower job turnover (OECD, 1997) and slower entry and exit of firms (Scarpetta et al., 2002) have been emphasized as the most harmful features of rigid labor markets. Indeed, the labor markets in many SEE countries are characterized by relatively low turnover rates (World Bank, 2002; Rutkowski, 2003). The objectives of this paper are to develop measures of the flexibility of labor markets in the SEE countries and to shed some light on the ongoing debate about the role of labor market institutions in labor market performance. The approach used in this paper builds on work carried out by Nickel (1997), Nickel and Layard (1999), OECD (1999), and Blanchard and

4
Wolfers (1999), but goes further by taking into account the availability of information on and the specificity of the transition countries. The rest of the paper is structured as follows. Section 2 presents a description of labor market institutions in the SEE countries and compares them to those in CEE, EU, and OECD countries. Section 3 examines the effect of institutions on the labor market performance. Finally, Section 4 concludes with a summary of the main findings and some policy implications.
2. Labor Market Rigidities The fairly high unemployment rates that persist in numerous parts of Europe are often attributed to labor market rigidities.2 As the SEE countries aspire to enter the EU, an interesting question is whether they have introduced into their labor markets the same rigidities that exist in other European countries. I examine the labor market institutions during the late 1990s and early 2000s for seven SEE countries (Albania, Bosnia and Herzegovina, Bulgaria, Croatia, Macedonia, Romania, and Serbia and Montenegro), following the methodology used by the OECD (1999). This allows to compare the results for the SEE countries with those presented by the OECD (1999) for its member countries and with the results in Riboud et al. (2002) for six Central and Eastern European (CEE) countries (Czech Republic, Estonia, Hungary, Poland, Slovakia, and Slovenia). Measuring the degree of flexibility or rigidity of labor markets is not an easy task due to the lack of a unique quantifiable indicator that can serve as barometer. I use the employment protection legislation (EPL) index as a main indicator of the strictness of labor market policies and institutions for the following reasons. First, EPL involves many different aspects of regulation which are unlikely to affect labor markets outcomes in the same way. Second, calculating the EPL index is important for the evaluation of the relative importance of different components of employment protection for labor market performance and for informing policy choices. While more emphasize is put on EPL, other forms of labor market regulations are also considered in this paper, such as the unemployment benefit systems, wage setting institutions, active labor market policies, and taxes on labor. In addition, I try to capture the rigidity “in practice.” The use of alternative practices that may offset some of the effects of EPL has not received much attention in the literature, even though such off-setting flexibilities may be of great relevance. Early retirements may be regarded as an off-setting flexibility when the dismissal of older workers is costly; self-employment may be one way of avoiding restrictions on employment contracts or high fixed wage costs; part-time work and work-sharing may be possibilities to adjust during recessions; informal or black-economy activity may be a response to overly regulated labor markets (Saint-Paul, 1996). As a result, the regulations that are most distorting “on paper” may well be the least enforced “in practice” (Squire and Suthiwart-Narueput, 1997). In the context of the SEE countries, it has often been argued that the legal protection of employees has rarely been respected and that there is considerable room for entrepreneurs to informally hire and fire workers. It is also worth remarking that the SEE countries have relatively high rates of 2 Whether or not the poor labor market performances result from tight labor market regulations remains a hotly debated issue in Europe. Theoretical models provide guidelines on how these regulations may affect labor market outcomes, but the relationship between the two is mainly an empirical question.

5
self-employment and that the self-employed are presumably more likely to operate in the underground economy. Due to the impossibility to evaluate the degree of the enforcement of regulations and policies, I use a measure of underground economy to account for labor rigidities “in practice,” that is, for the off-setting flexibilities to excessively regulated labor markets.3
2.1. Employment Protection Legislation Employment protection legislation (EPL) refers to regulations that restrict the employers’ freedom to dismiss workers. While their objective is to “protect” the welfare of employees by reducing their exposure to unfair treatment and to the risk of fluctuating incomes, these regulations may increase the costs of employing workers (for an overview of potential benefits and costs of EPL, see OECD, 1999). I construct EPL indices for the seven SEE countries using the OECD methodology. In particular, I consider the legislation on permanent employment, temporary employment and collective dismissals. The EPL is a weighted average of 22 indicators, some readily available in quantitative form (e.g., notice period or severance payment), some constructed using qualitative information (e.g., difficulty of dismissal).4 These indicators are based on very detailed normative information, which is coded and aggregated according to a weighting scheme (Table A1.1). The EPL index takes values from 1 to 6. The higher the value of the EPL index, the stricter is the employment protection legislation. Table 3 shows the EPL indices for the SEE countries, which were calculated based on available labor codes (as amended up to a certain year) and other (mainly national) sources.5 Several conclusions can be drawn from the information presented. First, the countries that constituted former Yugoslavia (Bosnia and Herzegovina, Croatia, Macedonia, and Serbia and Montenegro) initially adopted more rigid labor codes than their neighbors in the region (Albania, Bulgaria, and Romania).6,7
3 Forteza and Rama (2001) consider the number of ILO conventions ratified by a country as a reasonable proxy for the degree of labor rigidity as stated “on paper.” On the other hand, they use minimum wages, mandated benefits, trade unions, and government employment as indicators of the labor rigidity “in practice.” In the context of the SEE economies, however, a measure of underground economy seems to be a more appropriate indicator of labor rigidities “in practice.” 4 Some indicators are constructed from qualitative information using a rather subjective conversion scale, for instance, the willingness of courts to entertain lawsuits by fired workers or the interpretation of the notion of “just cause” for dismissal (see Bertola et al., 2000). 5 For more detailed information on the evolution of EPL indices in the SEE countries, see Table A1.2 in Appendix 1. 6 This is probably a result of some built-in institutional mechanisms taken from the previous system of worker self-management (unique for former Yugoslavia) that could not be discarded easily at the beginning of economic and social reforms. 7 In Serbia and Montenegro, before the adoption of completely new labor legislation in 2001, the Yugoslav Law on Labor Relations was in force. The law provided a high degree of employment protection and did not contain the elements of modern legislation. Thus, applying the OECD methodology to calculate the EPL index based on this law would not yield comparable results.

6
Table 3: Employment Protection Legislation (late 1990s/early 2000s)
Regular Temporary Collective EPL Year employment employment dismissals index
Albania
1995 2.1 3.0 2.8 2.6
Bosnia and Herzegovina
1999
2003
2.2
1.8
4.3
3.1
3.0
3.3
3.2
2.6
Bulgaria 1996
2003
2.0
2.2
3.9
3.4
2.6
2.6
2.9
2.7
Croatia
1996
2003
2.8
2.6
3.9
1.9
5.0
4.3
3.6
2.6
Macedonia 1995
2003
2.1
2.0
4.3
3.1
4.8
4.0
3.4
2.8
Romania
2003 1.7 3.0 4.8 2.8
Serbia and Montenegro 2001
2.2 3.1 3.8 2.9
SEE average
late ‘90s1
early ‘00s2
2.2
2.1
3.9
2.9
3.6
3.7
3.1
2.7
CEE average
late 1990s 2.7 1.2 4.1 2.4
EU average3 late 1990s 2.4 2.3 3.2 2.5 OECD average4 late 1990s 2.1 2.0 2.9 2.2 1/ Does not include figures for Romania and Serbia and Montenegro, since data are not available for the late 1990s. 2/ Includes the 1995 figures for Albania. 3/ Does not include Luxembourg. 4/ Does not include Mexico, Czech Republic, Hungary, Poland, and the Slovak Republic. Sources: Own calculations based on labor codes and other (mainly) national sources for SEE countries, Riboud et al. (2002) for CEE countries, OECD (1999) for OECD and EU countries. Second, in the 1990s the need for rapid structural adjustment after the introduction of economic and social reforms was reflected in profound amendments to national labor legislation (usually after heated discussions among social partners). This led to a substantial decrease of workers’ protection and a reduction in the EPL indices to levels comparable to those prevailing in developed market economies. The Croatian example is particularly
7
noteworthy: in less than a decade the country has moved from the highest to relatively low levels on the rigidity scale. Third, currently the SEE countries seem to constitute quite a monolithic group with respect to their national EPL. A comparison of the overall EPL index for all seven countries does not reveal substantial disparities: the index values range from 2.6 to 2.9. This is slightly above the CEE and EU averages. A closer look at the components of the EPL index reveals that the SEE countries have relatively flexible regular employment legislation, with indices below the CEE and EU averages. On the other hand, the SEE indices on temporary employment are much higher than the CEE and EU averages, with the exception of Croatia that recently liberalized its temporary EPL to a significant extent by legalizing the functioning of temporary work agencies. The disparities among the SEE countries are highest with respect to the collective dismissal legislation, with Albania and Bulgaria being quite flexible (with indices of 2.8 and 2.6 respectively) and Romania and Croatia quite restrictive (with indices of 4.3 and 4.8 respectively). To shed additional light on the similarities and differences among the SEE countries, the following analysis elaborates on all three components of the EPL index. Regular employment legislation establishes the rules for hiring and firing procedures concerning permanent workers, notification requirements, and severance payments. Except for Croatia, this legislation is quite flexible in the SEE countries (with index values ranging from 1.7 to 2.2). In most countries a dismissal comes into effect through a written statement to an employee. Dismissals in every country are justified on the basis of capacity or conduct and because of economic redundancy (Table A1.3). However, in Bosnia and Herzegovina, Croatia, and Romania employers are required to look for retraining or to ensure the worker’s transfer to another suitable position. 8 Overall, Croatia remains the outlier of the group with the most restrictive regular employment legislation and an index value of 2.6. This is mainly because of the long notice period and the large severance payment in the case of the dismissal of workers after more than 20 years of service. Temporary employment legislation regulates the use of fixed-term contracts, their renewal and maximum duration, as well as the functioning of temporary work agencies (Table A1.4). This is the legislation where the SEE countries are quite restrictive, with most indices ranging above 3.0. Most of the countries have relaxed their restrictions on the use of temporary contracts. The overall strictness of this type of legislation stems mainly from the fact that, except for Croatia and Romania, the legislation of the SEE countries does not stipulate the existence of temporary work agencies.9 Collective dismissal legislation defines the term “collective,” as opposed to “individual,” and stipulates notification requirements and payments associated with such dismissals (Table A1.5). In this case, the SEE countries do not constitute a homogeneous group: Albania and Bulgaria have the least restrictive legislation with index values significantly below the CEE and EU averages, while the Croatian and Romanian indices are above the SEE and EU averages. This is due to substantial disparities in SEE legislation on collective dismissals. First, considerable differences exist in the definitions of “collective dismissal.” While in most countries the “collective dismissal” is defined as dismissal of more than 5 employees, in Albania and Croatia the term refers to the dismissal of at least 20 workers, while the
8 With the 2003 amendments of the Croatian labor code, the retraining requirement is imposed only on employers with at least 20 employees. 9 In Romania the use of temporary work agencies is limited only to specific reasons, leading to a relatively high value of the temporary employment legislation index.

8
Bulgarian labor code does not contain a definition of collective dismissals at all. Second, there are significant differences regarding the additional delays and costs imposed on employers in the case of collective dismissals vs. individual dismissals. While in Bulgaria and Serbia and Montenegro there are no additional delays for the notification to take place, in Macedonia and Croatia the delays amount to two and three months respectively. Overall, the comparison between the SEE countries on the one hand and the CEE and OECD countries on the other shows that the SEE countries tend to be relatively restrictive. However, this rigidity mainly stems from their legislation on temporary employment and collective dismissals, while the SEE legislation on regular employment is quite flexible. These cross-regional comparisons suggest that in adopting and amending their labor legislation during the transition period, the SEE countries have been mainly focusing on relaxing the regular employment restrictions, while insufficient attention has been paid to the benefits of adopting more flexible legislation on temporary employment and, in some countries, more flexible legislation on collective dismissals.10 The central question of this study is whether the stricter EPL in the SEE countries has been an important contributor to the persistently high unemployment rates.
2.2. Features of SEE Labor Markets In this section I will present information on the labor market institutions and policies in the SEE countries and try to identify any clear pattern relative to the situation in the CEE and EU countries. Interpreting the data in this section, one needs to keep in mind that the access ti reliable data is problematic in several ways. Data on labor market interventions and outcomes in the SEE countries are not produced on a regular basis. They are organized in ways that make comparisons difficult and most often are not readily accessible. In the process of collecting the data, I systematically selected the “best” sources when confronted with conflicting information and discarded data when the sources appeared to be unreliable or the figures were clearly inaccurate. Equally important, some data were calculated based on information available from different sources. Taking into account all these limitations, the data presented in this section should be taken mainly as preliminary and only indicative. I start by analyzing the different policies adopted by the SEE countries to support the unemployed. The generosity of a particular unemployment insurance system depends on the quantity and duration of the benefits, and the system’s eligibility rules. These vary quite substantially across the SEE countries (Table 4). The benefit replacement rate, which shows the share of income that is replaced by unemployment benefits, is fairly high in Croatia and rather low in Albania, and Bosnia and Herzegovina. All the SEE countries have strictly time- limited systems, with a maximum duration of 12 months in most countries, except Serbia and Montenegro where the maximum duration is 24 months. The average SEE benefit duration is comparable to the CEE average, but much lower than those of the EU and OECD. Instead of directly comparing eligibility rules across countries, which would be rather cumbersome, I use the coverage rate (the share of unemployed receiving unemployment insurance benefits) as a proxy indicator. The coverage rate is highest in Romania (60 percent) and lowest in Serbia and Montenegro (below 10 percent). Overall, except in the case of 10 In contrast, the liberalization in EPL between the late 1980s and the late 1990s in the OECD countries was mostly due to liberalization of temporary contracts (OECD, 1999).

9
Romania, the coverage rates in the SEE countries were falling continuously throughout the past decade mainly as a result of the increasing shares of long-term unemployed in the presence of limited benefit duration.
Table 4. Passive Labor Market Policies (late 1990s/early 2000s) Benefit Replacement
Rate (in %)
Maximum Benefit Duration1
Coverage Rate
Albania 302 12 months (1) 10 Bosnia and Herzegovina3 30-40 6-12 months(0.75) 13 Bulgaria 60 6-12 months (0.7) 24.8 Croatia 100 2.5-10.25 months (0.5) 17 Macedonia 50 3-18 months (0.9) 10 Romania 50-60 6-12 months (0.75) 69 Serbia and Montenegro 604 3-24 months (1.1)4 8.4 SEE average 56 10 months (0.8) 22 CEE average 48 10 months (0.9) 44 EU average 60 23 months (1.9) - OECD average 58 24 months (2.0) -
- Data not available. Benefit replacement rate – initial benefit level divided by previously earned income. Coverage rate – percentage of unemployed receiving unemployment insurance benefits. 1/ Figures in parentheses indicate the average benefit duration in years. Following the coding procedure in Nickell (1997), 4 or more years mean indefinite duration. 2/ Unemployment benefits were set up at a flat rate of 4000 leks per month as of 1998. The figure is calculated relative to the average monthly wage for state employees of 13,234 leks. 3/ The figures are for the Federation of Bosnia and Herzegovina. 4/ The figures are for the Republic of Serbia. Sources: Arandarenko (2003) and Friedrich Ebert Stiftung (2002) for Croatia, Macedonia, Romania, and Serbia and Montenegro; Cazes (2002) for Bulgaria; Freedom House (2000), International Social Security Association (1999), and Pasha et al. (2002) for Albania; World Bank (2002) for Bosnia and Herzegovina, and Macedonia; World Bank (2003) for Macedonia; OECD (1999) and Riboud et al. (2002) for CEE, OECD, and EU countries. The low replacement rates, the relatively short duration of unemployment benefits, and the limited coverage would imply that labour supply disincentives are modest in the SEE countries. However, one should keep in mind the sizable migration out of these countries to the EU and OECD countries. Worker remittances might have played an important role in creating more “discouraged workers” particularly among older members of the population.
Active labor market policies refer to expenditures on activities for the unemployed that are geared to help them back into work and are popular in many European countries.11 These include labor market training, assistance with job search, subsidized employment, and special measures for the disabled. However, the aggregate spending figures can be misleading, since they are partly a function of the number of unemployed. As in Nickell (1997), to correct for this caveat I consider the active labor market spending per unemployed person as a percentage of GDP per member of the labor force. Regardless of the indicator used, it is
11 However, active labor market policies have been also subject to criticism for a number of reasons (a summary can be found in Calmfors, 1994).

10
notable that all SEE countries have low levels of expenditure on active labor market policies (Table 5).12 The role of trade unions in collective bargaining and the tax burden on labor are the main factors that influence wage formation and determine labor costs. Trade union strength leads to higher wages and higher unemployment in “right-to-manage” models (Farber, 1986). However, the bargaining power of trade unions in SEE has declined during the past decade, both at the national and at the company level, especially in the private sector. This has been followed by a sharp decline in unionization rates, which are now mostly at levels comparable to the EU average (Table 5).13 It should be noted here that, apart from the union density, the union coverage (the share of workers actually covered by union bargaining) and the extent of coordination in wage bargaining are also important features of the wage determination system. However, data on these variables are not available for most SEE countries and therefore I do not include them in the discussion and the following analysis.
Table 5. Active Policies, Unionization, and Taxes on Labor (late 1990s/early 2000s)
Active Policies % GDP per
unemployed
Union Density
Payroll Tax Rate
Albania - - 22.0 42.5 Bosnia and Herzegovina1 0.08 0.005 - 46.9 Bulgaria 0.12 0.008 58.2 45.0 Croatia 0.15 0.011 64.0 41.2 Macedonia 0.05 0.001 45.0 31.5 Romania 0.10 0.013 50.0 60.5 Serbia and Montenegro - - 51.0 53.22 SEE average 0.10 0.01 48.4 45.8 CEE average 0.42 0.04 49.1 43.4 EU average 1.16 0.16 41.9 23.5 OECD average 0.92 0.14 36.9 20.6
- Data not available. Active policies (spending per unemployed) – ratio of active labor market spending (% of GDP) to LFS unemployment rate. Union density – percentage of salaried workers that belong to a union. 1/ The figures are for the Federation of Bosnia and Herzegovina. 2/ The figure is for the Republic of Serbia. Sources: Arandarenko (2003) for Romania; Cazes (2002) for Bulgaria; Freedom House (2001) for Albania, Croatia, Macedonia, Romania, and Serbia and Montenegro; Gray and Weig (1999) for Albania; International Social Security Association (1999) for Croatia, and Serbia and Montenegro; Micevska et al. (2002) and World Bank (2003) for Macedonia; OECD (2000) for Romania; Vujcic and Lang (2002) for Croatia; World Bank (2002) for Bosnia and Herzegovina; OECD (1999) and Riboud et al. (2002) for CEE, OECD, and EU countries, online OECD database on Labour Market Statistics – INDICATORS for OECD and EU countries.
12 When it comes to the mixture of active and passive policies, most of the SEE countries seem to devote more resources to passive policies than to active ones. 13 It should be noted that the data on union density for the SEE countries are highly questionable. The figures reported in this paper rely largely on numbers reported by the trade union federations themselves. However, according to survey data, these figures tend to be significantly inflated (Crowley, 2002).

11
The final column in Table 5 gives information on the tax burden on labor. Payroll and other taxes can increase the cost of labor, even in the absence of upward pressures on wages.14 Besides the payroll tax, Nickell (1997) considers the total tax rate, which is the sum of the average payroll, income and consumption tax rates. This paper focuses only on the payroll taxes since it is very difficult to construct the total tax rate based on reliable and consistent information on value-added and (progressive) income tax rates for the SEE countries.15 Payroll tax rates range from 31.5 percent in Macedonia to as high as 60.5 percent in Romania. Overall, SEE payroll tax rates are comparable to the CEE average and about twice as high as the EU and OECD averages. The high tax burden on labor in the SEE countries can be explained by the continuous fiscal pressures on governments to increase their spending on unemployment insurance systems in the presence rising unemployment.16 According to the evidence presented in this section, it could be concluded that the SEE countries operate less generous unemployment insurance systems (especially in terms of the duration of benefits) than the EU and OECD countries. They also spend less on active labor market policies. In comparison with the EU and OECD countries the SEE countries fall into the middle of the range in terms of union density. Similarly to the CEE countries, the SEE countries have very high payroll taxes.17 The consequences of these similarities and differences for labor market outcomes form the next topic.
3. Effects on Unemployment
The main features of the SEE labor market institutions and policies (here the independent variables) were described in the previous section. The idea here is to consider empirical evidence from OECD, CEE, and SEE countries, use the methods already applied in previous research mainly on data from OECD countries, and investigate whether the results will differ once the SEE countries are included in the analysis. I first present some basic statistics about the relations between various aspects of unemployment (overall, male, female, youth, and long-term unemployment) and labor market institutions. Unemployment rates are averaged over the period 1995-2000. As in Nickell (1997), I choose to use six-year averages in order to smooth out both the cycle and the year-on-year noise.18 Data on labor market institutions for 37 countries (24 OECD countries, 6 CEE countries and 7 SEE countries) refer mainly to the late 1990s. To ensure comparability, the late -1990s values of the EPL indicators for the SEE countries are used, except in the case of Romania and Serbia and Montenegro where only values for the early 2000s could be calculated based on available data. Thus, for instance, instead of the 2003 value the 1996
14 There are competing views about the effects of taxation on unemployment. For instance, Daveri and Tabellini (2000) argue that higher taxes lead to higher unemployment and lower output growth. By contrast, Bell and Nickell (1997) argue that any tax on labor is borne by the employees in the long run, with no effect on unemployment. 15 In addition, as Cazes (2002) argues, the unemployed also pay income and consumption taxes. 16 Aging populations, declining employment rates, and elevated poverty put additional strain on the public pension systems. Additionally, a decrease in other types of tax proceeds due to the economic contraction forced the governments in the region to look for alternative sources of revenues. 17 Due to lack of accurate data, I do not examine the role of minimum wages. However, the available evidence seems to suggest that they are not binding in most transition countries. 18 Note, however, that continuous time series data over the study period are not available for all SEE countries. Thus, for these countries the averages are usually calculated over a few data points.

12
value of the EPL indicator for Bosnia and Herzegovina is applied in the analysis that follows.19 Table 6 presents correlation coefficients between the unemployment rates and EPL strictness indicators.20 Many of these correlation coefficients are not significantly different from zero, especially the correlations between the measures of regular employment and collective dismissal strictness on the one hand and the unemployment rates on the other. However, these correlations suggest that the EPL strictness of temporary employment and the overall EPL index seem to be more strongly associated with various unemployment measures.21 Leaving the transition countries out of the sample and conducting the same type of bivariate analysis only for the OECD countries produces qualitatively similar results: the coefficients on the strictness of temporary EPL and the overall EPL index are still statistically significant, although less strongly. This stands in contrast to the bivariate analysis in OECD (1999) that finds no association between EPL strictness indicators and unemployment rates for OECD countries. However, unemployment rates in the OECD study are averaged over the period 1990-1997 and these averages are unlikely to be significantly correlated with the late -1990s EPL indices. Averaging the unemployment rates over the period 1995-2000 (as done in this paper) seems to be more appropriate.
Table 6. Correlation Coefficients between EPL Indicators, Unemployment Rates and Underground Economy
Indicators of the strictness of EPL Regular
Employment Temporary employment
Collective dismissals
Overall EPL index
Unemployment Overall 0.021 0.474*** 0.287* 0.397** Males -0.079 0.396** 0.194 0.279 Females 0.049 0.514*** 0.259 0.425** Youths 0.040 0.558*** 0.327* 0.471*** Long-term 0.067 0.562*** 0.321* 0.471*** Underground Economy 0.328* 0.697*** 0.341** 0.689*** The sample consists of 37 countries: 24 OECD countries, 6 CEE countries (Czech Republic, Estonia, Hungary, Poland, Slovakia, and Slovenia), and 7 SEE countries (Albania, Bulgaria, Bosnia and Herzegovina, Croatia, Macedonia, Romania, and Serbia and Montenegro). The unemployment rates are averaged using available data over the period 1995-2000, except for the figure for Bosnia and Herzegovina which is based on the 2001 LSMS. * , ** and *** denote correlation coefficients significant at 10%, 5% and 1% levels respectively. Sources: own calculations and Riboud et al. (2002) for EPL indicators; World Development Indicators database (2003) for unemployment rates; Riboud et al. (2002) and OECD (1999, 2001) for the incidence of long-term unemployment in CEE and OECD countries; TransMONEE database (2002) for youth unemployment rates in SEE countries; World Bank (2002) for Bosnia and Herzegovina and for incidence of long-term unemployment in SEE countries; and Schneider (2002) for measures of underground economy.
19 Another reason for using late -1990s values of the EPL indicators is that those values are supposed to have an impact (if any) on the labor market performance during the study period. 20 Correlation coefficients between different labor market institutions and policies are presented in Table A2.1 in Appendix 2. 21 I plotted these bivariate correlations to check if they were driven by outliers. Macedonia appeared to be the only outlier in the sample. However, excluding Macedonia and re-estimating the correlations did not change the results: the coefficients decreased slightly, but remained highly statistically significant.

13
Table 6 also includes a measure of the underground economy in GNP taken from Schneider (2002). As mentioned previously, informal activity may be a response to overly regulated labor markets. Indeed, the measure of underground economy is highly correlated with the EPL index. 22 This is in line with recent literature (OECD, 1999; Kugler, 2000) suggesting that job security provisions provide incentives for operation in the informal sector. Although the positive correlation between the EPL index and the size of the underground economy shows preliminary indication that the underground economy is a relevant concept as an off-setting flexibility to strict labor legislation, this result should be taken as indicative only. Further research is needed to determine whether this causality really holds and to estimate the degree of flexibility provided by the informal sector. To establish which institutions and policies appear to be most robustly correlated with unemployment, I conduct a battery of cross-sectional regressions in the spirit of the extreme bound analysis (Table 7). That is, I regress the unemployment rate on a constant, the variable of interest, and each of the other explanatory variables in turn. This analysis was previously used in cross-country regressions on the determinants of output growth (Levine and Renelt, 1992) and recently applied in cross-country regressions on the determinants of net employment growth (Garibaldi and Mauro, 2002). In line with the previous theoretical and empirical research (e.g., Nickel, 1987; Blanchflower and Oswald, 1994), logs of unemployment rates are used in the analysis that follows.23
Table 7. Unemployment and Institutional Variables: Robustness Checks Min1 Max1 p < 0.12 Strictness of EPL Regular employment -0.350 0.107 1 Temporary employment 0.157 0.243 8 Collective dismissals 0.016 0.159 3 Overall EPL -0.026 0.488 7 Benefit Replacement Rate -0.008 -0.003 1 Benefit Duration -0.104 0.005 0 Active Policies -0.575 0.030 0 Union Density 0.002 0.006 0 Payroll Tax 0.011 0.019 9 The sample consists of 37 countries: 24 OECD countries, 6 CEE countries (Czech Republic, Estonia, Hungary, Poland, Slovakia, and Slovenia), and 7 SEE countries (Albania, Bulgaria, Bosnia and Herzegovina, Croatia, Macedonia, Romania, and Serbia and Montenegro). The dependent variable is the log of the unemployment rate averaged over the period 1995-2000. All regressions include a constant. 1 Min (Max) is the minimum (maximum) value of the coefficient in the regressions. 2 Number of regressions in which the coefficient has a p-value less than 10%.
22 Using only data on OECD countries (which have been freed of frictions typical for CEE and SEE countries during the last decade) produces highly significant and an even higher correlation coefficient of 0.74 between the EPL index and the share of the underground economy. 23 For long-term and youth unemployment rates, the choice of the econometric specification between levels and logs is less obvious (e.g., Mincer, 1976). Therefore, different specifications have been estimated. The results, however, have been qualitatively the same.

14
The results summarized in Table 7 suggest that two sets of labor market institutions should be particularly considered as they seem to have an impact on overall unemployment rates.24 These are the EPL strictness and the tax burden on labor. In particular, the coefficients on temporary legislation, overall EPL, and payroll taxation tend to have a robustly positive impact on unemployment. None of the remaining features of labor markets seem to be significantly associated with unemployment. This is in striking accordance with the findings in Garibaldi and Mauro (2002). This result is rather interesting since Garibaldi and Mauro (2002) consider only OECD countries and the dependent variable in their regressions is the net employment growth. While the bivariate and the extreme bound analyses provide useful guidelines on potential relationships, multivariate analysis may provide a better assessment since it controls for other determinants of cross-country differences in unemployment. Table 8 reports the estimated coefficients from regression models that attempt to isolate the causal impact of those variables that exhibited robust impact in the analyses conducted above.25 It should be noted that, despite the use of six-year averages, there may still be significant long-term variations across countries in the stance of macroeconomic policies. In an attempt to deal with this problem, Nickell (1997) controls for the average changes in inflation. However, this measure is not appropriate for transition countries. Therefore, as in Cazes (2002), I include an output gap as the deviation between the actual and long-run trend output, the latter being obtained using a GDP smoothing method based on the Hodrick-Prescott filter.26 A dummy variable for the SEE countries should capture unobserved characteristics of these countries that might be important in explaining the dependent variables.27 Due to limited availability of performance and control variables, the final regression samples in Tables 8 to10 differ. Before proceeding with the discussion of the findings, a few caveats of the analysis that follows need to be taken into account. First, given the few data points available, the regression results should be taken as indicative only. Second, like all simple cross-section regressions, care must be taken with their interpretation because of issues of reverse causality and the like. Yet another caveat of the analysis is that it is not yet possible to introduce a time lag between the dates at which EPL strictness and labor market performance are measured, since it may take several years for changes in EPL to be fully reflected in employment and unemployment. It has, for example, been argued that the initial impact of EPL reforms on employment and unemployment may differ from their long-run effects (Bertola and Ichino, 1995). Thus, it is possible that recent changes in EPL are not yet fully visible in the labor market performance. The first column of Table 8 reports a “basic specification,” including a single, overall indicator of EPL strictness. A second version of the basic specification is presented in column (2), which differs only in that separate indicators are used for the three main components of EPL. In both cases, the results are qualitatively similar. The estimated coefficient for overall
24 Robustness checks for male, female, youth, and long-term unemployment rates are presented in Tables A2.2-A2.5. 25 I also ran the regressions including the other institutional and policy variables. As expected, their coefficients were statistically insignificant. 26 The output gap is measured as the fraction of real GDP to potential GDP, minus 1. It covers the same period as the dependent variables. Data for GDP in 1995 constant US dollars are obtained from the World Development Indicators database (with exception of the data for Serbia and Montenegro, which are in constant 1994 dinars, provided by the National Bank of Serbia). Potential GDP is obtained by using the Hodrick-Prescott filter applied to real GDP with the value of the parameter lambda set to 25. 27 I have also run the regressions including an additional dummy for the CEE countries or a dummy for all the transition countries. The coefficients on these dummies were mostly insignificant.

15
EPL strictness is insignificant, which is in accord with the majority of prior studies. Similarly, none of the coefficients for the three components of EPL indicates a significant impact on unemployment. This shows that the finding that there is no link between overall EPL strictness and unemployment is not due to off-setting effects of the separate components of EPL.
Table 8. Regressions to Explain Log Overall Unemployment Rate
(1) (2) (3) (4) Strictness of EPL Regular employment -0.098
(0.120)
Temporary employment
0.151 (0.091)
Collective dismissals
0.010 (0.007)
Overall EPL
0.102 (0.109)
-0.051 (0.112)
Payroll Tax
0.008 (0.006)
0.010 (0.007)
0.007 (0.032)
Underground Economy 0.032* (0.017)
“Adjusted” EPL Strictness -2.897 (1.947)
“Adjusted” Taxation
0.103 (0.122)
Output Gap
0.001 (0.046)
0.010 (0.047)
-0.019 (0.041)
-0.022 (0.045)
Dummy for SEE countries 0.495** (0.232)
0.237 (0.299)
-0.038 (0.286)
0.484** (0.217)
Number of observations 32 32 30 30 Adjusted R2 0.336 0.334 0.366 0.235
The sample consists of 37 countries: 24 OECD countries, 6 CEE countries (Czech Republic, Estonia, Hungary, Poland, Slovakia, and Slovenia), and 7 SEE countries (Albania, Bulgaria, Bosnia and Herzegovina, Croatia, Macedonia, Romania, and Serbia and Montenegro). The unemployment rate is averaged using available data over the period 1995-2000, except for the figure for Bosnia and Herzegovina which is based on the 2001 LSMS. Standard errors are in parentheses. All regressions include a constant. *, ** and *** denote coefficients significant at 10%, 5% and 1% levels respectively. Column (3) of Table 8 reports the estimates for a specification including a measure of underground economy. As discussed above, this measure is intended to capture an off-setting flexibility to overly regulated labor markets. The coefficients on the overall EPL strictness and payroll taxation remain insignificant. The coefficient on the size of the underground economy shows positive correlation with the unemployment rate, though only marginally. Interpreting the regression results in column (3), however, one needs to take into account the

16
high collinearity between the EPL index and the underground economy as well as between the payroll taxation and the underground economy.28 Column (4) of Table 8 accounts for the rigidity “in practice” in a different way. It makes use of two new variables constructed as ratios of the EPL index to the underground economy (the “adjusted” EPL strictness) and of the payroll taxation to the underground economy (the “adjusted” taxation).29 The basic finding appears robust: overall unemployment is not significantly related to EPL strictness. On the other hand, the coefficient on the SEE dummy is significant, indicating that there might have been other factors specific to these count ries, affecting labor market outcomes.30 Turning now to the demographic composition of unemployment, Table 9 presents regression results relating to international differences in the unemployment rates of males, females, youths, and the long-term unemployed. In this and the following table, each independent variable is investigated using the four specifications considered in Table 8. Most of the coefficients are not significantly different from zero. The strongest evidence is that stricter legislation on temporary legislation has an effect on female and youth unemployment, that is, on the groups that may face difficulties in gaining access to stable jobs. This is a novel result since previous empirical studies have not found evidence of a significant impact of temporary EPL on labor market performance (e.g., OECD, 1999).31 The bivariate association between stricter EPL and higher unemployment (Table 6) is only confirmed for the long-term unemployed. This is in line with evidence on OECD countries (OECD, 1999) and contrary to evidence on both OECD and CEE countries (Cazes, 2002). Higher payroll taxes are associated with higher rates of youth unemployment (as in Cazes, 2002). In particular, there seems to be a significant association between high youth unemployment and a policy package including strict temporary employment regulations and a high tax burden. The size of the underground economy seems to increase the unemployment of all groups. A speculative explanation of this result might be that a larger underground economy contributes to a lower demand for labor (for instance, through decreasing the investment due to higher costs of uncertainty). Rather interestingly, while the effect on male, female and youth unemployment seems to be similar, there seems to be a particularly strong association between the long-term unemployment rate and the size of the underground economy. The effect of the underground economy on long-term unemployment is about twice as high as the effect on overall unemployment and 50 percent higher than the effect on male unemployment. This could be a result of the higher tendency of the long-term unemployed to engage occasionally in informal activities.
28 The respective correlation coefficients are 0.69 and 0.71. 29 In a similar way, Lacko (2003) constructs the “subjective” tax rate as a ratio of the tax rate and a corruption index. 30 Leaving out the SEE dummy increases the significance of the coefficients on payroll taxation, temporary EPL, and underground economy. 31 It should be noted, however, that previous research has not paid much attention to the relative importance of different components of employment protection for labor market performance. In particular, it is striking that most of the empirical literature makes no distinction between the relaxation of EPL for permanent contracts and the liberalization of temporary contracts, even though theory suggests that these may have quite different effects (Young, 2003).

17
Table 9. Regressions to Explain Log Unemployment Rates
Male Unemployment Female Unemployment Youth Unemployment Long-Term Unemployment (1) (2) (3) (4) (1) (2) (3) (4) (1) (2) (3) (4) (1) (2) (3) (4) Strictness of EPL Regular employment -0.253
(0.155) -0.116
(0.130) -0.194
(0.122) 0.073
(0.223)
Temporary employment
0.199 (0.188)
0.226** (0.099)
0.247** (0.093)
0.246 (0.169)
Collective dismissals
-0.052 (0.110)
0.016 (0.093)
0.013 (0.087)
0.095 (0.162)
Overall EPL
-0.007 (0.146)
-0.136 (0.110)
0.177 (0.121)
-0.001 (0.121)
0.143 (0.118)
-0.046 (0.128)
0.416** (0.196)
0.156 (0.213)
Payroll Tax
0.005 (0.008)
0.010 (0.009)
0.005 (0.006)
0.007 (0.007)
0.010 (0.007)
0.005 (0.007)
0.013* (0.007)
0.018** (0.007)
0.008 (0.007)
0.011 (0.011)
0.013 (0.012)
-0.008 (0.012)
Underground Economy 0.039** (0.018)
0.041** (0.019)
0.045** (0.020)
0.063* (0.033)
“Adjusted” EPL Strictness -3.623* (1.848)
-2.282 (2.236)
-4.514* (2.299)
-1.431 (4.084)
“Adjusted” Taxation
0.077 (0.117)
0.088 (0.141)
0.112 (0.147)
0.022 (0.257)
Output Gap
-0.007 (0.061)
0.012 (0.061)
-0.037 (0.041)
-0.035 (0.043)
-0.011 (0.051)
0.001 (0.051)
-0.042 (0.045)
-0.043 (0.053)
0.400 (1.098)
0.007 (1.041)
-0.470 (1.045)
-1.127 (1.191)
-0.011 (0.083)
-0.009 (0.089)
-0.040 (0.079)
-0.047 (0.096)
Dummy for SEE countries 0.657* (0.323)
0.186 (0.400)
-0.211 (0.305)
0.313 (0.225)
0.353 (0.269)
-0.016 (0.336)
-0.411 (0.337)
0.314 (0.272)
0.600** (0.254)
0.160 (0.304)
-0.092 (0.335)
0.561* (0.285)
0.696 (0.447)
0.487 (0.593)
-0.256 (0.565)
1.020** (0.495)
Number of observations 31 31 29 29 31 31 29 29 31 31 29 29 31 31 29 29 Adjusted R2 0.135 0.193 0.300 0.201 0.347 0.283 0.313 0.062 0.431 0.495 0.476 0.304 0.386 0.345 0.401 0.115
The sample consists of 37 countries: 24 OECD countries, 6 CEE countries (Czech Republic, Estonia, Hungary, Poland, Slovakia, and Slovenia), and 7 SEE countries (Albania, Bulgaria, Bosnia and Herzegovina, Croatia, Macedonia, Romania, and Serbia and Montenegro). The unemployment rates are averaged using available data over the period 1995-2000, except for the figure for Bosnia and Herzegovina which is based on the 2001 LSMS. Standard errors are in parentheses. All regressions include a constant. *, ** and *** denote coefficients significant at 10%, 5% and 1% levels respectively.

18
In summary, the multivariate analysis strengthens the conclusion that EPL strictness has little or no impact on overall unemployment. It also suggests that EPL may affect the demographic composition of unemployment, with a higher female and youth unemployment being associated with stricter temporary employment regulations. In addition, with a stricter EPL those who become unemployed are at a greater risk of remaining unemployed for a year or more.
3.2. Effects on Employment and Labor Participation
In this section I investigate relations between labor market institutions and other measures of labor supply. I first look at the employment-to-populations ratios. The focus on employment has two important advantages. First, theory and past research suggest that employment levels are affected negatively by job security provisions (e.g., Lazear, 1990; Bertola, 1990; Hopenhayn and Rogerson, 1997; Heckman and Pagés, 2000).32 Second, employment is easier to measure than unemployment, because it does not depend on subtle distinctions between individuals who are in the labor force and those who are not.33 However, it should be noted that other variables may contribute to explain variation across countries in labor input (early retirement schemes, disability systems, and the like), which are not taken into account in this paper. Therefore, the labor input equations might contain more unexplained noise. Before going on to discuss the regression results, it is important to note that the employment situation in the SEE countries has been a source of concern as employment-to-population ratios are quite low, varying from 40 percent in Bosnia and Herzegovina to 64 percent in Romania. The SEE average of 52 percent is much lower than the OECD average (65 percent) and the CEE average (62 percent). Columns (1) and (2) of Table 10 present the regression results for the effect of EPL, payroll taxation, and underground economy on employment rates.34 For overall employment, none of the coefficients on EPL strictness indicators is statistically significant (the coefficient on temporary employment legislation is only borderline significant). However, it appears that EPL has a significant impact on female employment rates. In particular, relaxing the regulations on temporary employment seems to matter most for stimulating increased female employment. The negative coefficient on output gap in the female employment regressions might be explained by the omission of some important variables, as explained above. These omissions could be captured by the output gap variable (e.g., Bruno and Cazes, 1998). One could even speculate that employers producing below their potential might be reluctant to increase their female labor inputs (for reasons not immediately apparent) to better use their capacities.
32 However, views that regulations have no substantial impact also prevail in the literature (e.g., Blank and Freeman, 1994; Freeman, 2000). 33 The very notion of “searching a job” becomes hazy in countries where a large proportion of the labor force works in the informal sector or is self-employed, as it is the case in the SEE countries. Many people may declare that they are actively searching for a job (and be counted as unemployed) even when in fact their search efforts are minimal. 34 Robustness checks of the impact of different institutional and policy variables are presented in Tables A2.6 to A2.7 in Appendix 2.

19
Table 10. Regressions to Explain Employment and Labor Force Participation
Overall Employment Female Employment Overall Labor Force Participation Female Labor Force Participation (1) (2) (3) (4) (1) (2) (3) (4) (1) (2) (3) (4) (1) (2) (3) (4) Strictness of EPL Regular employment 0.710
(2.040) 1.329
(2.338) 0.432
(1.643) 0.692
(2.251)
Temporary employment
-2.848* (1.542)
-5.151*** (1.779)
-2.563** (1.244)
-3.387* (1.704)
Collective dismissals
0.019 (1.448)
0.799 (1.701)
0.924 (1.194)
1.282 (1.636)
Overall EPL
-2.911 (1.836)
-0.891 (2.034)
-4.786** (2.255)
-2.049 (2.613)
-2.363 (1.523)
-0.574 (1.613)
-2.915 (2.087)
-1.398 (2.330)
Payroll Tax
0.141 (0.106)
-0.188 (0.114)
-0.134 (0.113)
-0.136 (0.132)
-0.246* (0.135)
-0.111 (0.144)
-0.071 (0.088)
-0.129 (0.091)
-0.004 (0.090)
-0.040 (0.120)
-0.118 (0.125)
-0.009 (0.130)
Underground Economy -0.456 (0.317)
-0.572 (0.404)
-0.603** (0.251)
-0.490 (0.363)
“Adjusted” EPL Strictness 20.01 (37.28)
-2.470 (47.57)
8.298 (30.65)
-5.882 (39.98)
“Adjusted” Taxation
-1.508 (2.342)
-1.247 (3.018)
-0.016 (1.920)
0.190 (2.513)
Output Gap
1.200 (0.770)
1.024 (0.797)
1.470* (0.745)
1.539* (0.860)
-46.35** (22.25)
-52.69** (21.20)
-33.15 (22.36)
-23.25 (26.66)
0.508 (0.645)
0.243 (0.653)
0.543 (0.601)
0.599 (0.724)
1.165 (0.884)
0.806 (0.894)
1.300 (0.869)
1.354 (0.944)
Dummy for SEE countries -6.464 (3.912)
-2.693 (5.077)
1.392 (5.199)
-8.934** (4.154)
-8.625 (5.905)
-0.678 (7.092)
5.769 (8.772)
-8.046** (8.322)
-13.46*** (3.466)
-10.34*** (4.363)
-6.301 (4.274)
-16.23*** (3.715)
-12.69*** (4.751)
-8.420 (5.978)
-5.197 (6.173)
-14.68*** (4.845)
Number of observations 32 32 30 30 28 28 26 26 31 31 29 29 31 31 29 29 Adjusted R2 0.445 0.436 0.456 0.272 0.287 0.365 0.219 0.114 0.599 0.616 0.646 0.485 0.452 0.448 0.401 0.346
The sample consists of 37 countries: 24 OECD countries, 6 CEE countries (Czech Republic, Estonia, Hungary, Poland, Slovakia, and Slovenia), and 7 SEE countries (Albania, Bulgaria, Bosnia and Herzegovina, Croatia, Macedonia, Romania, and Serbia and Montenegro). Ratios refer to persons aged 15 to 64 years who are in employment or in the labor force divided by the working age population. The dependent variables are averaged over the period 1995-2000. Standard errors are in parentheses. All regressions include a constant. *, ** and *** denote coefficients significant at 10%, 5% and 1% levels respectively.

20
Unemployment is not the only margin of adjustment when employment creation is weak. In the light of dim employment prospects, jobless workers can decide to exit the labor force, instead of looking for a job (the well-known ‘discouraged worker’ phenomenon). The existence of early retirement schemes in many SEE countries made it more attractive for older workers to exit the labor force.35 As a result, labor force participation rates in the SEE countries are quite low, ranging from 48 percent in Bosnia and Herzegovina to 63 percent in Romania. Furthermore, the reduction of child care support provided by the state and the subsequent increase in child care prices, combined with a decline in the number of child care centers and the tightening of social assistance for mothers with small children, led numerous women to exit the labor force to attend their children. Female labor participation rates are particularly low, varying from 34 percent in Bosnia and Herzegovina to 57 percent in Romania. Columns (3) and (4) of Table 10 present the results of regressions addressing the overall and female labor force participation rates.36 Stricter regulations on temporary employment appear to discourage the supply of labor. Large underground economy has a similar effect. The significant coefficient on the SEE dummy is probably capturing the effect of other important variables affecting labor force participation in these countries. To sum up, simple cross country regressions suggest that EPL lowers labor input, with the evidence being quite robust regarding the negative impact of stricter temporary employment regulations. Again, this is a novel result, indicating that it might be sensible to reduce obstacles to adopting more fixed-term contracts and legalizing the operation of temporary work agencies. This is based on the following rationale: unlike with the entry into a regular employment out of unemployment into (which has become increasingly more difficult), temporary employment forms gradually reduce the obstacles in the way of permanent integration into the labor market.37
4. Conclusion The potential incompatibility of EPL with the flexibility required for firms and national economies to prosper today has occasioned much debate and a growing body of research. The central question has been whether excessively strict EPL has been an important contributor to the persistently high unemployment experienced in many OECD countries since the early 1980s. Naturally, empirical research to date has mostly used data on EPL for OECD countries. This paper presents new data that describe the EPL and other labor market institutions and policies prevailing in seven SEE countries in the late 1990s and early 2000s. The main contribution here has been to construct the appropriate EPL indices for the SEE countries. This offers the possibility to extend the international comparative analysis of the strictness and impact of EPL to a wider range of countries.
35 These schemes were often used to control unemployment among this particular group of workers. 36 Tables A2.8-2.9 indicate that benefit duration and active labor market policies might also influence labor force participation rates. Specifications including these variables have been tested, but their coefficients have turned out insignificant. 37 It should be noted, however, that fixed-term contracts are no panacea. For instance, their introduction in Spain in the presence of high dismissal costs on permanent jobs gave rise to a dual labor market with no net gains in total employment.

21
The main findings on labor market institutions in the SEE countries can be summarized as follows:
- The countries that constituted former Yugoslavia (Bosnia and Herzegovina, Croatia, Macedonia, and Serbia and Montenegro) initially adopted more rigid labor codes than their neighbours in the region (Albania, Bulgaria, and Romania).
- During the past decade SEE countries have liberalized their EPL significantly.
- Despite these liberalization efforts, the SEE countries still stand out for having
relatively strict employment protection. However, this rigidity mainly stems from their strict legislation on temporary employment and collective dismissals, while the SEE legislation on regular employment is quite flexible.
- In general, the SEE countries operate less generous unemployment insurance systems
than the EU and OECD countries. They also spend less on active labor market policies and fall in the middle of the range in terms of union density. On the other hand, the SEE countries have very high payroll taxes.
The new data provide the basis for a reassessment of the links between EPL and labor market performance. The analysis strengthens the conclusion of prior studies that the EPL index has little or no effect on overall unemployment. In addition, the effect of overall EPL index on the demographic composition of unemployment is quite weak. However, both the bivariate and the multivariate analysis support the hypothesis that a stricter regulation of temporary employment leads to higher unemployment for women and younger workers as well as to lower employment and labor force participation rates. This is a novel result that might be important for informing policy choices when it comes to choosing the best mix of EPL components. Prior studies have paid little attention to off-setting flexibilities as a response to overly regulated labor markets, even though such flexibilities may be of great importance. This paper makes a modest advance in this regard by investigating the potential impact of the underground economy. Preliminary results indicate that a larger underground economy is associated with higher unemployment rates for all labor force groups considered in this paper. The implications of the findings presented in this paper for policy making cannot be reduced to a simple recipe. While the effect of labor market institutions is hard to uncover, it should not be disregarded. EPL should be monitored closely as part of the continuing process of evaluating and adjusting an overall strategy for improving labor market performance. In particular, the analysis presented here indicates that in the SEE countries the limits of possible deregulation have not yet been reached as far as temporary employment is concerned. As labor market conditions evolve, the focus on initiatives to relax regulation of temporary employment would contribute to eliminating some of the barriers to employment for women, youths and other labor force groups that may face difficulties in gaining access to stable jobs. This paper presents simple associations between EPL and labor market outcomes that are intended to begin to unravel these issues. Future research could use the data presented here to investigate the dynamic effects of EPL reform including a broader set of countries than the ones used by prior empirical studies. This is important since changes in EPL are likely to

22
affect expectations and policies in complex ways with ultimately profound impact on labor market performance and the economy as a whole.

23
References Arandarenko, Mihail (2003), “International Advice and Labor Market Institutions in South East Europe,” mimeo. Bell, Brian and Stephen J. Nickell (1997), “Would Cutting Payroll Taxes on the Unskilled Have a Significant Impact on Unemployment?” in Snower and de la Dehesa (eds.) Unemployment Policy: Government Options for the Labour Market. Cambridge, M.A.: Cambridge University Press, pp. 296-328. Bentolila, Samuel and Giuseppe Bertola (1990), “Firing Costs and Labour Demand: How Bad is Eurosclerosis?” Review of Economic Studies 57(3), pp. 381-402. Bertola, Giuseppe (1990), “Job Security, Employment and Wage,” European Economic Review 34 (4), pp. 851-79. Bertola, Giuseppe, Tito Boeri, and Sandrine Cazes (2000), “Employment Protection in Industrialized Countries: The Case for New Indicators,” International Labour Review 139(1), pp. 57-72. Bertola, Giuseppe and Andrea Ichino (1995), “Crossing the River: A Comparative Perspective on Italian Employment Dynamics,“ Economic Policy 21, pp. 359-415. Blanchard, Olivier and Pedro Portugal (2001), “What Hides Behind an Unemployment Rate: Comparing Portuguese and U.S. Labor Markets,” American Economic Review 91(1), pp. 187-207. Blanchard, Olivier and Justin Wolfers (2000), “The Role of Shocks and Institutions in the Role of European Unemployment: The Aggregate Evidence,” Economic Journal 110(462), pp. C1-33. Blanchflower, David G. and Andrew J. Oswald (1994), The Wage Curve. Cambridge, M.A.: MIT Press. Blank, Rebecca M. and Richard B. Freeman (1994), “Does a Large Social Safety Net Mean Less Economic Flexibility?” in Blank and Freeman (eds.) Working under Different Rules. New York: Russel Sage. Bruno, Catherine and Sandrine Cazes (1998), “French Youth Unemployment: An Overview,” Employment and Training Papers No. 23. Geneva: International Labour Organization. Calmfors, Lars (1994), “Active Labour Market Policy and Unemployment: A Framework for the Analysis of Crucial Design Features,” OECD Economic Studies 22, pp. 7-47. Cazes, Sandrine (2002), “Do Labour Market Institutions Matter in Transition Countries? An Analysis of Labour Market Flexibility in the Late Nineties,” International Institute for Labour Studies Discussion Paper DP/140/2002. Geneva: International Labour Organization. Crowley, Stephen (2002), “Explaining Labor Quiescence in Post-Communist Europe: Historical Legacies and Comparative Perspective,” Center for European Studies Central and

24
Eastern Europe Working Paper No. 55. Cambridge, M.A.: Harvard University Center for European Studies. Daveri, Francesco and Guido Tabellini (2000), “Unemployment, Growth and Taxation in Industrial Countries,“ Economic Policy 15(30), pp. 47-104. Farber, Henry S. (1986), “The Analysis of Union Behavior,” in Ashenfelter and Card (eds.) Handbook of Labor Economics. Amsterdam: Elsevier, pp. 1039-89. Forteza, Alvaro and Martin Rama (2001), “Labor Market ‘Rigidity’ and the Success of Economic Reforms across More than One Hundred Countries,” World Bank Working Papers – Governance No. 2521. Washington D.C.: World Bank. Freeman Richard B. (2000), “Single Peaked vs. Diversified Capitalism: The Relation between Economic Institutions and Outcomes,” NBER Working Paper 7556. Cambridge, M.A.: National Bureau of Economic Research. Freedom House (1998), Nations in Transit 1998. Available at: http://www.freedomhouse.org/nit98/. Freedom House (2000), Nations in Transit 1999-2000. Available at: http://www.freedomhouse.org/research/nitransit/2000/.. Freedom House (2001), Nations in Transit 2001. Available at: http://www.freedomhouse.org/research/nitransit/2001/. Friedrich Ebert Stiftung (2002), “Employment and Labour-Market Policy in South Eastern Europe,” Regional Project on Social Security and Employment in South-East-Europe. Belgrade: Friedrich Ebert Stiftung. Garibaldi, Pietro and Paolo Mauro (2002), “Anatomy of Employment Growth” Economic Policy 17(34), pp. 67-114. Gray, Clive and David Weig (1999), “Pension System Issues and Their Relations to Economic Growth,” CAER II Discussion Paper No. 41. Cambridge, M.A.: Harvard Institute for International Development. Heckman, James J. and Carmen Pagés (2000), “The Cost of Job Security Regulation: Evidence from Latin American Labor Markets,” NBER Working Paper 7773. Cambridge, M.A.: National Bureau of Economic Research. Hopenhayn, Hugo and Richard Rogerson, (1997) “Job Turnover and Policy Evaluation: A General Equilibrium Analysis,” Journal of Political Economy 101(5), pp. 915-38. International Social Security Association (1999), Social Security Programs Throughout the World, 1999. Available at: http://www.ssa.gov/policy/docs/progdesc/ssptw/1999/. Kugler, Adriana (2000), “The Incidence of Job Security Regulations on Labor Market Flexibility and Compliance in Colombia: Evidence from the 1990 Reform,” Research Network Working Paper R-393. Washington, D.C.: Inter-American Development Bank.

25
Lacko, Maria (2003), “’Wandering Around’ the Segments of Labor Market: Cross-Country Comparison of the Impact of Tax Rates and Corruption,” paper presented at the Vienna Institute for International Economic Studies (WIIW) Introductory Workshop on Enterprise Development, Informal Economy and Labour Markets. Lazear, Edward (1990), “Job Security Provision and Employment,” Quarterly Journal of Economics 105(3), pp. 699-726. Levine, Ross and David Renelt (1992), “A Sensitivity Analysis of Cross-Country Growth Regressions,“ American Economic Review 82(4), pp. 942-63. Micevska, Maja, Dimitar Eftimoski and Tatjana Petkovska-Mircevska (2002), “Economic Growth of the Republic of Macedonia: Experiences and Policy Recommendations,” Global Development Network Project on Explaining Growth. Available at: http://www.cerge-ei.cz/pdf/gdn/grp_final_macedonia.pdf. Mincer, Jacob (1976), “Unemployment Effects of Minimum Wages,” Journal of Political Economy 84(4), pp. S87-104. Nickell, Stephen J. (1987), “Why Is Wage Inflation in Britain So High?” Oxford Bulletin of Economics and Statistics 49(1), pp. 103-28. Nickell, Stephen J. (1997), “Unemployment and Labor Market Rigidities: Europe versus North America,” Journal of Economic Perspectives 11(3), pp. 55-74. Nickell, Stephen J. and Richard Layard (1999), “Labour Market Institutions and Economic Performance,” in Ashenfelter and Card (eds.) Handbook of Labor Economics. Amsterdam: Elsevier, pp. 3029-84. OECD (1997), Employment Outlook. Paris: OECD. OECD (1999), Employment Outlook. Paris: OECD. OECD (2000), Labor Market and Social Policy in Romania. Paris: OECD. OECD (2001), Employment Outlook. Paris: OECD. Riboud, Michelle, Carolina Sánchez-Páramo, and Carlos Silva-Jáuregui (2002), “Does Eurosclerosis Matter? Institutional Reform and Labor Market Performance in Central and Eastern European Countries in the 1990s,” World Bank Social Protection Discussion Paper No. 0202. Washington D.C.: World Bank. Pasha, Auron, Ahmet Mancellari, Bukurie Dumani, Elton Babameto, and Drini Salko (2002), “Determinants of Growth: Albania Case,” Global Development Network Project on Explaining Growth. Available at: http://www.cerge-ei.cz/pdf/gdn/grp_final_albania.pdf. Rutkowski, Jan (2003), “Does Strict Employment Protection Discourage Job Creation? Evidence from Croatia,” World Bank Policy Research Working Paper 3104. Washington, D.C.: World Bank.

26
Saint-Paul, Gilles (1996), Dual Labor Markets: A Macroeconomic Perspective. Cambridge and London: MIT Press. Scarpetta, Stefano (1996), “Assessing the Role of Labour Market Policies and Institutional Settings on Unemployment: A Cross-Country Study,” OECD Economic Studies No. 26 pp. 43-98. Scarpetta, Stefano, Philip Hemmings, Thierry Tressel, and Jaejoon Woo (2002), “The Role of Policy and Institutions for Productivity and Firm Dynamics: Evidence from Micro and Industry Data,” OECD Working Paper 329. Paris: OECD. Schneider, Friedrich (2002), “Size and Measurement of the Informal Economy in 110 Countries around the World,” Rapid Response Unit Discussion Paper No. 1348. Washington, D.C: World Bank. Squire, Lyn and Sethaput Suthiwart-Narueput (1997), “The Impact of Labor Market Regulations,” World Bank Economic Review 11(1), pp. 119-44. Vujcic, Boris and Maroje Lang (2002), “Croatia: GDN Project Country Study.” Available at: http://www.cerge-ei.cz/pdf/gdn/grp_final_croatia.pdf. World Bank (2002), “Labor Market in Postwar Bosnia and Herzegovina: How to Encourage Businesses to Create Jobs and Increase Worker Mobility,” Human Development Unit Report No. 24889-BIH. Washington, D.C: World Bank. World Bank (2003), “Macedonia – Country Economic Memorandum Tackling Unemployment,” World Bank Economic Report No. 26681. Washington, D.C: World Bank. Young, David (2003), “Employment Protection Legislation: Its Economic Impact and the Case for Reform,” European Economy Economic Papers No. 186. Brussels: European Commission.

27
Appendix 1
Following the OECD (1999) methodology, the EPL indices for the SEE countries presented in this paper are constructed as a weighted average of 22 different measures describing various aspects of the legislation, covering permanent contracts, temporary contracts, and collective dismissals. Some of the measures are available based on normative information (e.g. notice period, maximum duration of temporary contracts, etc.) but some others need to be transformed into quantitative terms, using a subjective conversion scale. Table A1.1 presents the 22 indicators aggregated in three steps using a set of weights.
Table A1.1. Employment Protection Index: Selection of Indicators and Weighting Scheme
Level 4 Level 3 Level 2 Level 1
Procedures (1/2)
RC1 Procedural
Inconveniences (1/3) Delay to a start notice (1/2) 9 months (1/7) 4 years (1/7) Notice period after 20 years (1/7) 9 months (4/21) 4 years (4/21)
RC2 Notice and severance
pay for no-fault individual dismissal (1/3) Severance pay after
20 years (4/21) Definition of unfair dismissal (1/4) Trial period (1/4) Compensation (1/4)
RC Regular contracts
(5/12)
RC3 Difficulty of dismissals
(1/3) Reinstatement (1/4) Valid cases other than objective (1/2) Max number of successive contracts (1/4)
TC1 Fixed-term contracts (1/2)
Max cumulated duration (1/4) Types of work for which is legal (1/2) Restrictions on number of renewal (1/4)
TC Temporary contracts
(5/12) TC2
Temporary Work Agency (1/2) Max cumulated duration (1/4)
Definition of collective dismissal (1/4) Additional notification requirements (1/4) Additional delays involved (1/4)
ELP Overall Summary Indicator
CD Collective Dismissals (2/12)
Other special costs to employers (1/4) Source: OECD (1999).

28
Table A1.2 presents the evolution of the EPL indices in the SEE countries. The calculations are based on labor codes (as amended up to a certain year) and other (mainly national) sources that were available to the author.
Table A1.2: Employment Protection Legislation
Regular Temporary Collective EPL Year employment employment dismissals index
Albania (ALB)
1995 2.1 3.0 2.8 2.6
Bosnia and Herzegovina (BIH)1
1999
2000
2003
2.2
1.8
1.8
4.3
3.1
3.1
3.0
3.3
3.3
3.2
2.6
2.6
Bulgaria (BGD)
1996
2001
2003
2.0
1.9
2.2
3.9
3.4
3.4
2.6
2.6
2.6
2.9
2.6
2.7
Croatia (HRV)
1996
2001
2003
2.8
2.8
2.6
3.9
3.9
1.9
5.0
5.0
4.3
3.6
3.6
2.6
Macedonia (MKD)2
1995
2000
2003
2.1
2.1
2.0
4.3
4.3
3.1
4.8
4.0
4.0
3.4
3.3
2.8
Romania (ROM) 2003
1.7 3.0 4.8 2.8
Serbia and Montenegro (SCG)3
2001
2.2 3.1 3.8 2.9
1/ Based on the labor code of the Federation of Bosnia and Herzegovina. 2/ The Macedonian labor code was adopted in 1993 and has been amended many times since then. Only the amendments that had an effect on the EPL index are presented in the table. 3/ Based on the labor code of the Republic of Serbia. Tables A1.3 to A1.5 present detailed information that form the basis for the indicators of EPL for selected years. Detailed information used to calculate the EPL indices for the other years shown in Table A1.2 are available from the author upon request.

29
Table A1.3. EPL Index: Dismissal Regulation for Permanent Employees (12 indicators)
Regular proceduresa Notice and severance pay for no-fault
individualsa,b Difficulty of dismissal
Notice period after Severance pay after Definition of unfair Trial period Compensation Extent of Proceduresc Delay to start of noticed 9m 4y 20y 9m 4y 20y dismissale before eligibility at 20y of tenure f re-admissiong
Scale 0-3 Days Months Scale 0-3 Months Months Scale 0-3 ALB 1995 1 13 1 2 3 0 2 10 0 3 16 0 BIH 2000 1 1 0.5 0.5 0.5 0 1.3 3 2 6 9 2 BGD 2001 1.8 1 1 1 2 1 1 6 0 6 6 2 HRV 2001 2 7 0.5 2 6 0 2 10 2 6 15 2 MKD 2000 1.5 4.5 1 1 3 0 1 5 1.5 - 6 2 ROM 2003 2 1 0.5 0.5 0.5 0 0 0 2 3 6 0 SCG 2001 2 7 0 0 0 1.5 1.8 3.5 1.5 3 6 2
- Not legally regulated. a) Averages are taken where different situations apply (e.g. dismissals for personal reasons and for redundancy). b) Where relevant, calculations assumed that the worker was 35 years old at the start of employment. c) Procedures are scored according to the following scale: 1 when a written statement of the reasons for dismissal must be supplied to the employee; 2 when a third party
(such as a works council) must be notified; and 3 when the employer cannot proceed to dismissal without authorization from a third party. d) Estimated time includes an assumption of 6 days in case of required warning procedure prior to dismissal. One day is counted when dismissal can be notified orally or
the notice can be directly handed to the employee, 2 when a letter needs to be sent by mail, and 3 when a registered letter needs to be sent. e) Scores 0 when worker capability or redundancy of the job are adequate and sufficient grounds for dismissal; 1 when social considerations, age or job tenure must when
possible influence the choice of which worker(s) to dismiss; 2 when a transfer and/or retraining to adapt the worker to different work must be attempted prior to dismissal; and 3 when worker capability cannot be a ground for dismissal.
f) Where relevant, calculations assume that the worker was 35 years old at the start of employment and that a court case takes 6 months on average. g) The extent of reinstatement is based upon whether, after finding of unfair dismissal, the employee has the option of reinstatement into his/her previous job. The indicator
is 1 when this option is rarely made available to the employee, 2 when it is fairly often made available, and 3 when it is always made available.

30
Table A1.4. EPL Index: Regulation for Temporary Forms of Employment (6 indicators).
Fixed-Term Contracts Temporary Work Agencies (TWA) Valid reasons for use Types of activities for Maximum other than Maximum number of Maximum which agency can be Restrictions on accumulated duration ‘objective reasons’a consecutive contractsc accumulated duration hired renewals of contracts Scale 0-3b Number Months Scale 0-4d Yes/No Months
ALB 1995 2.5 no limit no limit 0 na na BIH 2000 3 no limit 24 0 na na BGD 2001 2 no limit 36 0 na na HRV 2001 1 no limit 36 0 na na MKD 2000 0 no limit no limit 0 na na ROM 2003 1 3 18 2 Yes 18 SCG 2001 2.5 no limit 36 0 na na
na Not applicable. a) All countries recognize the validity of fixed-term contracts in “objective” situations, a term which typically refers to specific projects, seasonal work, replacement of
temporary absent permanent workers, and exceptional workload. b) Scored 0 if fixed-term contracts are permitted only for “objective” or “material” reasons; 1 if specific exemptions apply to situations of employer need or employee need;
2 when exemptions exist on both the employer and the employee side; 3 when there are no restrictions on the use of fixed-term contracts. c) The law in most countries does not specify any limits to the number of fixed-term contracts. d) Scored 0 if TWA employment is not legally regulated, 1 to 3 depending upon the degree of restrictions, and 4 when no restrictions apply.
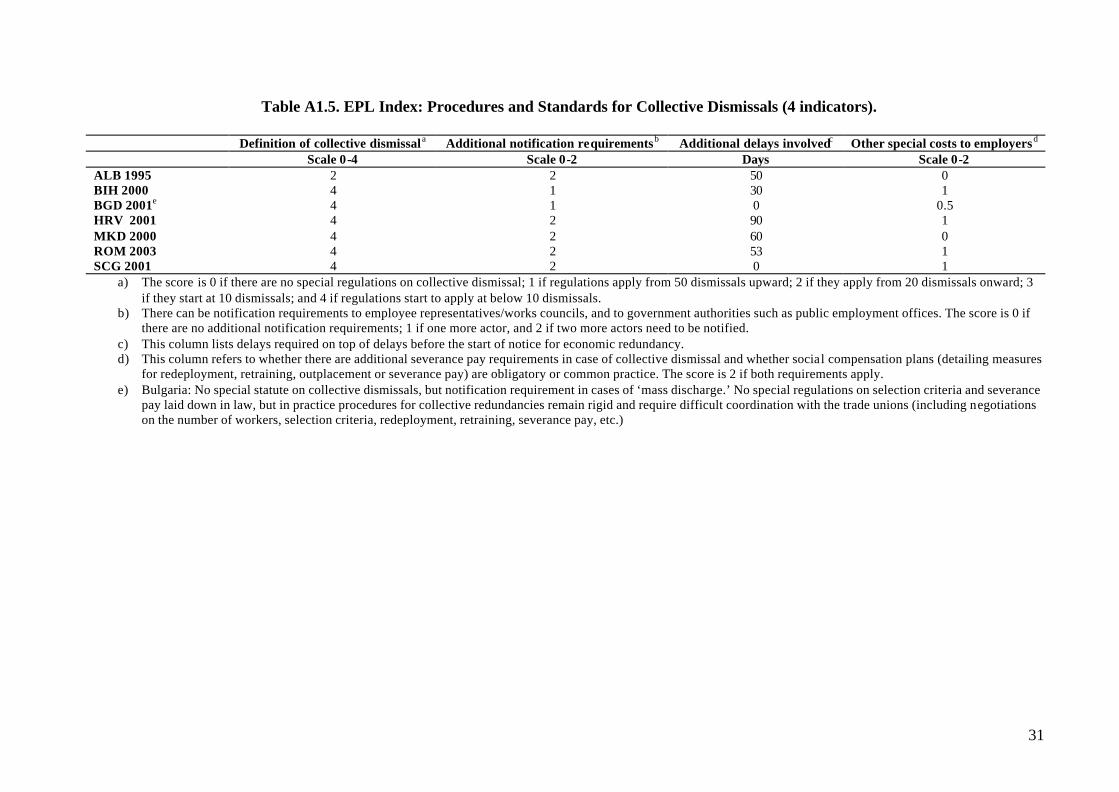
31
Table A1.5. EPL Index: Procedures and Standards for Collective Dismissals (4 indicators).
Definition of collective dismissala Additional notification requirementsb Additional delays involvedc Other special costs to employersd Scale 0-4 Scale 0-2 Days Scale 0-2
ALB 1995 2 2 50 0 BIH 2000 4 1 30 1 BGD 2001e 4 1 0 0.5 HRV 2001 4 2 90 1 MKD 2000 4 2 60 0 ROM 2003 4 2 53 1 SCG 2001 4 2 0 1
a) The score is 0 if there are no special regulations on collective dismissal; 1 if regulations apply from 50 dismissals upward; 2 if they apply from 20 dismissals onward; 3 if they start at 10 dismissals; and 4 if regulations start to apply at below 10 dismissals.
b) There can be notification requirements to employee representatives/works councils, and to government authorities such as public employment offices. The score is 0 if there are no additional notification requirements; 1 if one more actor, and 2 if two more actors need to be notified.
c) This column lists delays required on top of delays before the start of notice for economic redundancy. d) This column refers to whether there are additional severance pay requirements in case of collective dismissal and whether social compensation plans (detailing measures
for redeployment, retraining, outplacement or severance pay) are obligatory or common practice. The score is 2 if both requirements apply. e) Bulgaria: No special statute on collective dismissals, but notification requirement in cases of ‘mass discharge.’ No special regulations on selection criteria and severance
pay laid down in law, but in practice procedures for collective redundancies remain rigid and require difficult coordination with the trade unions (including negotiations on the number of workers, selection criteria, redeployment, retraining, severance pay, etc.)

32
Appendix 2
Table A2.1. Labor Market Institutions and Policies: Correlation Matrix
EPL EPL_R EPL_T EPL_C BEN_R BEN_D ACT_P UNION TAX EPL_R .73*** 1 EPL_T .89*** .40** 1 EPL_C .41** .19 .17 1 BEN_R .24 .16 .19 .23 1 BEN_D -.25 -.18 -.12 -.42** .05 1 ACT_P -.03 .34* -.28 .24 .15 .12 1 UNION .09 .04 -.04 .43** .29 .02 .31* 1
TAX .53*** .32* .44*** .45*** -.01 -.47*** .18 .17 1 The sample consists of 37 countries: 24 OECD countries, 6 CEE countries (Czech Republic, Estonia, Hungary, Poland, Slovakia, and Slovenia), and 7 SEE countries (Albania, Bulgaria, Bosnia and Herzegovina, Croatia, Macedonia, Romania, and Serbia and Montenegro). * , ** and *** denote correlation coefficients significant at 10%, 5% and 1% levels respectively. EPL is the index of employment protection legislation; EPL_R, EPL_T, and EPL_C are the indices of legislation on regular employment, temporary employment, and collective dismissals, respectively; BEN_R is the benefit replacement rate; BEN_D is the benefit duration; ACT_P is the spending on active policies per unemployed; UNION is union density; TAX is the payroll tax rate.
Table A2.2. Male Unemployment and Institutional Variables: Robustness Checks Min1 Max1 p < 0.12 Strictness of EPL Regular employment -0.452 -0.074 2 Temporary employment 0.143 0.323 9 Collective dismissals -0.058 0.067 0 Overall EPL -0.331 0.457 1 Benefit Replacement Rate 0.002 0.008 0 Benefit Duration -0.053 0.048 0 Active Policies -0.352 0.196 0 Union Density 0.005 0.008 0 Payroll Tax 0.007 0.017 6 The sample consists of 37 countries: 24 OECD countries, 6 CEE countries (Czech Republic, Estonia, Hungary, Poland, Slovakia, and Slovenia), and 7 SEE countries (Albania, Bulgaria, Bosnia and Herzegovina, Croatia, Macedonia, Romania, and Serbia and Montenegro). The dependent variable is log of male unemployment rate averaged over the period 1995-2000. All regressions include a constant. 1 Min (Max) is the minimum (maximum) value of the coefficient in the regressions. 2 Number of regressions in which the coefficient has a p-value less than 10%.

33
Table A2.3. Female Unemployment and Institutional Variables: Robustness Checks Min1 Max1 p < 0.12 Strictness of EPL Regular employment -0.361 0.150 1 Temporary employment 0.182 0.261 8 Collective dismissals 0.023 0.171 1 Overall EPL -0.026 0.534 8 Benefit Replacement Rate -0.008 -0.001 0 Benefit Duration -0.074 -0.021 0 Active Policies -0.556 0.131 0 Union Density -0.005 0.004 0 Payroll Tax 0.009 0.018 7 The sample consists of 37 countries: 24 OECD countries, 6 CEE countries (Czech Republic, Estonia, Hungary, Poland, Slovakia, and Slovenia), and 7 SEE countries (Albania, Bulgaria, Bosnia and Herzegovina, Croatia, Macedonia, Romania, and Serbia and Montenegro). The dependent variable is log of female unemployment rate averaged over the period 1995-2000. All regressions include a constant. 1 Min (Max) is the minimum (maximum) value of the coefficient in the regressions. 2 Number of regressions in which the coefficient has a p-value less than 10%.
Table A2.4. Youth Unemployment and Institutional Variables: Robustness Checks Min1 Max1 p < 0.12 Strictness of EPL Regular employment -0.150 0.108 1 Temporary employment 0.215 0.319 9 Collective dismissals -0.005 0.203 5 Overall EPL -0.030 0.674 7 Benefit Replacement Rate -0.007 0.004 0 Benefit Duration -0.088 -0.002 0 Active Policies -0.580 0.191 0 Union Density 0.002 0.007 0 Payroll Tax 0.016 0.026 9 The sample consists of 37 countries: 24 OECD countries, 6 CEE countries (Czech Republic, Estonia, Hungary, Poland, Slovakia, and Slovenia), and 7 SEE countries (Albania, Bulgaria, Bosnia and Herzegovina, Croatia, Macedonia, Romania, and Serbia and Montenegro). The dependent variable is log of youth unemployment rate (ages 15-24) averaged over the period 1995-2000. All regressions include a constant. 1 Min (Max) is the minimum (maximum) value of the coefficient in the regressions. 2 Number of regressions in which the coefficient has a p-value less than 10%.

34
Table A2.5. Long-Term Unemployment and Institutional Variables: Robustness Checks Min1 Max1 p < 0.12 Strictness of EPL Regular employment -0.646 0.390 3 Temporary employment 0.276 0.484 8 Collective dismissals 0.141 0.412 6 Overall EPL 0.247 1.096 8 Benefit Replacement Rate -0.014 -0.003 0 Benefit Duration -0.185 0.015 0 Active Policies -0.571 0.845 0 Union Density 0.007 0.017 3 Payroll Tax 0.018 0.033 8 The sample consists of 37 countries: 24 OECD countries, 6 CEE countries (Czech Republic, Estonia, Hungary, Poland, Slovakia, and Slovenia), and 7 SEE countries (Albania, Bulgaria, Bosnia and Herzegovina, Croatia, Macedonia, Romania, and Serbia and Montenegro). The dependent variable is log of long-term unemployment rate (unemployed more than a year) averaged over the period 1995-2000. All regressions include a constant. 1 Min (Max) is the minimum (maximum) value of the coefficient in the regressions. 2 Number of regressions in which the coefficient has a p-value less than 10%.
Table A2.6. Employment and Institutional Variables: Robustness Checks Min1 Max1 p < 0.12 Strictness of EPL Regular employment -3.241 5.212 1 Temporary employment -4.972 -3.507 9 Collective dismissals -2.758 0.528 1 Overall EPL -9.975 0.084 8 Benefit Replacement Rate 0.028 0.153 2 Benefit Duration 0.255 2.316 0 Active Policies -1.987 11.006 0 Union Density -0.028 0.060 0 Payroll Tax -0.352 -0.214 9 The sample consists of 37 countries: 24 OECD countries, 6 CEE countries (Czech Republic, Estonia, Hungary, Poland, Slovakia, and Slovenia), and 7 SEE countries (Albania, Bulgaria, Bosnia and Herzegovina, Croatia, Macedonia, Romania, and Serbia and Montenegro). The dependent variable is employment/population ratio (for persons aged 15-64 years) averaged over the period 1995-2000. All regressions include a constant. 1 Min (Max) is the minimum (maximum) value of the coefficient in the regressions. 2 Number of regressions in which the coefficient has a p-value less than 10%.

35
Table A2.7. Female Employment and Institutional Variables: Robustness Checks Min1 Max1 p < 0.12 Strictness of EPL Regular employment -3.716 5.195 1 Temporary employment -6.407 -4.075 9 Collective dismissals -2.238 2.188 0 Overall EPL -11.115 1.890 8 Benefit Replacement Rate 0.054 0.171 0 Benefit Duration 0.876 2.009 0 Active Policies 0.697 13.696 0 Union Density 0.058 0.148 0 Payroll Tax -0.283 -0.120 5 The sample consists of 37 countries: 24 OECD countries, 6 CEE countries (Czech Republic, Estonia, Hungary, Poland, Slovakia, and Slovenia), and 7 SEE countries (Albania, Bulgaria, Bosnia and Herzegovina, Croatia, Macedonia, Romania, and Serbia and Montenegro). The dependent variable is female employment/population ratio (for women aged 15-64 years) averaged over the period 1995-2000. All regressions include a constant. 1 Min (Max) is the minimum (maximum) value of the coefficient in the regressions. 2 Number of regressions in which the coefficient has a p-value less than 10%.
Table A2.8. Activity and Institutional Variables: Robustness Checks Min1 Max1 p < 0.12 Strictness of EPL Regular employment -2.995 6.127 1 Temporary employment -5.804 -4.056 9 Collective dismissals -2.490 1.079 0 Overall EPL -10.593 2.160 8 Benefit Replacement Rate -0.093 0.050 0 Benefit Duration 0.546 2.433 3 Active Policies 2.738 15.976 4 Union Density -0.060 1.348 0 Payroll Tax -0.360 -0.181 9 The sample consists of 37 countries: 24 OECD countries, 6 CEE countries (Czech Republic, Estonia, Hungary, Poland, Slovakia, and Slovenia), and 7 SEE countries (Albania, Bulgaria, Bosnia and Herzegovina, Croatia, Macedonia, Romania, and Serbia and Montenegro). The dependent variable is labor force participation rate (for persons aged 15-64 years) averaged over the period 1995-2000. All regressions include a constant. 1 Min (Max) is the minimum (maximum) value of the coefficient in the regressions. 2 Number of regressions in which the coefficient has a p-value less than 10%.

36
Table A2.9. Female Activity and Institutional Variables: Robustness Checks Min1 Max1 p < 0.12 Strictness of EPL Regular employment -3.518 6.978 1 Temporary employment -8.317 -4.733 9 Collective dismissals -2.144 1.079 0 Overall EPL -12.507 4.521 8 Benefit Replacement Rate -0.100 0.092 0 Benefit Duration 1.187 2.877 3 Active Policies 5.025 20.299 4 Union Density 0.011 0.102 0 Payroll Tax -0.358 -0.148 7 The sample consists of 37 countries: 24 OECD countries, 6 CEE countries (Czech Republic, Estonia, Hungary, Poland, Slovakia, and Slovenia), and 7 SEE countries (Albania, Bulgaria, Bosnia and Herzegovina, Croatia, Macedonia, Romania, and Serbia and Montenegro). The dependent variable is female labor force participation rate (for women aged 15-64 years) averaged over the period 1995-2000. All regressions include a constant. 1 Min (Max) is the minimum (maximum) value of the coefficient in the regressions. 2 Number of regressions in which the coefficient has a p-value less than 10%.