Embed Size (px)
Citation preview
Christof Rühl, Group Chief Economist
January 2013
© BP 2013
Contents
Introduction
Global energy trends
Outlook 2030: Fuel by fuel
Implications
Energy Outlook 2030
© BP 2013
Introduction
Global energy trends
Outlook 2030: Fuel by fuel
Implications
Energy Outlook 2030
© BP 2013
0
3
6
9
12
1990 2010 2030
OECD non-OECD
0
2
4
6
8
1990 2010 2030
OECD Non-OECD
0
25
50
75
100
1990 2010 2030
OECD Non-OECD
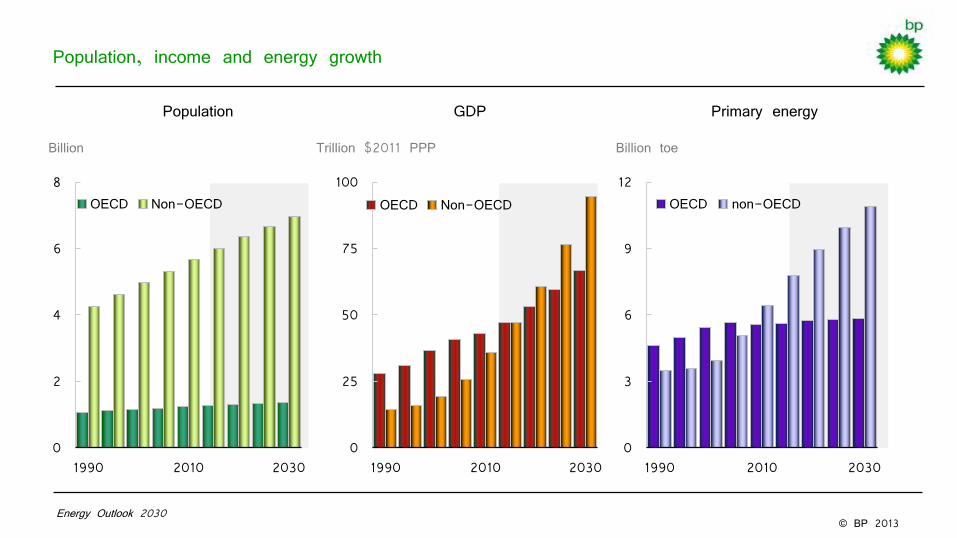
Population, income and energy growth
Energy Outlook 2030
Billion
Population GDP
Trillion $2011 PPP Billion toe
Primary energy
© BP 2013
0
3
6
9
12
15
18
1990 2010 2030
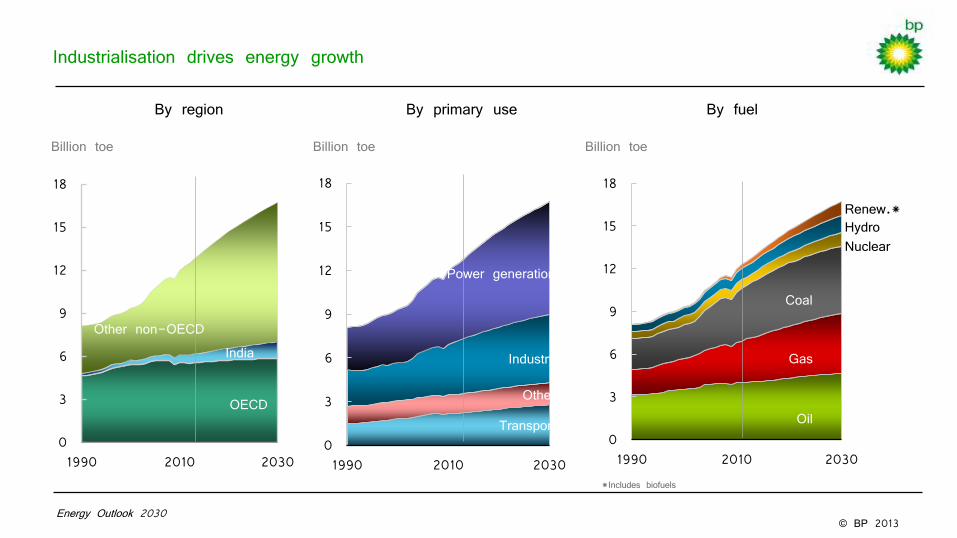
Industrialisation drives energy growth
Billion toe
Energy Outlook 2030
OECD
0
3
6
9
12
15
18
1990 2010 2030
Other
Power generation
Transport
By primary use By fuel By region
Oil
Coal
Gas
Billion toe Billion toe
Industry
0
3
6
9
12
15
18
1990 2010 2030
Hydro Nuclear
Renew.*
Oil
Coal
Gas
*Includes biofuels
Other non-OECD India
© BP 2013
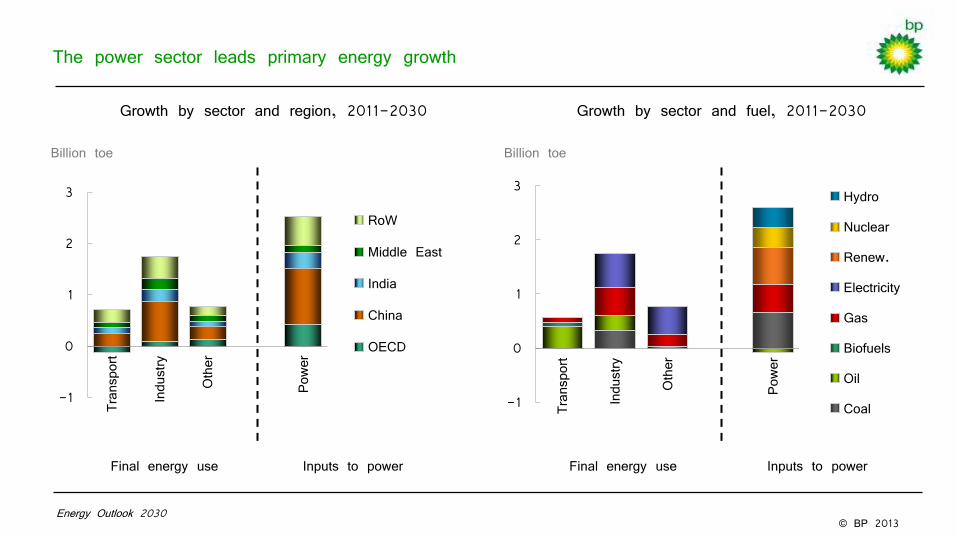
The power sector leads primary energy growth
Growth by sector and fuel, 2011-2030 Growth by sector and region, 2011-2030
-1
0
1
2
3
Transport
Industry
Other
Power
Hydro
Nuclear
Renew.
Electricity
Gas
Biofuels
Oil
Coal
Final energy use Inputs to power
Billion toe
-1
0
1
2
3
Transport
Industry
Other
Power
RoW
Middle East
India
China
OECD
Final energy use Inputs to power
Billion toe
Energy Outlook 2030

© BP 2013
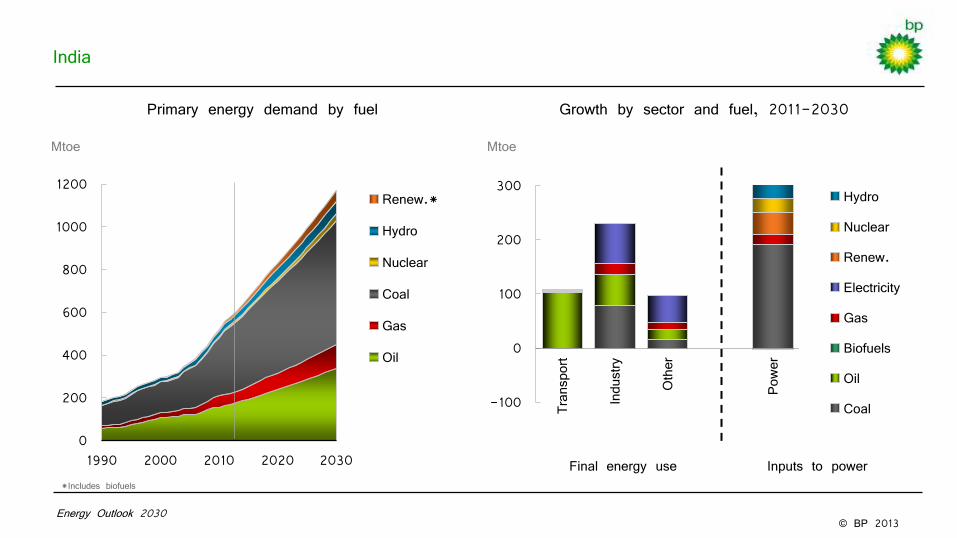
India
Mtoe
Energy Outlook 2030
Growth by sector and fuel, 2011-2030 Primary energy demand by fuel
Oil
Coal
Gas
0
200
400
600
800
1000
1200
1990 2000 2010 2020 2030
Renew.*
Hydro
Nuclear
Coal
Gas
Oil
*Includes biofuels
-100
0
100
200
300
Transport
Industry
Other
Power
Hydro
Nuclear
Renew.
Electricity
Gas
Biofuels
Oil
Coal
Final energy use Inputs to power
Mtoe
© BP 2013
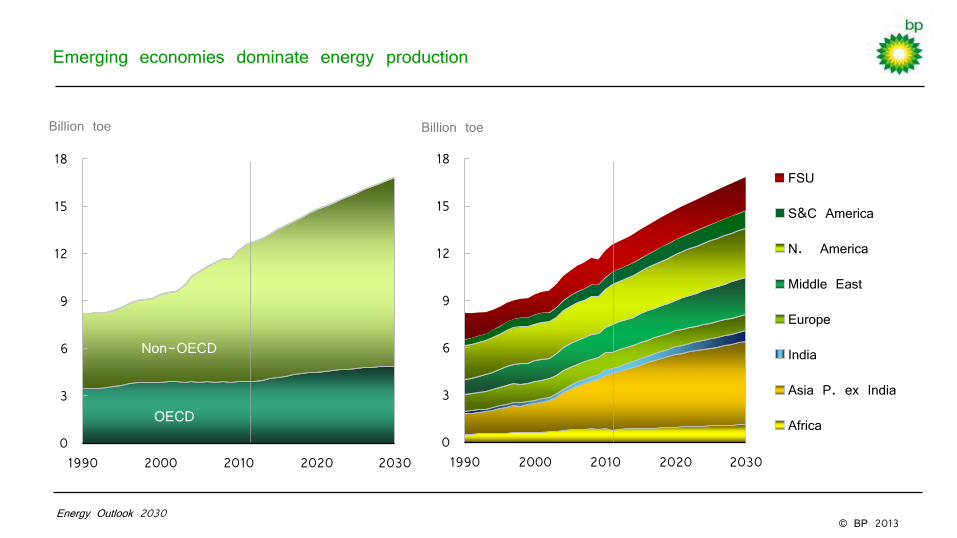
0
3
6
9
12
15
18
1990 2000 2010 2020 2030
FSU
S&C America
N. America
Middle East
Europe
India
Asia P. ex India
Africa
Emerging economies dominate energy production
OECD
Non-OECD
Billion toe
Energy Outlook 2030
0
3
6
9
12
15
18
1990 2000 2010 2020 2030
OECD
Non-OECD
Billion toe
© BP 2013 Energy Outlook 2030
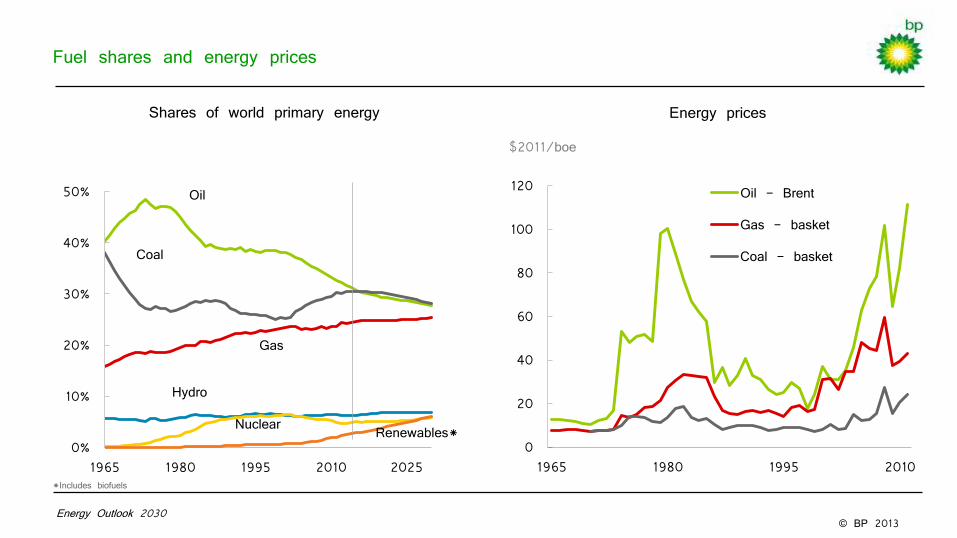
Shares of world primary energy
0%
10%
20%
30%
40%
50%
1965 1980 1995 2010 2025
Oil
Coal
Gas
Hydro
Nuclear Renewables*
*Includes biofuels
Fuel shares and energy prices
0
20
40
60
80
100
120
1965 1980 1995 2010
Oil - Brent
Gas - basket
Coal - basket
Energy prices
$2011/boe
© BP 2013 Energy Outlook 2030
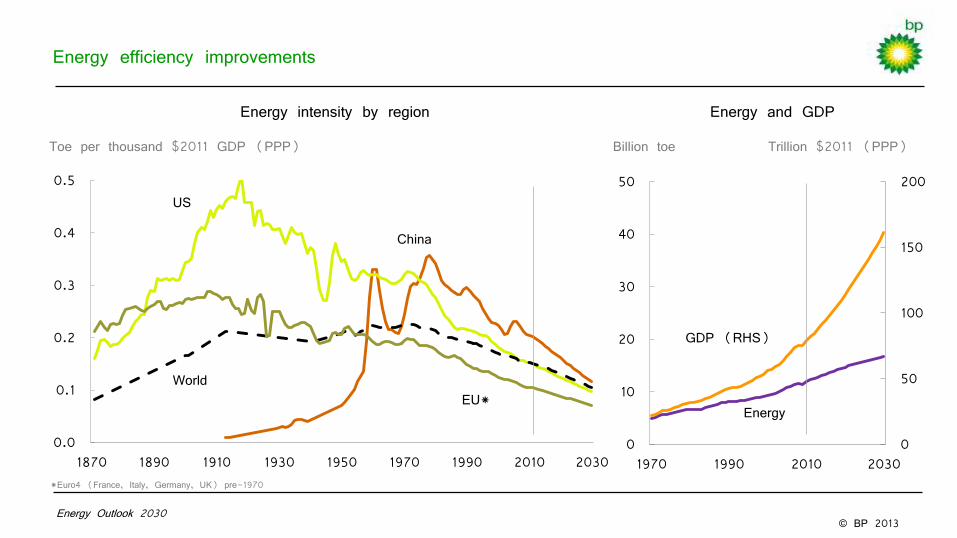
0.0
0.1
0.2
0.3
0.4
0.5
1870 1890 1910 1930 1950 1970 1990 2010 2030
Energy intensity by region
Toe per thousand $2011 GDP (PPP)
China
US
World EU*
0
50
100
150
200
0
10
20
30
40
50
1970 1990 2010 2030
GDP (RHS)
Energy
Energy and GDP
Billion toe Trillion $2011 (PPP)
Energy efficiency improvements
*Euro4 (France, Italy, Germany, UK) pre-1970

© BP 2013 Energy Outlook 2030
0.0
0.1
0.2
0.3
0.4
0.5
1870 1890 1910 1930 1950 1970 1990 2010 2030
Energy intensity by region
Toe per thousand $2011 GDP (PPP)
China
US
World
EU*
0
50
100
150
200
0
10
20
30
40
50
1970 1990 2010 2030
GDP (RHS)
Energy
Energy and GDP
Billion toe Trillion $2011 (PPP)
Energy efficiency improvements
*Euro4 (France, Italy, Germany, UK) pre-1970
India
© BP 2013
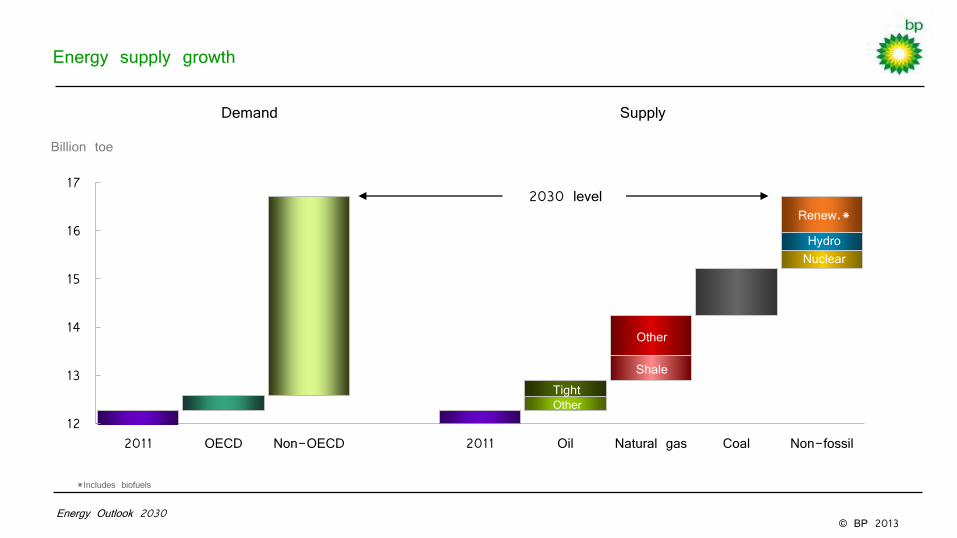
Energy supply growth
12
13
14
15
16
17
2011 OECD Non-OECD 2011 Oil Natural gas Coal Non-fossil
Demand Supply
Energy Outlook 2030
Tight Other
Shale
Other
Nuclear Hydro
Renew.*
Billion toe
2030 level
*Includes biofuels
© BP 2013
0
20
40
60
Asia Pacific
N. America
S. &
C. Am
erica
Africa
Europe &
Eurasia
Middle East
Gas Oil
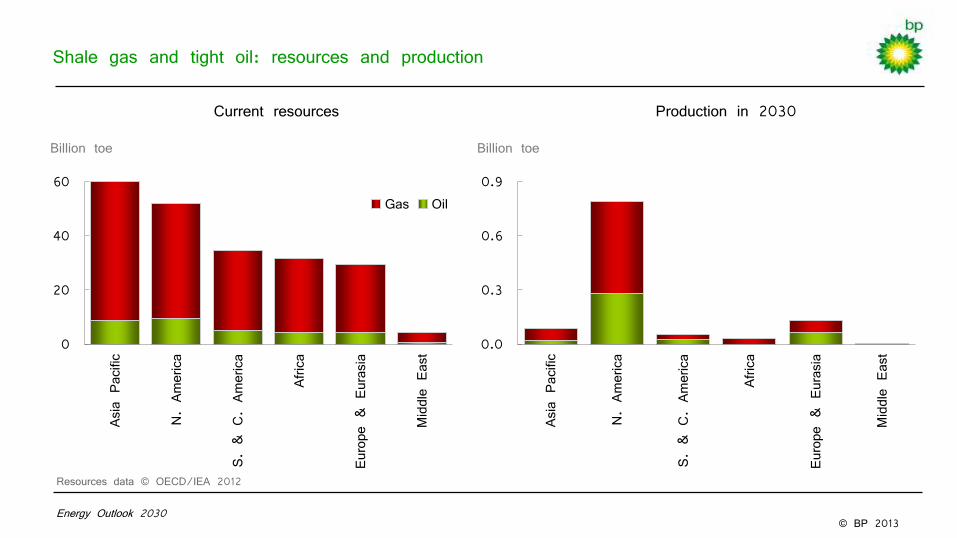
Shale gas and tight oil: resources and production
Billion toe
Current resources Production in 2030
Energy Outlook 2030
0.0
0.3
0.6
0.9
Asia Pacific
N. America
S. &
C. Am
erica
Africa
Europe &
Eurasia
Middle East
Billion toe
Resources data © OECD/IEA 2012
© BP 2013
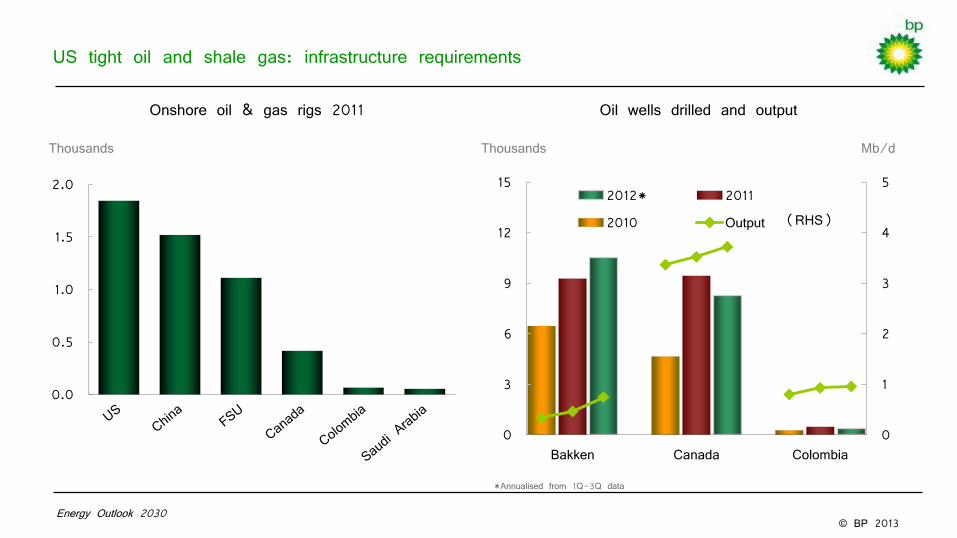
US tight oil and shale gas: infrastructure requirements
Onshore oil & gas rigs 2011
Thousands
Oil wells drilled and output
0
1
2
3
4
5
0
3
6
9
12
15
Bakken Canada Colombia
2012* 2011
2010 Output
Mb/d
Energy Outlook 2030
(RHS)
0.0
0.5
1.0
1.5
2.0
Thousands
*Annualised from 1Q-3Q data
© BP 2013
Introduction
Global energy trends
Outlook 2030: Fuel by fuel
Implications
Energy Outlook 2030
© BP 2013
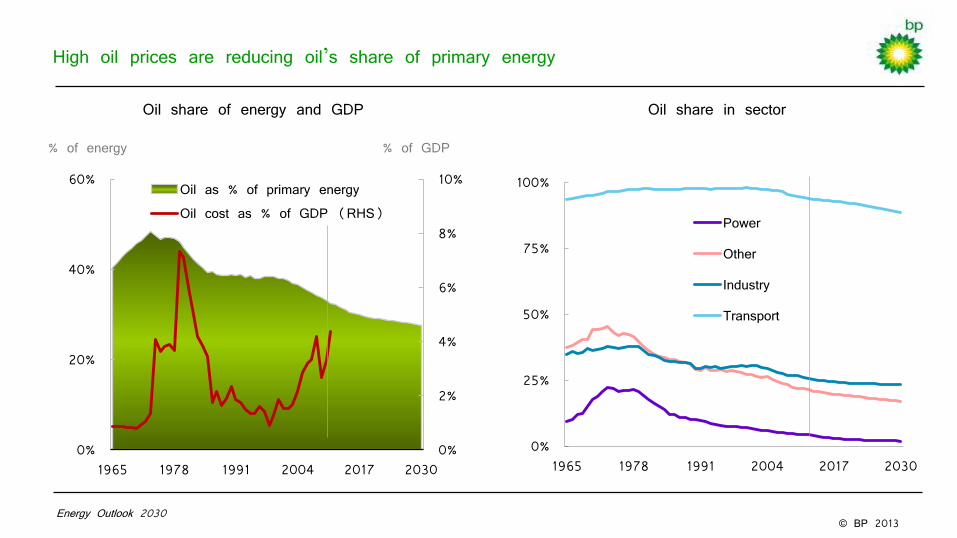
0%
2%
4%
6%
8%
10%
0%
20%
40%
60%
1965 1978 1991 2004 2017 2030
Oil as % of primary energy Oil cost as % of GDP (RHS)
High oil prices are reducing oil’s share of primary energy
0%
25%
50%
75%
100%
1965 1978 1991 2004 2017 2030
Power
Other
Industry
Transport
% of energy
Oil share in sector Oil share of energy and GDP
% of GDP
Energy Outlook 2030
© BP 2013
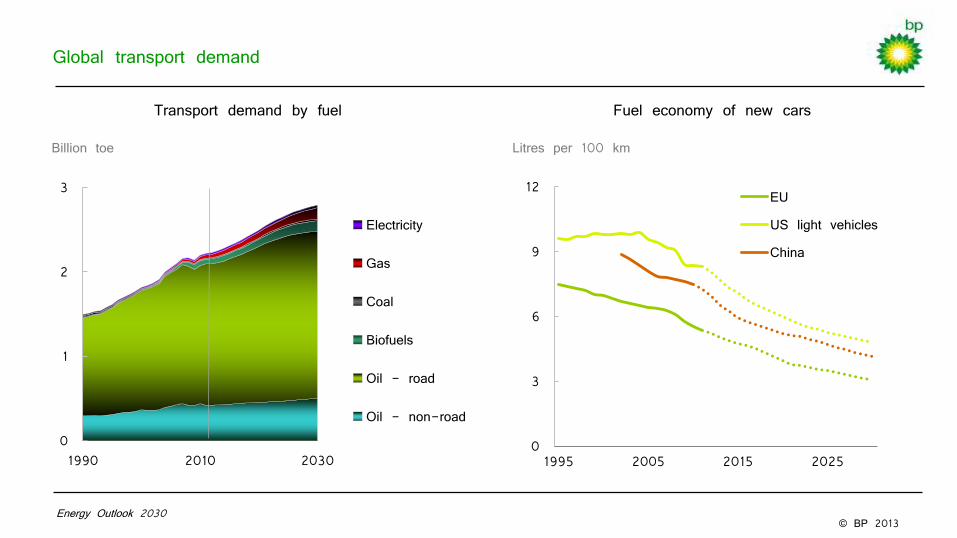
0
1
2
3
1990 2010 2030
Electricity
Gas
Coal
Biofuels
Oil - road
Oil - non-road
0
3
6
9
12
1995 2005 2015 2025
EU
US light vehicles
China
Global transport demand
Transport demand by fuel
Billion toe
Fuel economy of new cars
Litres per 100 km
Energy Outlook 2030
© BP 2013
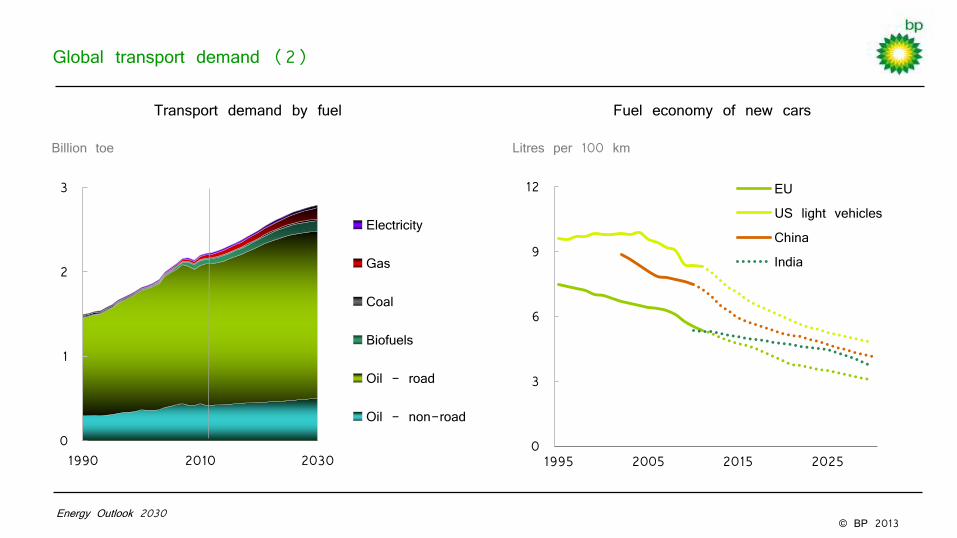
0
1
2
3
1990 2010 2030
Electricity
Gas
Coal
Biofuels
Oil - road
Oil - non-road
0
3
6
9
12
1995 2005 2015 2025
EU US light vehicles China India
Global transport demand (2)
Transport demand by fuel
Billion toe
Fuel economy of new cars
Litres per 100 km
Energy Outlook 2030
© BP 2013
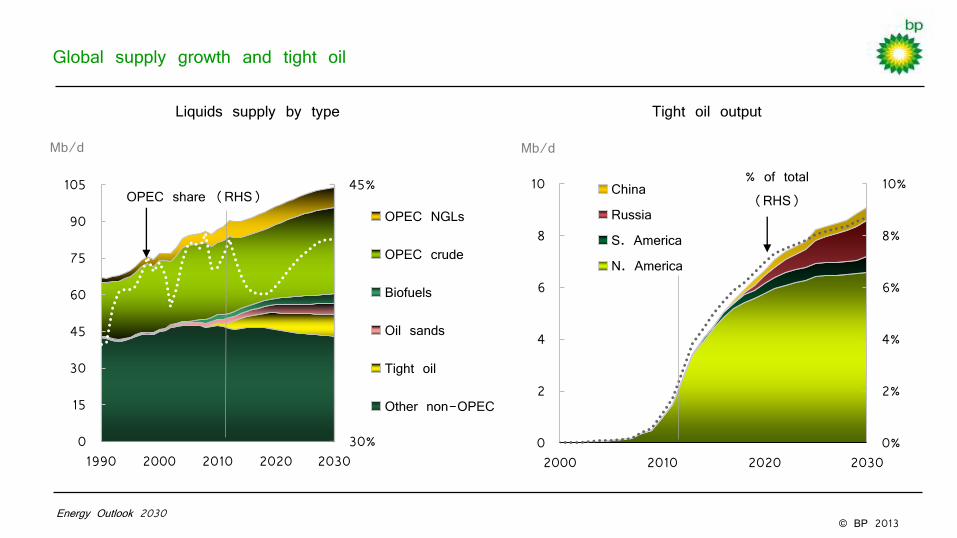
0%
2%
4%
6%
8%
10%
0
2
4
6
8
10
2000 2010 2020 2030
China
Russia
S. America
N. America
Liquids supply by type
30%
45%
0
15
30
45
60
75
90
105
1990 2000 2010 2020 2030
OPEC NGLs
OPEC crude
Biofuels
Oil sands
Tight oil
Other non-OPEC
Mb/d
NGLs
OPEC share (RHS)
Global supply growth and tight oil
Energy Outlook 2030
Tight oil output
% of total (RHS)
Mb/d
© BP 2013
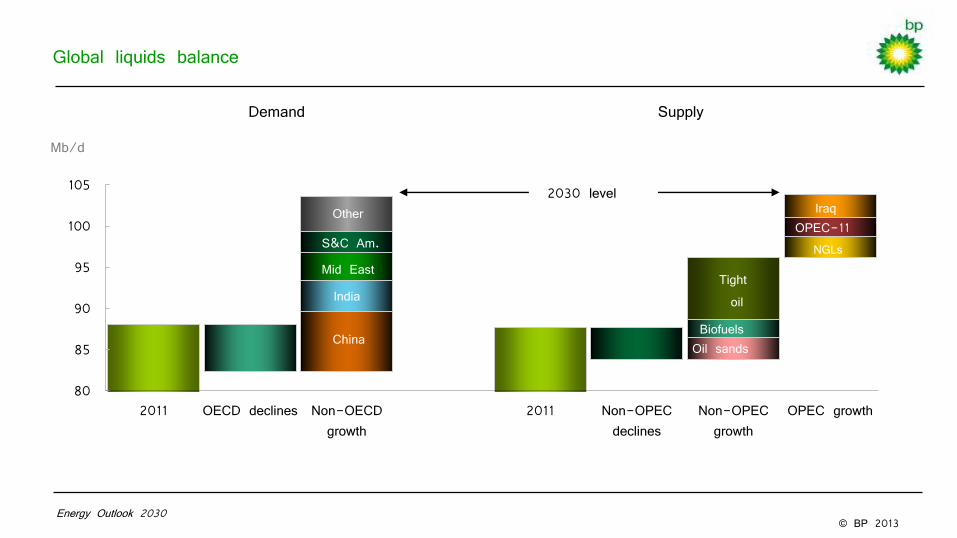
Global liquids balance
80
85
90
95
100
105
2011 OECD declines Non-OECD growth
2011 Non-OPEC declines
Non-OPEC growth
OPEC growth
Mb/d
Demand Supply
India
Mid East
China
NGLs OPEC-11
Other
S&C Am.
NGLs
Iraq 2030 level
Energy Outlook 2030
Tight oil
Biofuels Oil sands
© BP 2013
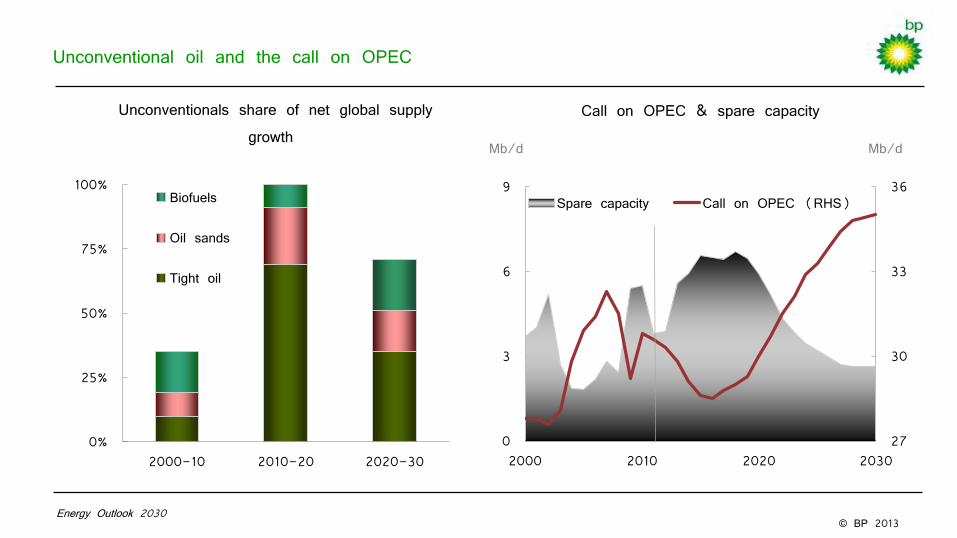
27
30
33
36
0
3
6
9
2000 2010 2020 2030
Spare capacity Call on OPEC (RHS)
Unconventional oil and the call on OPEC
Mb/d
Call on OPEC & spare capacity
Mb/d
Unconventionals share of net global supply growth
0%
25%
50%
75%
100%
2000-10 2010-20 2020-30
Biofuels
Oil sands
Tight oil
Energy Outlook 2030

© BP 2013
Shale gas and global supply growth
Energy Outlook 2030
Bcf/d
Gas production by type and region
0
100
200
300
400
500
1990 2000 2010 2020 2030
Non-OECD other
Non-OECD shale
OECD shale
OECD other
0%
6%
12%
18%
0
20
40
60
80
1990 2000 2010 2020 2030
RoW China
Europe & Eurasia Canada & Mexico
US
Shale gas production
Bcf/d
% of total (RHS)
© BP 2013 Energy Outlook 2030
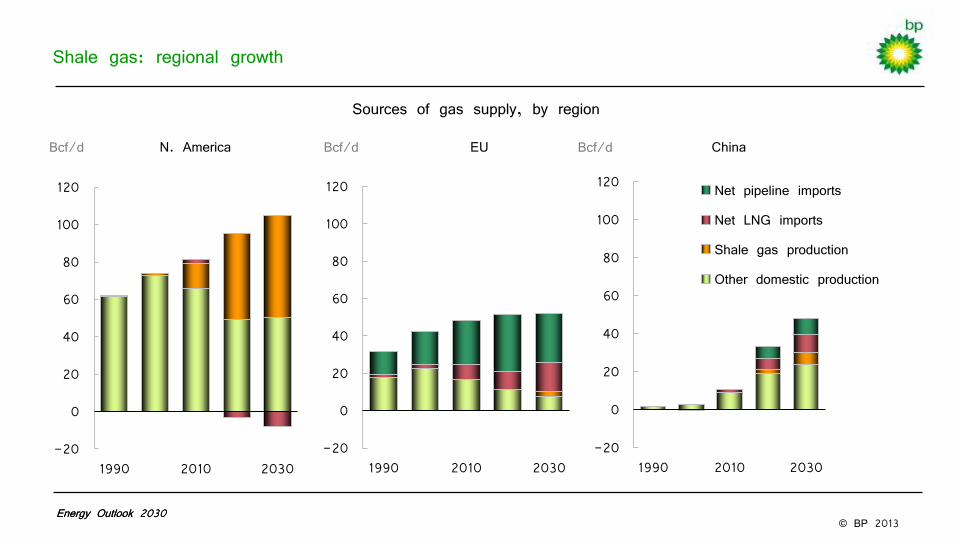
-20
0
20
40
60
80
100
120
1990 2010 2030
Net pipeline imports
Net LNG imports
Shale gas production
Other domestic production
Energy Outlook 2030
Shale gas: regional growth
Bcf/d China Bcf/d N. America Bcf/d EU
Sources of gas supply, by region
-20
0
20
40
60
80
100
120
1990 2010 2030 -20
0
20
40
60
80
100
120
1990 2010 2030
© BP 2013
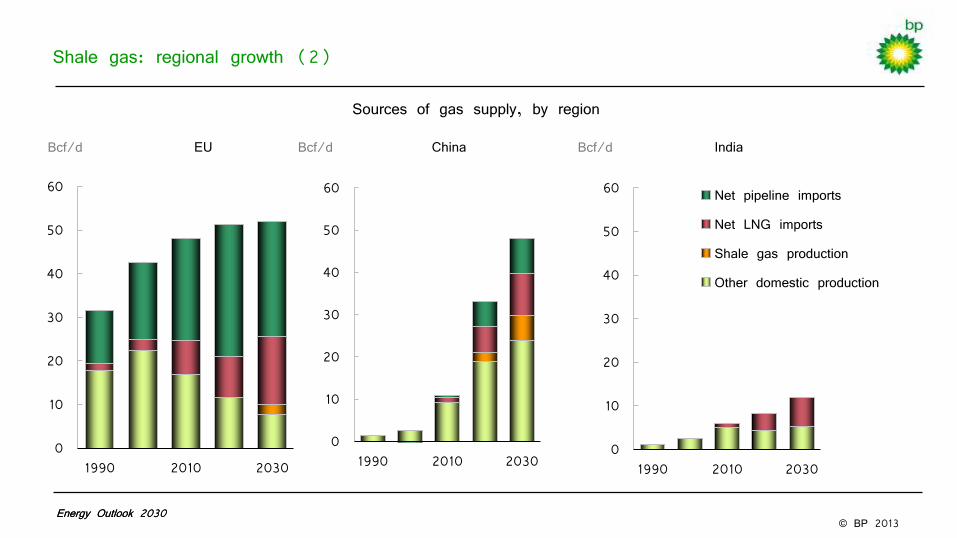
0
10
20
30
40
50
60
1990 2010 2030
Energy Outlook 2030
0
10
20
30
40
50
60
1990 2010 2030
Net pipeline imports
Net LNG imports
Shale gas production
Other domestic production
Energy Outlook 2030
Shale gas: regional growth (2)
Bcf/d India Bcf/d EU
Sources of gas supply, by region
0
10
20
30
40
50
60
1990 2010 2030
Bcf/d China
© BP 2013
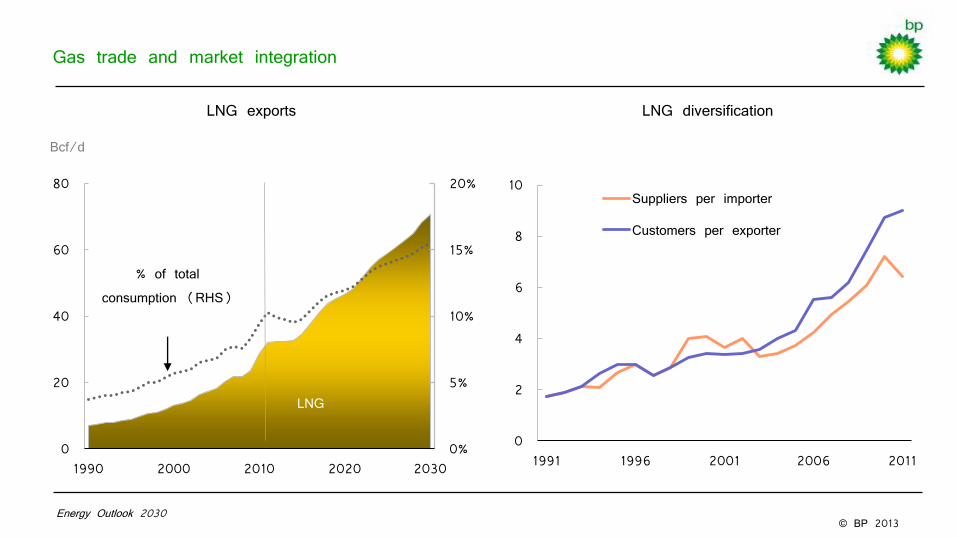
Gas trade and market integration
Energy Outlook 2030
0%
5%
10%
15%
20%
0
20
40
60
80
1990 2000 2010 2020 2030
LNG
Bcf/d
LNG exports
% of total consumption (RHS)
LNG diversification
0
2
4
6
8
10
1991 1996 2001 2006 2011
Suppliers per importer
Customers per exporter
© BP 2013 Energy Outlook 2030
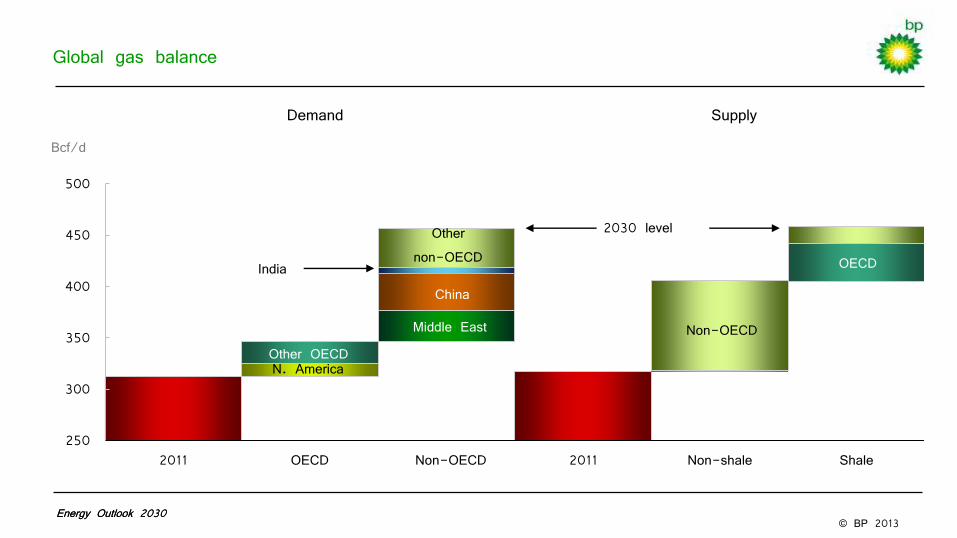
250
300
350
400
450
500
2011 OECD Non-OECD 2011 Non-shale Shale
N. America Other OECD
Middle East
China
Other non-OECD
Non-OECD
Energy Outlook 2030
Global gas balance
Bcf/d
Demand Supply
2030 level
OECD India
© BP 2013
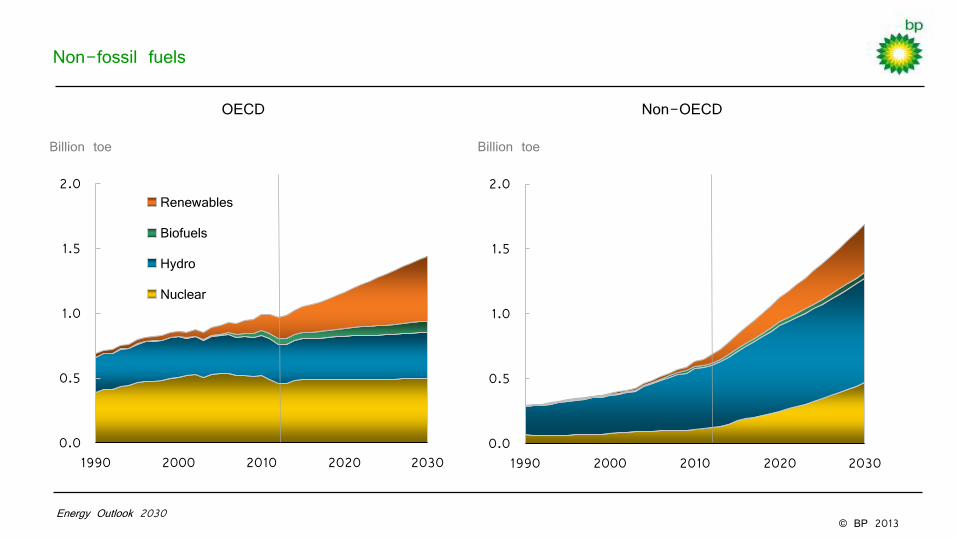
Non-fossil fuels
0.0
0.5
1.0
1.5
2.0
1990 2000 2010 2020 2030
Renewables
Biofuels
Hydro
Nuclear
Billion toe
Renewables in power
Biofuels
OECD
0.0
0.5
1.0
1.5
2.0
1990 2000 2010 2020 2030
Non-OECD
Billion toe
Energy Outlook 2030
© BP 2013
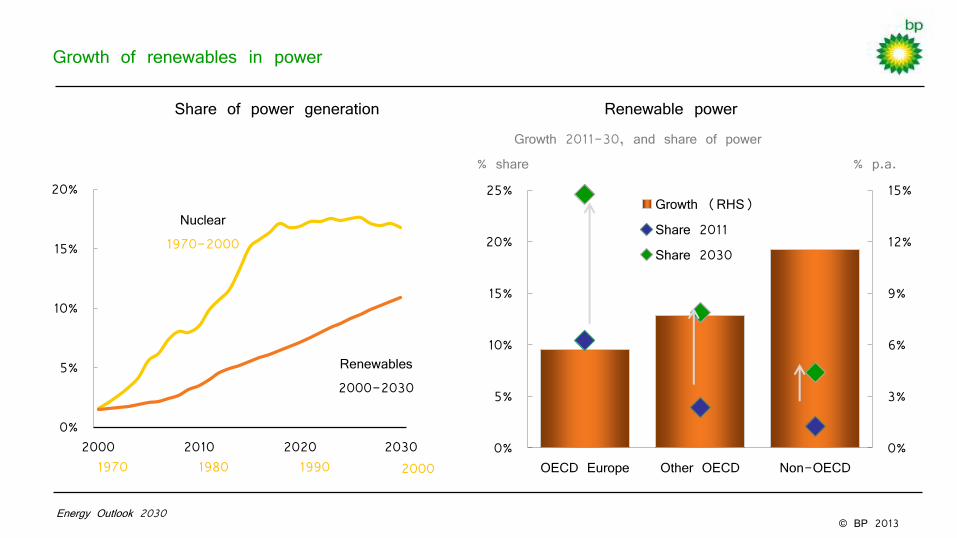
Growth of renewables in power
OECD
Non-OECD
0%
5%
10%
15%
20%
2000 2010 2020 2030
Nuclear 1970-2000
Renewables 2000-2030
1970 1980 1990 2000 0%
3%
6%
9%
12%
15%
0%
5%
10%
15%
20%
25%
OECD Europe Other OECD Non-OECD
Growth (RHS)
Share 2011
Share 2030
Renewable power
% p.a. % share
Share of power generation
Energy Outlook 2030
Growth 2011-30, and share of power
© BP 2013
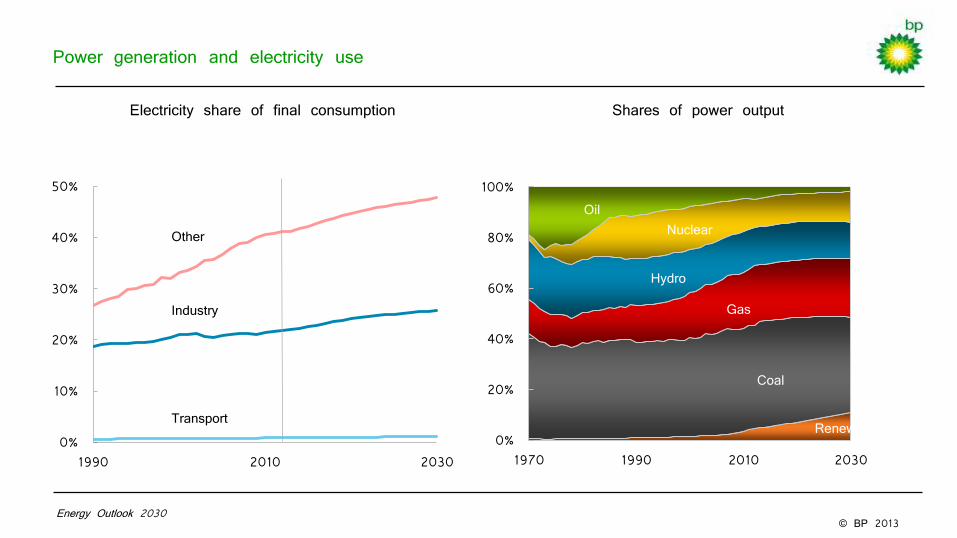
Electricity share of final consumption
Energy Outlook 2030
0%
10%
20%
30%
40%
50%
1990 2010 2030
Other
Industry
Transport
Power generation and electricity use
Shares of power output
0%
20%
40%
60%
80%
100%
1970 1990 2010 2030
Renew.
Nuclear
Coal
Oil
Hydro
Gas
© BP 2013
Introduction
Global energy trends
Outlook 2030: Fuel by fuel
Implications
Energy Outlook 2030
© BP 2013
0%
50%
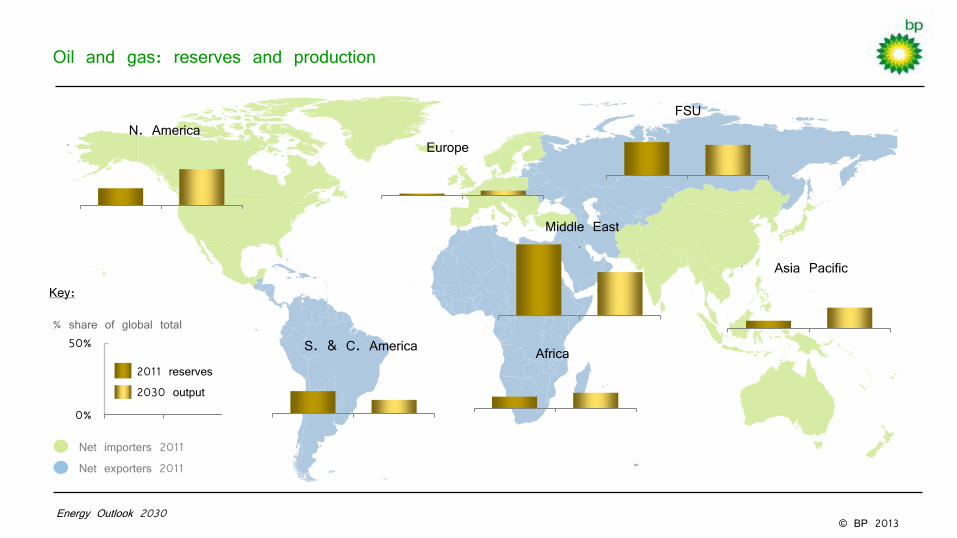
Oil and gas: reserves and production
2011 reserves 2030 output
% share of global total
Key:
Europe N. America
S. & C. America Africa
Middle East
FSU
Asia Pacific
Energy Outlook 2030
Net exporters 2011 Net importers 2011
© BP 2013
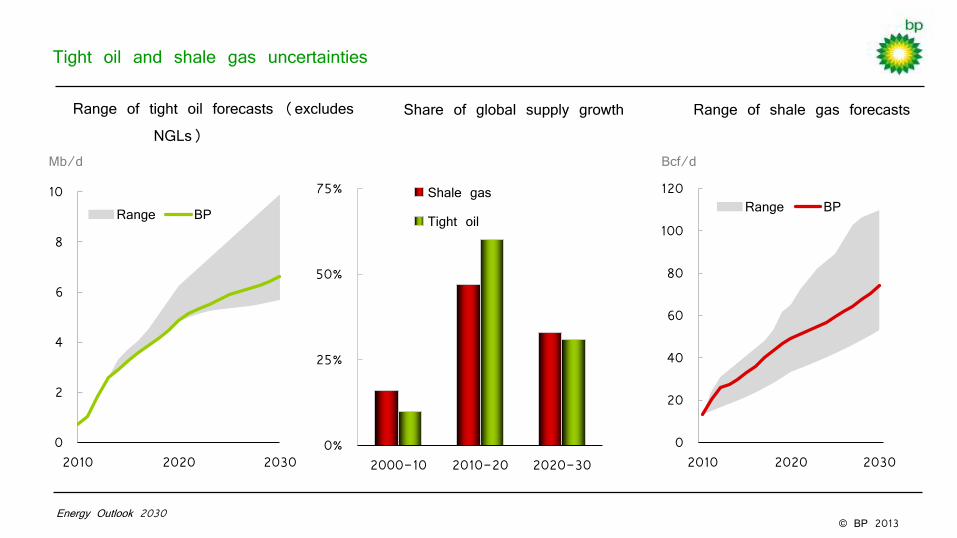
Tight oil and shale gas uncertainties
Share of global supply growth
0
2
4
6
8
10
2010 2020 2030
Range BP
Range of tight oil forecasts (excludes NGLs)
Mb/d
Energy Outlook 2030
0%
25%
50%
75%
2000-10 2010-20 2020-30
Shale gas
Tight oil
0
20
40
60
80
100
120
2010 2020 2030
Range BP
Bcf/d
Range of shale gas forecasts

© BP 2013
-80
-60
-40
-20
0
20
40
60
1990 2000 2010 2020 2030
China US
EU India
Energy imbalances to GDP ratio
Energy Outlook 2030
Energy imbalances
China EU US
-1,200
-900
-600
-300
0
300
1990
2010
2030
1990
2010
2030
1990
2010
2030
1990
2010
2030
Oil
Gas
Coal
Mtoe Toe per $Mln GDP PPP
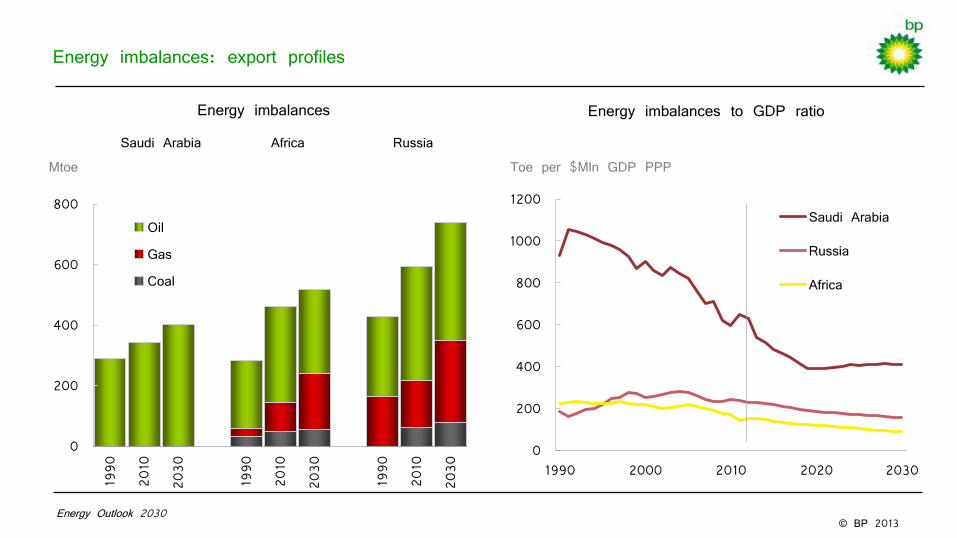
Energy imbalances: import profiles
India
© BP 2013
0
200
400
600
800
1000
1200
1990 2000 2010 2020 2030
Saudi Arabia
Russia
Africa
Energy imbalances to GDP ratio
Energy Outlook 2030
Energy imbalances
Saudi Arabia Africa Russia
0
200
400
600
800
1990
2010
2030
1990
2010
2030
1990
2010
2030
Oil
Gas
Coal
Mtoe Toe per $Mln GDP PPP
Energy imbalances: export profiles
© BP 2013
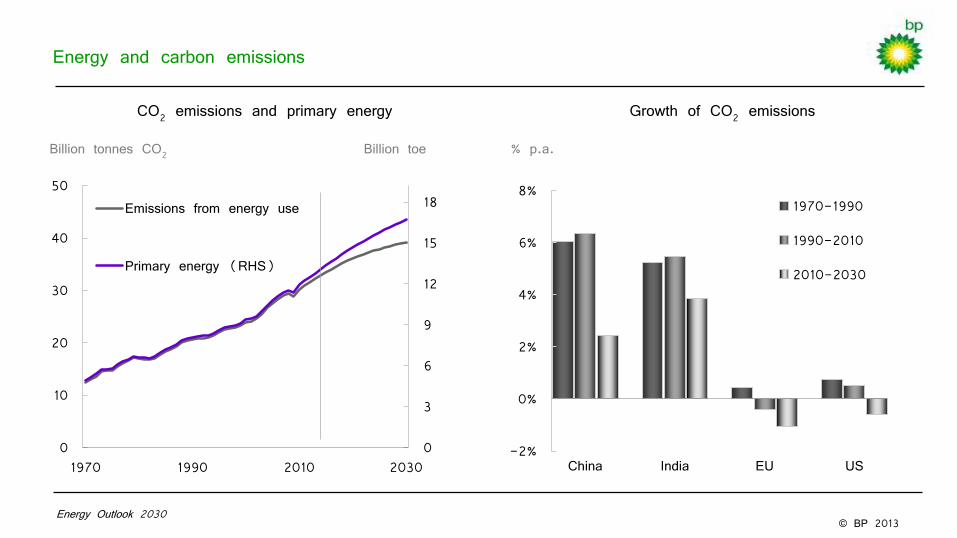
Oil
Gas
CO2 emissions and primary energy
Billion tonnes CO2
Energy Outlook 2030
Growth of CO2 emissions
% p.a.
0
3
6
9
12
15
18
0
10
20
30
40
50
1970 1990 2010 2030
Emissions from energy use
Primary energy (RHS)
Billion toe
-2%
0%
2%
4%
6%
8%
China India EU US
1970-1990
1990-2010
2010-2030
Energy and carbon emissions
© BP 2013
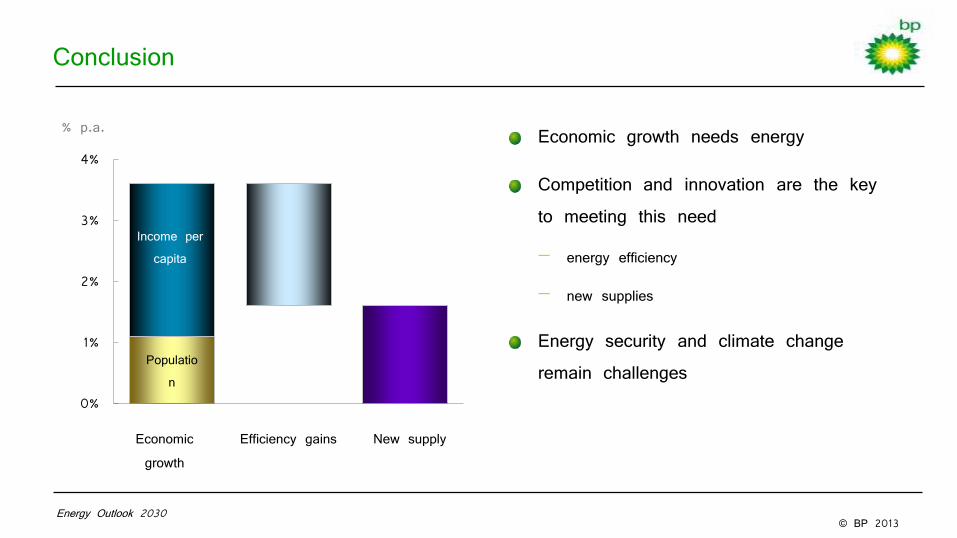
Conclusion
0%
1%
2%
3%
4%
Population
Income per capita
Economic growth
Efficiency gains New supply
% p.a. Economic growth needs energy
Competition and innovation are the key to meeting this need
− energy efficiency
− new supplies
Energy security and climate change remain challenges
Energy Outlook 2030
January 2013
© BP 2013
0
30
60
90
120
150
180
1970 1990 2010 2030 0
1
2
3
4
5
6
7
8
9
1970 1990 2010 2030 0
3
6
9
12
15
18
1970 1990 2010 2030
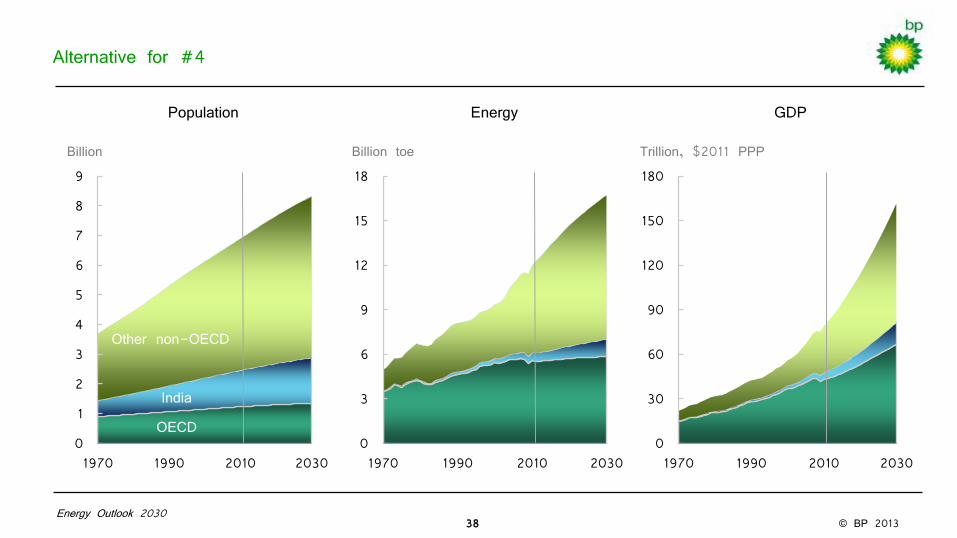
Alternative for #4
Energy
Billion toe Trillion, $2011 PPP
GDP Population
Billion
Other non-OECD
India
OECD
Energy Outlook 2030 38
© BP 2013
India
Mtoe
Energy Outlook 2030
Growth by sector and fuel, 2011-2030 Primary energy demand by fuel
Oil
Coal
Gas
0
200
400
600
800
1000
1200
1990 2000 2010 2020 2030
Renew.*
Hydro
Nuclear
Coal
Gas
Oil
*Includes biofuels
-100
0
100
200
300
Transport
Industry
Other
Power
Hydro
Nuclear
Renew.
Electricity
Gas
Biofuels
Oil
Coal
Final energy use Inputs to power
Mtoe

© BP 2013
0
1
2
3
1990 2010 2030
Electricity
Gas
Coal
Biofuels
Oil - road
Oil - non-road
0
3
6
9
12
1995 2005 2015 2025
EU US light vehicles China India
Global transport demand (with India forecast added, no history)
Transport demand by fuel
Billion toe
Fuel economy of new cars
Litres per 100 km
Energy Outlook 2030
© BP 2013
0
5
10
15
20
25
30
35
40
45
50
1990 2000 2010 2020 2030
Power
Oil
Industry
OECD
China
India
Energy Outlook 2030
China
India
OECD
China
India
China
India
OECD OECD
China
India
OECD
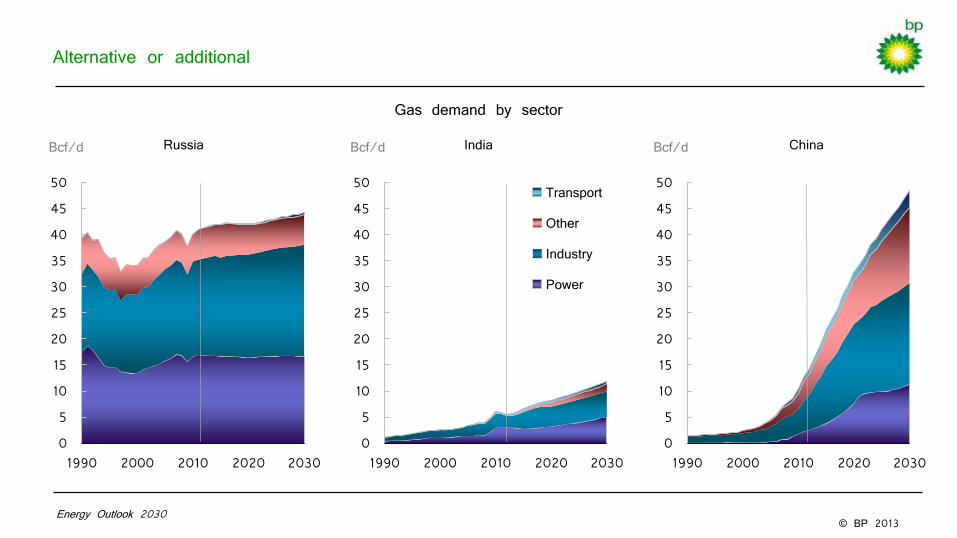
Bcf/d
Gas demand by sector
Power
Industry
0
5
10
15
20
25
30
35
40
45
50
1990 2000 2010 2020 2030
Transport
Other
Industry
Power
0
5
10
15
20
25
30
35
40
45
50
1990 2000 2010 2020 2030
Russia India China
Alternative or additional
Bcf/d Bcf/d

© BP 2013
0
10
20
30
40
50
60
1990 2010 2030
Energy Outlook 2030
0
10
20
30
40
50
60
1990 2010 2030
Net pipeline imports
Net LNG imports
Shale gas production
Other domestic production
Energy Outlook 2030
Alternative for #21 - Version 1
Bcf/d India Bcf/d EU
Sources of gas supply, by region
0
10
20
30
40
50
60
1990 2010 2030
Bcf/d China
© BP 2013 Energy Outlook 2030
-5
0
5
10
15
20
25
30
1990 2010 2030
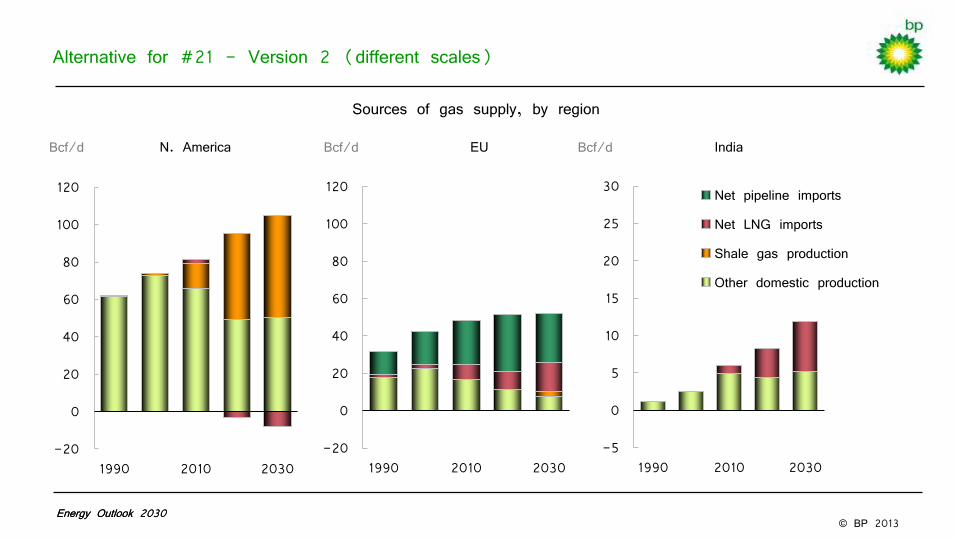
Net pipeline imports
Net LNG imports
Shale gas production
Other domestic production
Energy Outlook 2030
Alternative for #21 - Version 2 (different scales)
Bcf/d India Bcf/d N. America Bcf/d EU
Sources of gas supply, by region
-20
0
20
40
60
80
100
120
1990 2010 2030 -20
0
20
40
60
80
100
120
1990 2010 2030
© BP 2013
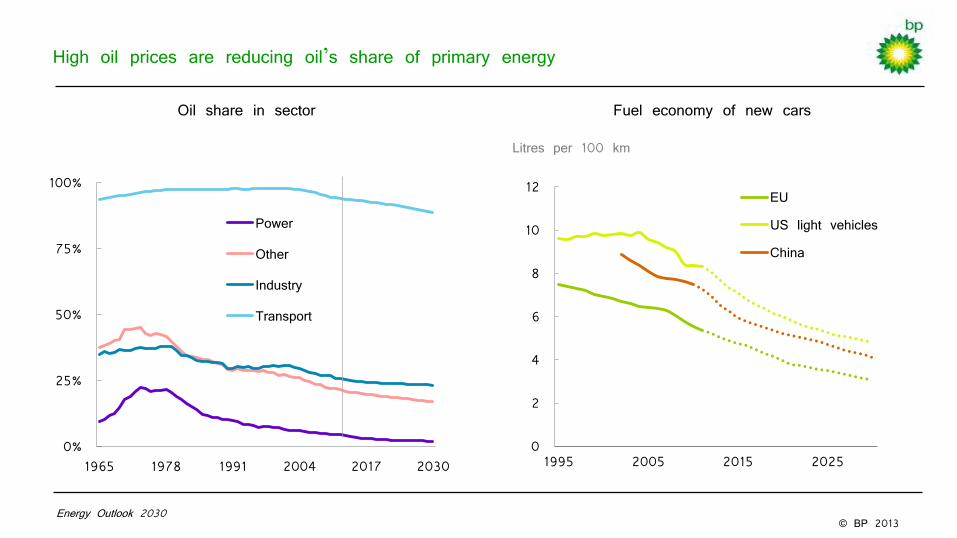
High oil prices are reducing oil’s share of primary energy
0%
25%
50%
75%
100%
1965 1978 1991 2004 2017 2030
Power
Other
Industry
Transport
Oil share in sector
Energy Outlook 2030
0
2
4
6
8
10
12
1995 2005 2015 2025
EU
US light vehicles
China
Fuel economy of new cars
Litres per 100 km
© BP 2013
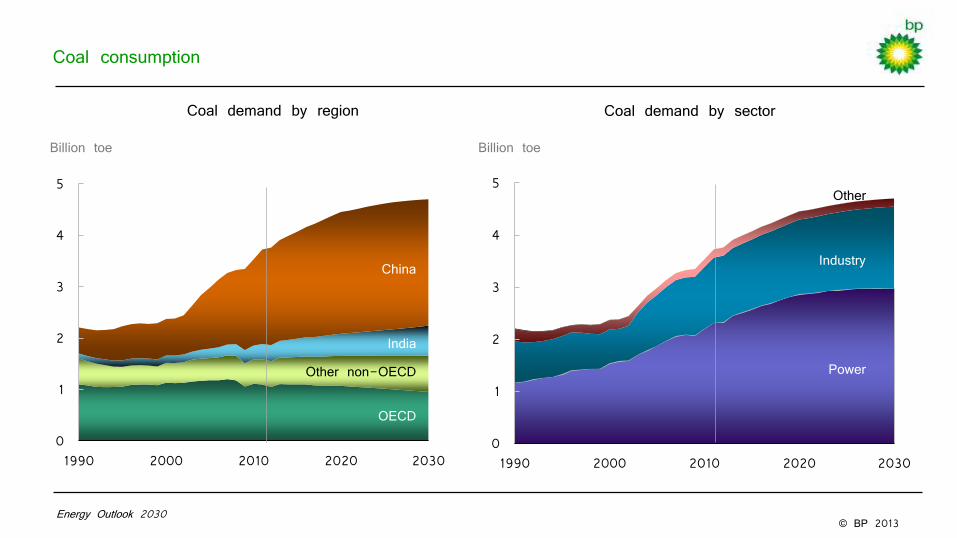
Coal consumption
Power
Oil
Industry
Coal demand by region
OECD
China
India
Billion toe
Energy Outlook 2030
China
India
OECD
China
Other Non-OECD
India
China
India
OECD
0
1
2
3
4
5
1990 2000 2010 2020 2030
OECD
China
Other non-OECD
India
China
India
OECD
Billion toe
Coal demand by sector
0
1
2
3
4
5
1990 2000 2010 2020 2030
Power
Industry
Other