Embed Size (px)
Citation preview

January 2010
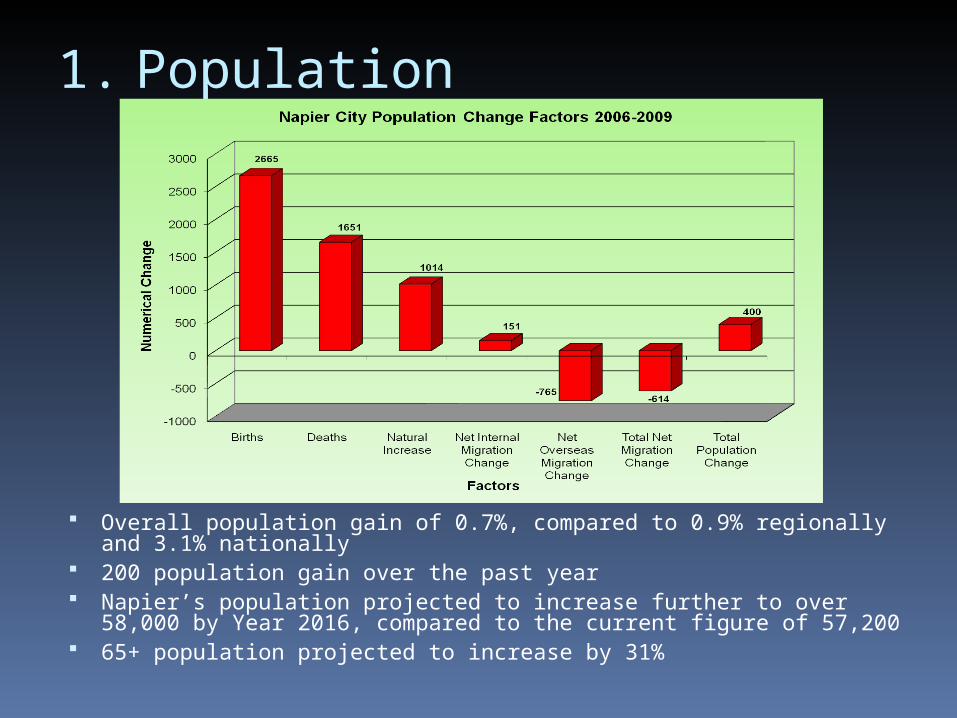
1. Population
Overall population gain of 0.7%, compared to 0.9% regionally and 3.1% nationally
200 population gain over the past year Napier’s population projected to increase further to over 58,000
by Year 2016, compared to the current figure of 57,200 65+ population projected to increase by 31%
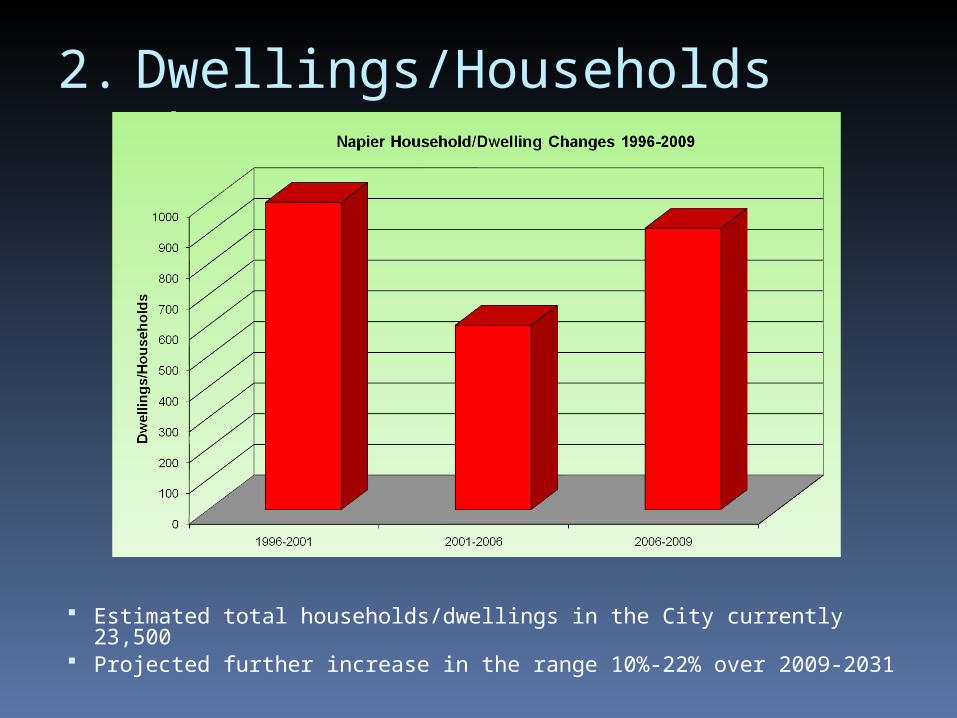
2. Dwellings/Households Change
Estimated total households/dwellings in the City currently 23,500 Projected further increase in the range 10%-22% over 2009-2031

3. Economic Activity-GDP
Economic growth fluctuates more at the smaller local economy level Minus 1.4% growth (decline) in Napier over the year ended September
2009, an improvement on the previous year and better than the national level
This year anticipate gradual move back towards the positive growth area
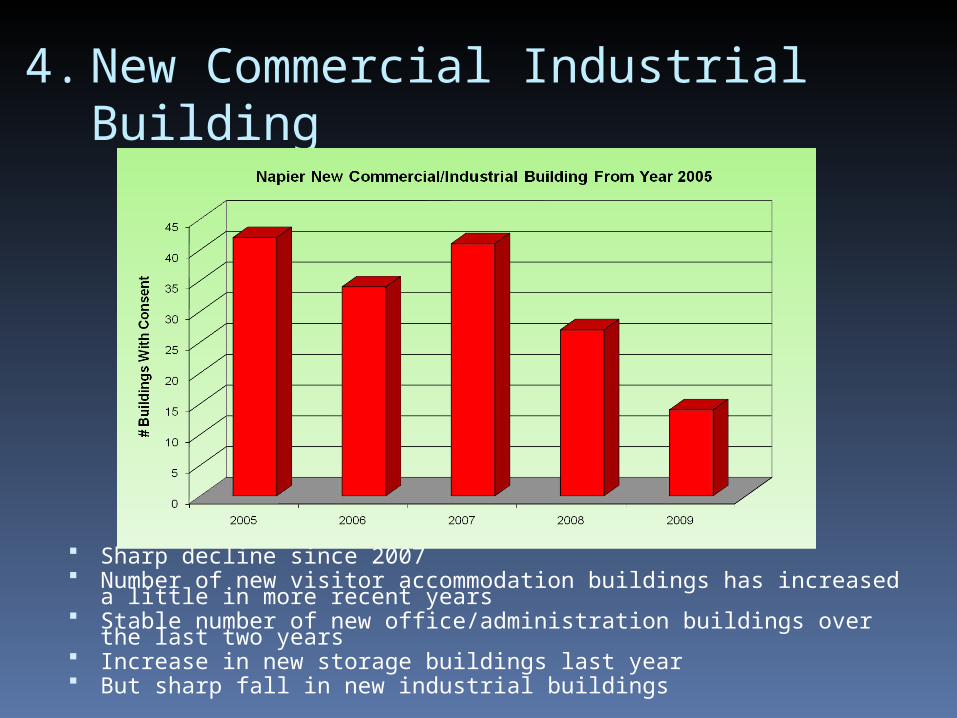
4.New Commercial Industrial Building
Sharp decline since 2007 Number of new visitor accommodation buildings has increased a
little in more recent years Stable number of new office/administration buildings over the last
two years Increase in new storage buildings last year But sharp fall in new industrial buildings
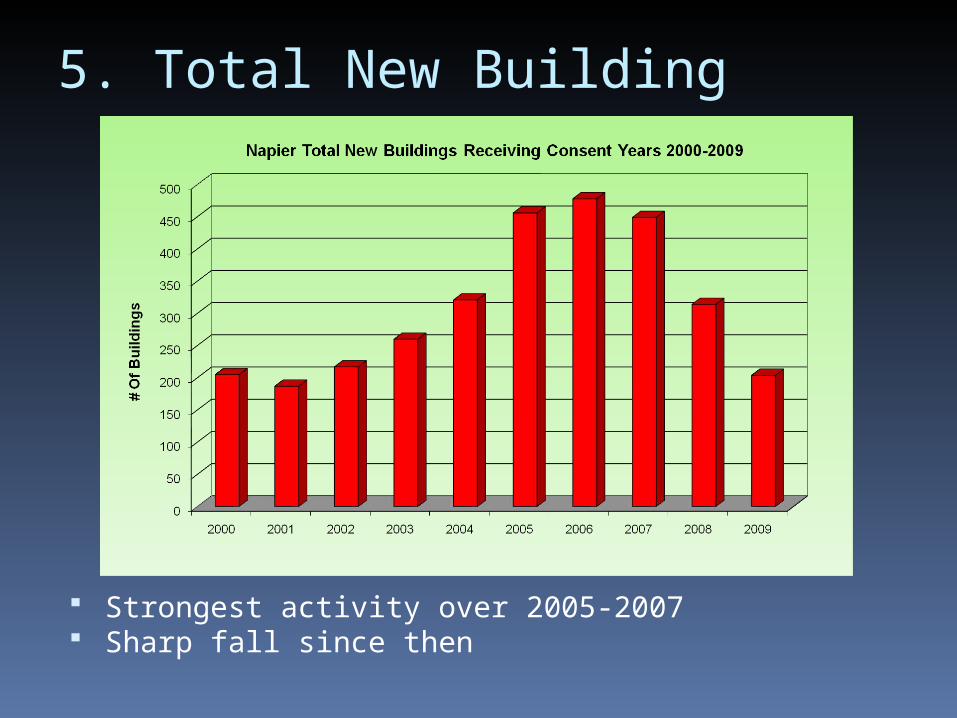
5. Total New Building
Strongest activity over 2005-2007 Sharp fall since then
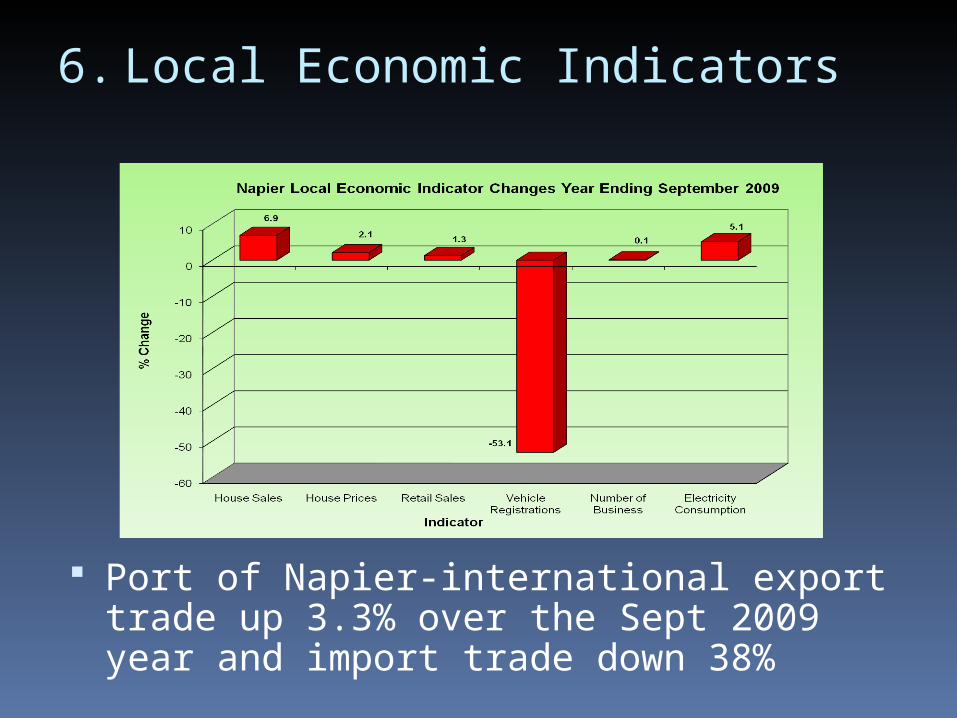
6.Local Economic Indicators
Port of Napier-international export trade up 3.3% over the Sept 2009 year and import trade down 38%

7.Local Business Performance
Results of Napier business confidence survey in September 2009 Approx. half of the 200 firms surveyed reported begin significantly impacted by
the major international economic downturn Local businesses have responded to the downturn by, for example, reducing
operating costs, staff changes, increased marketing, new business opportunities, restructuring and improved debt management
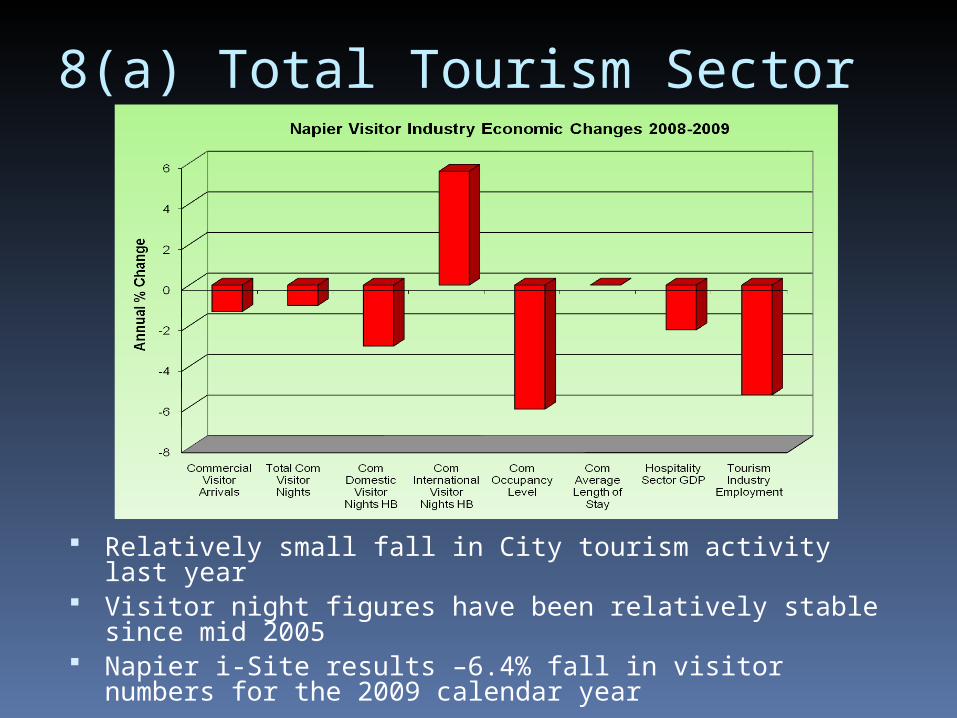
8(a) Total Tourism Sector
Relatively small fall in City tourism activity last year Visitor night figures have been relatively stable since mid
2005 Napier i-Site results –6.4% fall in visitor numbers for the
2009 calendar year
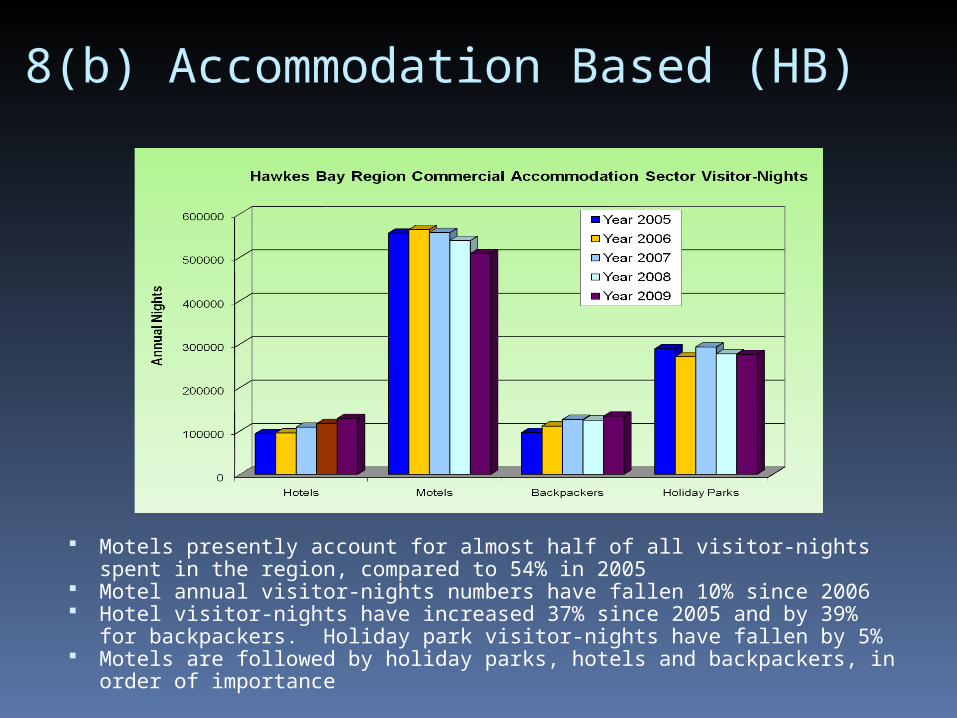
8(b) Accommodation Based (HB)
Motels presently account for almost half of all visitor-nights spent in the region, compared to 54% in 2005
Motel annual visitor-nights numbers have fallen 10% since 2006 Hotel visitor-nights have increased 37% since 2005 and by 39%
for backpackers. Holiday park visitor-nights have fallen by 5% Motels are followed by holiday parks, hotels and backpackers, in
order of importance
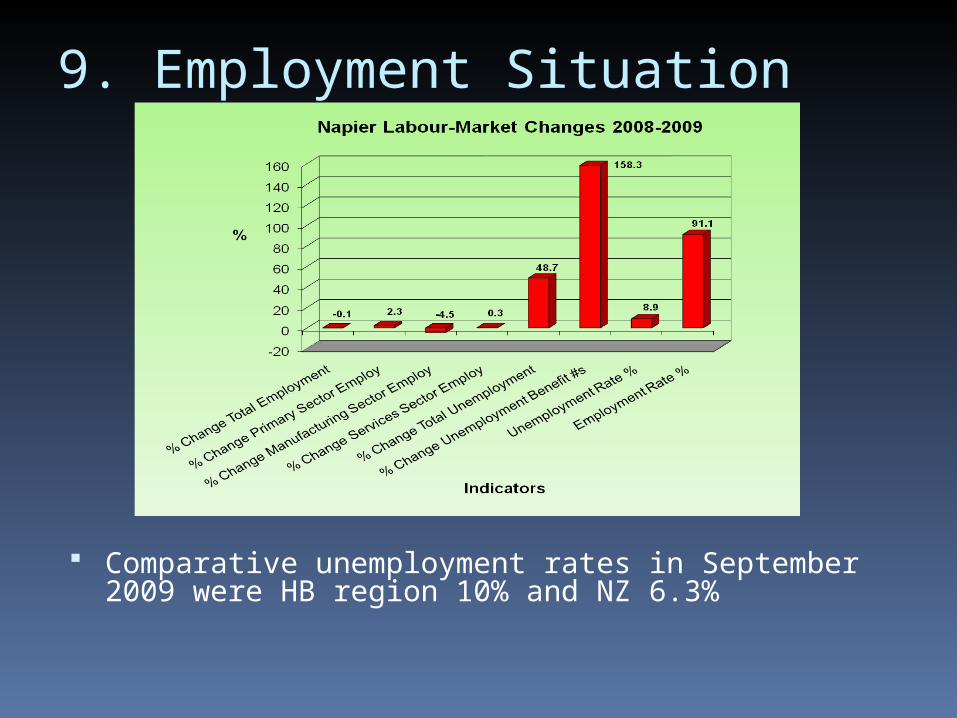
9. Employment Situation
Comparative unemployment rates in September 2009 were HB region 10% and NZ 6.3%
10. Income Situation Number of working-age income-tested
beneficiaries in December 2009 stood at 5,527, compared to 4,641 in December 2008
Numbers for other individual benefit categories was: DPB – 2,009 Sickness – 1,008 Invalids – 1,350
Number of families under pressure Increased number of people receiving
food parcels
11. Changes since September 2009 Number of people on the unemployment
benefit in Napier at the end of December 2009 up 6.7% on the September quarter
Commercial visitor arrivals over Oct/Nov 2009 down 1% on the same period in 2008, with visitor-nights down 6%
Some business closures CBD business activity since Dec 09 –lot of
pre-Christmas sales, more cash spending, strong Boxing Day, supermarkets very positive, lots of people in town, positive impact of cruise ships, high quality independent outlets doing well and January performance still good.
12. Year 2010 Outlook Continued gradual economic recovery Positive impacts from the upcoming
major summer events programme Seasonal work opportunities with the
upcoming annual horticultural harvesting season
Impacts of the rural production sector-positive production conditions but tight markets situation
Overall low growth environment anticipated for the year ahead