Embed Size (px)
Citation preview

Jamie NagleJamie Nagle
University of Qolorado, BoulderUniversity of Qolorado, Boulder
Winter Workshop on Nuclear Dynamics 2008South Padre Island, Texas
Acknowledging fruitful collaboration with Mike Tannenbaum.Useful theory input and discussions with W. Horowitz, P. Jacobs, C. Loizides, G-Y Qin, I. Vitev, X.N. Wang.
• QuasiParticles versus the Perfect Fluid.
• Quarkonia.
• Quixotical Queries into Quicksand Quandaries ?
• Quantitative Constraints on the Quark Gluon Plasma.
Quasi-Particle Degrees of Freedom versus the Perfect Fluid as Descriptors of the Quark-Gluon Plasma.L.A. Linden Levy, J.L. Nagle, C. Rosen, P. Steinberg.e-Print: arXiv:0709.3105 [nucl-th]
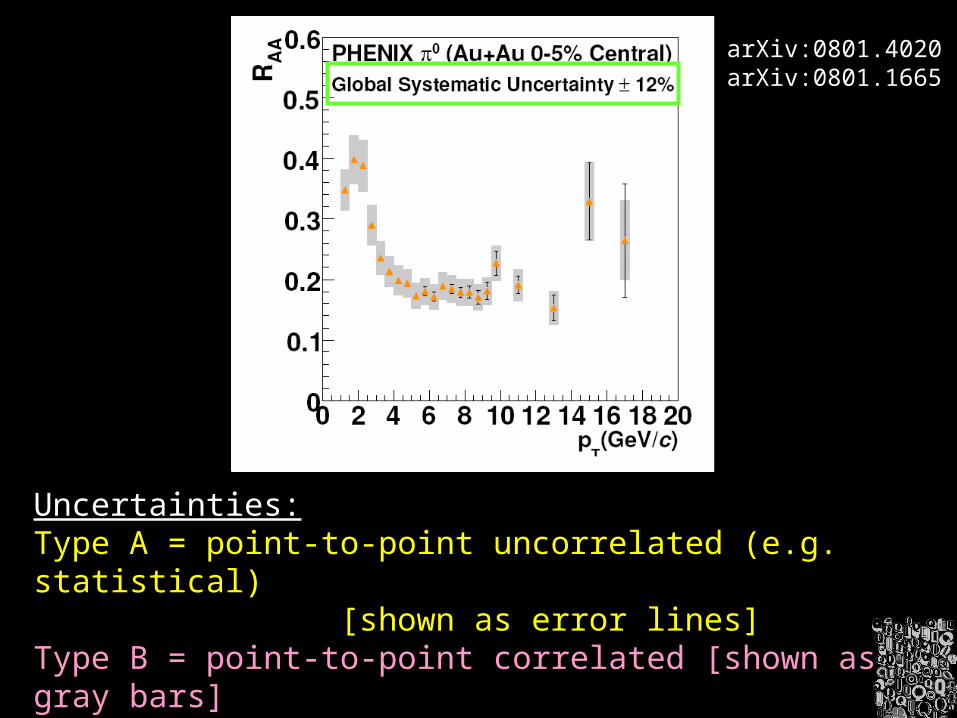
Uncertainties:Type A = point-to-point uncorrelated (e.g. statistical) [shown as error lines]Type B = point-to-point correlated [shown as gray bars]Type C = globally correlated (i.e. all points move by multiplicative factor) [text]
arXiv:0801.4020arXiv:0801.1665
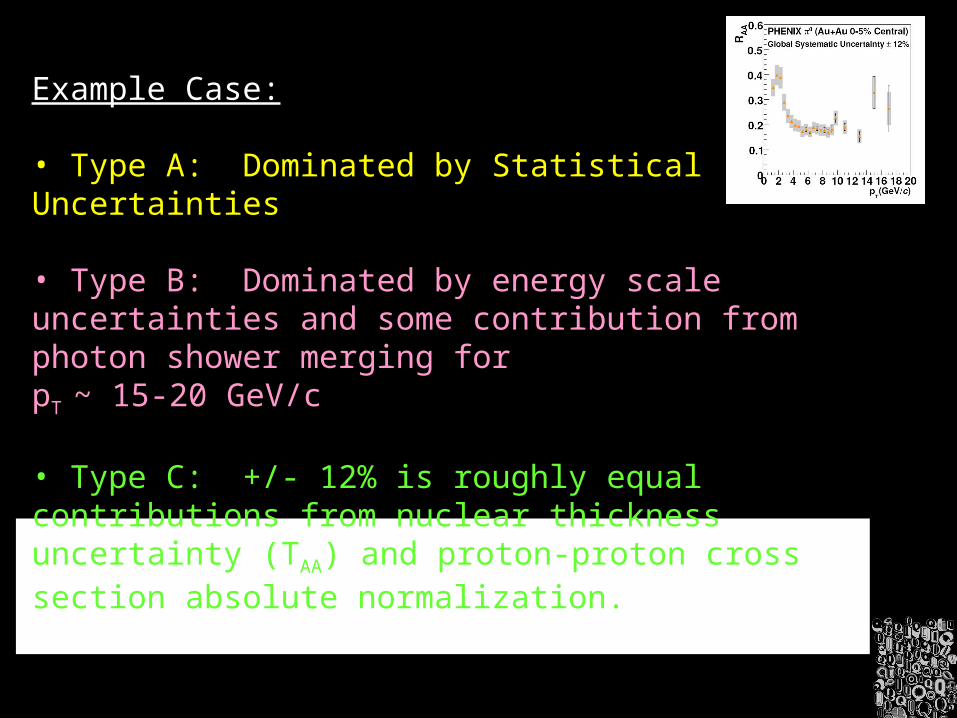
Example Case:
• Type A: Dominated by Statistical Uncertainties
• Type B: Dominated by energy scale uncertainties and some contribution from photon shower merging for pT ~ 15-20 GeV/c
• Type C: +/- 12% is roughly equal contributions from nuclear thickness uncertainty (TAA) and proton-proton cross section absolute normalization.
Every RHIC published result on which a full quantitative analysis is to be performed needs to explicitly quote these uncertainty contributions !
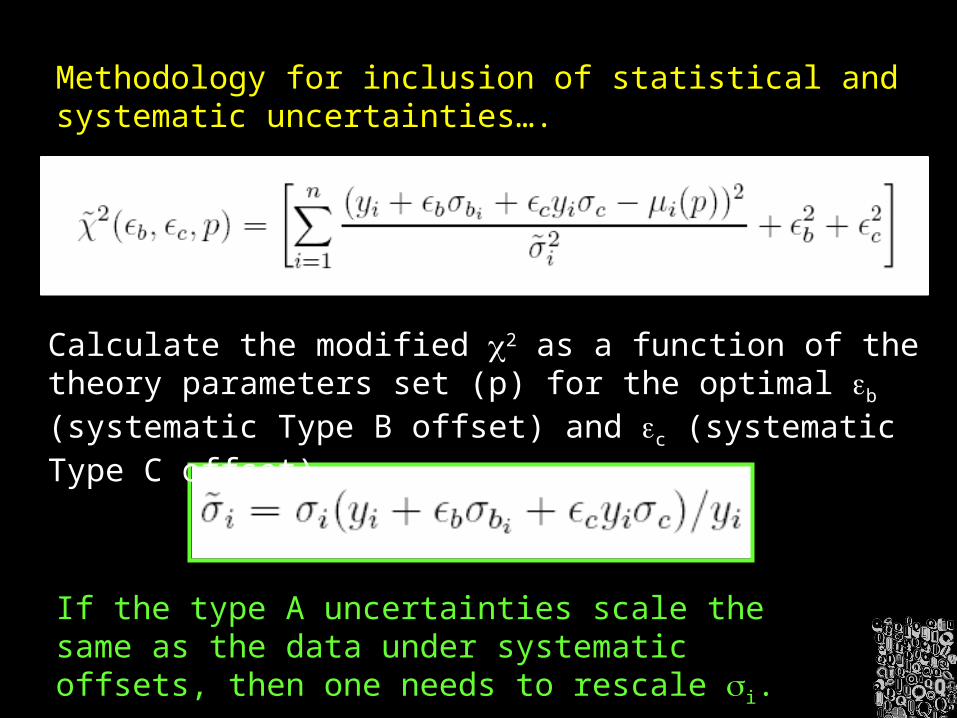
Methodology for inclusion of statistical and systematic uncertainties….
Calculate the modified 2 as a function of the theory parameters set (p) for the optimal b (systematic Type B offset) and c (systematic Type C offset).
If the type A uncertainties scale the same as the data under systematic offsets, then one needs to rescale i.
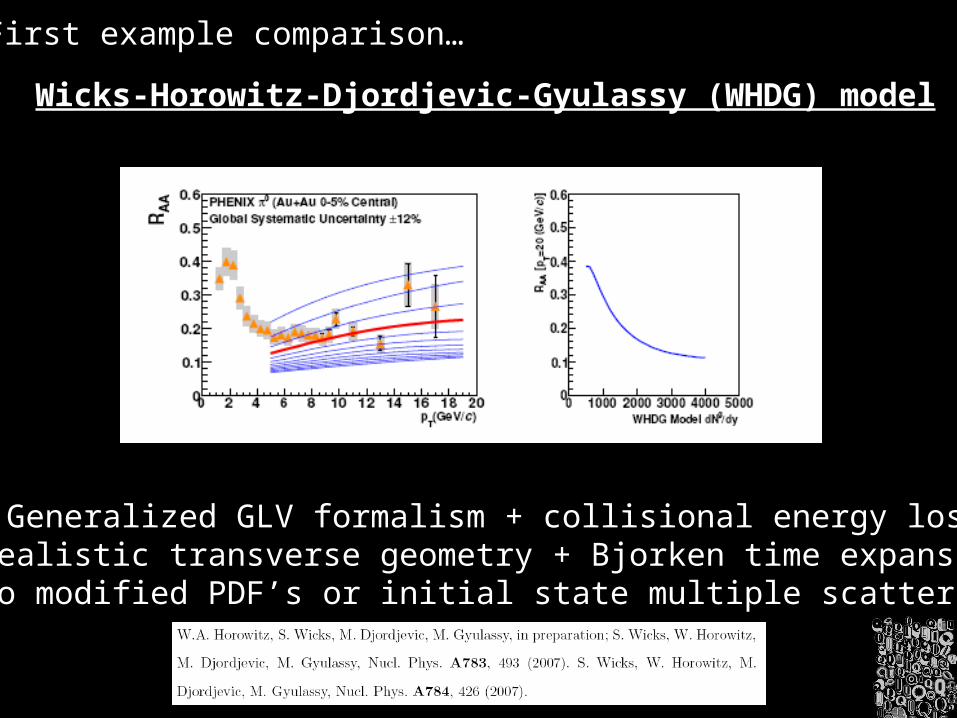
First example comparison…
Wicks-Horowitz-Djordjevic-Gyulassy (WHDG) model
• Generalized GLV formalism + collisional energy loss.• Realistic transverse geometry + Bjorken time expansion.
• No modified PDF’s or initial state multiple scattering.
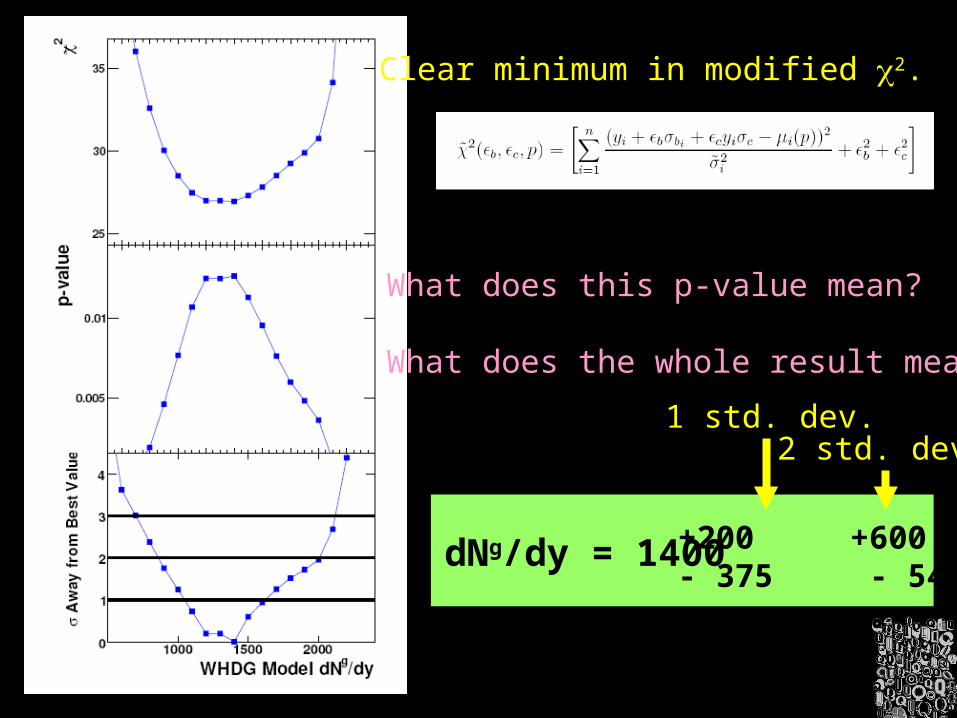
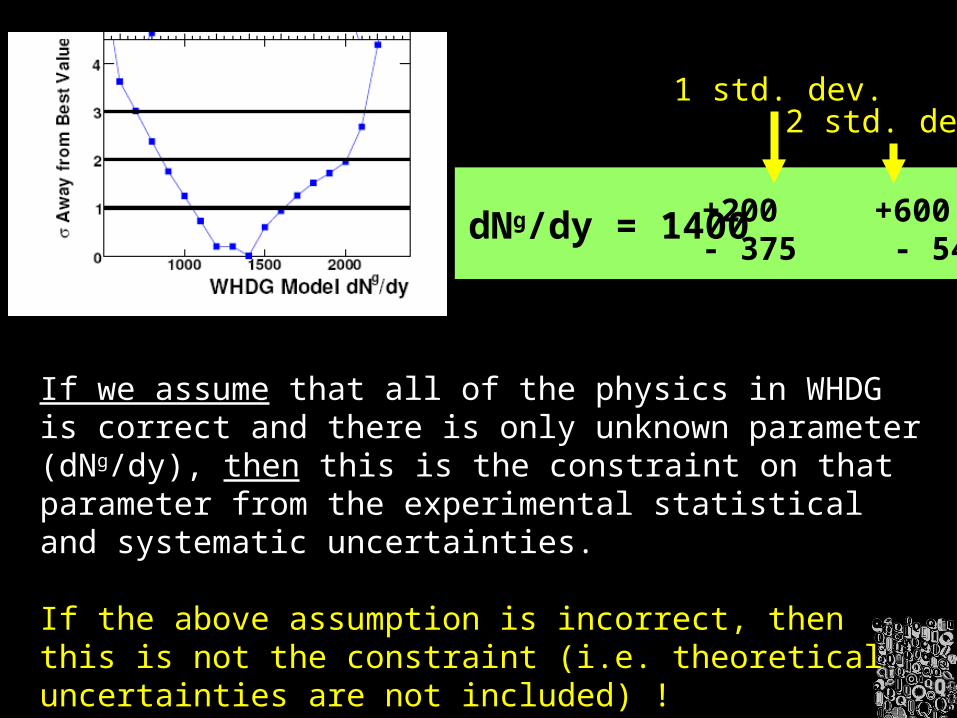
Clear minimum in modified 2.
dNg/dy = 1400 +200 +600- 375 - 540
1 std. dev.2 std. dev.
What does this p-value mean?
What does the whole result mean?
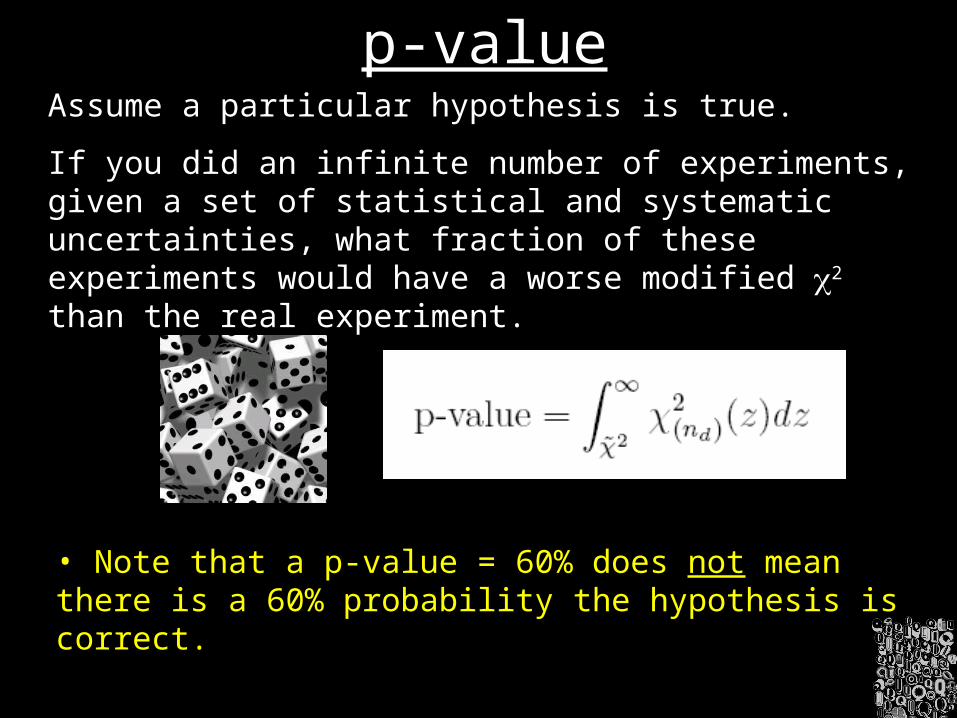
p-valueAssume a particular hypothesis is true.
If you did an infinite number of experiments, given a set of statistical and systematic uncertainties, what fraction of these experiments would have a worse modified 2 than the real experiment.
• Note that a p-value = 60% does not mean there is a 60% probability the hypothesis is correct.
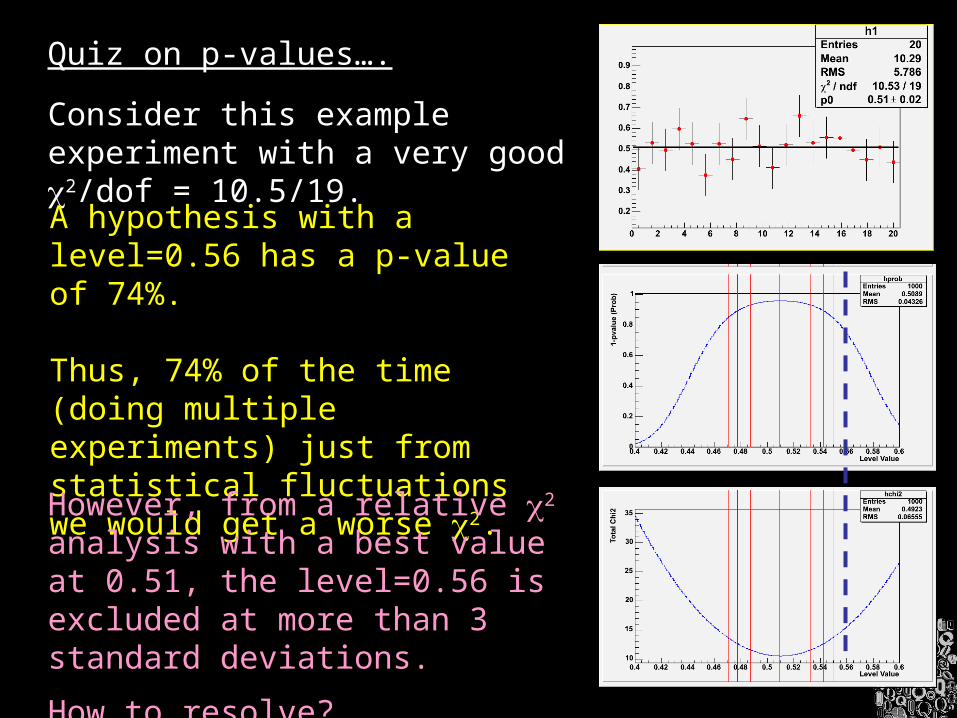
Quiz on p-values….
Consider this example experiment with a very good 2/dof = 10.5/19.
A hypothesis with a level=0.56 has a p-value of 74%.
Thus, 74% of the time (doing multiple experiments) just from statistical fluctuations we would get a worse 2.
However, from a relative 2 analysis with a best value at 0.51, the level=0.56 is excluded at more than 3 standard deviations.
How to resolve?
dNg/dy = 1400 +200 +600- 375 - 540
1 std. dev.2 std. dev.
If we assume that all of the physics in WHDG is correct and there is only unknown parameter (dNg/dy), then this is the constraint on that parameter from the experimental statistical and systematic uncertainties.
If the above assumption is incorrect, then this is not the constraint (i.e. theoretical uncertainties are not included) !
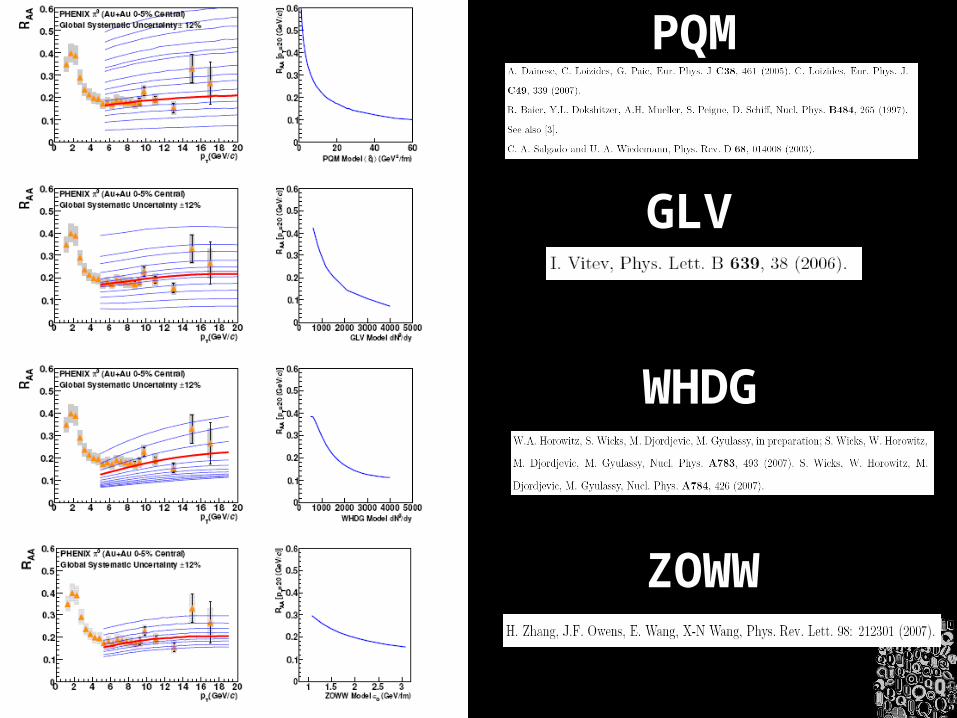
PQM
GLV
WHDG
ZOWW
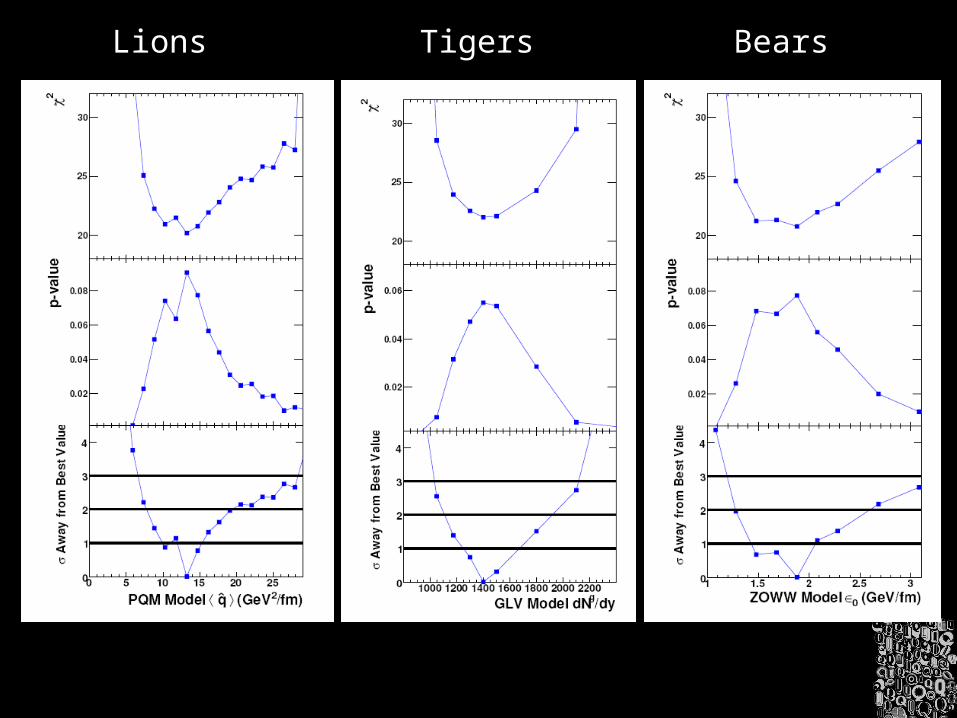
Lions Tigers Bears
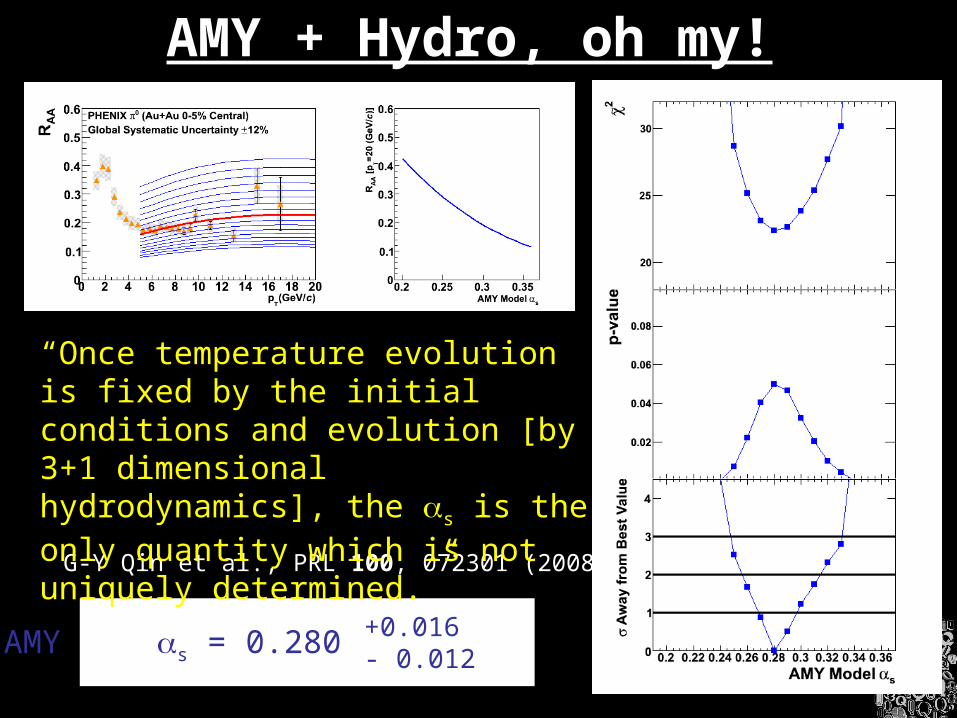
G-Y Qin et al., PRL 100, 072301 (2008)
“Once temperature evolution is fixed by the initial conditions and evolution [by 3+1 dimensional hydrodynamics], the s is the only quantity which is not uniquely determined.”
AMY + Hydro, oh my!
AMY s = 0.280 +0.016- 0.012
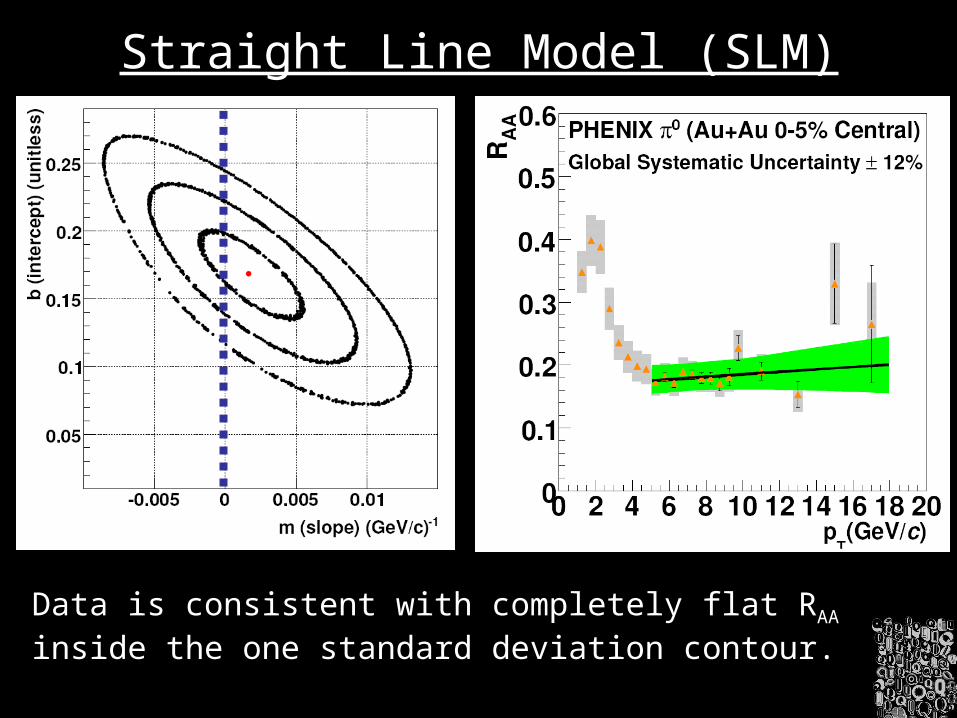
Straight Line Model (SLM)
Data is consistent with completely flat RAA inside the one standard deviation contour.
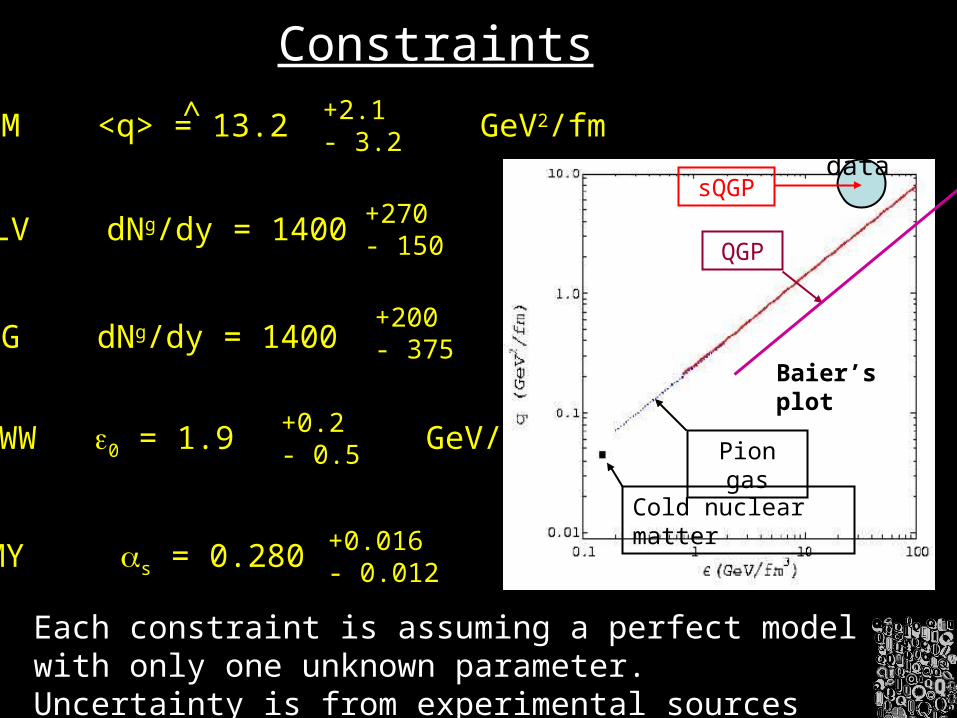
PQM <q> = 13.2 GeV2/fm +2.1- 3.2
^
GLV dNg/dy = 1400 +270- 150
WHDG dNg/dy = 1400 +200- 375
ZOWW 0 = 1.9 GeV/fm +0.2- 0.5
AMY s = 0.280 +0.016- 0.012
Constraints
Each constraint is assuming a perfect model with only one unknown parameter. Uncertainty is from experimental sources only !
Pion gas
Cold nuclear matter
RHIC data
sQGP
QGP
Baier’s plot
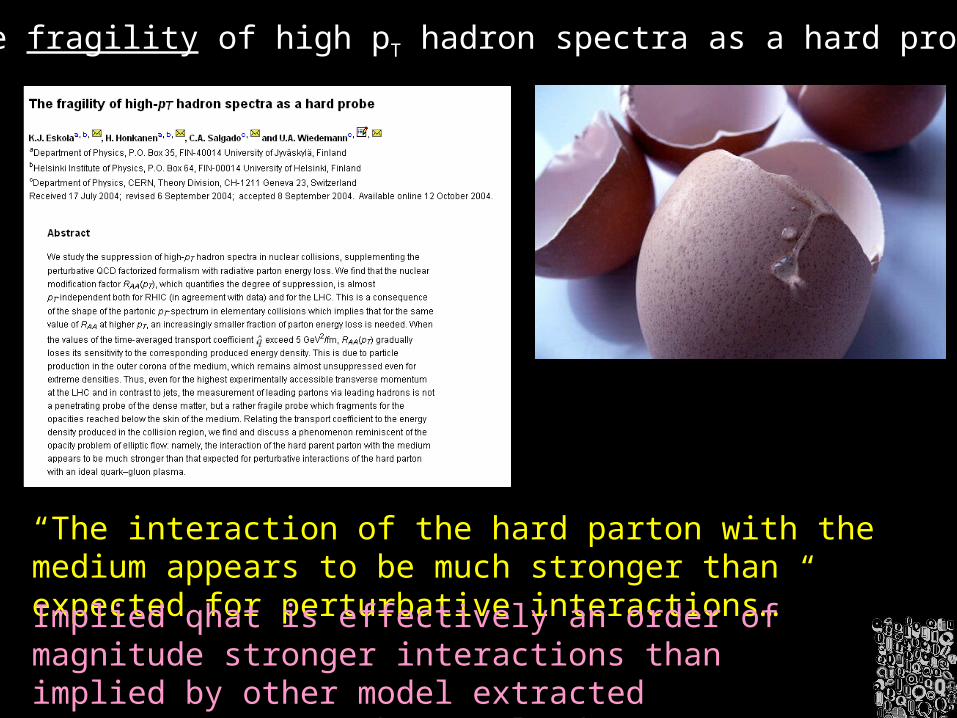
“The fragility of high pT hadron spectra as a hard probe”
“The interaction of the hard parton with the medium appears to be much stronger than expected for perturbative interactions…”
Implied qhat is effectively an order of magnitude stronger interactions than implied by other model extracted parameters. MUST be resolved ….
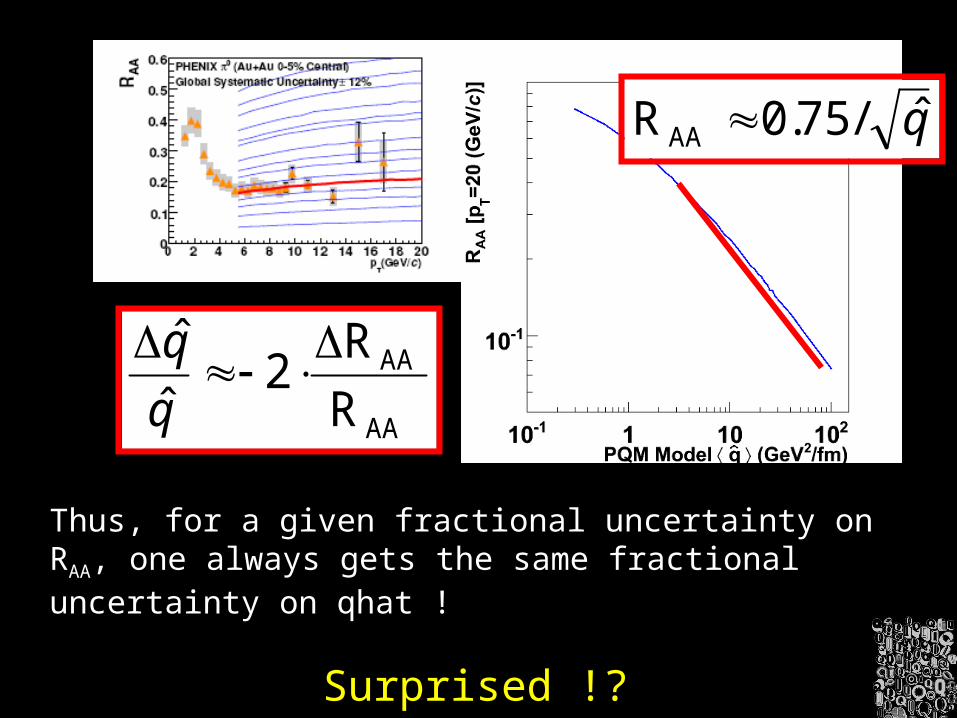
q̂/75.0RAA
AA
AA
R
R2
ˆ
ˆ
q
q
Thus, for a given fractional uncertainty on RAA, one always gets the same fractional uncertainty on qhat !
Surprised !?
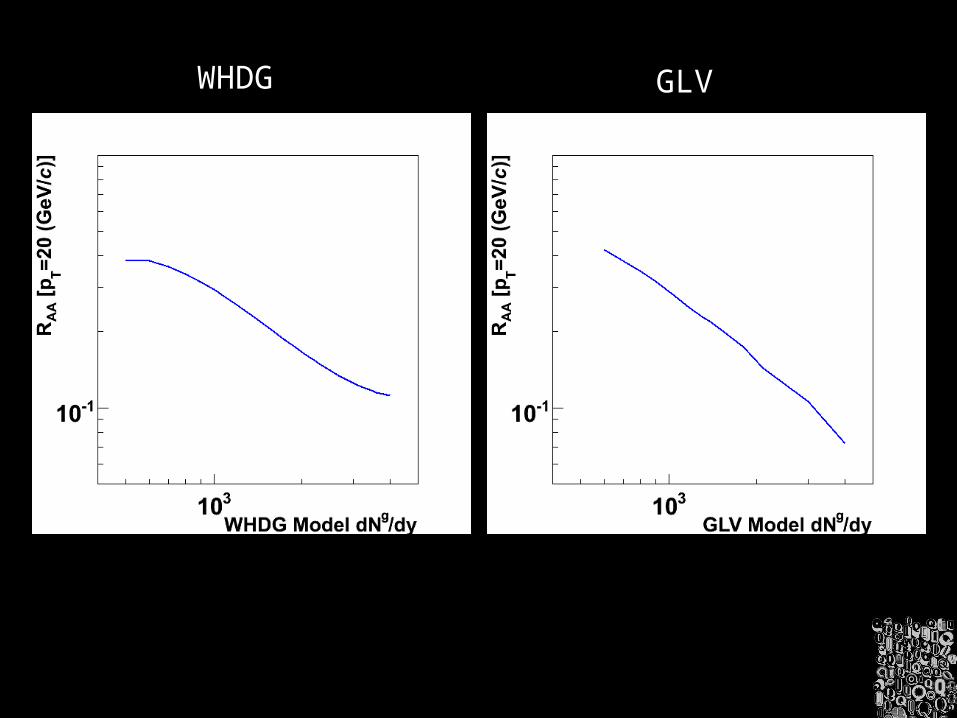
WHDG GLV
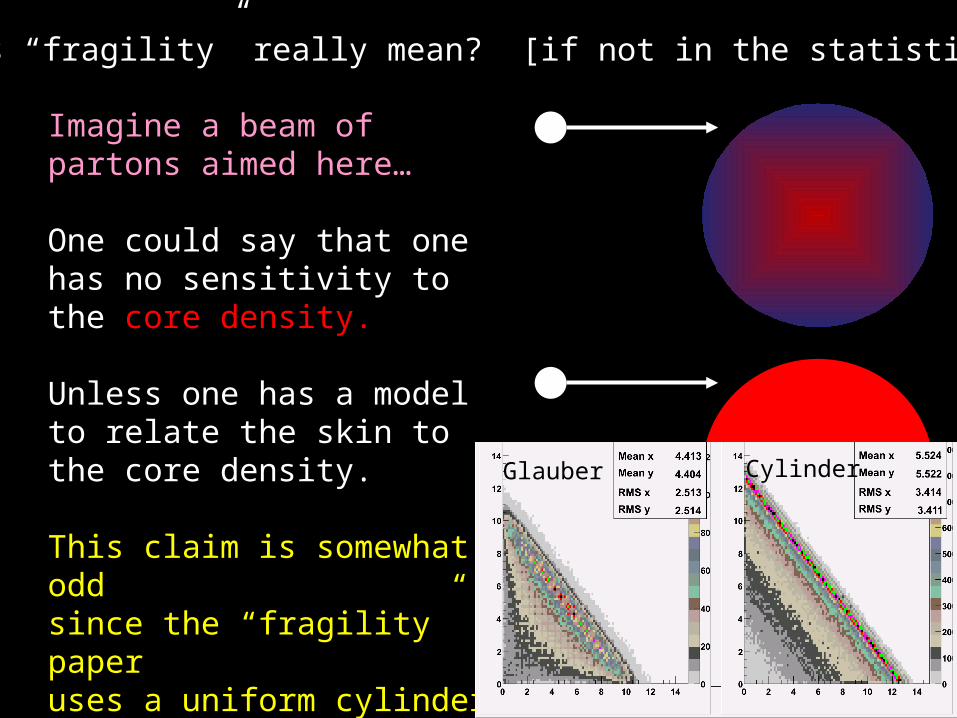
What does “fragility” really mean? [if not in the statistical sense]
Imagine a beam of partons aimed here…
One could say that one has no sensitivity to the core density.
Unless one has a model to relate the skin to the core density.
This claim is somewhat odd since the “fragility” paper uses a uniform cylinder geometry !
Glauber Cylinder
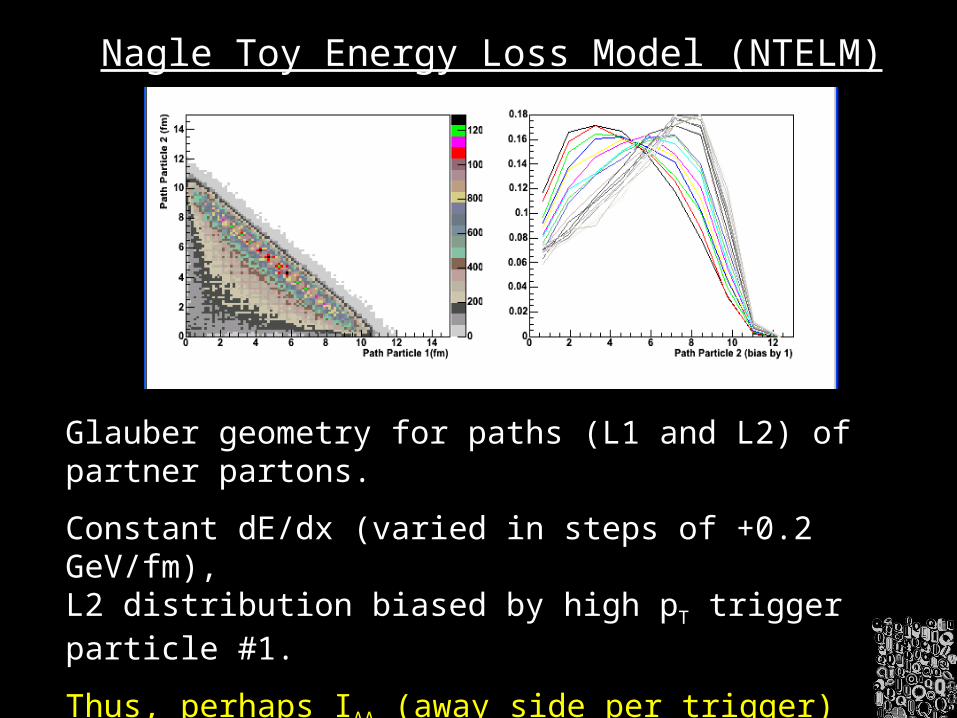
Nagle Toy Energy Loss Model (NTELM)
Glauber geometry for paths (L1 and L2) of partner partons.
Constant dE/dx (varied in steps of +0.2 GeV/fm), L2 distribution biased by high pT trigger particle #1.
Thus, perhaps IAA (away side per trigger) will be more sensitive that RAA.
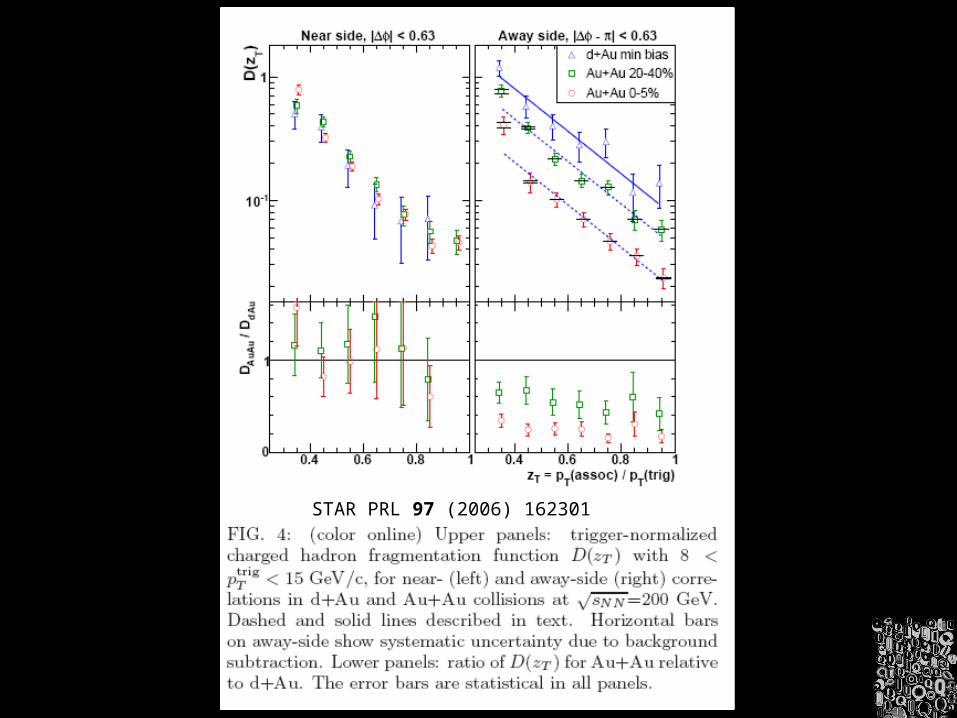
STAR PRL 97 (2006) 162301
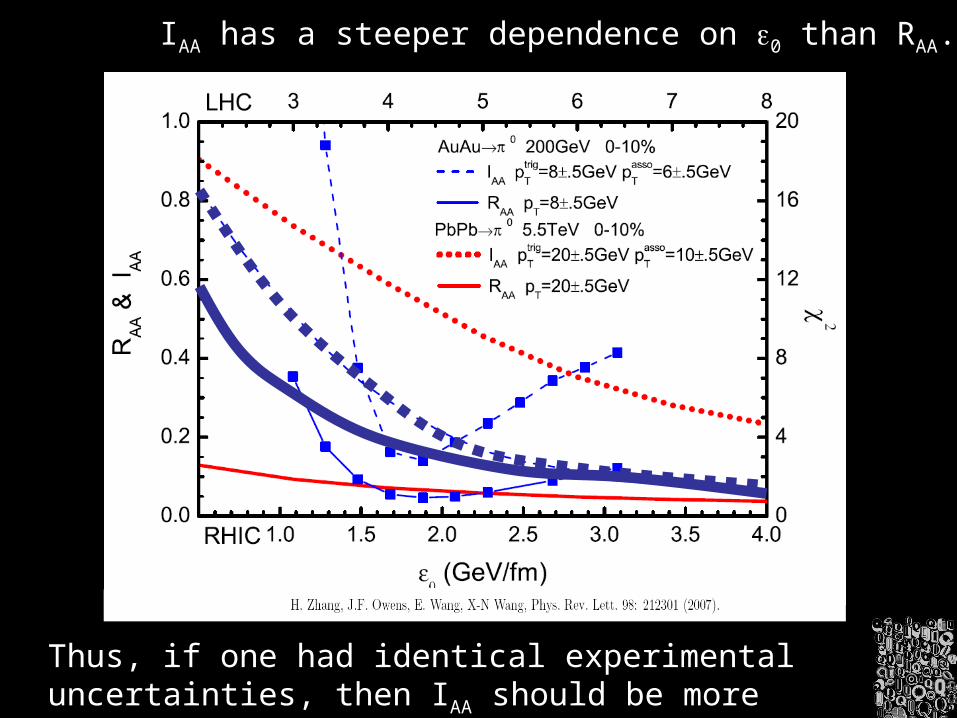
IAA has a steeper dependence on 0 than RAA.
Thus, if one had identical experimental uncertainties, then IAA should be more constraining.
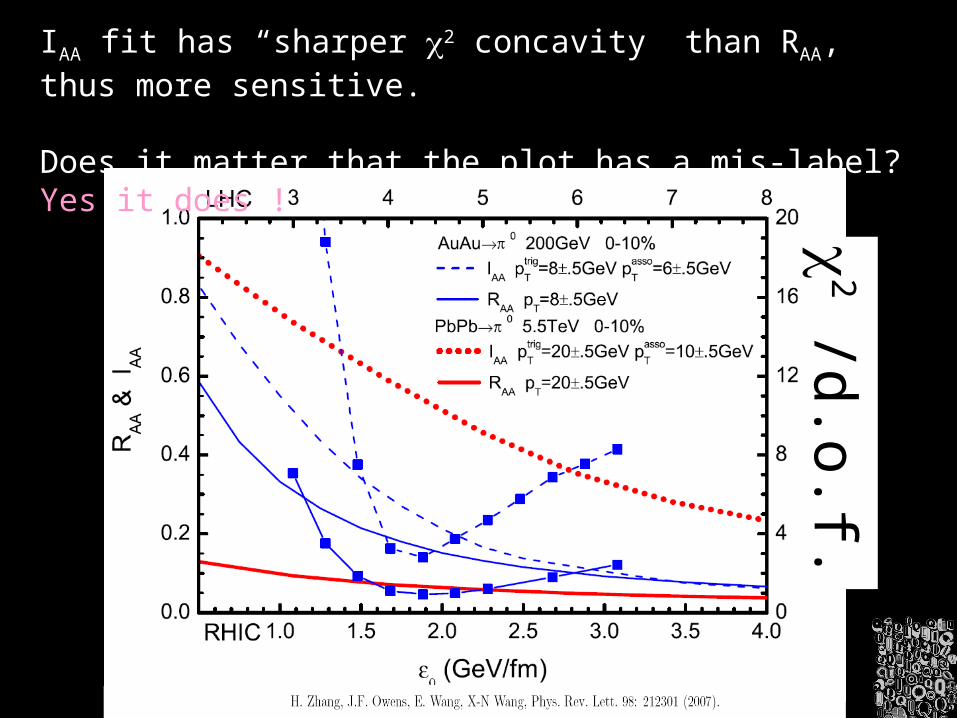
IAA fit has “sharper 2 concavity” than RAA, thus more sensitive.
Does it matter that the plot has a mis-label? Yes it does !
2 /d.o.f.
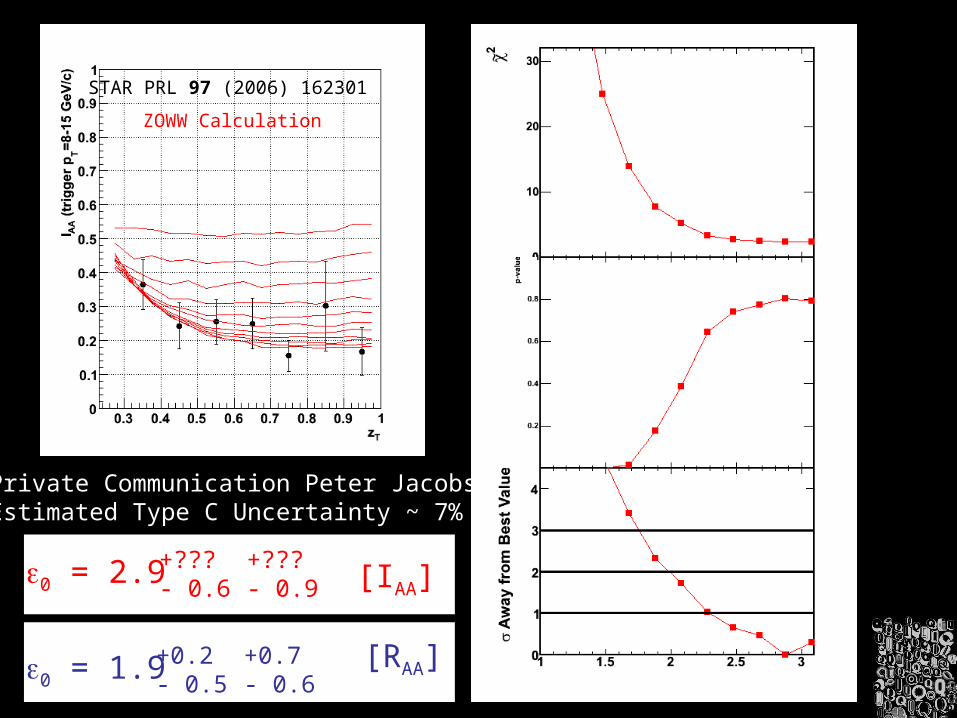
Private Communication Peter Jacobs Estimated Type C Uncertainty ~ 7%
0 = 2.9 +???- 0.6
0 = 1.9 +0.2- 0.5
+???- 0.9
+0.7- 0.6
[IAA]
[RAA]
ZOWW Calculation
STAR PRL 97 (2006) 162301
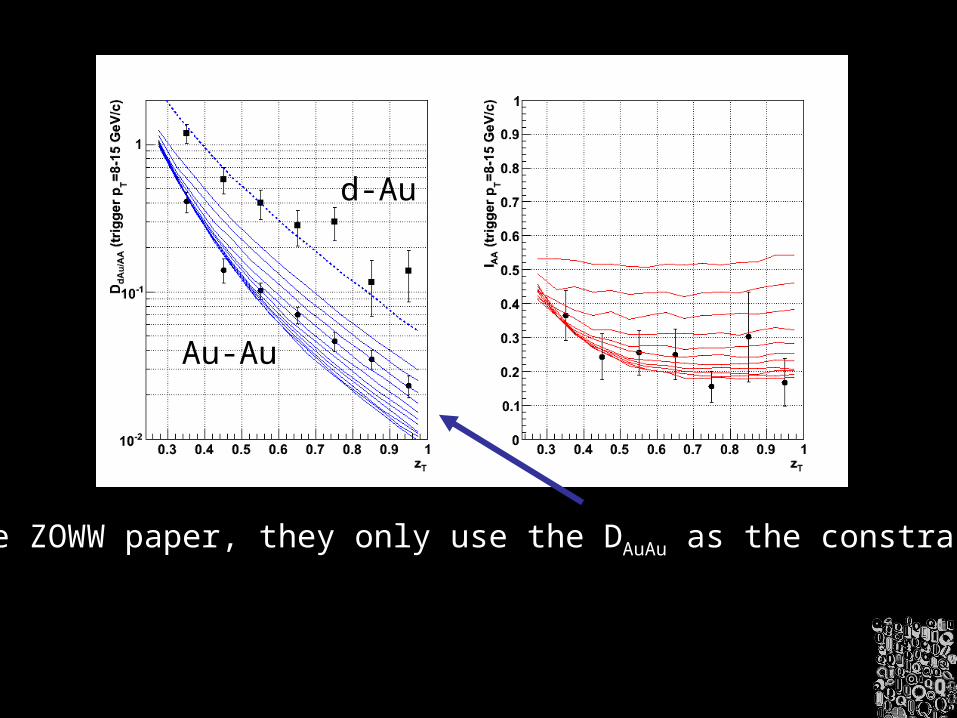
In the ZOWW paper, they only use the DAuAu as the constraint !
d-Au
Au-Au
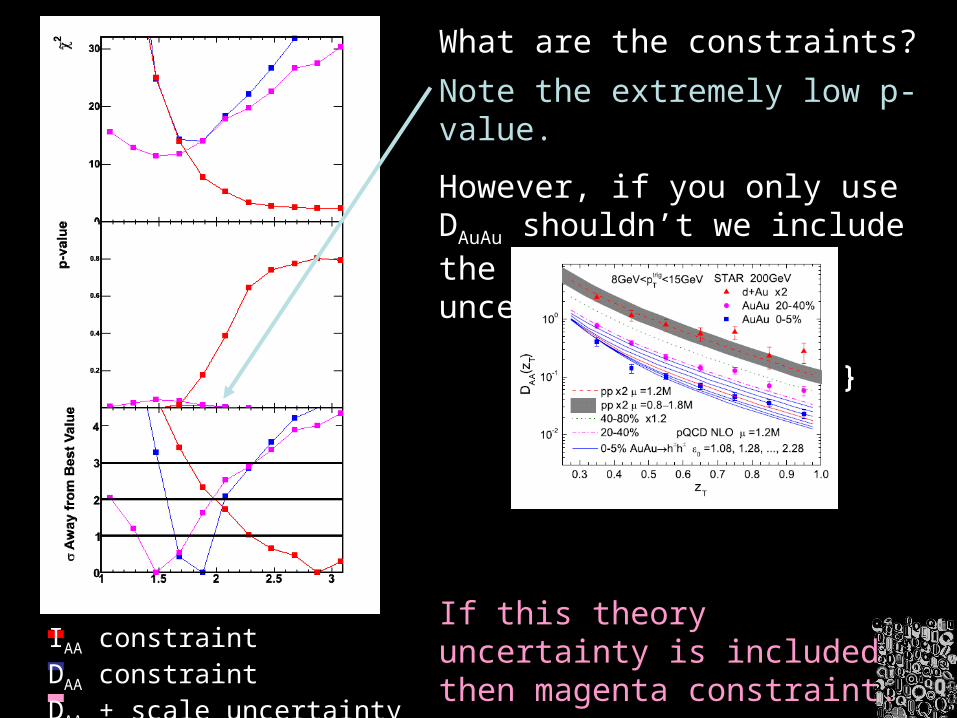
What are the constraints?
Note the extremely low p-value.
However, if you only use DAuAu shouldn’t we include the NLO pQCD scale uncertainty?
If this theory uncertainty is included then magenta constraint.
Does the scale uncertainty cancel in IAuAu (or RAuAu)?
IAA constraintDAA constraintDAA + scale uncertainty
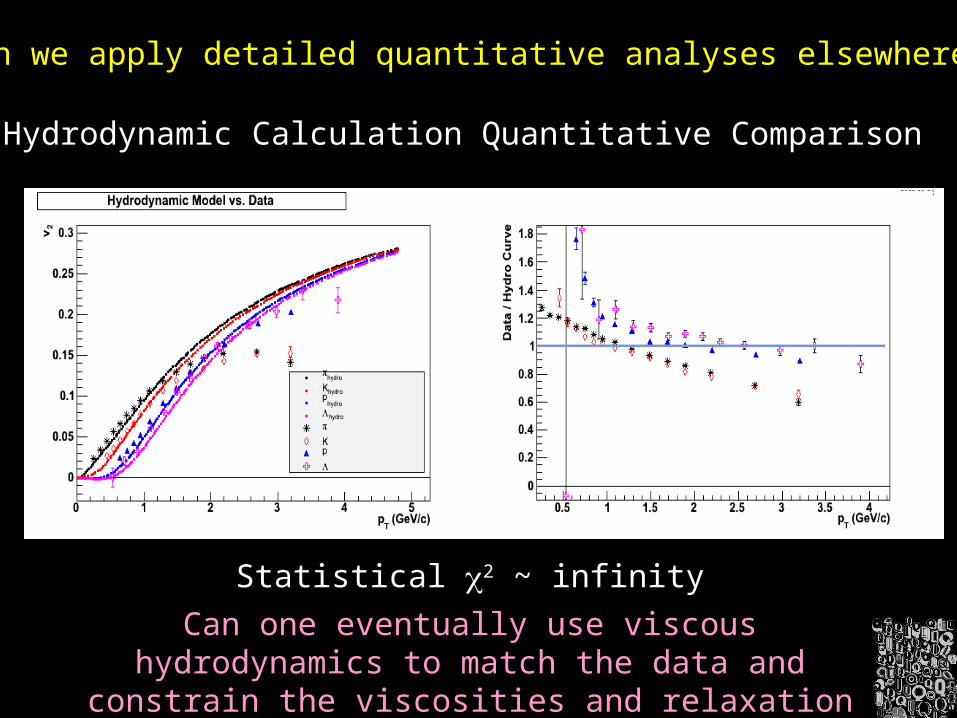
Hydrodynamic Calculation Quantitative Comparison
Statistical 2 ~ infinity
Can we apply detailed quantitative analyses elsewhere?
Can one eventually use viscous hydrodynamics to match the data and constrain the viscosities and
relaxation times?
Q SummaryExperimental observations….
- Well understood method for inclusion of uncertainties
- Large p-p and d-Au data sets will improve IAA
- Experiments need to quantify Type A, B, C uncertainties
- Limits are getting close to Glauber limits (future improvements?)
Theoretical observations….
- Need to resolve fundamental disconnect about whether perturbative calculations describe parton energy-loss
- All calculations need realistic geometry, fluctuations, and running coupling
Some feel (strongly) that these comparisons are premature.
If you feel this way, just consider storing the knowledge of this constraint method away until you believe it is useful !
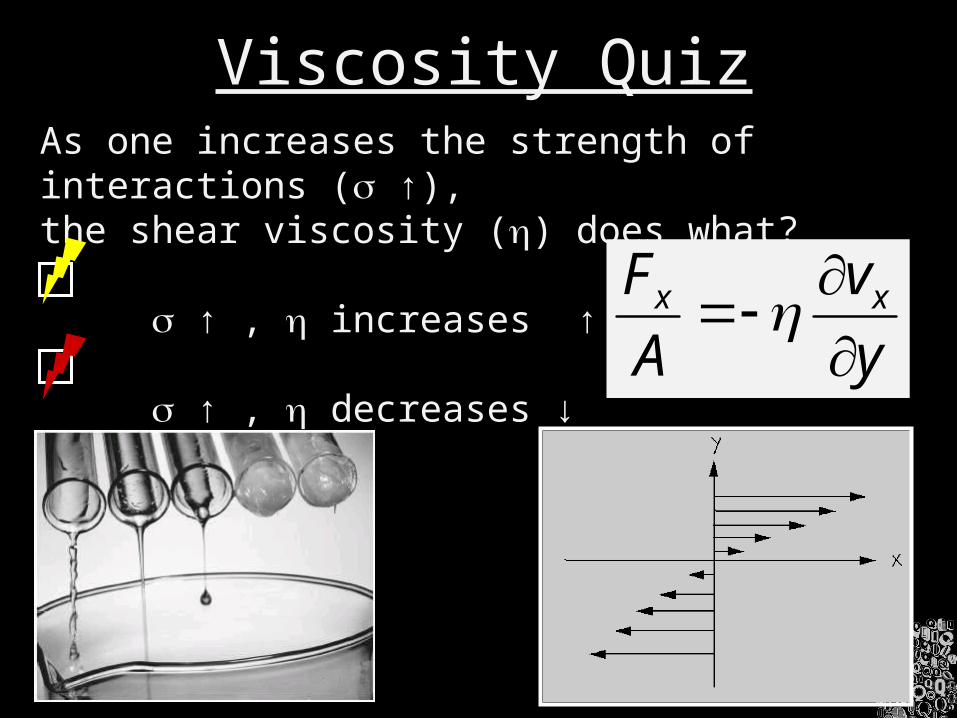
Viscosity QuizAs one increases the strength of interactions ( ↑),the shear viscosity () does what?
↑ , increases ↑
↑ , decreases ↓ y
v
A
F xx
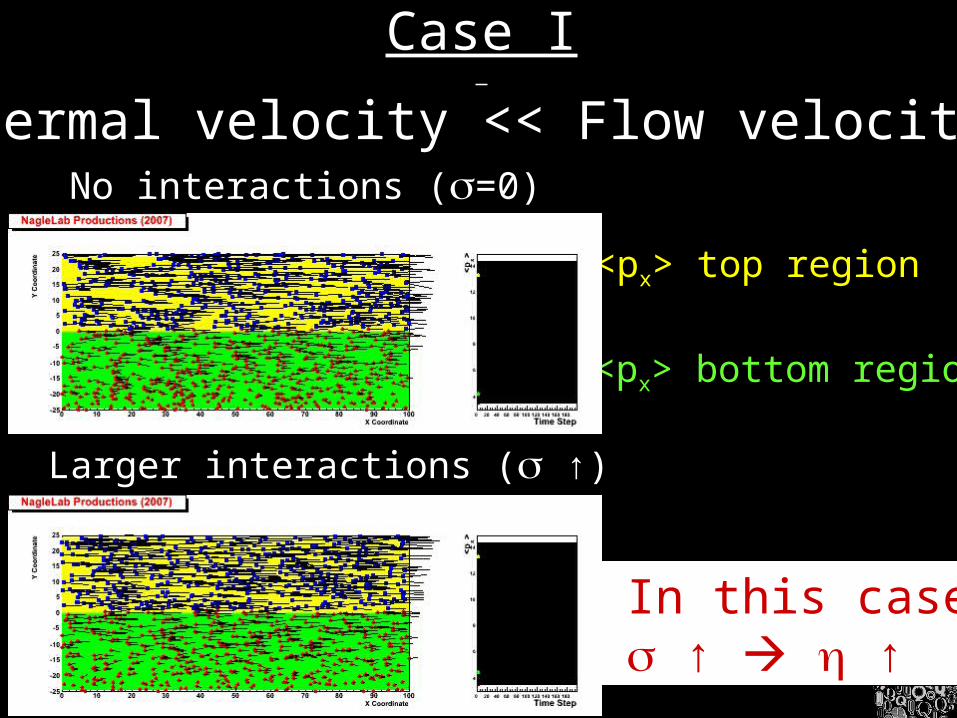
Case I
Thermal velocity << Flow velocity.No interactions (=0)
Larger interactions ( ↑)
<px> top region
<px> bottom region
* In this case, ↑ ↑
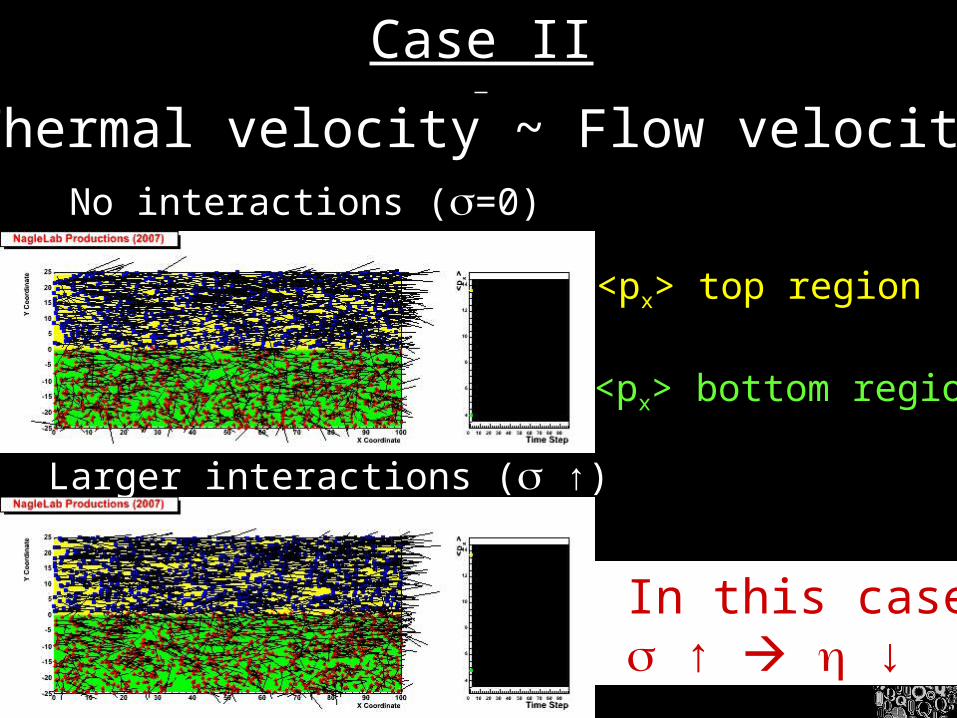
Case II
Thermal velocity ~ Flow velocityNo interactions (=0)
Larger interactions ( ↑)
<px> top region
<px> bottom region
* In this case, ↑ ↓
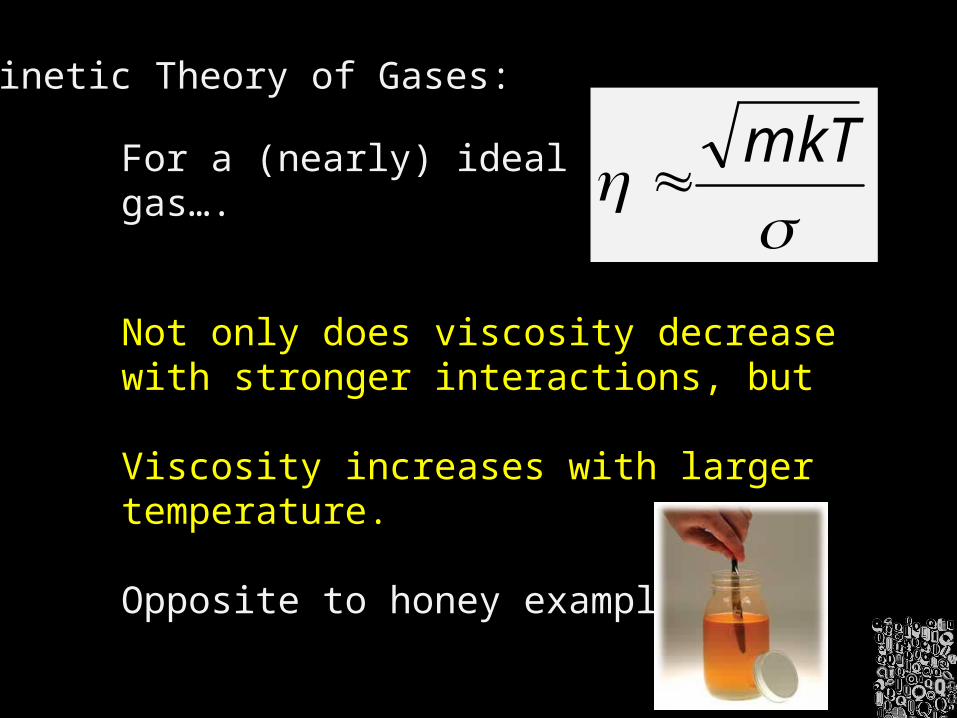
For a (nearly) ideal gas….
mkT
Kinetic Theory of Gases:
Not only does viscosity decrease with stronger interactions, but
Viscosity increases with larger temperature.
Opposite to honey example…
Region of Brain containing higher intellect.
Stimulate that part of your brain for this talk on quantitative statistics!