Embed Size (px)
Citation preview

James River BasinWatershed Inputs and
Critical Conditions
Andrew Parker, Tetra Tech
Science Advisory Panel MeetingApril 26, 2013
VCU Rice Center

Analysis Objectives
? Assess watershed flow and pollutant load inputs to tidal James§ Temporal and
spatial trends? Evaluate critical
conditions§ Occurrence of WQ
exceedances§ Temporal and
spatial trends

Source Data
? Lower James Focus? Stream Flow Data§ USGS
? WQ Data§ USGS§ EPA-CBPO§ DEQ
? Bay Model Output§ Flows§ Pollutant Loads

Source Data
HUC8-CBP Segment Station ID
Sample Dates
Sample Count
Chl aS.
Solid TSS TP PO4
PO4
F. TN NH3 NO2 NO3 NOX
NOX
F.Org.
N
Appom.-TF2
TF5.47/12/84-9/20/12 440 663 0 782 0 804 900 0 0 0 0 926 882
2-APP001.531/14/80-12/4/12 168 788 0 469 0 913 0 154 154 154 0 413 0
2-APP012.791/14/80-12/17/12 1 322 0 313 130 130 59 258 258 258 2 0 0
020416501/17/80-2/5/13 172 761 381 540 14 819 536 73 14 14 29 833 391
Chick.-OH
RET5.1A4/18/88-9/20/12 387 677 0 634 0 677 815 0 0 0 0 856 878
2-CHK002.171/29/80-12/10/12 30 315 0 308 96 160 57 265 256 256 9 0 0
2-CHK035.264/26/84-12/5/12 0 156 0 158 0 12 146 158 12 12 146 0 0
020425001/18/80-2/5/13 10 117 143 170 23 200 170 35 1 1 35 200 52
Middle James-Willis-TF2
TF5.27/12/84-9/20/12 433 337 0 390 0 409 595 0 0 0 0 564 574
2-JMS110.301/23/80-12/4/12 172 487 0 315 15 541 0 167 167 166 2 218 0
2-JMS113.205/17/06-12/4/12 124 154 0 154 0 125 149 27 0 0 27 127 0

Source DataHUC8-CBP Segment Station ID
Sample Dates
Sample Count
Chl a S. Solid TSS TP PO4 PO4 F. TN NH3 NO2 NO3 NOX NOX F. Org. N
Lower James-TF1
TF5.67/12/84-9/20/12 443 677 0 786 0 818 883 0 0 0 0 913 881
2-JMS050.575/19/80-12/4/12 0 186 0 219 145 35 65 164 157 157 7 0 0
Lower James-OH RET5.27/12/84-9/6/12 438 658 0 785 0 805 980 0 0 0 0 989 1001
Lower James-MH LE5.29/25/84-9/6/12 439 668 0 765 0 800 917 0 0 0 0 949 891
Hampton Roads-MH
2-NAN010.696/14/83-6/5/02 6 130 0 119 41 89 0 121 132 132 0 0 0
2-NAN019.141/29/80-12/27/12 68 320 0 297 126 133 59 256 261 262 0 0 0
Hampton Roads-PH
EBE12/27/89-9/26/12 522 555 0 559 0 556 526 0 0 0 0 561 524
LE5.69/25/84-9/25/12 451 669 0 770 0 795 905 0 0 0 0 922 778
LFB011/22/98-9/25/12 184 375 0 333 0 371 358 0 0 0 0 371 448
SBE22/28/89-9/26/12 522 556 0 559 0 571 540 0 0 0 0 572 543
WBE12/27/89-9/25/12 521 556 0 545 0 563 526 0 0 0 0 566 567
2-EBE000.401/7/80-12/13/12 41 246 0 124 39 208 0 158 168 169 0 78 0
2-ELI004.791/22/98-12/18/12 197 389 0 18 0 382 0 2 0 0 0 382 0
2-LAF003.831/22/98-12/18/12 203 399 0 18 0 390 0 0 0 0 0 390 0
2-SBE001.531/7/80-5/19/10 1 190 0 130 39 136 0 163 175 175 0 1 0
2-WBE004.441/22/98-12/18/12 195 386 0 33 14 374 0 13 14 14 0 375 0

Watershed Inputs

Watershed Inputs Background
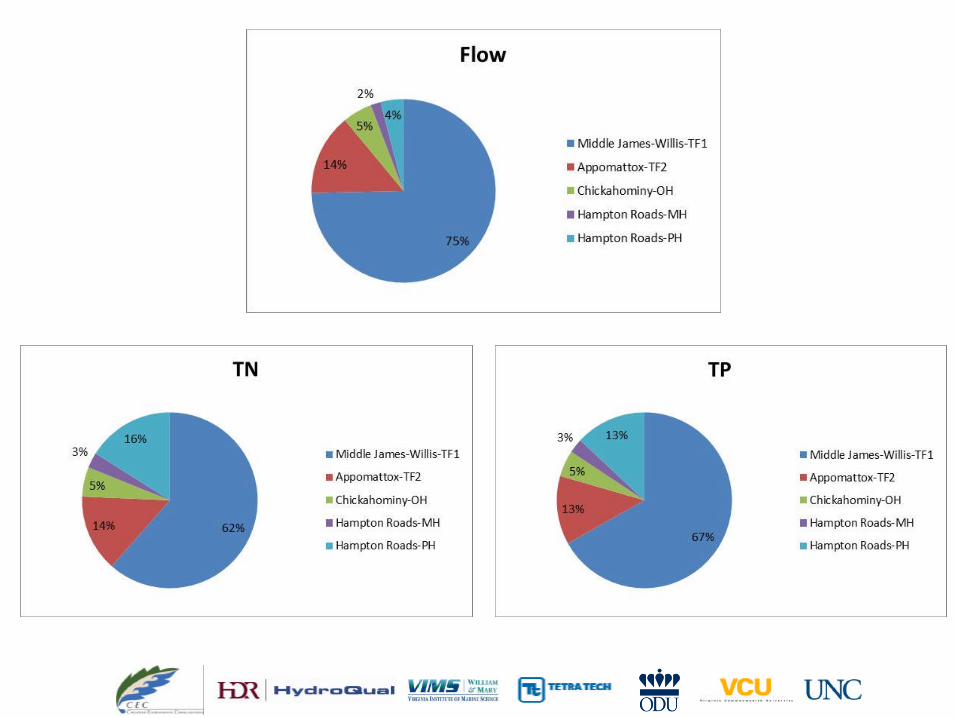
? What is the nutrient contribution to the tidal James?§ Coincident flow and water quality data used to estimate loads§ CBPO watershed model output used where flow data were
unavailable or water quality data were tidally influenced? 5 segments (90% of watershed):§ Middle James-Willis-TF1§ Appomattox-TF2§ Chickahominy-OH
§ Hampton Roads-MH (Nansemond R.)§ Hampton Roads-PH (Elizabeth R.)
? 5 pollutants§ Total nitrogen (TN)§ Total phosphorus (TP)§ Nitrate (NO3)
§ Organic nitrogen (Org N)§ Dissolved ortho-phosphorus (PO4)

Watershed Inputs Background

Watershed Inputs

Per acre

Watershed Inputs Summary
HUC8-CBP Seg Drainage DescriptionDrainage Area (mi2)
Flow (ac-ft/yr)
Average Annual Load (kg/yr)
TN TP NO3* Organic N PO4*
Middle James-Willis-TF1
James River above Richmond, VA 6,803
5,220,046 (5,498,103)
3,862,264 (5,200,729)
497,462 (1,029,412)
1,684,411 (1,210,077)
3,306,826 (3,668,970)
178,599 (256,273)
Appomattox-TF2 Appomattox River 1,6121,004,705
(1,041,983)889,927
(1,214,049)93,908
(116,339)342,016
(483,926)515,389
(559,754)20,012
(42,620)
Chickahominy-OH Chickahominy River 470
363,779 (359,017)
341,327 (216,167)
36,092 (27,363)
113,556 (76,945)
255,122 (128,392)
4,798 (18,742)
Hampton Roads-MH** Nansemond River 201 (122,613) (178,566) (19,595) (71,870) (94,948) (12,441)
Hampton Roads-PH** Elizabeth River 168 (282,399) (1,007,514) (97,125) (311,000) (336,028) (72,701)
Total 9,2546,993,543
(7,304,115)6,279,599
(7,817,025)744,181
(1,289,834)2,522,853
(2,153,818)4,508,312
(4,788,092)288,551
(402,777)
*Bay Model simulated values in (parentheses)

Watershed Inputs Summary
? Higher flows (winter>spring/fall>summer) result in higher nutrient loads
? Generally consistent nutrient contribution across watershed§ Exception is Hampton Roads-PH drainage (Elizabeth R.)
• Urban watershed (Norfolk and Portsmouth)
• Permitted discharges
? Applicability of analysis§ Similar analysis during calibration§ Accurate representation of facilities§ Improve model nutrient prediction

Critical Condition Analysis
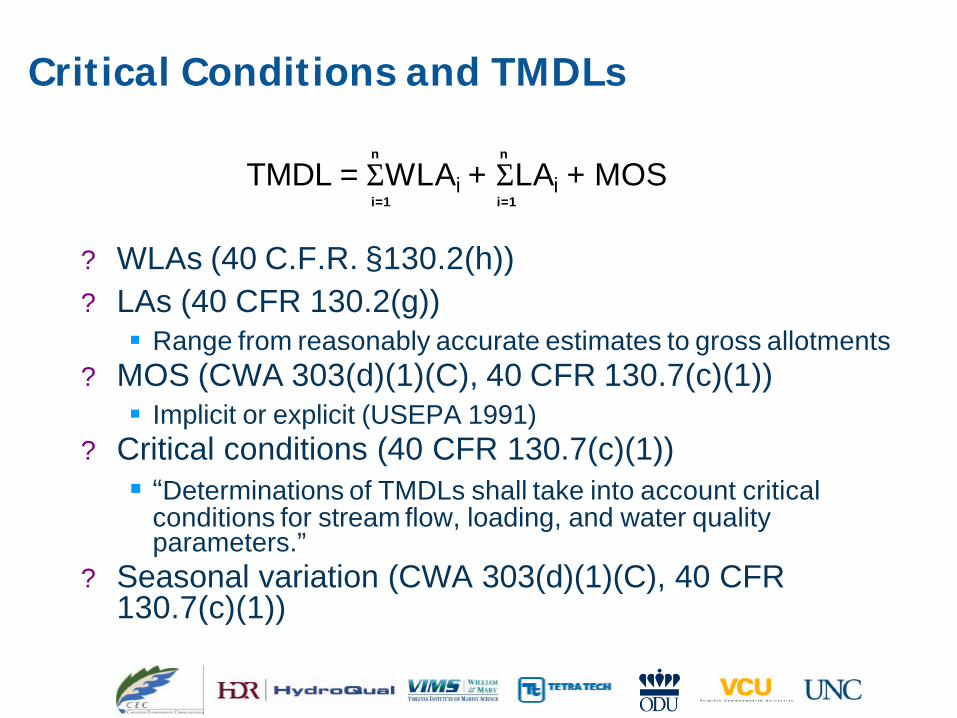
Critical Conditions and TMDLs
? WLAs (40 C.F.R. §130.2(h)) ? LAs (40 CFR 130.2(g)) § Range from reasonably accurate estimates to gross allotments
? MOS (CWA 303(d)(1)(C), 40 CFR 130.7(c)(1))§ Implicit or explicit (USEPA 1991)
? Critical conditions (40 CFR 130.7(c)(1))§ “Determinations of TMDLs shall take into account critical
conditions for stream flow, loading, and water quality parameters.”
? Seasonal variation (CWA 303(d)(1)(C), 40 CFR 130.7(c)(1))
TMDL = ΣWLAi + ΣLAi + MOSn
i=1
n
i=1

Previous Analysis for the James River
? Analysis during Bay TMDL development§ Tested for correlation between flow and chlorophyll a
exceedances of criteria§ Flow magnitude assessed as return period § Average annual flows summarized for 3-yr period§ Return period compared to Chlorophyll a violations over the
Bay Model simulation time period (1984–2004)§ Similar approach to bay-wide analysis for DO, which
targeted 10-yr return period (1993-1995)§ No strong correlation found
? Previous analysis limitations§ One flow gage (02037500) used for analysis at all locations§ Water quality data only though 2004

Updated Analysis
? Reconstructed previous analysis using updated water quality and flow data (1984–2012)
? Data summarized for spring and summer? Correlation was assessed for five locations
HUC8-CBP Segment USGS Stream-flow StationWater Quality
Station
Appomattox-TF2 02041650 TF5.4
Middle James-Willis-TF2 02037500 TF5.2
Lower James-TF1 Sum of 02037500; 02041650 TF5.6
Lower James-MHSum of 02037500; 02041650; 02042500 LE5.2
Lower James-OHSum of 02037500; 02041650; 02042500 RET5.2

Analysis Results
? Strength of correlation determined using:§ Non-parametric Kendall Tau
• Score range -1 to 1• Score of 1 indicates perfect association, negative sign indicates
inverse relationship
§ Single-variable linear regression with hypothesis test to determine significance
Kendall Tau Score (abs.) Correlation
0.0–0.33 Weak
0.33–0.67 Moderate
0.67–1.0 Strong

Analysis Results-Spring
? Tau scores indicate weak correlations during spring? Appomattox-TF2 and Lower James-OH show the highest
scores (inverse relationship)? Appomattox-TF2 and Lower James-OH only segments with
r2>0? No segment meets hypothesis test (low p-value)
HUC8-CBP SegmentKendall Tau
Score r2 p-value
Appomattox-TF2 -0.13 0.08 0.36
Middle James-Willis-TF2 0.07 0.00 0.82
Lower James-TF1 0.08 0.00 0.58
Lower James-OH -0.16 0.12 0.27
Lower James-MH 0.10 0.00 0.51

Analysis Results-Spring

Analysis Results-Summer
? Tau scores indicate weak correlations during summer but stronger than for spring
? ~Moderate scores are seen at Appomattox-TF2 (inverse) and Middle James-Willis-TF2 (direct)
? Appomattox-TF2 meets hypothesis test (p<0.05)
HUC8-CBP SegmentKendall Tau
Score r2 p-value
Appomattox-TF2 -0.31 0.13 0.03
Middle James-Willis-TF2 0.36 0.61 0.08
Lower James-TF1 0.00 0.15 1.00
Lower James-OH 0.08 0.02 0.57
Lower James-MH -0.19 0.1 0.17

Analysis Results-Summer

Paired Data Analysis
? Water quality and flow data paired with coincident chlorophyll a sampling
? Supplements statistical analysis? Same five locations plus Hampton Roads-PH and
Chickahominy-OH ? Paired data compared in 2 ways:
1. Grouped into percentile ranges with weighted chlorophyll a concentrations compared to min, max, and mean of the paired flow or pollutant concentration
2. Grouped by month with weighted chlorophyll a concentrations compared to mean flow or pollutant concentration

Paired Data AnalysisMiddle James Willis-TF2 Appomattox-TF2

Paired Data AnalysisLower James-TF1 Lower James-MH

Analysis Summary
? Statistical analysis§ Generally weak relationship between flow and
chlorophyll a exceedances§ Justifies deterministic model development
? Paired data analysis § Variable relationship by location§ Justifies deterministic model development§ Useful for supporting watershed model calibration

Potential Next Steps
? Use chlorophyll a concentrations rather than exceedances
? Vary flow averaging periods (months and multi-year averaging period)
? Focus solely on algae data analysis and not flow


![(Www.entrance-exam.net)-Corporation Bank PO Sample Paper 2[1]_new](https://img.pdfslide.us/doc/110x75/577d27411a28ab4e1ea36fcb/wwwentrance-examnet-corporation-bank-po-sample-paper-21new.jpg)