Embed Size (px)
DESCRIPTION
Combining migration data from multiple sources: Applications to internal movements in England, 1999-2007. James Raymer with Peter W.F. Smith and Corrado Giulietti Southampton Statistical Sciences Research Insitute (S3RI). - PowerPoint PPT Presentation
Citation preview
1
Combining migration data from multiple sources: Applications to internal movements in England, 1999-2007James Raymer
with Peter W.F. Smith and Corrado GiuliettiSouthampton Statistical Sciences Research Insitute (S3RI)
Centre for Spatial Analysis and Policy, University of Leeds, 19 February 2009
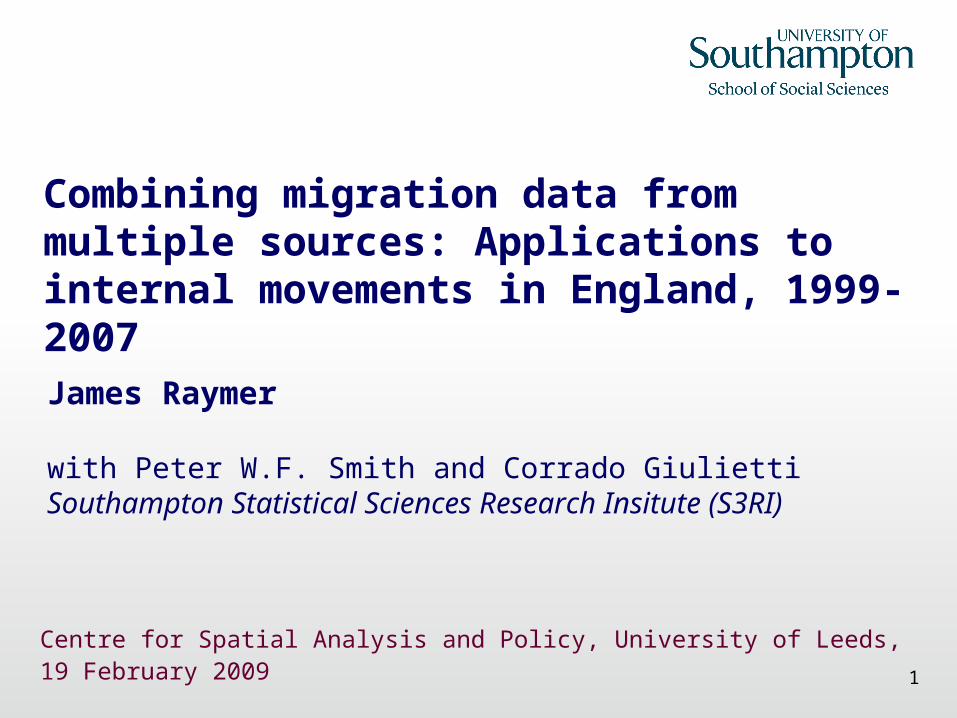
ESRC project on Combining Migration Data in England and Wales
• Develop a methodology for combining migration data and for producing ‘more detailed’ flows over time
• Applications include flows by ethnicity, economic activity and education at regional, county and area group levels
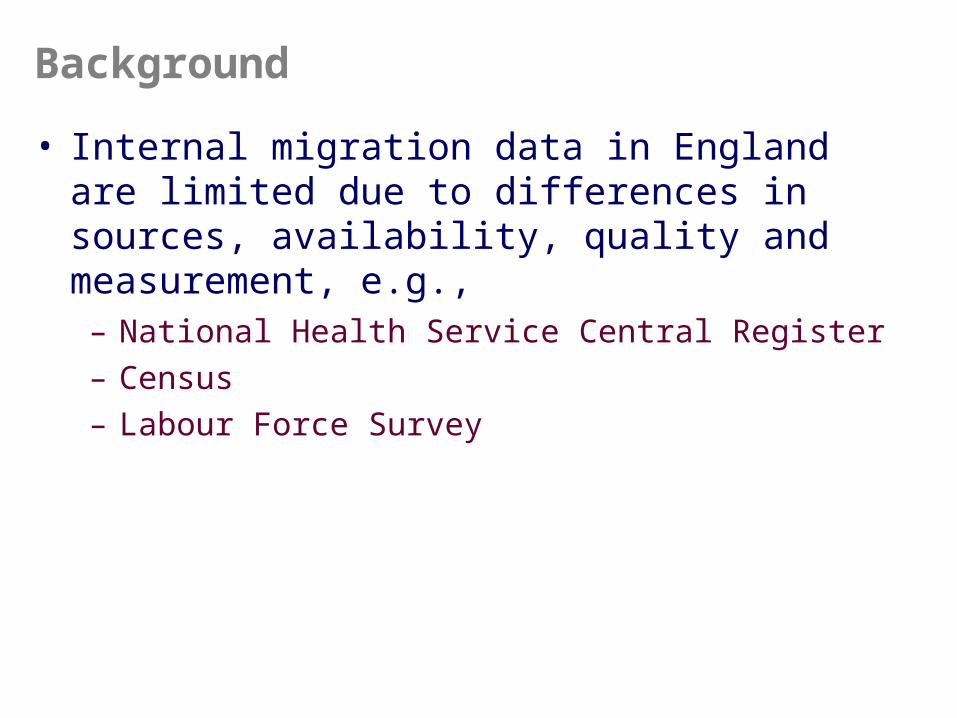
Background
• Internal migration data in England are limited due to differences in sources, availability, quality and measurement, e.g., – National Health Service Central Register– Census– Labour Force Survey
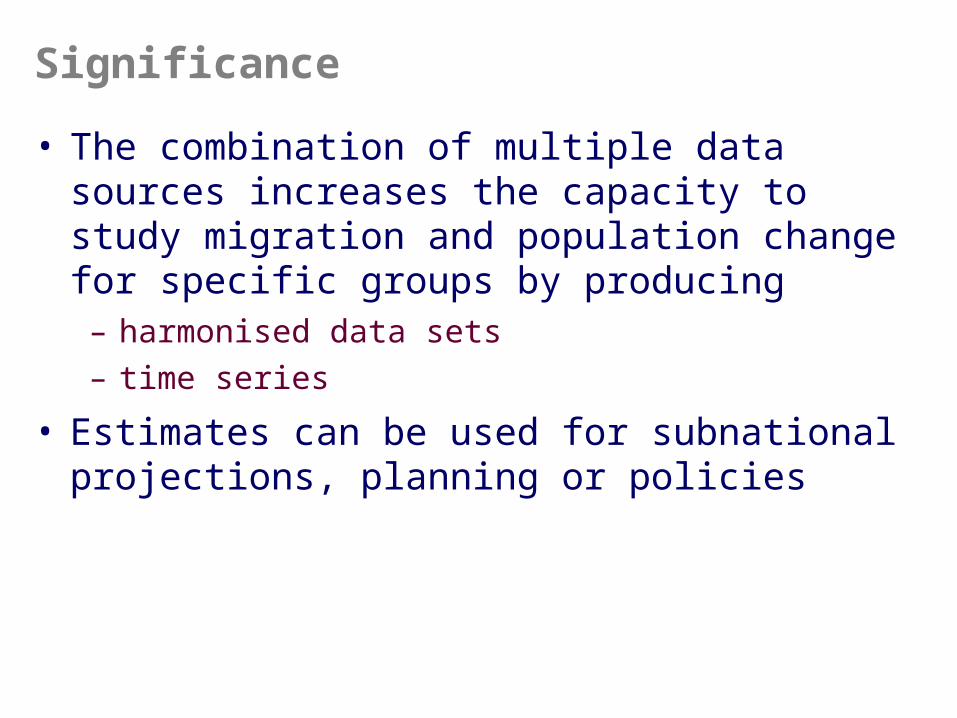
Significance
• The combination of multiple data sources increases the capacity to study migration and population change for specific groups by producing – harmonised data sets– time series
• Estimates can be used for subnational projections, planning or policies
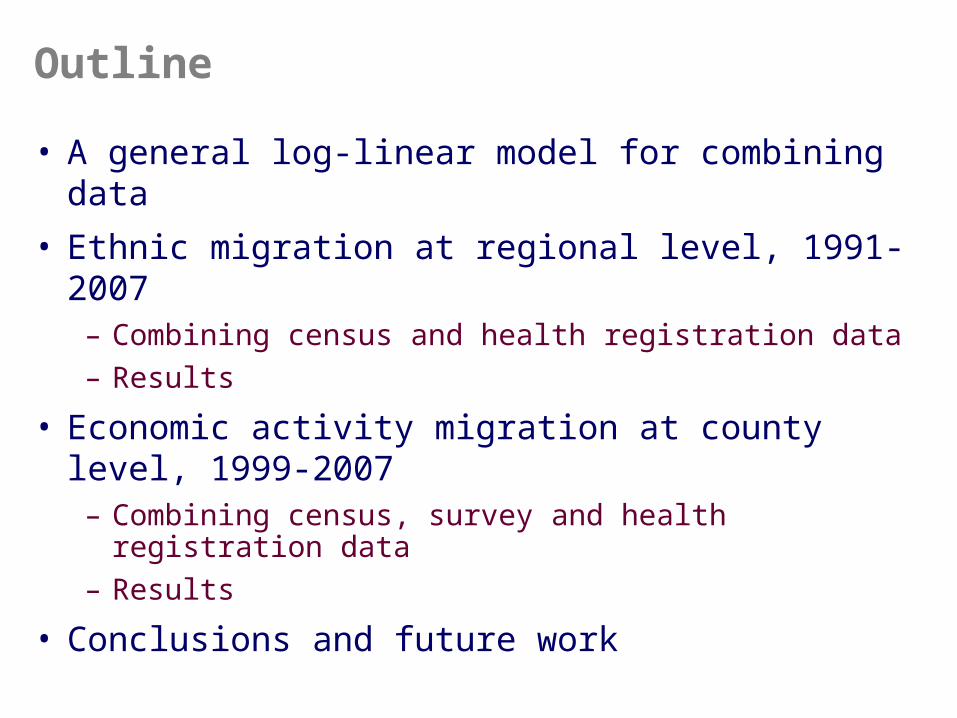
Outline
• A general log-linear model for combining data
• Ethnic migration at regional level, 1991-2007– Combining census and health registration data– Results
• Economic activity migration at county level, 1999-2007– Combining census, survey and health registration
data– Results
• Conclusions and future work
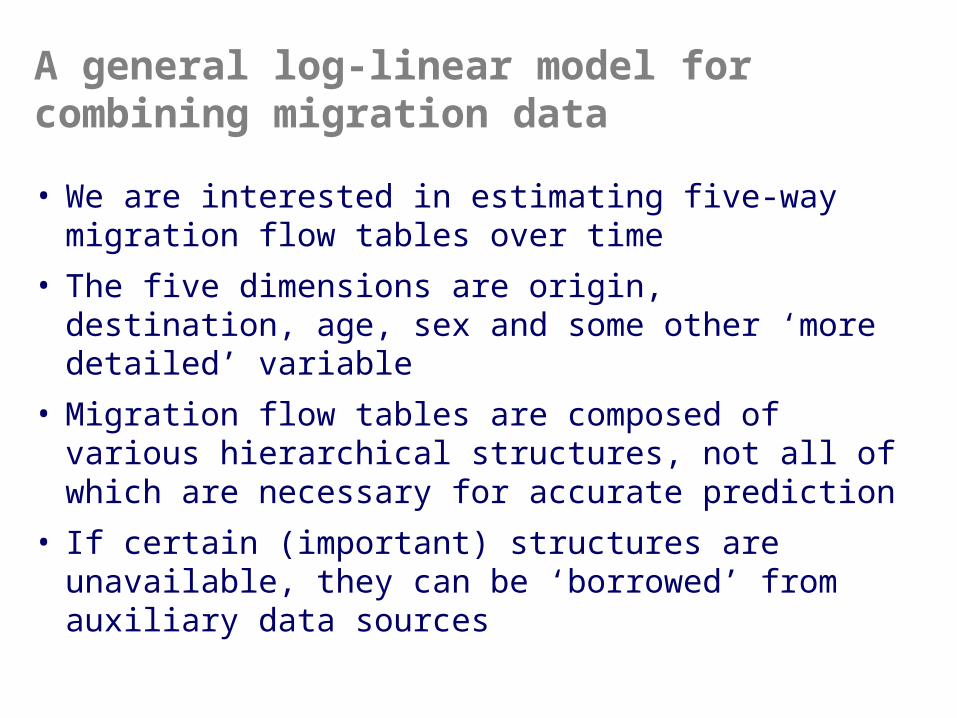
A general log-linear model for combining migration data
• We are interested in estimating five-way migration flow tables over time
• The five dimensions are origin, destination, age, sex and some other ‘more detailed’ variable
• Migration flow tables are composed of various hierarchical structures, not all of which are necessary for accurate prediction
• If certain (important) structures are unavailable, they can be ‘borrowed’ from auxiliary data sources
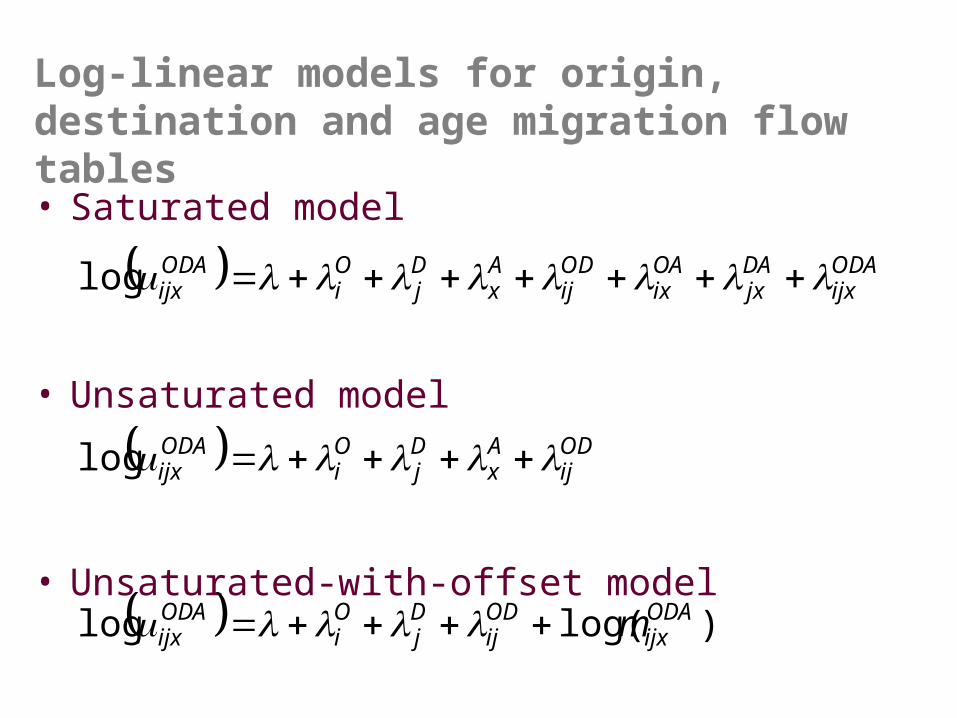
Log-linear models for origin, destination and age migration flow tables• Saturated model
• Unsaturated model
• Unsaturated-with-offset model
ODij
Ax
Dj
Oi
ODAijx log
)log(log ODAijx
ODij
Dj
Oi
ODAijx m
ODAijx
DAjx
OAix
ODij
Ax
Dj
Oi
ODAijx log
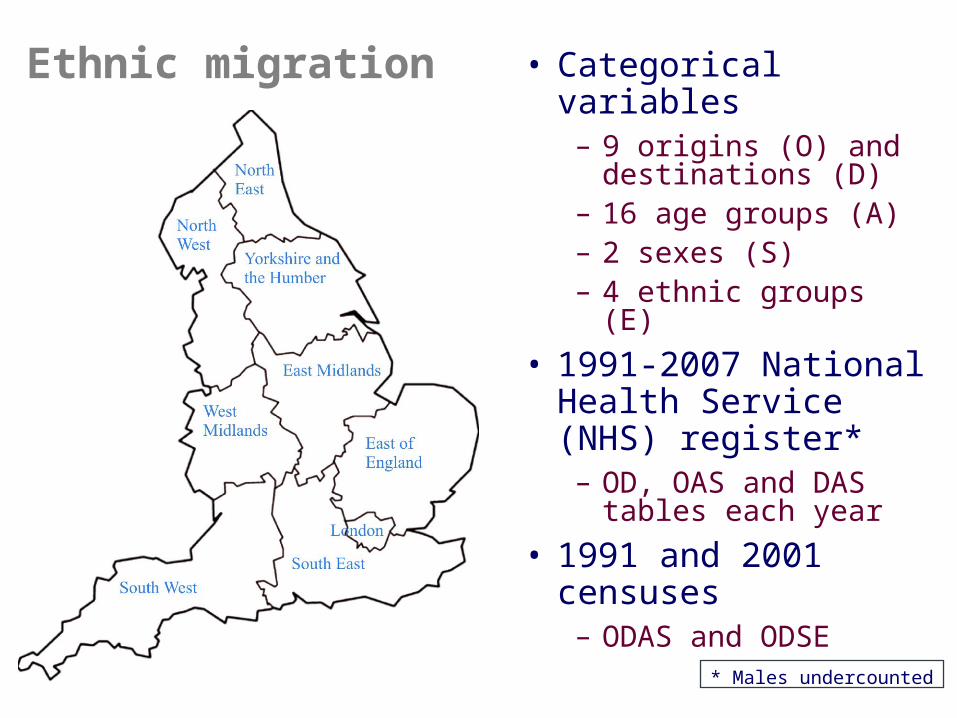
Ethnic migration • Categorical variables– 9 origins (O) and
destinations (D)– 16 age groups (A) – 2 sexes (S)– 4 ethnic groups (E)
• 1991-2007 National Health Service (NHS) register*– OD, OAS and DAS
tables each year
• 1991 and 2001 censuses– ODAS and ODSE
* Males undercounted
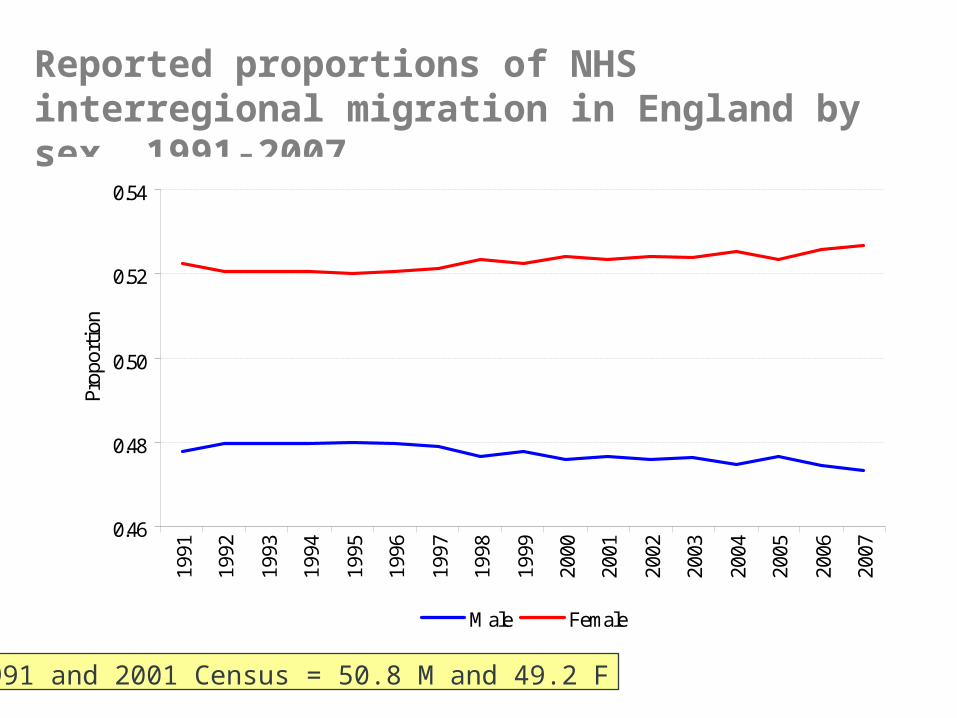
Reported proportions of NHS interregional migration in England by sex, 1991-2007
1991 and 2001 Census = 50.8 M and 49.2 F
0.46
0.48
0.50
0.52
0.5419
91
1992
1993
1994
1995
1996
1997
1998
1999
2000
2001
2002
2003
2004
2005
2006
2007
Prop
orti
on
Male Female
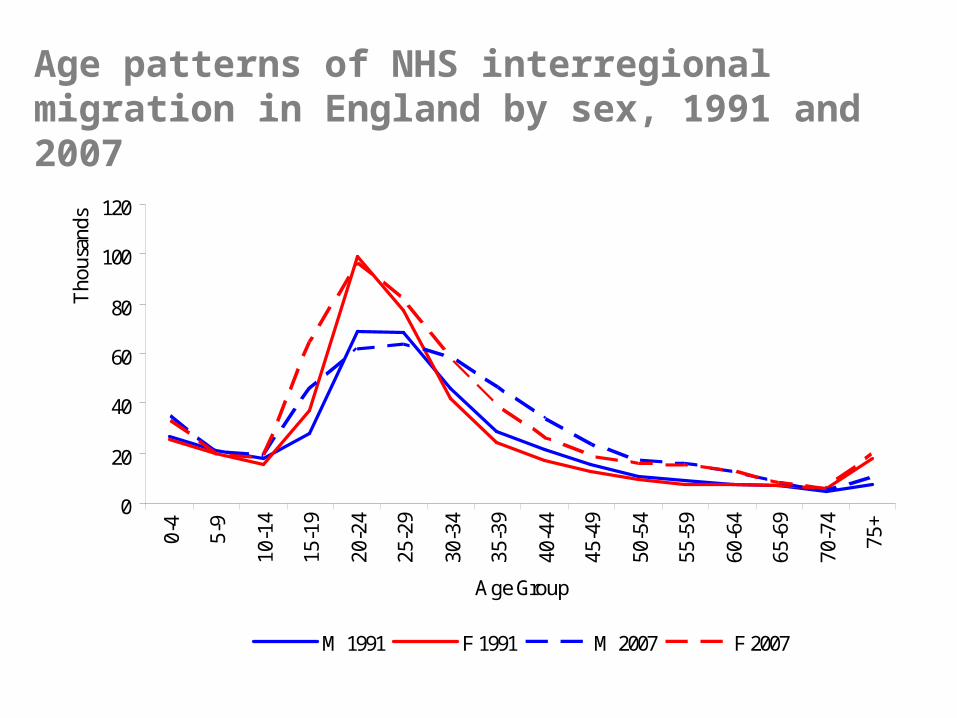
Age patterns of NHS interregional migration in England by sex, 1991 and 2007
0
20
40
60
80
100
120
0-4
5-9
10-1
4
15-1
9
20-2
4
25-2
9
30-3
4
35-3
9
40-4
4
45-4
9
50-5
4
55-5
9
60-6
4
65-6
9
70-7
4
75+
Tho
usan
ds
Age Group
M 1991 F 1991 M 2007 F 2007
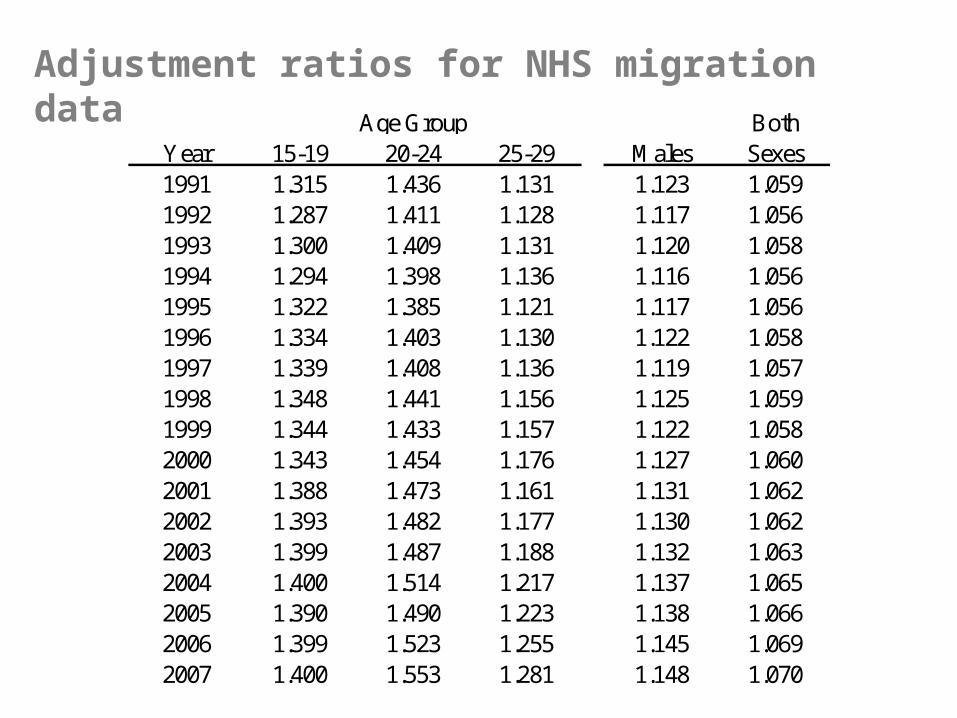
Adjustment ratios for NHS migration data Both
Year 15-19 20-24 25-29 Males Sexes1991 1.315 1.436 1.131 1.123 1.0591992 1.287 1.411 1.128 1.117 1.0561993 1.300 1.409 1.131 1.120 1.0581994 1.294 1.398 1.136 1.116 1.0561995 1.322 1.385 1.121 1.117 1.0561996 1.334 1.403 1.130 1.122 1.0581997 1.339 1.408 1.136 1.119 1.0571998 1.348 1.441 1.156 1.125 1.0591999 1.344 1.433 1.157 1.122 1.0582000 1.343 1.454 1.176 1.127 1.0602001 1.388 1.473 1.161 1.131 1.0622002 1.393 1.482 1.177 1.130 1.0622003 1.399 1.487 1.188 1.132 1.0632004 1.400 1.514 1.217 1.137 1.0652005 1.390 1.490 1.223 1.138 1.0662006 1.399 1.523 1.255 1.145 1.0692007 1.400 1.553 1.281 1.148 1.070
Age Group
Basic framework
• Data preparation
• Identification of key structures and theoretical model
• Estimate the flows
• Analyse the results
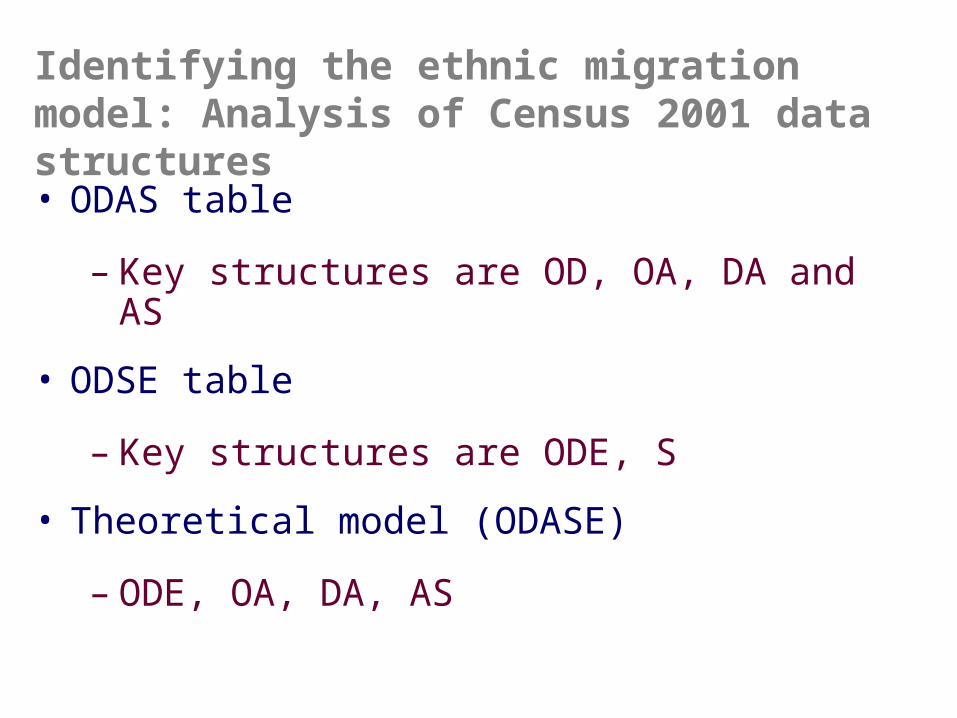
Identifying the ethnic migration model: Analysis of Census 2001 data structures• ODAS table
– Key structures are OD, OA, DA and AS
• ODSE table
– Key structures are ODE, S
• Theoretical model (ODASE)
– ODE, OA, DA, AS
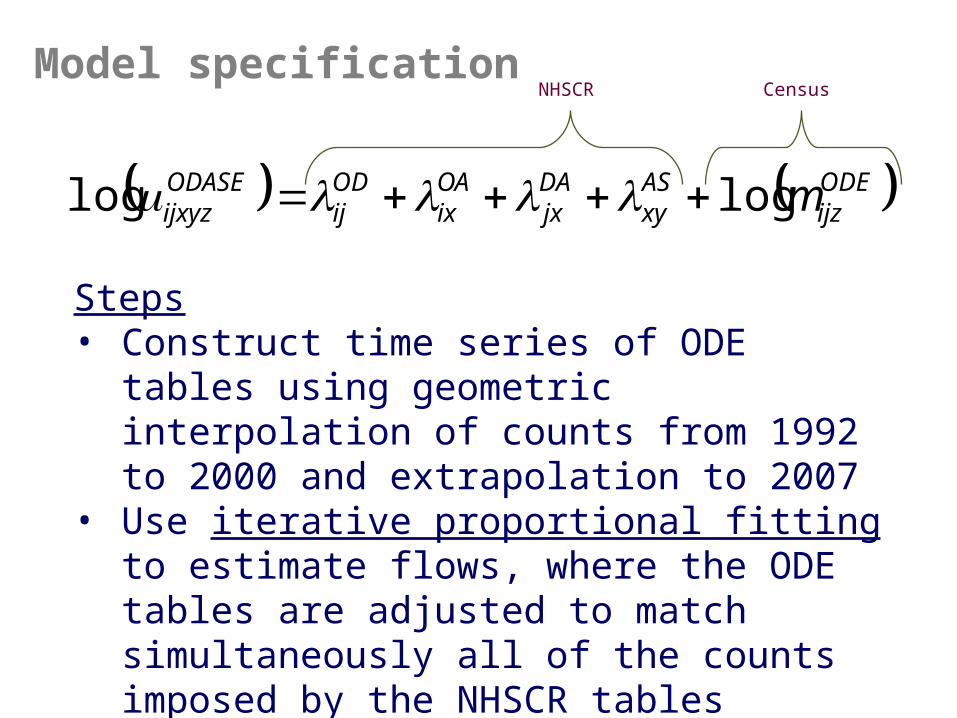
Model specification
ODEijz
ASxy
DAjx
OAix
ODij
ODASEijxyz mloglog
Steps• Construct time series of ODE tables
using geometric interpolation of counts from 1992 to 2000 and extrapolation to 2007
• Use iterative proportional fitting to estimate flows, where the ODE tables are adjusted to match simultaneously all of the counts imposed by the NHSCR tables
• Adjust counts of males for three age groups
NHSCR Census
0
10
20
30
40
50
60
70
80
1991 1993 1995 1997 1999 2001 2003 2005 2007
Tho
usan
ds
South Asian Black Chinese & Other
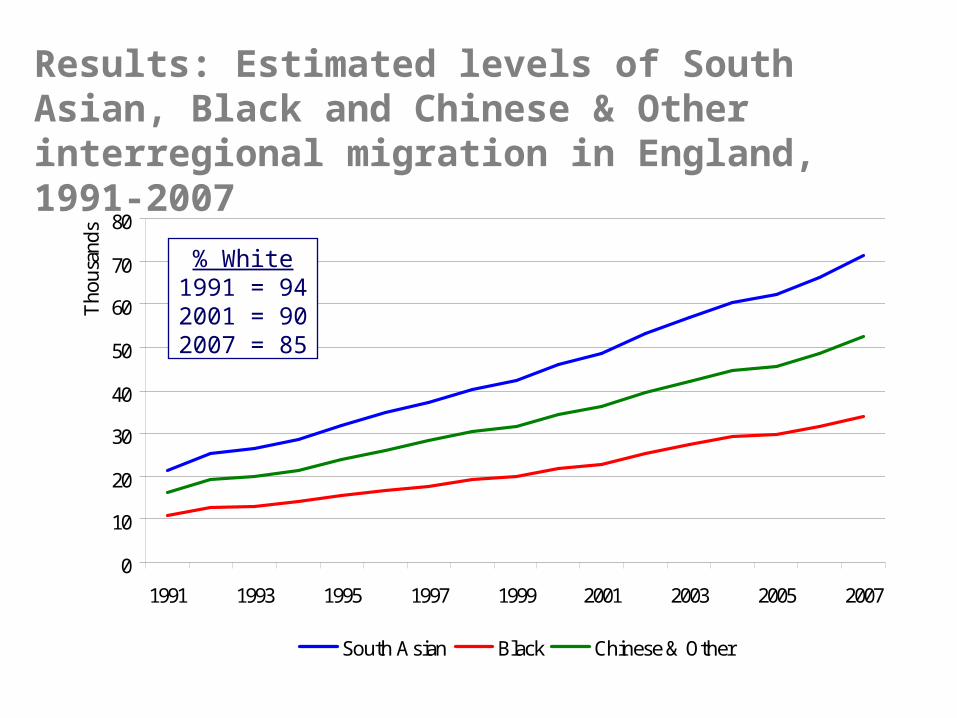
Results: Estimated levels of South Asian, Black and Chinese & Other interregional migration in England, 1991-2007
% White1991 = 942001 = 902007 = 85
0
1
2
3
4
5
6
7
8
1991
1993
1995
1997
1999
2001
2003
2005
2007
Tho
usan
ds
0
1
2
3
4
5
6
7
8
1991
1993
1995
1997
1999
2001
2003
2005
2007
Tho
usan
ds
0
1
2
3
4
5
6
7
8
1991
1993
1995
1997
1999
2001
2003
2005
2007
Tho
usan
ds
0
10
20
30
40
50
60
70
80
90
1991
1993
1995
1997
1999
2001
2003
2005
2007
Tho
usan
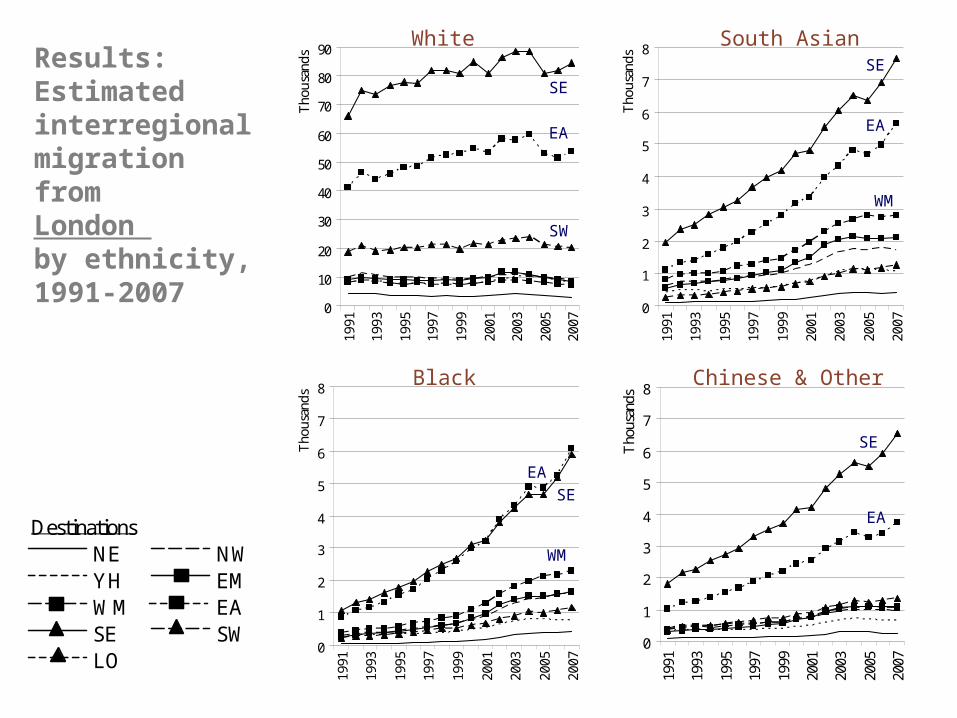
dsResults: Estimated interregional migration from London by ethnicity, 1991-2007
White South Asian
Black Chinese & Other
DestinationsNE NWYH EMWM EASE SWLO
SE
EA
SW
SE
EA
WM
SE
EA
EASE
WM
0
10
20
30
40
50
60
70
80
90
1991
1993
1995
1997
1999
2001
2003
2005
2007
Tho
usan
ds
0
1
2
3
4
5
6
7
8
1991
1993
1995
1997
1999
2001
2003
2005
2007
Tho
usan
ds
0
1
2
3
4
5
6
7
8
1991
1993
1995
1997
1999
2001
2003
2005
2007
Tho
usan
ds
0
1
2
3
4
5
6
7
8
1991
1993
1995
1997
1999
2001
2003
2005
2007
Tho
usan
ds
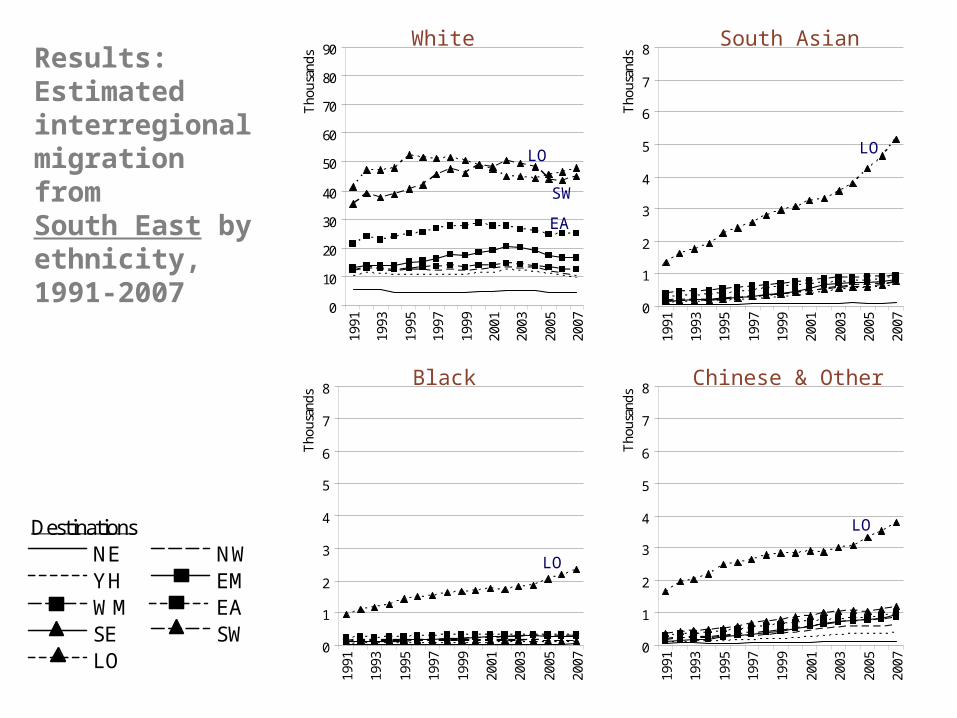
Results: Estimated interregional migration from South East by ethnicity, 1991-2007
White South Asian
Black Chinese & Other
DestinationsNE NWYH EMWM EASE SWLO
LO
SW
EA
LO
LO
LO
0
100
200
300
400
500
600
700
800
900
0 5 10 15 20 25 30 35 40 45 50 55 60 65 70 75+
Age
1991 1999 2007
0
100
200
300
400
500
600
700
800
900
0 5 10 15 20 25 30 35 40 45 50 55 60 65 70 75+
Age
1991 1999 2007
0
50
100
150
200
250
300
0 5 10 15 20 25 30 35 40 45 50 55 60 65 70 75+
Age
1991 1999 2007
0
50
100
150
200
250
300
0 5 10 15 20 25 30 35 40 45 50 55 60 65 70 75+
Age
1991 1999 2007
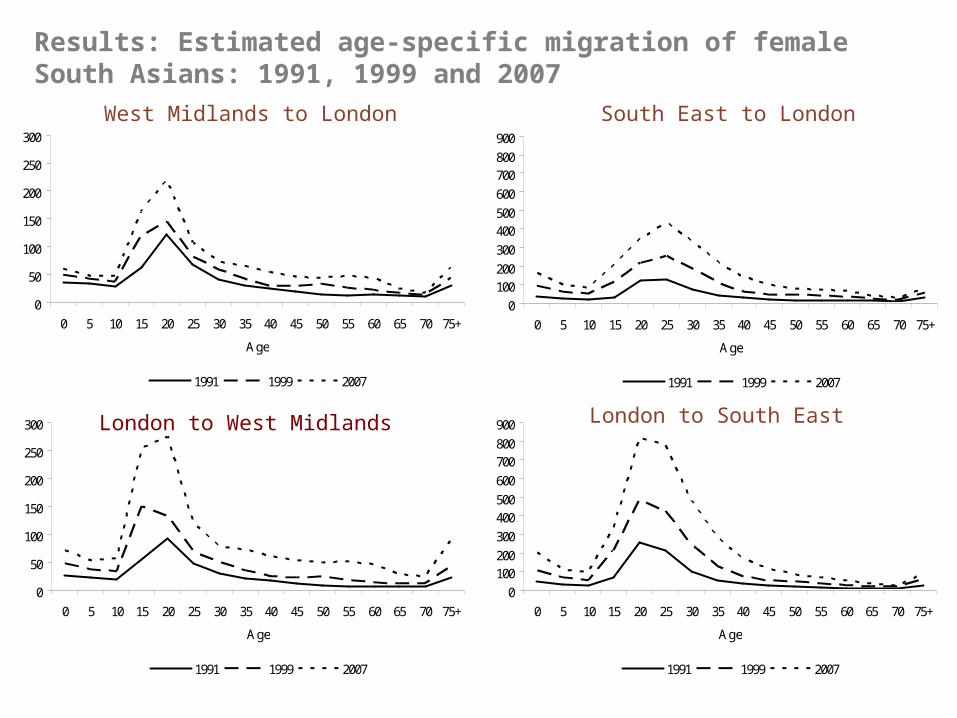
Results: Estimated age-specific migration of female South Asians: 1991, 1999 and 2007
West Midlands to London
London to South East
South East to London
London to West Midlands
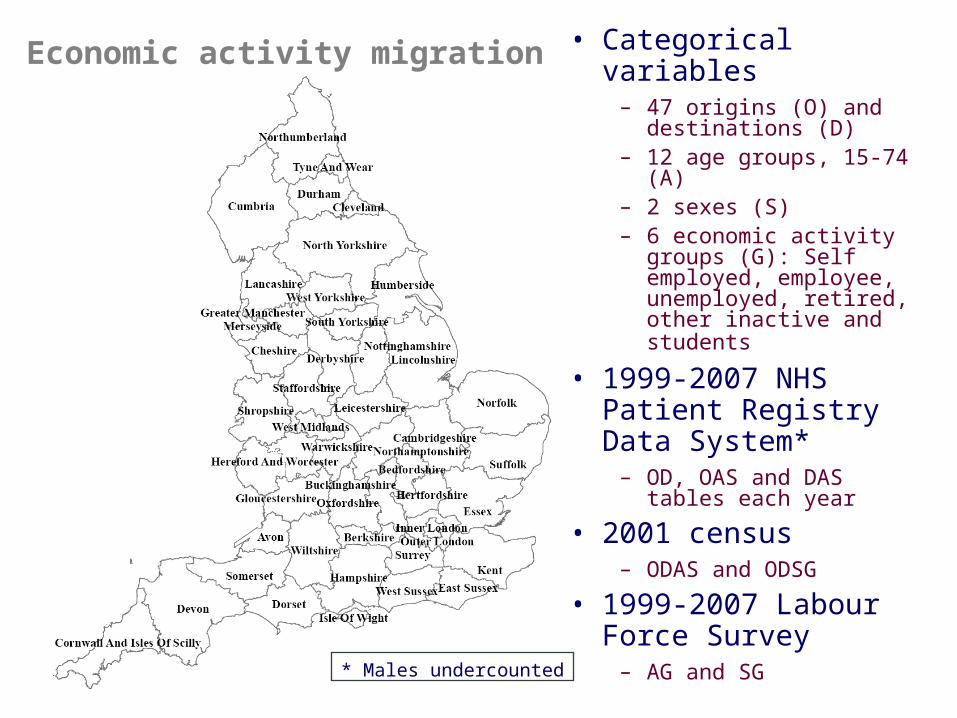
• Categorical variables– 47 origins (O) and
destinations (D)– 12 age groups, 15-74
(A)– 2 sexes (S)– 6 economic activity
groups (G): Self employed, employee, unemployed, retired, other inactive and students
• 1999-2007 NHS Patient Registry Data System*
– OD, OAS and DAS tables each year
• 2001 census– ODAS and ODSG
• 1999-2007 Labour Force Survey
– AG and SG
Economic activity migration
* Males undercounted
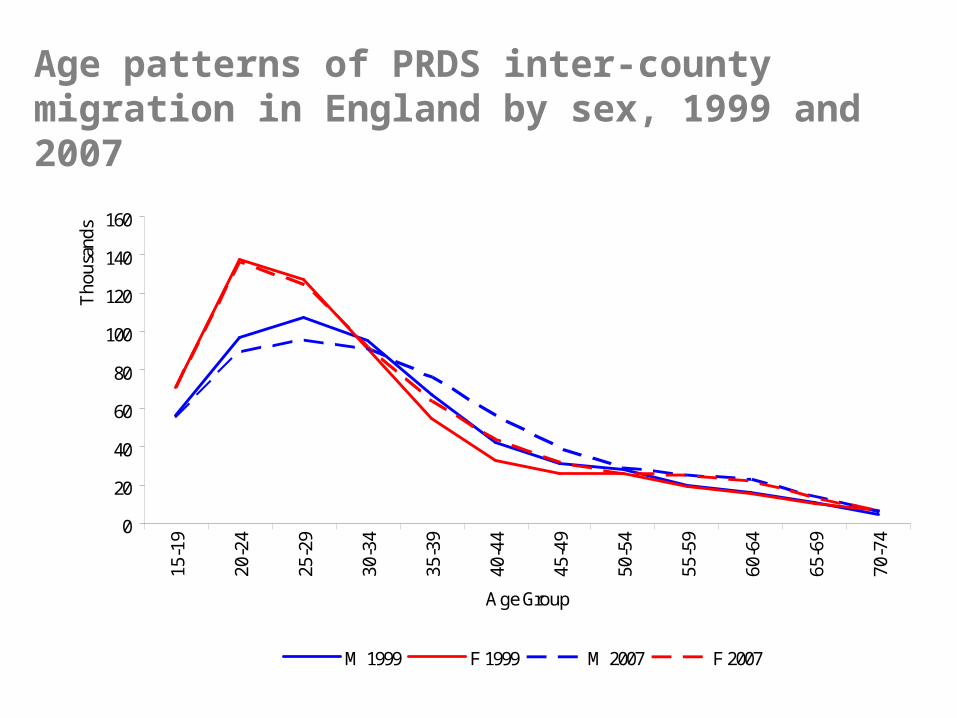
Age patterns of PRDS inter-county migration in England by sex, 1999 and 2007
0
20
40
60
80
100
120
140
160
15-1
9
20-2
4
25-2
9
30-3
4
35-3
9
40-4
4
45-4
9
50-5
4
55-5
9
60-6
4
65-6
9
70-7
4
Tho
usan
ds
Age Group
M 1999 F 1999 M 2007 F 2007
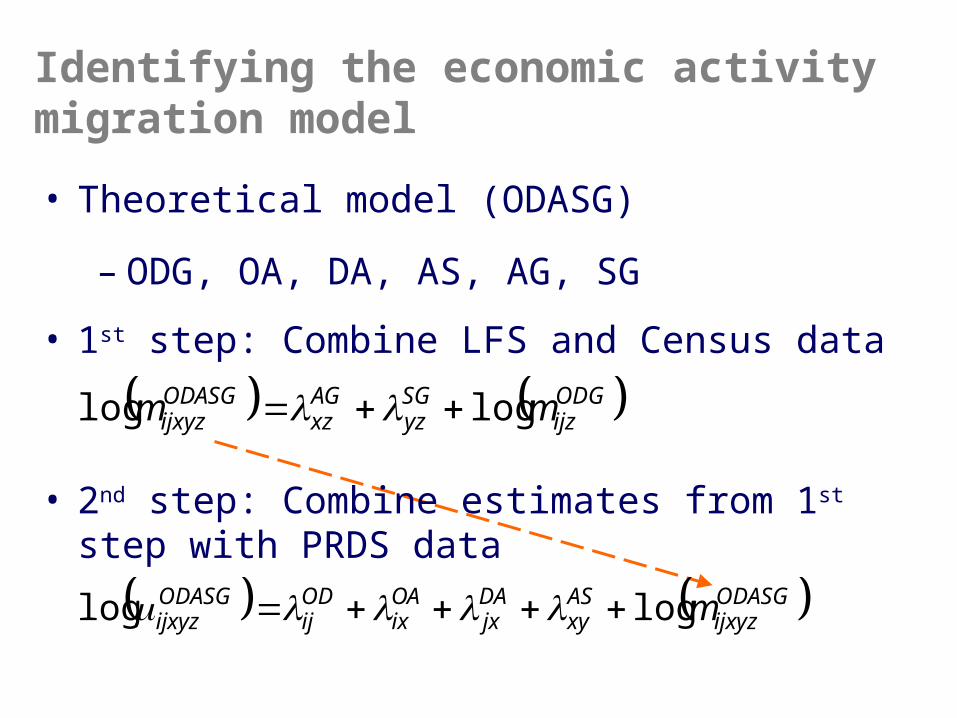
Identifying the economic activity migration model
• Theoretical model (ODASG)
– ODG, OA, DA, AS, AG, SG
• 1st step: Combine LFS and Census data
• 2nd step: Combine estimates from 1st step with PRDS data
ODASGijxyz
ASxy
DAjx
OAix
ODij
ODASGijxyz mloglog
ODGijz
SGyz
AGxz
ODASGijxyz mm loglog
-
200
400
600
800
1,000
1,200
1,400
1999 2001 2003 2005 2007
Tho
usan
ds
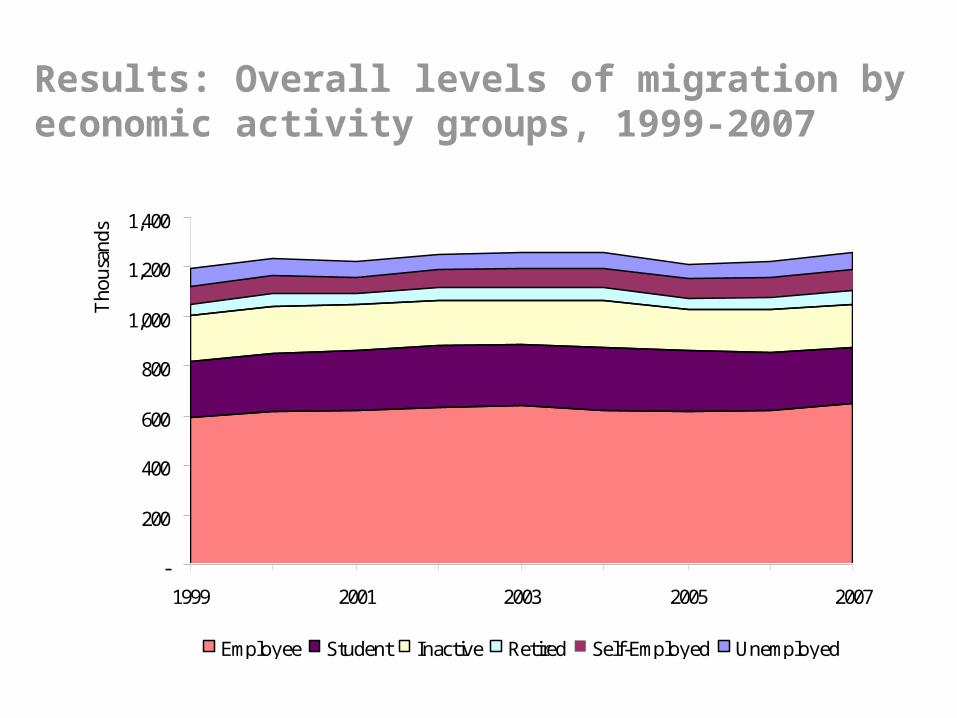
Employee Student Inactive Retired Self-Employed Unemployed
Results: Overall levels of migration by economic activity groups, 1999-2007
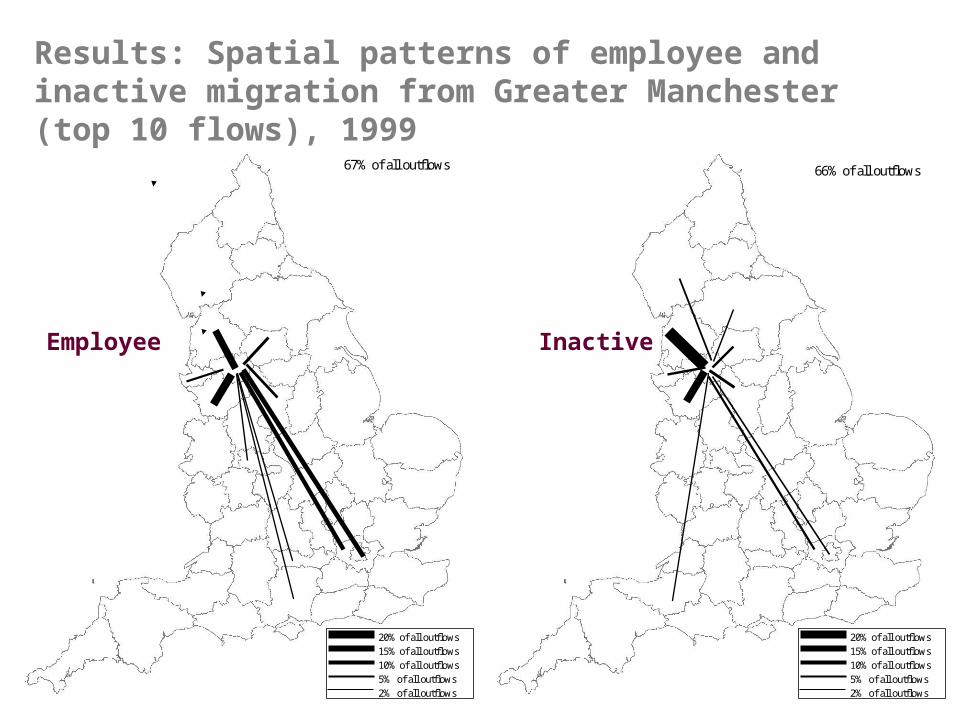
20% of all outflows15% of all outflows10% of all outflows5% of all outflows2% of all outflows
67% of all outflows
20% of all outflows15% of all outflows10% of all outflows5% of all outflows2% of all outflows
66% of all outflows
Results: Spatial patterns of employee and inactive migration from Greater Manchester (top 10 flows), 1999
Employee Inactive
20% of all outflows15% of all outflows10% of all outflows5% of all outflows2% of all outflows
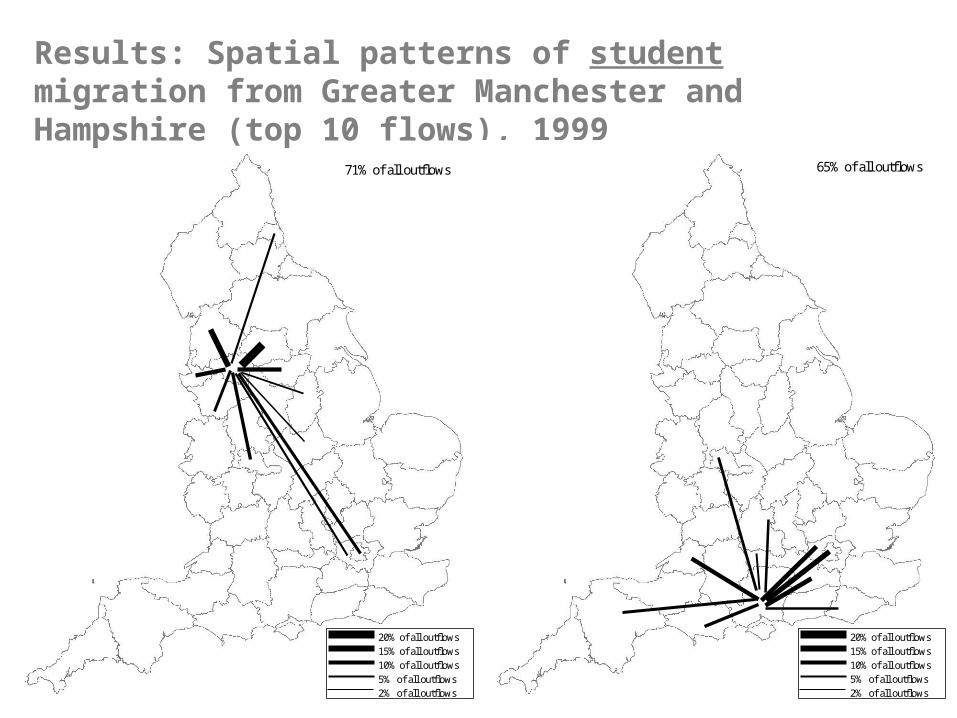
71% of all outflows
Results: Spatial patterns of student migration from Greater Manchester and Hampshire (top 10 flows), 1999
20% of all outflows15% of all outflows10% of all outflows5% of all outflows2% of all outflows
65% of all outflows
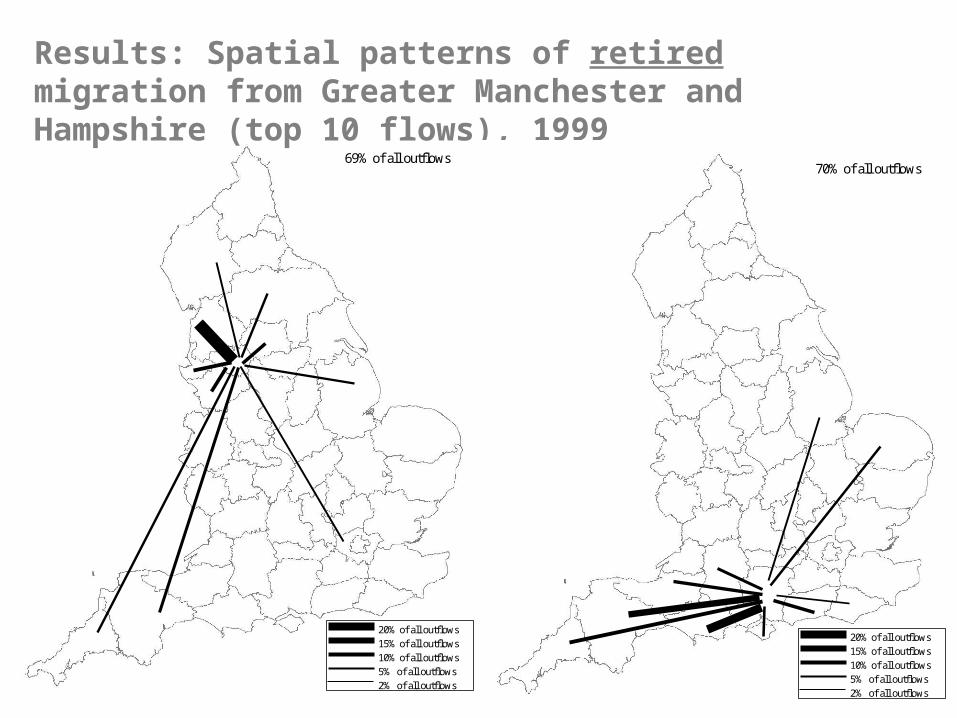
20% of all outflows15% of all outflows10% of all outflows5% of all outflows2% of all outflows
69% of all outflows
Results: Spatial patterns of retired migration from Greater Manchester and Hampshire (top 10 flows), 1999
20% of all outflows15% of all outflows10% of all outflows5% of all outflows2% of all outflows
70% of all outflows
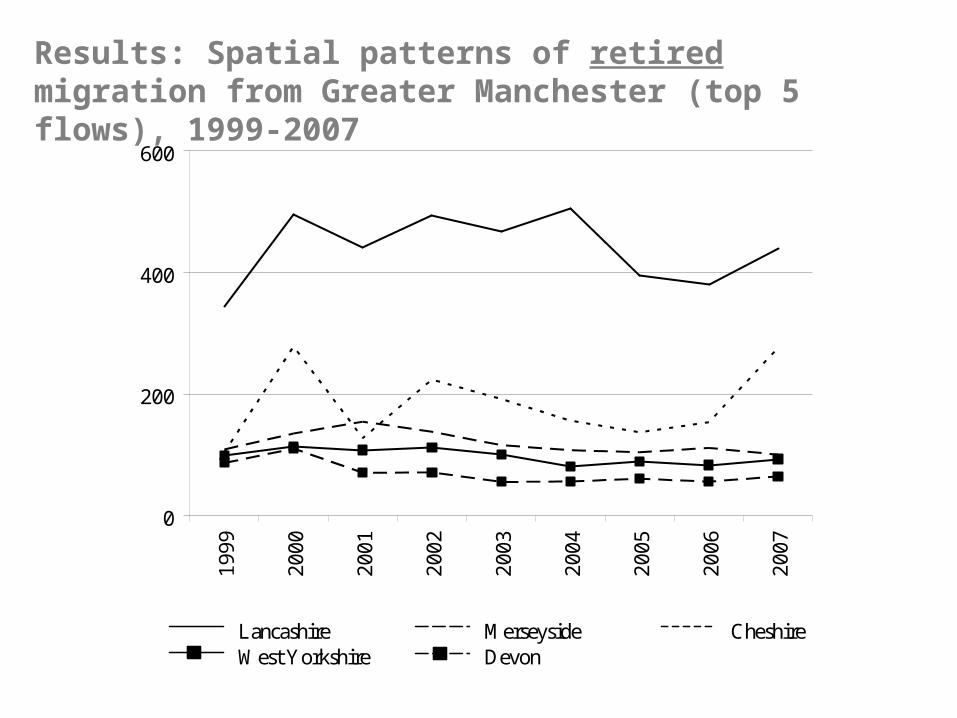
Lancashire Merseyside CheshireWest Yorkshire Devon
0
200
400
600
1999
2000
2001
2002
2003
2004
2005
2006
2007
0
500
1000
1500
2000
1999
2000
2001
2002
2003
2004
2005
2006
2007
Results: Spatial patterns of retired migration from Greater Manchester (top 5 flows), 1999-2007
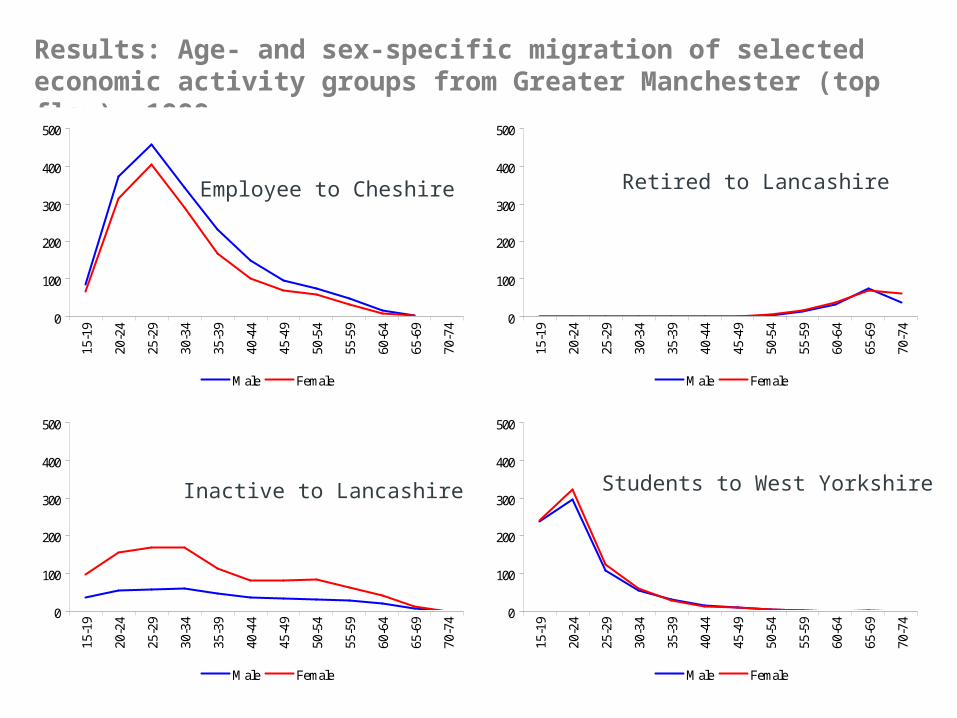
Results: Age- and sex-specific migration of selected economic activity groups from Greater Manchester (top flow), 1999
0
100
200
300
400
500
15-1
9
20-2
4
25-2
9
30-3
4
35-3
9
40-4
4
45-4
9
50-5
4
55-5
9
60-6
4
65-6
9
70-7
4
Male Female
0
100
200
300
400
500
15-1
9
20-2
4
25-2
9
30-3
4
35-3
9
40-4
4
45-4
9
50-5
4
55-5
9
60-6
4
65-6
9
70-7
4
Male Female
0
100
200
300
400
500
15-1
9
20-2
4
25-2
9
30-3
4
35-3
9
40-4
4
45-4
9
50-5
4
55-5
9
60-6
4
65-6
9
70-7
4
Male Female
0
100
200
300
400
500
15-1
9
20-2
4
25-2
9
30-3
4
35-3
9
40-4
4
45-4
9
50-5
4
55-5
9
60-6
4
65-6
9
70-7
4
Male Female
Employee to Cheshire Retired to Lancashire
Students to West YorkshireInactive to Lancashire
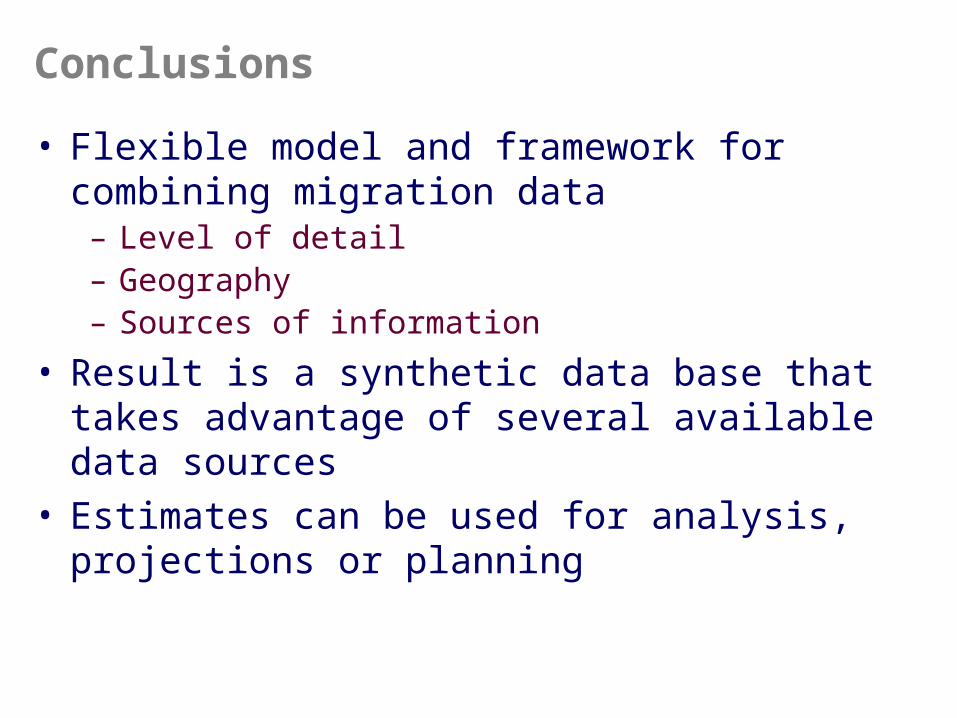
Conclusions
• Flexible model and framework for combining migration data– Level of detail– Geography– Sources of information
• Result is a synthetic data base that takes advantage of several available data sources
• Estimates can be used for analysis, projections or planning
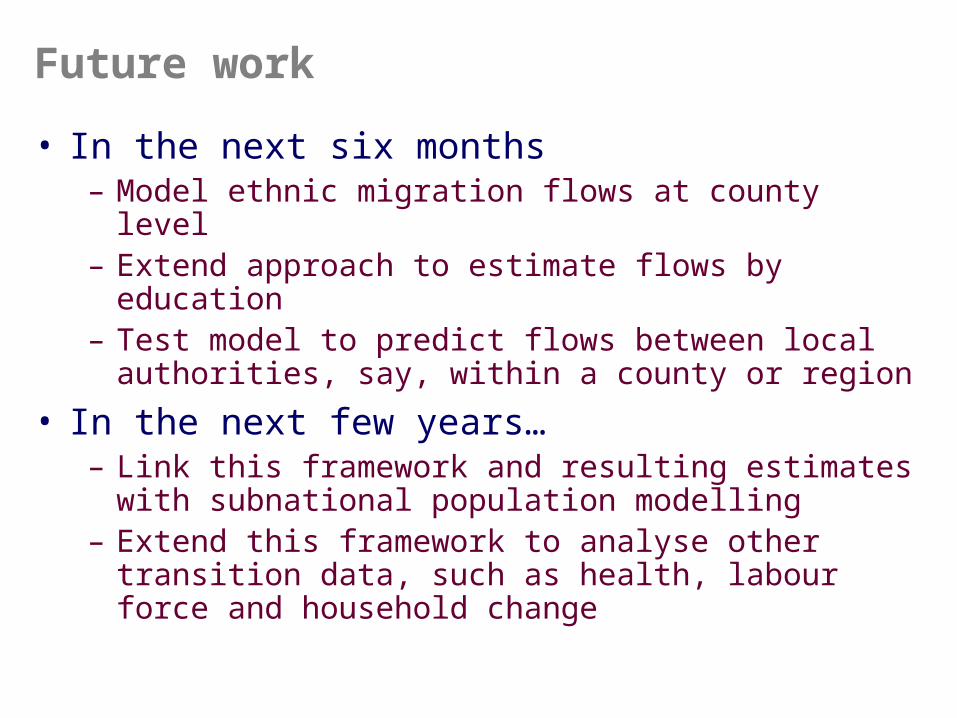
Future work
• In the next six months– Model ethnic migration flows at county level – Extend approach to estimate flows by education– Test model to predict flows between local
authorities, say, within a county or region
• In the next few years…– Link this framework and resulting estimates
with subnational population modelling– Extend this framework to analyse other
transition data, such as health, labour force and household change
30
Contact information
James Raymer
Southampton Statistical Sciences Research Institute (S3RI)University of SouthamptonSouthampton SO17 1BJ
Email: [email protected]
See also Raymer J, Smith PWF and Giulietti C (2008) Combining census and registration data to analyse ethnic migration patterns in England from 1991 to 2007. University of Southampton Statistical Sciences Institute Methodological Working Paper, M08/09. Available at: http://eprints.soton.ac.uk/63739/01/s3ri-workingpaper-M08-09.pdf