Embed Size (px)
Citation preview
STUDENT FEARS ON SECONDARY SCHOOL CAMPUSES
AND THEIR PERCEPTIONS OF POLICIES AND
PROCEDURES THAT INCREASE FEELINGS
OF SAFETY AND SECURITY
A Dissertation Presented to the Faculty
of
California State University, Stanislaus
In Partial Fulfillment
of the Requirements for the Degree
of Doctor of Education in Educational Leadership
By
James A. Lake
May 2015
CERTIFICATION OF APPROVAL
STUDENT FEARS ON SECONDARY SCHOOL CAMPUSES
AND THEIR PERCEPTIONS OF POLICIES AND
PROCEDURES THAT INCREASE FEELINGS
OF SAFETY AND SECURITY
by
James A. Lake
Signed Certification of Approval page is
on file with the University Library
Dr. Chet Jensen Date
Professor of Education
Dr. John Borba Date
Professor of School Administration
Dr. Robert Price Date
Affiliated Faculty

© 2015
James A. Lake
ALL RIGHTS RESERVED
iv
DEDICATION
This dissertation and Doctorate in Educational Leadership is dedicated to my
five wonderful children, James Hunter Lake, Jessup Steven Lake, Emme Lee Lake,
Jedidiah (Jedi) Lake, and Josiah William Lake. Thank you for being so supportive of
your father and for the understanding you have shown me as I have worked to pursue
a better life for our family. I love you all more than words can express. Each one of
you is amazing in your own way, and I cannot wait to see you grow and achieve all of
your hopes and dreams. Thank you for always bringing happiness and love into my
life.
I also dedicate this to my father and mother for instilling in me the will to
keep going and never give up. To my dad, James R. Lake, without your example as a
high school administrator, and more importantly as a great man and father, I would
not have been inspired to follow in your footsteps in education or to pursue my
Doctorate in Educational Leadership. For my mom, Marilyn J. Lake, thank you for
being such an amazing example of perseverance and for your love, devotion, and
understanding through all of my successes and failures.
Finally, I dedicate this dissertation to Dr. Chet Jensen. Without your
consistent mentoring and unwavering belief in my abilities, my Ed.D. would have
never become a reality. I will never be able to thank you enough.
v
ACKNOWLEDGMENTS
I am is extremely grateful for the constant support, understanding, and
dedication of my committee chair, Dr. Chet Jensen, Professor of Education at
California State University, Stanislaus. I also acknowledge the valuable time and
guidance provided by Dr. John Borba, Professor of School Administration, and
Dr. Robert Price, retired Superintendent and affiliated faculty member of California
State University, Stanislaus. I am indebted to each of you for your time, dedication,
and valuable insight and counsel as members of my dissertation committee. I also
want to thank my friend and fellow educator, Hector Perez, for his assistance in
developing the Student Safety Survey. Sam and Shawn Daniel also deserve
recognition for all their hours of logistical help. Finally, I would like to acknowledge
Larry DeBora (retired teacher for Stanislaus County Office of Education) for his
many hours of discussion with me regarding student safety and, most of all, for his
constant encouragement and steadfast faith in me as a friend through the good times
and the bad.
vi
TABLE OF CONTENTS
PAGE
Dedication ........................................................................................................... iv
Acknowledgments ............................................................................................... v
List of Tables ...................................................................................................... ix
Abstract ............................................................................................................... xii
CHAPTER
I. Introduction ......................................................................................... 1
Historical Background ................................................................ 3
Legal Ramifications .................................................................... 7
Rationale ..................................................................................... 9
Statement of the Problem ............................................................ 13
Research Rationale and Hypotheses ........................................... 14
Significance of the Study ............................................................ 18
Limitations .................................................................................. 19
Delimitations ............................................................................... 19
Role of the Researcher ................................................................ 20
Definition of Terms ..................................................................... 20
Summary ..................................................................................... 24
II. Review of the Literature ..................................................................... 26
Historical Framework ................................................................. 27
Legal Framework ........................................................................ 33
Identifying Security and Safety Issues ........................................ 35
Bullying and Violence ................................................................ 38
School Resource Officers ........................................................... 41
School Culture and Climate ........................................................ 43
Suspension, Zero Tolerance, and No-Contact Contracts ............ 44
Security of School Facilities ....................................................... 49
Students’ Perceptions of Security Measures ............................... 53
Student Safety vs. Academic Performance ................................. 55
Classroom Management and Student Safety .............................. 55
Positive Relationships with School Personnel ............................ 57
vii
CHAPTER PAGE
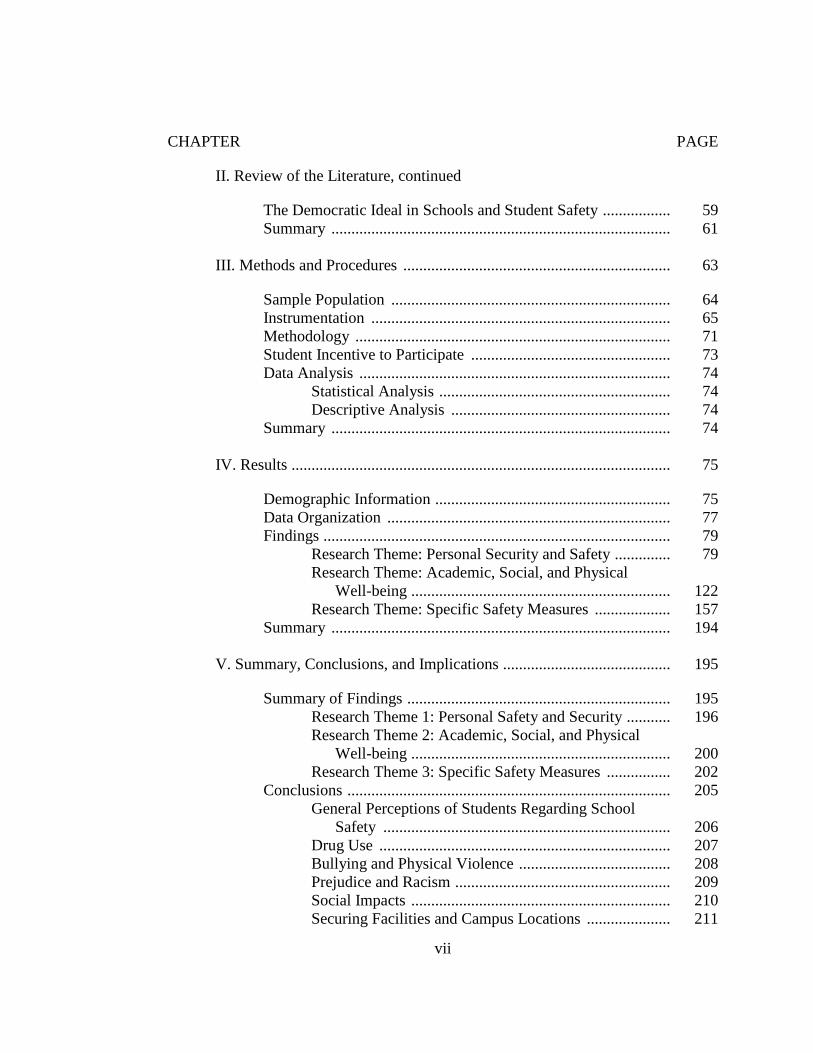
II. Review of the Literature, continued
The Democratic Ideal in Schools and Student Safety ................. 59
Summary ..................................................................................... 61
III. Methods and Procedures ................................................................... 63
Sample Population ...................................................................... 64
Instrumentation ........................................................................... 65
Methodology ............................................................................... 71
Student Incentive to Participate .................................................. 73
Data Analysis .............................................................................. 74
Statistical Analysis .......................................................... 74
Descriptive Analysis ....................................................... 74
Summary ..................................................................................... 74
IV. Results ............................................................................................... 75
Demographic Information ........................................................... 75
Data Organization ....................................................................... 77
Findings ....................................................................................... 79
Research Theme: Personal Security and Safety .............. 79
Research Theme: Academic, Social, and Physical
Well-being ................................................................. 122
Research Theme: Specific Safety Measures ................... 157
Summary ..................................................................................... 194
V. Summary, Conclusions, and Implications .......................................... 195
Summary of Findings .................................................................. 195
Research Theme 1: Personal Safety and Security ........... 196
Research Theme 2: Academic, Social, and Physical
Well-being ................................................................. 200
Research Theme 3: Specific Safety Measures ................ 202
Conclusions ................................................................................. 205
General Perceptions of Students Regarding School
Safety ........................................................................ 206
Drug Use ......................................................................... 207
Bullying and Physical Violence ...................................... 208
Prejudice and Racism ...................................................... 209
Social Impacts ................................................................. 210
Securing Facilities and Campus Locations ..................... 211
viii
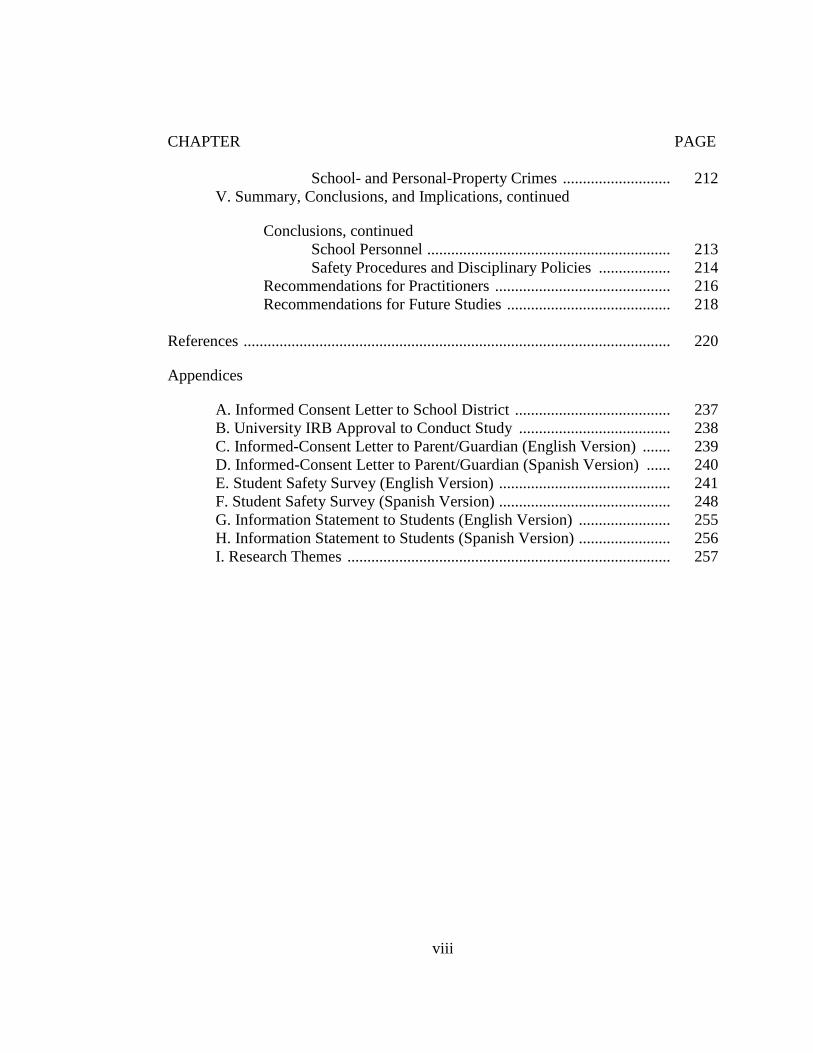
CHAPTER PAGE
School- and Personal-Property Crimes ........................... 212
V. Summary, Conclusions, and Implications, continued
Conclusions, continued
School Personnel ............................................................. 213
Safety Procedures and Disciplinary Policies .................. 214
Recommendations for Practitioners ............................................ 216
Recommendations for Future Studies ......................................... 218
References ........................................................................................................... 220
Appendices
A. Informed Consent Letter to School District ....................................... 237
B. University IRB Approval to Conduct Study ...................................... 238
C. Informed-Consent Letter to Parent/Guardian (English Version) ....... 239
D. Informed-Consent Letter to Parent/Guardian (Spanish Version) ...... 240
E. Student Safety Survey (English Version) ........................................... 241
F. Student Safety Survey (Spanish Version) ........................................... 248
G. Information Statement to Students (English Version) ....................... 255
H. Information Statement to Students (Spanish Version) ....................... 256
I. Research Themes ................................................................................. 257
ix
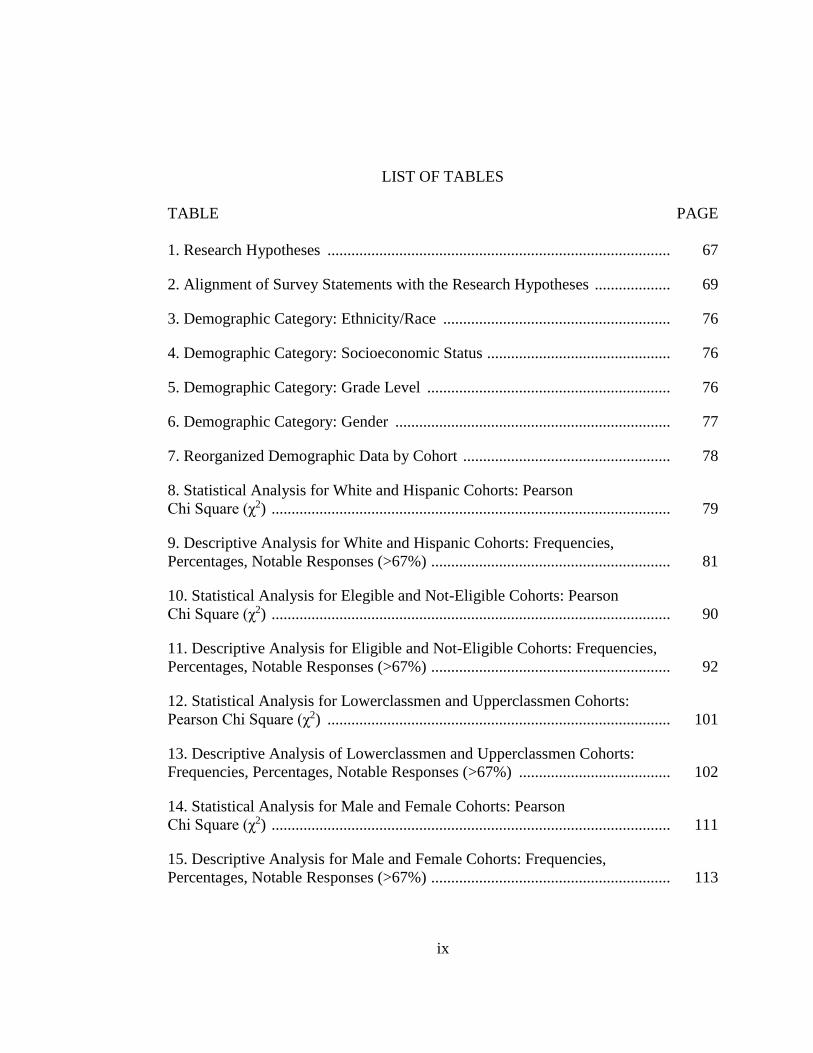
LIST OF TABLES
TABLE PAGE
1. Research Hypotheses ...................................................................................... 67
2. Alignment of Survey Statements with the Research Hypotheses ................... 69
3. Demographic Category: Ethnicity/Race ......................................................... 76
4. Demographic Category: Socioeconomic Status .............................................. 76
5. Demographic Category: Grade Level ............................................................. 76
6. Demographic Category: Gender ..................................................................... 77
7. Reorganized Demographic Data by Cohort .................................................... 78
8. Statistical Analysis for White and Hispanic Cohorts: Pearson
Chi Square (χ2) .................................................................................................... 79
9. Descriptive Analysis for White and Hispanic Cohorts: Frequencies,
Percentages, Notable Responses (>67%) ............................................................ 81
10. Statistical Analysis for Elegible and Not-Eligible Cohorts: Pearson
Chi Square (χ2) .................................................................................................... 90
11. Descriptive Analysis for Eligible and Not-Eligible Cohorts: Frequencies,
Percentages, Notable Responses (>67%) ............................................................ 92
12. Statistical Analysis for Lowerclassmen and Upperclassmen Cohorts:
Pearson Chi Square (χ2) ...................................................................................... 101
13. Descriptive Analysis of Lowerclassmen and Upperclassmen Cohorts:
Frequencies, Percentages, Notable Responses (>67%) ...................................... 102
14. Statistical Analysis for Male and Female Cohorts: Pearson
Chi Square (χ2) .................................................................................................... 111
15. Descriptive Analysis for Male and Female Cohorts: Frequencies,
Percentages, Notable Responses (>67%) ............................................................ 113
x
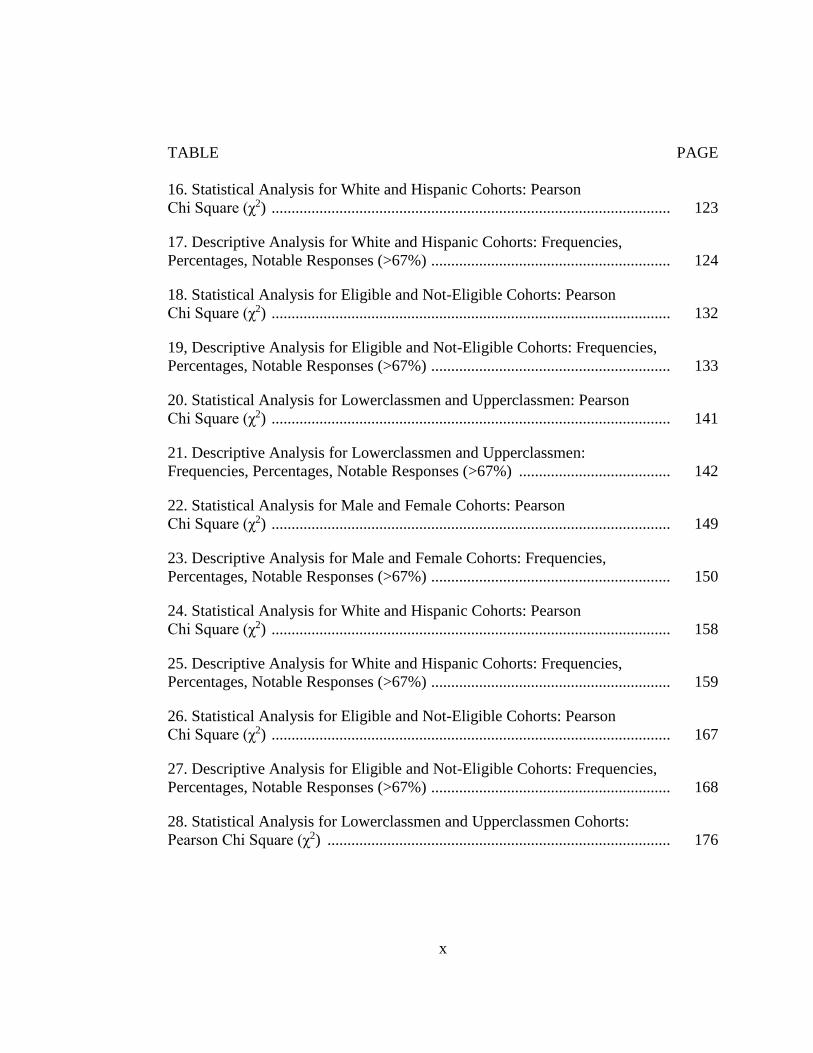
TABLE PAGE
16. Statistical Analysis for White and Hispanic Cohorts: Pearson
Chi Square (χ2) .................................................................................................... 123
17. Descriptive Analysis for White and Hispanic Cohorts: Frequencies,
Percentages, Notable Responses (>67%) ............................................................ 124
18. Statistical Analysis for Eligible and Not-Eligible Cohorts: Pearson
Chi Square (χ2) .................................................................................................... 132
19, Descriptive Analysis for Eligible and Not-Eligible Cohorts: Frequencies,
Percentages, Notable Responses (>67%) ............................................................ 133
20. Statistical Analysis for Lowerclassmen and Upperclassmen: Pearson
Chi Square (χ2) .................................................................................................... 141
21. Descriptive Analysis for Lowerclassmen and Upperclassmen:
Frequencies, Percentages, Notable Responses (>67%) ...................................... 142
22. Statistical Analysis for Male and Female Cohorts: Pearson
Chi Square (χ2) .................................................................................................... 149
23. Descriptive Analysis for Male and Female Cohorts: Frequencies,
Percentages, Notable Responses (>67%) ............................................................ 150
24. Statistical Analysis for White and Hispanic Cohorts: Pearson
Chi Square (χ2) .................................................................................................... 158
25. Descriptive Analysis for White and Hispanic Cohorts: Frequencies,
Percentages, Notable Responses (>67%) ............................................................ 159
26. Statistical Analysis for Eligible and Not-Eligible Cohorts: Pearson
Chi Square (χ2) .................................................................................................... 167
27. Descriptive Analysis for Eligible and Not-Eligible Cohorts: Frequencies,
Percentages, Notable Responses (>67%) ............................................................ 168
28. Statistical Analysis for Lowerclassmen and Upperclassmen Cohorts:
Pearson Chi Square (χ2) ...................................................................................... 176
xi
TABLE PAGE
29. Descriptive Analysis for Lowerclassmen and Upperclassmen Cohorts:
Frequencies, Percentages, Notable Responses (>67%) ...................................... 177
30. Statistical Analysis for Male and Female Cohorts: Pearson Chi Square (χ2) 185
31. Descriptive Analysis for Male and Female Cohorts: Frequencies,
Percentages, Notable Responses (>67%) ............................................................ 186
xii
ABSTRACT
This study was designed to identify for educators what students feared in secondary
school, and what policies and procedures that students perceived to increase their
feelings of safety and security on campus. This study explored a distribution of
secondary student responses regarding their perceptions of safety and security on a
high school campus as it related to four demographic categories: ethnicity/race,
socioeconomic status, grade level, and gender. The resulting statistical analysis was
evaluated further by dividing each category into eight cohorts: White and Hispanic,
eligible and not eligible for free or reduced-price lunch, lowerclassmen (LC) and
upperclassmen (UC), and male and female. From this research study, administrators,
superintendents, and school boards may determine how to utilize fiscal and social
resources in creating and implementing safety and security measures that reduce
student fears and positively impact their perception concerning safety and security.
1
CHAPTER I
INTRODUCTION
There is always a well-known solution to every human problem—neat,
plausible, and wrong.
— H. L. Mencken (1920), Prejudices
Gang free, drug free, tobacco free, violence free, and bully free—across
America’s high school campuses, statements advertising compliance with these social
and legal mandates can be viewed on school fences, buildings, and offices. However,
quantitative studies and nationwide polls show that students do not feel safer at
school because of declarations, policies, or programs (Bosworth, Ford, & Hernandez,
2011; Shelton, Owens, & Song, 2009). Many students attend school in fear, while
parents apprehensively wonder when the next fight, shooting, or lockdown will occur
(Akiba, 2008; Johnson, 2009; Knox, Laske, & Tromanhauser, 1992; Jones, 2013;
Manning & Bucher, 2005; Mooij, 2005).
Throughout American history, schools have been perceived as safe havens—
sanctuaries of American society—microcosms of democratic utopia; learning centers
for the democratic ideal, creativity, and all of the best initiatives America had to offer
(Henry, 2000; Kesson & Ross, 2004; Rea & Stallworth-Clark, 2003; Trump, 1999).
Students were out of harm’s way, and parents sent their children to acquire academic
and social skills from trusted and respected teachers (Bushaw & Lopez, 2011;
Stanwood & Doolittle, 2004).
2
Unfortunately, today, American secondary schools are high-security
environments—gated, guarded, and under video surveillance by metal detectors and
police officers (Bracy, 2011). Schools have adopted “strict discipline policies to keep
students in line and maintain safe campuses” (Shelton et al., 2009, p. 25). School
districts have invested in human resources, facility upgrades, and technology to make
schools safer; however, an unintended consequence of these efforts is that many
schools resemble prisons more than they do institutions of progress and academic
learning (Kohn, 2004; Schneider, 2007). Although improvements in school security
and student safety have been made, and academic researchers have offered solutions,
student fear and school violence continue to befall America’s youth across the
country and other children throughout the world (Berkowitz & Benbenishty, 2012).
Interestingly, Flannery, Modzeleski, and Kretschmar (2013) discovered that
the odds of a school shooting occurring in one of the 125,000 elementary and
secondary schools in the U.S. were “about once every 6,000 years” (p. 3). According
to Flannery et al. (2013), the number of school shootings represented “less than 2% of
the annual homicides of youth ages 5–18 in the US” (p. 3). However, Fisher (2007)
maintained that even though school massacres are statistically extremely rare, they
are still tragically real events, and parent and student populations are profoundly
cognizant and frightened at the possibility.
In response to public outcry over school shootings and other security
concerns, policy makers and practitioners have rushed to implement safety measures
in schools without tapping into the most important resource on safety: the students
3
themselves (Shumow & Lomax, 2001). Kohn (2004) professed that educators and
stakeholders alike cling to a hope that schools will be safe havens if they were to
install enough surveillance cameras and other security measures such as metal
detectors. Sparks (2011a) found that implementing such technologies was not an
effective deterrent as administrators would hope. In fact, years of research produced
evidence to the contrary. There were no conclusive findings that metal detectors
decreased crime or violence, but there was proof that their existence made students
feel more apprehensive about their safety.
According to a 2013 Gallup Poll, the greatest variance in parental concern
over their child’s safety while at school was determined by household income of their
classmates (Jones, 2013). In fact, socioeconomic background affected parents’
perceptions regarding school safety by a margin of 2 to 1. Fear is a word that has
become commonplace in America’s schools (Jones, 2013; May & Dunaway, 2000).
Stakeholders must take back schools from the apprehension that surrounds them—
from the gangs, bullying, fights, violence, shootings, and drugs that are prevalent in
schools today (Adelman & Taylor, 2007; Henry, 2000).
Historical Background
Throughout the 17th and 18th centuries, families were the focal point in a
young adult’s life for socialization and education. Reading, writing, arithmetic, and
religion were essential educational goals that were usually taught in the home or
small church-sponsored schools (Foner & Garraty, 1991). Stevens, Wood, and
Sheehan (2002) maintained this form of education was to develop a spiritual and
4
ethical citizenry whose main concern and devotion was to each other and the safety
of the colony.
The 19th and 20th centuries created a new role for schools. The school was
not merely about basic education but focused on creating a community of educated
citizens who were prepared to live in and contribute to a democratic society (Stevens
et al., 2002). Educating the labor force had become a vital part of industrialization to
establish the United States in the world as a leader in manufacturing (Stevens et al.,
2002). In the Cardinal Principles report of 1918, the Commission on the
Reorganization of Secondary Education asserted that schools should be preparing
students not only intellectually but also for life (Stevens et al., 2002).
Discipline problems in schools have evolved over the decades. In the 1950s
and 1960s, discipline consisted of dealing with students who were “talking without
permission, being disruptive in class, running in the hallways, or smoking behind the
gymnasium” (Denmark, Krauss, Wesner, Midlarsky, & Gielen, 2005). By the 1970s,
student violations of the dress code were the heated topic, and the 1980s exposed
student fighting as one of the major concerns. At the end of the 1980s and into the
1990s, fighting had given way to violent gang activity, and “with it came the
problems of weapons, substance abuse, and violent assaults against other students and
school staff” (Denmark et al., 2005).
The 20th century also brought school safety issues to the forefront in
American education due to developments in technology and communications. In
Bath, Michigan, on May 18, 1927, a school board member, Andrew Kehoe, killed 45
5
people and injured 58 when he detonated a bomb at the Bath Consolidated School
and then set off a car bomb as rescuers and onlookers gathered at the school to help.
This act was the worst disaster to ever hit an America school up to that time (Lindle,
2008).
However, after the shooting deaths of 13 students and faculty members at
Columbine High School in 1999, the 32 students at Virginia Tech University in 2007,
and the 26 students, teachers and administrators at Sandy Hook Elementary School in
2012, school violence not only continued to terrify students and teachers, but the
nature of the attacks appeared to change drastically (Jones, 2013; Kennedy, 2010).
Greenhough (2008) maintained violent acts by students underwent a change over the
last 3 decades from small, isolated fights to well-designed, planned attacks on faculty,
staff, and students that could only be classified as terrorism.
In addition to the violence permeating schools across America, the terrorist
attacks of September 11, 2001, brought the fear for students’ safety to the forefront of
America’s attention. The attacks on America’s financial district begged the question,
“How safe were our schools from terrorist attacks?” Immediately, school
administrators across the United States began to implemented plans to protect
students by improving security measures. From installing metal detectors and video
surveillance, to hiring security staff, police officers, drug dogs, and educators are
trying to be vigilant about protecting students and staff on school campuses.
Research clearly substantiates these declarations. In 2011, 95% of the students
reported that their schools implemented a student code of conduct, while 89% of the
6
students reported that school staff or adult supervision was visible in the hallways.
Furthermore, 77% of the students, 12–18 years old, reported security cameras in their
schools, 70% reported campus security or School Resource Officers (SROs) at their
schools, and 11% stated their schools utilized metal detectors (Robers, Kemp,
Rathbun, & Morgan, 2014).
Nonetheless, violence and bullying continue to create anxiety among students
(Rea & Stallworth-Clark, 2003). According to the most recent Phi Delta
Kappa/Gallup Poll 2013, 51% of public school parents agreed or strongly agreed that
school districts should employ more armed security guards in schools. The same poll
showed that 35% of parents agreed or strongly agreed with arming teachers and
administrators to keep their students safe at school (Bushaw & Lopez, 2013).
Unfortunately, the most important resource available about how to address school
violence and eliminate student fears is consistently overlooked: the students
themselves (Winter, 2011).
Faced with intense public pressure to eliminate violence and a create safe
learning environment for students, schools continually practice lockdown drills and
prepare for emergencies to deal with a myriad of safety contingencies (Kennedy,
2011). The 21st-century generation of students has become accustomed to video
surveillance, the presence of police officers on campus, zero-tolerance policies, drug
dogs, random searches, conflict mediation, and instruction-based programs to reduce
bullying, gang activity, and violence (Juvonen, 2001). School buildings are painted
with numbers that identify them in a systematic way. Intercoms and electronic door
7
locks are designed to keep students in school rooms and intruders out. Signs also
help with the transportation of students on and off campus. Increased security is
simply the new norm (Kennedy, 2011).
Even though schools have invested in human resources, facility upgrades, and
technology to make students safer and to increase school security, the amount of
money spent on safety pales in comparison to other government categories
(Schneider, 2007). In 2013, $633 billion was spent by the Department of Defense,
whereas, in the same year, only $48 billion was allocated to the Department of
Education (Edwards, 2013). Consequently, violence and bullying have not
disappeared, and they continue to create anxiety and fear for secondary students until
more human and financial assets are utilized in proactive, research-based security and
safety measures (Juvonen, 2001).
Legal Ramifications
In an effort to combat these new discipline issues in schools, California voters
amended their Constitution in 1982 by adding the provision called the “Right to Safe
Schools,” which states, “All students and staff or [sic] primary, elementary, junior
high and senior high schools have the inalienable right to attend campuses which are
safe, secure, and peaceful” (Cal. Const., Art. I, § 28, sub. C). Furthermore, under
California Government Code § 820(a), 815.2(a), as cited by Glaeser and Calcagnie
(2005), public employees such, as school personnel and school districts, have to
provide reasonable safety and security measures to protect students from any internal
and external dangers to the best of their ability or they can be held legally liable.
8
Akiba (2008) asserted that creating a safe and secure environment conducive to
student learning is the responsibility of all educators worldwide and the foundation
for students’ academic achievement. Reynolds, Skiba, Sheras, Conoley, and Garcia-
Vazquez, (2008) stated that
There can be no doubt that schools have the duty to use all effective means
needed to maintain a safe and disciplined learning environment … teachers
cannot teach and students cannot learn in a climate marked by chaos and
disruption—about this there is no controversy. (p. 852)
The issue of violence in schools has been a clear concern for school
administrators, teachers, school boards, and parents since the beginning of the 1990s.
For 10 consecutive years, from 1992 to 2002, the annual Phi Delta Kappa/Gallup Poll
showed that the public believed that school violence and a lack of discipline was the
most pressing issue facing public schools (Bushaw & Lopez, 2012). In reaction to the
public outcry and the growing number of violent acts that occurred at schools,
governors across the United States emphasized the necessity for safety and security in
the Goals 2000: Educate America Act, which was signed into law March 31, 1994.
The legislation set a goal that, “By the year 2000, every school in the United States
will be free of drugs, violence, and the unauthorized presence of firearms and alcohol
and will offer a disciplined environment conducive to learning” (Paris, 1994,
pp. 22–25).
In addition to evaluating teachers, increasing the Academic Performance
Index (API) scores for each school, meeting Annual Yearly Progress (AYP) targets,
and dealing with literally hundreds of other concerns a day, educators have an
9
additional challenge: educating students while, at the same time, providing them
with a safe and secure environment that is free from violence and fear. This issue has
prompted vast educational changes and reforms in American schools, beginning in
the latter part of the 20th century and continuing into the 21st century (Hantman et
al., 2008). Although reforms have been made, and academic researchers have offered
solutions, fear and violence continue to engulf schools across the country and
throughout the world. As a result of No Child Left Behind (NCLB) Act of 2001, “the
consequences of a public accounting for school safety may have generated more
opportunities for public fear and panic as opposed to increasing conditions for school
safety and security” (Lindle, 2008, p. 28). Consequently, the question regarding how
to create safe schools remains an enigma to both educators and politicians (Akiba,
2008; Wood & Huffman, 1999).
Rationale
Over the last 2 decades, school violence and the issue of security has become
a significant concern throughout the United States (Berkowitz & Benbenishty, 2012;
Rose & Gallup, 1999; Warr, 2000). Around the country, the news media highly
publicizes violent events in secondary schools, constantly reminding the public of the
severe problems that the educational community faces with regard to student safety
(Rose & Gallup, 1999; Shelton et al., 2009). According to the Phi Delta
Kappa/Gallup Poll 2011, 68% of the Americans surveyed heard more negative news
reports about schools than positive ones (Bushaw & Lopez, 2011).
10
Some research has suggested that school violence has experienced a major
decline. Bosworth et al. (2011) claimed that students are safer at school than
anywhere else, as “violent crime in schools declined by 50% between 1993 and 2003”
(p. 194). However, other sources indicate that significant safety issues for students
continue to exist in schools (DeVoe, Peter, Noonan, Snyder, & Baum, 2005).
Although the United States does not have the highest levels of school violence among
all of the countries of the world, students are frequently exposed to school shootings,
physical and sexual assault, threats of violence, weapons and drugs on campus, and
bullying and intimidation that increase fear and trepidation on school campuses
(Akiba, LeTendre, Baker, & Goesling, 2002).
Based on the latest surveys conducted by the National Center for Educational
Statistics (NCES) in 2012, the total number of crimes perpetrated at school on
students ages 12–18 was 52 victimizations for every 1,000 students—much higher
than the 38 victimizations per 1,000 students reported off campus (Robers et al.,
2014). Robers et al., (2014) established that 1.364 million people were victims of
nonfatal crimes among students ages 12–18, “including 615,600 thefts and 749,200
violent crimes” (p. iv). The same report disclosed that 7% of students enrolled in
grades 9–12 had been “threatened or injured with a weapon, such as a gun, knife, or
club or school property” (p. iv). The same study also indicated that those exposed to
threats, attacks, and injuries was higher for males than females—10% and 5%
respectively (Robers et al., 2014).
11
Furthermore, Robers et al. (2014) indicated that 4% of students’ ages 12–18
reported that they were more afraid of attack or physical harm while on school
campus, whereas only 2% of students were fearful of attack off campus.
Additionally, 6% of the students skipped at least one day of school or a school
activity out of fear of physical attack on their person. Based on the race and ethnicity
of the students surveyed, 4% of White students and 2% of Asian students reported
being afraid of attack or harm at school, while 9% of Black students and 7% of
Hispanic students claimed fear of violence at school (Robers et al., 2014).
Gangs, drugs, and bullying continue to be issues that create fear and security
issues for students within secondary schools (Volokh & Snell, 1998). Robers et al.
(2014) reported 18% of students within public schools asserted gang activities had
occurred on campus, and 19% reported the presence of gangs in their schools. When
the surveys were disaggregated by ethnicity/race, 21% of both White and Asian
students reported a gang problem at their schools compared to 59% by Black and
Hispanic students.
Furthermore, Robers et al. (2014) found that 26% of students in high school
reported that they had been offered sold or given drugs on campus, and 23% had used
marijuana; both percentages increased by 3 points from 2009. With regard to
ethnicity/race, the percentages of students offered or sold drugs were dramatically
higher. According to Robers et al. (2014), 40% of Native Americans and 39% of
Pacific Islanders were offered or purchased drugs compared to 33% of Hispanic
students and 23% of White, Black, and Asian students.
12
In addition to fears of physical violence, crime, gangs, and drugs, bullying
has impacted American schools significantly. According to Booth, Van Hasselt, and
Vecchi (2011), the number of students who are bullied has increased steadily since
1999. Robers et al. (2014) concluded that 28% of students ages 12–18 reported being
bullied at school, while 9% reported being bullied electronically through social-media
posts or text messaging. He also discovered that the prevalence of students being
bullied was higher among females (19%) than males (16%). In the same study, 26 %
of 9th graders reported being bullied compared to 28% of sophomores, 24% of
juniors, and 22% of seniors (Robers et al., 2014). According to Cowie and Oztug
(2008), “Young people mention relationships within their peer group as the major
factor that causes them to feel unsafe at school.… The most common suggestions for
making school a better place referred to action against bullying” (p. 59).
For decades, school safety and student well-being has been interrelated to
positive academic achievement and the overall success of the students and staff
(Shumow & Lomax, 2001). No amount of instruction and assessment will improve
students’ abilities to learn and to achieve personal and academic success unless they
have a sanctuary where they feel safe, secure, and free from, not only the outside
pressures of society, but also the violence and fear that students are exposed to in
schools (Freiberg, 1998; Goldstein, Young, & Boyd, 2008; Marshall, 2004).
Research has shown that fear of violence at school includes more than merely feeling
unsafe; it also contributes to difficulty paying attention, not participating in class,
lowered grades, lack of attendance, and dropping out (Bowan & Bowan, 1999;
13
Cheng, 2003; Edmondson, Fetro, Drolet, & Ritzel, 2007; Hantman et al., 2008;
Henry, 2000; Shelton et al., 2009). Stephens (1994) suggested that, “Responding to
school violence required a systematic, collaborative approach that will incorporate
prevention, intervention and suppression strategies” (p. 32). Wood and Huffman
(1999) pragmatically observed that “Prevention is always better than reaction”
(p. 23).
Statement of the Problem
Research about schools has consistently identified males as being more prone
to violence at school and the majority of school shooters as White students (Hong,
Cho, Allen-Meares, & Espelage, 2011; Robers et al., 2014). Furthermore, Hong et al.
(2011) asserted that social structure plays a role in establishing a culture of
masculinity where students of lesser economic means are more likely to be bullied.
Even the way a student dresses has been identified as a potential terrorist threat to
students based on race, gender, ethnicity, and social class (Studak & Workman,
2007).
Researchers have profiled the causes and identified the characteristics of those
who commit acts of violence on school campuses; however, few researchers have
queried high school students to reflect on what fears they have and what security
measures increase their perceptions of safety on secondary school campuses (Winter,
2001). Furthermore, Mooij, Smeets, and de Wit (2011) affirmed that “School safety
and corresponding feelings of both pupils and school staff are beginning to receive
more and more attention” (p. 369). Accordingly, Bracy (2011) submitted that
14
students perceive most security stratagems utilized by administrators as
unnecessary and continue to express a desire to play a larger role in the creation of
rules and safety procedures.
According to Hong et al. (2011), researchers all over the world have
recognized that “psychiatric assessment and individual-based violence prevention
strategies are not enough” to stop school violence and ameliorate student fears
(p. 868). Hong et al. (2012) recommended that all other possible ecological factors
that might influence students’ feelings of well-being and the fears they have on
secondary school campuses, such as ethnicity, socioeconomic status, age level and
gender, be studied.
Consequently, the purpose of this research study was to determine (1) what
personal safety and security fears high school students have on campus; (2) how those
specific fears impact high school students’ academic, social, and physical well-being;
and (3) what specific safety measures high school students perceive increase their
feelings of safety and well-being at school.
Research Rationale and Hypotheses
The present study was designed to add to the greater body of knowledge by
analyzing secondary school students’ perceived fears and by identifying specific
measures that students believe would ameliorate their fears and improve school-wide
safety. The literature suggests that safety fears may negatively affect certain
categories of students to a lesser or greater degree (Robers et al., 2014). Therefore,
15
this researcher analyzed the perceptions of four distinct categories of students,
utilizing 8 specific cohorts:
1. Ethnicity/race: This category is defined as a human group having racial,
religious, linguistic, and certain other traits in common (William Collins Sons &
Co. Ltd, 2009). This researcher explored the perceptions of White and Hispanic
students concerning school safety.
2. Socioeconomic status (SES): SES is defined as an individual’s or group’s
position within a hierarchical social structure. Socioeconomic status depends on a
combination of variables, including occupation, education, income, wealth, and
place of residence. Sociologists often use socioeconomic status as a means of
predicting behavior (The American Heritage® New Dictionary of Cultural
Literacy, 2014). This researcher analyzed the responses of two cohorts: those
students eligible for free or reduced-price lunch and those students not eligible for
free or reduced-price lunch.
3. Grade level: Secondary school or high school students traditionally represent
grade levels 9, 10, 11, and 12, or freshmen, sophomores, juniors, and seniors,
respectively (Collins English Dictionary, 2014). This researcher collected and
evaluated data from 2 student cohorts to determine if their safety fears differ
significantly by age group: lowerclassmen (LC), made up of 9th and 10th grade
students, and upperclassmen (UC), comprised of 11th and 12th grade students.
16
4. Gender: In the present study, this researcher compared and contrasted the
safety fears of secondary school students in cohorts: male and female secondary
school students.
The research questions were as follows:
1. What personal safety and security fears do high school students have on campus?
2. How do those specific fears impact high school students’ academic, emotional,
and physical well-being?
3. What specific safety measures do high school students perceive increase their
feelings of safety and well-being at school?
The null hypotheses are as follows:
H1: There is no significant difference in the distribution of responses on a
survey of high school students’ perceived fears in terms of personal safety and
security on high school campuses, disaggregated by ethnicity/race.
H2: There is no significant difference in the distribution of responses on a
survey of high school students’ perceived fears in terms of personal safety and
security on high school campuses, disaggregated by socioeconomic status.
H3: There is no significant difference in the distribution of responses on a
survey of high school students’ perceived fears in terms of personal safety and
security on high school campuses, disaggregated by grade level.
H4: There is no significant difference in the distribution of responses on a
survey of high school students’ perceived fears in terms of personal safety and
security on high school campuses, disaggregated by gender.

17
H5: There is no significant difference in the distribution of responses on a
survey of high school students’ perceptions in terms of how specific fears impact
their academic, social, and physical well-being disaggregated by ethnicity/race.
H6: There is no significant difference in the distribution of responses on a
survey of high school students’ perceptions in terms of how specific fears impact
their academic, social, and physical well-being disaggregated by socioeconomic
status.
H7: There is no significant difference in the distribution of responses on a
survey of high school students’ perceptions in terms of how specific fears impact
their academic, social, and physical well-being disaggregated by grade level.
H8: There is no significant difference in the distribution of responses on a
survey of high school students’ perceptions in terms of how specific fears impact
their academic, social, and physical well-being disaggregated by gender.
H9: There is no significant difference in the distribution of responses on a
survey of high school students’ perceptions in terms of specific safety measures that
are intended to improve their feelings of safety and well-being at school,
disaggregated by ethnicity/race.
H10: There is no significant difference in the distribution of responses on a
survey of high school students’ perceptions in terms of specific safety measures that
are intended to improve their feelings of safety and well-being at school,
disaggregated by socioeconomic status.
18
H11: There is no significant difference in the distribution of responses on a
survey of high school students’ perceptions in terms of specific safety measures that
are intended to improve their feelings of safety and well-being at school,
disaggregated by grade level.
H12: There is no significant difference in the distribution of responses on a
survey of high school students’ perceptions in terms of specific safety measures that
are intended to improve their feelings of safety and well-being at school,
disaggregated by gender.
Significance of the Study
Research is used in many ways to inform educators of important issues within
schools. Unfortunately, very few studies, if any, have been conducted that seek to
discover specific fears students have in secondary schools and how students believe
school administrators should address those fears. Parents expect school district
personnel and site administrators to ensure that schools are safe, viable learning
centers (Astor, Myer, Benenishty, Marachi, & Rosemond, 2005; Hantman et al.,
2008). However, many stakeholders believe that school boards and administrators
have fallen short of this obligation and continue to be reactionary to the violence and
fear that students feel rather than proactively engaging, treating, and eliminating the
underlying problems (Bullock & Fitzsimmons, 1996; Hantman et al., 2008; Wood &
Huffman, 1999).
The present study may provide useful information to secondary school
administrators regarding the types of fears students have on high school campuses
19
and what safety and security methods students perceive would address their fears
and increase their feelings of well-being. As a result, administrators and school
boards may be motivated to utilize student input in establishing school security and
safety measures. Additionally, the findings may encourage a broader conversation by
state and local policy makers regarding the value of student input in the development
and implementation of security measures on high school campuses.
Limitations
The following limitations provided the context in which the study was
conducted:
1. This researcher assumed that the respondents would be honest and candid
regarding their fears and feelings about safety at their school.
2. This researcher used only one secondary school in California to conduct the
study, and, therefore, the conclusions and findings may not generalize to other
secondary schools in California.
3. Cultural, philosophical, and religious differences may have limited parents’
willingness to allow their children to participate in the study.
Delimitations
The following delimitations provided the context in which the study was
conducted:
1. The present study was conducted at one comprehensive high school in a rural
community in California’s San Joaquin Valley.
2. The study did not include secondary students in the 7th and 8th grades.
20
3. The study did not consider primary languages other than English and Spanish.
4. The study did not consider student disciplinary or attendance history.
5. The study did not consider student grades or grade-point averages.
Role of the Researcher
This researcher has worked in education for 14 years, 8 years as a high school
administrator. He has been an assistant principal and principal of both large and
small high schools, ranging in approximate size from 110 students to 2,800 students,
in both California’s San Joaquin Valley and the State of Nebraska. As a teacher for 7
years, this researcher worked with at-risk youth who were prone to gang activity,
violence, drug and alcohol abuse, physical and psychological abuse by relatives and
foster parents, and bullying at school. These experiences directly impacted this
researcher’s desire to conduct a study about students’ perceptions of safety and
security on secondary school campuses. However, previous experiences will be self-
monitored to ensure an objective analysis of the data.
Definition of Terms
Goals 2000: Educate America Act of 1994. This act was signed into law on
March 31, 1994, under broad support from Congress. The legislation was enacted
with the hope that, by the year 2000, the United States would be leading the world in
math and science by establishing “national and state standards on almost every
important aspect of public schooling, including course content, standardized exams,
and the certification/licensure of teachers,” and every school in the United States
21
would be free of drugs, alcohol, and violence, and would be conducive to learning
(Stevens et al., 2000, p. 350).
Gun Free Schools Act of 1994. This act was signed into law by President
Clinton in response to an increase in gun violence on school campuses. It required all
states to enact legislation to expel students who brought firearms to school for a
minimum of 1 year. Many states chose to expand the scope of the law to include
dangerous weapons such as knives, tasers, firearm look-a-likes, explosives, chains,
severe acts of violence, and drug sales (Cambron-McCabe, McCarthy, & Thomas,
2009).
Gun-Free School Zones Act of 1990. This statute was enacted in 1990 by
Congress, making possession of a firearm a felony at a place that the individual
knows, or has reasonable cause to believe, is a school zone. In 1995, the Gun Free
School Zones Act of 1990 was declared unconstitutional by the Supreme Court, as it
was determined to violate interstate commerce laws outside of the scope of
Congressional control (Safra, 2000).
Gun-Free School Zones Act of 1996. In 1996, the Gun-Free School Zones Act
of 1990 was amended, due to changes proposed by Attorney General Janet Reno, to
include language that circumvented the interstate commerce laws. Consequently, the
law was passed in September 1996 (Safra, 2000).
High school. A school attended after elementary school or junior high school,
usually consisting of grades 9 or 10 through 12 (The American Heritage® New
Dictionary of Cultural Literacy, 2014).
22
In loco parentis. Parents send their children to school to spend the day in
the company of educators. This simple every-day act removes children from the
physical control of their parents. While parents do not relinquish their responsibility
for their children while the children attend school, parents share some of that
responsibility with teachers and administrators. Schools assume some of the
responsibilities and exercise some of the prerogatives typically reserved for parents
(DeMitchell, 2012).
No Child Left Behind (NCLB) Act of 2001. NCLB was part of a movement
toward standards-based education and assessment that began with the Improving
America’s Schools Act of 1994 (IASA), a reauthorization of the Elementary and
Secondary Education Act of 1965 (ESEA), which was first enacted as part of
President Lyndon Johnson’s War on Poverty and designed to focus federal funding on
poor schools with low-achieving students. On January 8, 2002, President George W.
Bush signed into law the No Child Left Behind (NCLB) Act of 2001. This federal
legislation was intended to identify low-achieving schools as well as persistently
dangerous ones, allowing students to attend a different school if theirs had been so
classified and to hold educators accountable for student performance through
common educational standards and annual testing to track student achievement
(Jorgensen & Hoffman, 2003).
Safe and Drug Free Schools and Communities Program (1986). The Safe and
Drug-Free Schools and Communities (SDFSC) program was authorized by Congress
in 1986 as a response to alarmingly high rates of alcohol and other drug use among
23
children and youth. The purpose was to provide funds to states and local school
districts to implement anti-drug programs and increase safety on school campuses.
The law provided 20% of the available federal funds to governors to disperse in the
form of grants to school districts. The remaining 80% was allocated to each school
district on the basis of enrollment. In 1994, the Program was reauthorized under Title
IV of the Elementary and Secondary Schools Act, and in 2002, the Safe and Drug
Free Schools and Communities Act was reauthorized again under No Child Left
Behind, Title IV, Part A. The Program continues to be administered by the Office of
Safe and Healthy Students (OSHS) (Sherman, Hoff Sommers, & Manno, 2000).
School Resource Officer. School Resource Officers (SROs) are certified,
sworn police officers who are employed by local police agencies but are permanently
assigned to work in local schools as armed security officers. The addition of SROs
has been a popular response in an effort to reduce or eliminate school violence across
America (Myrstol, 2011).
School violence. School violence occurs on school property, on the way to or
from school or school-sponsored events, or during a school-sponsored event. A young
person can be a victim, a perpetrator, or a witness of school violence. Youth violence
includes various behaviors. Some violent acts, such as bullying, slapping, or hitting,
can cause more emotional harm than physical. Other forms of violence, such as gang
violence and assault (with or without weapons), can lead to serious injury or even
death (Centers for Disease Control and Prevention, 2013).
24
Secondary school. A school for young people, usually between the ages of
12 and 18 (Robers et al., 2014).
Stakeholder. A stakeholder in education is an individual or a group of
individuals with an interest in the success of a school or district at fulfilling its
mission—delivering academic and social success of its students—through the every-
day operations, teaching, safety, and well-being of the students they serve (Paine &
McCann, 2009).
Zero-tolerance policy. Zero tolerance is a policy that school districts employ
to consistently impose suspension and expulsion in response to weapons, drugs, and
violence on school campuses. Zero tolerance usually mandates prearranged
consequences, such as suspension or expulsion, in order to remove violators from the
school environment and preserve the peaceful and academic integrity of the school
(Cornell & Mayer, 2010; Reynolds et al., 2008).
Summary
Chapter I discussed the historical and legal background related to school
safety. The rationale for this study suggested that, even with the extensive security
measures in secondary schools today, violence and bullying still exist and increase
the levels of fear and anxiety that students experience. The research questions,
hypotheses, limitations, and delimitations that guided the analysis of the data were
also identified. The significance of the study and definitions were also included in
this chapter to provide the context in which this study was conducted.
25
Chapter II will provide a review of the literature related to the safety
strategies that secondary schools use to temper student violence and eliminate student
fears. Chapter III will discuss the research methodology of the present study,
including the sample population, instrumentation, hypotheses, and alignment of the
survey instrument with the research question, data collection, and the statistical and
descriptive analyses. Chapter IV will present the findings and analyzes of the data,
and Chapter V will explain this researcher’s conclusions, will provide
recommendations for practitioners in the field and suggestions for further research.
26
CHAPTER II
REVIEW OF THE LITERATURE
After the tragic events at Columbine High School (1998), Virginia Tech
(2007), Sandy Hook Elementary (2012), and an estimated 12 other incidents as of
April 2014, student safety and school security continues to be a major concern for
students, parents, communities, and secondary school administrators (Ohlheiser,
2014). Consequently, the federal government and private research firms have
responded by conducting qualitative and quantitative studies designed to discover the
motives behind school violence and employ countermeasures to reduce the number of
incidences and eliminate student fears (Kennedy, 2010).
However, Manning and Bucher (2005) suggested, “The [greatest] challenge
lies with the educators who are [ultimately] responsible for making sure that students
do not fear attending school” (p. 5). Unfortunately, as Wood and Huffman (1999)
asserted, “Most of the work which has been done with violence in schools is
anecdotal rather than empirical, and has been done by experts in sociology, law
enforcement, and criminal justice [not] by school administrators” (p. 19). Winter
(2001) stated that very few, if any, of the qualitative and quantitative research studies
conducted today “have asked high school students to describe the atmosphere in their
school and whether they feel safe” (p. 21). Interestingly, state and local officials and
school district administrators have tried for years to calm students’ fears by
implementing stricter policies, installing expensive equipment, and utilizing
27
community resources such as law enforcement officers, social workers, and
counselors to deliver students from the anxiety and fear that surrounds them at school
without tapping into the most important resource available to them: the students
themselves (Bullock & Fitzsimmons, 1996; Stephens, 1994; Winter, 2011; Wood &
Huffman, 1999).
Producing a feeling of safety on campus for secondary students is much more
complex than simply employing metal detectors, surveillance cameras, SROs, and
drug dogs to eliminate violence. This approach ignores the complexities of student
relationships, their intimate knowledge of the school environment, and the
perceptions they have of their own safety. Bosworth et al. (2011) suggested that
perceptions of school security have a far greater impact on students than the programs
and policies designed to deal with the concrete problems facing secondary schools
today. Reynolds et al. (2008) maintained that high schools have the obligation to
utilize any and all means within their limited financial budgets to maintain a secure
environment that is free of violence for secondary students. Reynolds et al. (2008)
concluded, “Teachers cannot teach and students cannot learn in a climate marked by
chaos and disruption—about this there is no controversy” (p. 852).
Historical Framework
During the time of Plato and Aristotle, educators, politicians, parents, and
community members debated issues regarding content and pedagogy (Rorty, 1998).
Today, national Common Core standards, bilingual education, and high-stakes testing
are the hotly contested topics, but as important as each of these initiatives may be,
28
they are dwarfed by the most important issue facing schools today: student safety
(Ashford, Queen, Algozzine, & Mitchell, 2008; Volokh & Snell, 1998). In addition
to evaluating teachers, increasing API scores, meeting AYP targets, educators must
deal with student discipline and provide all pupils with a safe and secure environment
that is free from violence and fear (Reynolds, Skiba, Sheras, Conoley, & Garcia-
Vazquez, 2008; Sparks, 2011a; Stephens, 1994). As Ashford et al. (2008) suggested,
“Few concerns in the history of American Public Education have received as much
attention as this one” (p. 222).
School security and safety is not merely an issue that is current to the latter
half of the 20th century or the present day. As Cornell and Mayer (2010) stated,
“School violence is not so much a new problem as a recurrent one that has not been
adequately recognized for its persistence and pervasiveness throughout the history of
education” (p. 7). Evidence depicts student violence dating back over 2,000 years to
early Mesopotamia, the Middle Ages, and throughout the 17th and 18th centuries.
England, France, and the American colonies all experienced student discipline issues
ranging from mild misbehavior to assaults, rioting, and even violent altercations with
swords and firearms (Crews & Counts, 1997).
Throughout United States history, schoolchildren’s misdeeds have been well
documented. In Tennessee during the 1830s, a teacher was stabbed and dropped into
a well, and the school house was burned down (Wyatt-Brown, 1986). However,
technological advances in communications during the 20th century brought
knowledge of these safety and security lapses on school campuses to mainstream
29
America. In Bath, Michigan, on May 18, 1927, a school board member, Andrew
Kehoe, killed 45 people (38 of them elementary school children) and injured 58 when
he detonated a bomb at the Bath Consolidated School; he then set off a car bomb as
rescuers and onlookers gathered at the school to help. This act was the worst disaster
to occur in an American school up to that time (Fisher, 2007; Lindle, 2008; Shah,
2013).
As news of violence in schools began to spread throughout the decades of the
20th century, students began to direct extreme acts of violence toward other students
(Davis, 1971). In the 1920s, students fought with fists and occasionally rioted, but for
the most part, the time represented a period of affluence and opulence where schools
taught morality, character, and citizenship to students (Denmark et al., 2005).
According to Johnston (2012), prior to the 1950s there was little concern by school
administrators about school violence; however, more recent research created
conflicting reports (Warner et al., 1999). A 1949 survey of high school principals
suggested that they had no major issues with either student violence or destruction of
property, but by 1956, the National Education Association (NEA) found that violence
was becoming a serious issue on school campuses (Warner, Weist, & Krulak, 1999).
Johnston (2012) asserted that a quick inquiry of the New York Times produced 18
incidences of violence with firearms on school campuses between January 1, 1940,
and December 31, 1959.
By the 1960s and 1970s, knives took the place of fists, bats, and bricks, and
violent acts with firearms began to occur more frequently. On August 1, 1966,
30
Charles Whitman took the elevator to the observation deck of the clock tower at the
University of Texas in Austin, and began a shooting rampage, hitting 31 people—
killing 14. This was the deadliest shooting on a college campus until 2007 (Denmark
et al., 2005, Fisher, 2007; Knox et al., 1992). Denmark et al. (2005) maintained that
the number of homicides on elementary and secondary schools increased by nearly
20%. In the 1980s, violent acts on school property, specifically shootings, became
more prevalent, as the country experienced three major tragedies in the decade. The
first school shooting took place in St. Louis, Missouri, in 1983. The next occurred in
Winnetka, Illinois, and the last of the decade took place in Stockton, California, in
1989. In total, 8 students died and 34 were wounded in attacks on school campuses
(Fisher, 2007).
By the 1990s, assault (with and without weapons), sexual assault, rape,
bullying, intimidation, arson, extortion, robbery, theft, hazing, and drug and alcohol
abuse all increased on school campuses (Volokh & Snell, 1998). Fisher (2007) called
the 90s “the worst decade on record for school shootings” (p. 46). In April of 1999,
12 students and one teacher were killed, and 24 others were wounded at Columbine
High School in Colorado—the worst loss of life at a secondary school in American
history to date and the second most deadly in a public school setting in nearly 80
years (Fisher, 2007). School violence became a major issue facing American society
as a whole and was no longer considered a random issue that affected only a few
unfortunate schools and families (Crews & Counts, 1997).
31
The last decade of the 20th century and the early 21st century saw acts of
violence occur based on rebellion, anger, and protest by disgruntled students to
premeditated random acts of terrorism (Denmark et al., 2005). Research conducted
by Flannery et al. (2013) indicates that, from “1996 to 2006, 207 student homicides
occurred in US schools, an average of 21 deaths per year … with 65% attributed to
gunshot wounds—including the deaths of 13 students and a teacher at Columbine
High School in 1999” (p. 2). According to the most recent data gathered by the
National Center for Education Statistics (NCES) from July 1, 2010, through June 30,
2011, there were 31 school-associated violent deaths in elementary and secondary
schools in the United States (Robers et al., 2014). The shooting deaths at Virginia
Tech University in 2007 and the 26 students, teachers, and administrators at Sandy
Hook Elementary School in 2012 continue to stimulate student fears and to shock the
educational community (Jones, 2013; Kennedy, 2010).
Consequently, school administrators across the United States have
implemented plans to protect students by improving security measures. From
installing metal detectors and video surveillance to hiring security staff and police
officers, educators are trying to be vigilant about protecting students and staff on
school campuses. Research clearly substantiates these efforts by school officials. In
2011, 95% of the students in one study reported that their schools implemented a
student code of conduct, while 89% of the students reported that school staff or adult
supervision was visible in the hallways. Furthermore, 77% of the students between
the ages of 12 and 18 reported seeing security cameras in their schools, 70% reported
32
the presence of campus security or SROs at their schools, and 11% maintained that
their schools used metal detectors on their campus (Robers et al., 2014, p. viii).
However, violence and bullying have not disappeared and continue to create
anxiety among students (Rea & Stallworth-Clark, 2003). According to the most
recent Phi Delta Kappa/Gallup Poll 2013, 51% of the public school parents agreed or
strongly agreed that school districts should employ more armed security guards in
schools. The same poll showed that 35% of the parents agreed or strongly agreed
with arming teachers and administrators to keep their students safe at school (Bushaw
& Lopez, 2013). Unfortunately, the most important resource available about how to
address school violence and eliminate student fears is consistently overlooked: the
students themselves (Winter, 2011).
Although secondary school administrators have observed and dealt with many
forms of student violence throughout hundreds of years of education, and they
understand the necessity of having student safety and school security measures in
place, the attacks of September 11, 2001, “put the issue of [school] safety and
security on the front burner” (Kennedy, 2011, p. 19). The United States not only
responded by creating the U.S. Department of Homeland Security but also developed
the National Incident Management System (NIMS) for entities such as schools to
prepare for and respond to significant terrorist attacks and violent calamities across
the nation. Under NIMS, the Department of Education encourages school officials to
be familiar with and institute its six major components: command, preparedness,
33
resource management, communications and information management, supportive
technologies, and management maintenance.
Faced with intense public pressure to provide a safety for students from a
myriad of terrorist-type of attacks, schools engage in lockdown drills and other
emergency plans designed to deal with a myriad of contingencies (Kennedy, 2011).
Consequently, new generations of students have become accustomed to more
intensive security measures such as video surveillance, the presence of police officers
on campus, zero-tolerance policies, conflict mediation, and instruction-based
programs to reduce bullying, gang activity, and violence (Juvonen, 2001; Rand,
2001). School buildings are painted with numbers that identify them in a systematic
way. Intercoms and electronic door locks are designed to keep students in school
rooms and intruders out. Signs also help with the transportation of students on and
off campus. Increased security is simply the new normal for schools and students
(Kennedy, 2011).
Legal Framework
The issue of school safety has prompted vast educational changes and federal
and state legal reforms in American schools, beginning in the latter part of the 20th
century (Hantman et al., 2008). Over the last 40 years, the federal government has
conducted investigations and has passed legislation in an effort to eliminate school
violence and student fears that are perceived to spoil the American educational
system (Cornell & Mayer, 2010). In 1975, a Senate report concluded that homicide,
rape, and assault in schools were increasing dramatically (Bayh, 1975). Additionally,
34
the Safe and Drug Free Schools and Communities Program of 1986, the Gun Free
School Zones Act of 1990, the Gun-Free Schools Act of 1994, and the Gun Free
School Zones Amended Act of 1996 all depict U.S. educational institutions as places
that no longer resembled a safe learning environment but an ever-increasing danger
for students (Cornell & Mayer, 2010; Gregory & Cornell, 2009).
In an effort to combat violence in California schools, voters amended the State
Constitution in 1982 by adding the “Right to Safe Schools” provision under Article I,
§28, subdivision (c), which states, “All students and staff or public primary,
elementary, junior high and senior high schools have the inalienable right to attend
campuses which are safe, secure, and peaceful” (as cited in Biegel, 1987, p. 789).
Furthermore, Glaeser and Calcagnie (2005) cited California Government Code
§ 820(a), 815.2(a), which states that school personnel, as well as school districts, can
be held liable for injuries to students and staff due to a lack of reasonable safety and
security measures. Schools are obligated to act in loco parentis to ensure that
students are safe in schools (Greene, Barrios, Blair, & Kolbe, 2004).
In reaction to public outcry and the growing number of violent acts that were
occurring at schools, governors across the United States emphasized the necessity for
safety and security in the Goals 2000: Educate America Act, which was signed into
law March 31, 1994. The legislation set a goal that, “By the year 2000, every school
in the United States will be free of drugs, violence, and the unauthorized presence of
firearms and alcohol and will offer a disciplined environment conducive to learning”
(Paris, 1994, pp. 22–25).
35
The No Child Left Behind (NCLB) Act of 2001 mandated that states identify
“persistently dangerous schools,” but they may do so in many different ways
(Christie, 2004, p. 5). Schools that are designated “persistently dangerous” must
allow students to move to a “safer school,” similar to the policy under the NCLB,
which allows students to switch schools if their school is designated as an
“underperforming school” (U.S. Department of Education, 2004). However, the
“NCLB provides no remedies for persistently dangerous schools other than an escape
route for some students” (Lindle, 2004, p. 37). Under the NCLB, “the consequences
of a public accounting for school safety may have generated more opportunities for
public fear and panic as opposed to increasing conditions for school safety and
security” (Lindle, 2008, p. 28). Consequently, the question regarding how to create
safe schools appears to continue to be an enigma to educators and politicians (Akiba,
2008; Wood & Huffman, 1999).
Identifying Security and Safety Issues
According to Bullock and Fitzsimons (1996), “The problem of aggression and
violence in schools has reached such a serious level that the Center for Disease
Control and Prevention (CDC) refers to it as a national epidemic” (p. 34). Cruelty,
bullying, persecution, and harassment toward students must be combated at all levels
of education. Just as district and school administrators seek to eliminate illiteracy,
increase student achievement, and eradicate drop-out rates, definitive strategies must
be employed to remove violence, bullying, intimidation, and harassment on
campuses. Unfortunately, schools as well as communities react to these issues only if
36
episodes of violence make the headlines of the local, community, or national
media. Nationwide, educators need to make safety and security a goal that is as
important as rigorous academic standards (Hantman et al., 2008).
According to the Center for Disease Control (CDC) (2010), the goal for
schools should be to stop violence before it occurs. Prevention is a proactive method
for dealing with potential issues that could become violent. The CDC suggested a
four-stage approach to deal with school violence. First, the stakeholders must
understand the problem. Describing the issues means analyzing data, which, in turn,
identifies what type of violent behaviors are taking place, where they are happening,
and who is involved. Second, “prevention must focus on the variety of factors that
put people at risk for experiencing or perpetrating school violence … prevention
efforts must focus on these factors” (p. 4). Third, prevention strategies must be
designed from an assessment of the research. Once programs are developed, “they
must be evaluated rigorously to determine their effectiveness” (p. 4). Fourth, once
the programs and policies have been proven effective through research-based inquiry,
they must be implemented with fidelity in schools and communities. Trainings must
supply teachers and staff with the ability to execute the strategies in order to have the
greatest impact (CDC, 2010).
In 1994, educational professionals were invited to a conference called the
Eagle Summit in Irving, Texas, to specifically discuss the issues facing students in
schools. Drawing on their expertise in education, juvenile justice, mental health, and
counseling, the group arrived at a consensus about the most effective means to
37
improve school safety. The practices included establishing a School Safety Task
Force much like a School Safety Committee, determining the scope of the problem in
the school by identifying the types of incidents and the hot spots on campus where
students were most likely to be involved in violent acts, and creating and maintaining
a strict discipline policy that was fair and firm. Having adequate security and
supervision visible at all times was also imperative. Additionally, closely monitoring
visitor access onto the campus, implementing strict interventions by posting
emergency plans, and establishing behavior contracts that utilize Alternative
Education placement as a consequence for violence and abusive behaviors are actions
that cultivate safety at school (Bullock & Fitzsimons, 1996).
Wood and Huffman (1998) conducted research among six urban high schools
in Texas to identify detailed strategies that were cited by teachers, students,
administrators, and former gang members as being effective at preventing gang-
related behavior and violence at schools. The research showed that violence,
bullying, intimidation, and harassment were drastically reduced when the schools
followed a number of prevention policies. The first strategy was a well-defined
student code of conduct that was readily available to all students and parents. The
second was a stringent dress code that was strictly enforced by administrators,
teachers, and campus security. The third focused on administrators (both principals
and assistant principals) who were highly visible, available, and approachable.
Additionally, each campus employed a School Resource Officer and was frequently
visited by drug dogs (Wood & Huffman, 1999).
38
Bullying and Violence
Akiba (2008) detailed how school safety issues are not unique to the United
States but exist across the world. The author asserted that school violence and fear
affect student attendance, motivation, and, most importantly, academic achievement.
The study was conducted across 33 countries in an effort to answer three questions:
(a) How does the level of eighth graders’ fears of becoming victims of school
violence differ across 33 countries? (b) How do the individual characteristics of
eighth graders who fear becoming victims of school violence differ across 33
countries? And (c) What school and teacher characteristics are associated with the
level of eighth graders’ fears in the 33 countries? He discoverd that classroom
management was an intricate factor in students’ perceptions of safety. “School
disorganization” was the number one predictor of a fear of violence among eighth
graders in developed nations such as the USA, Chile, Israel, the Netherlands, and
Taiwan (p. 68). Akiba (2008) concluded, “Across the world, educators and policy
makers need to know that approximately 28.5% of 8th graders in school feel that it is
not a safe place to learn and fear becoming victims of violence” (p. 69).
In 2005, Mooij provided an analysis of a national campaign in the Netherlands
waged on bullying and violence. Beginning in 1991, the study began with bullying
involving 36 secondary schools and 1,055 students. The study concerning student
violence began in 1993, utilizing 71 secondary schools and 1,998 students. The final
study for both bullying and violence was completed in 2000. In 2000, the number of
39
schools that remained in the study were the same for both categories: 60 schools,
291 teachers, and 9,948 pupils ranging from 12 to 18 years of age.
The purpose of the analysis was to identify differences in the amount of
bullying and violence before and after the implementation of the campaign. The data
from pupils in identical school years were compared with respect to bullying between
1991 and 2000 and violence between 1993 and 2000. The statistical relations were
analyzed in a two-step multiple-regression analysis. According to the study, the years
of investigation (1991–2000 and 1993–2000) was the respective dependent variable.
The independent variables were pupils’ bullying or violence scores, sex, school year,
contextual lesson, school, and community variables. In order to conduct a test for
reliability and homogeneity, the responses were coded as (1) does not happen,
(2) sometimes happens, (3) regularly happens, and (4) frequently/always happens.
In both regression analyses, the contextual lesson and school variables
discriminated between the measurement years. In the first study, Mooij analyzed the
two groups: (a) the control group of students who took the survey in 1991
(N = 1,055), and (b) the experimental group that took the survey again in 2000
(N = 4,159). A t-test for independent groups was used to compare the groups’
exposure to bullying and the programs used to reduce bullying. The results showed
that there was a slight difference in the experimental group’s mean number of
students being bullied directly. Compared with 1991, the pupils in 2000 scored lower
for being a bully and higher for being bullied directly.
40
In the second study, Mooij analyzed the two groups: (a) the control group
of students who took the survey in 1993 (N = 1,998), and (b) the experimental group
that took the survey again in 2000 (N = 4,615). A t-test for independent groups was
used to compare the groups’ exposure to violence in schools and the programs used to
reduce violent behavior. The results showed that, compared with the students in
1993, the students in 2000 scored lower for being perpetrators of disruptive behavior
in school and higher for being perpetrators of intentional damage to property (Mooij,
2005).
According to Mooij (2005), the programs initiated in the Netherlands reflected
results in reducing violent behavior and improving student awareness of the issue of
proper social behavior. The nationwide effort consisted of a contest for videos,
photographs, texts, comic strips, posters, and music that promoted combating
violence and bullying. Student hotlines were installed; health and safety plans were
created and made available to students, staff, and parents; and welfare and counseling
organizations teamed up in order to provide counseling and other social services such
as anger management and conflict resolution. The number one factor that appeared to
have the greatest impact on lowering the amount of bullying and violence was
generating social awareness and educating students and adults in the communities and
school systems on the extent of the problems (Mooij, 2005).
From 2003 to 2006, the Alabama Department of Education took part in a
survey of its middle and high school students to determine the level of substance
abuse and dangerous behaviors among their students. According to the data collected
41
through a questionnaire called the Pride Questionnaire, 228 questions were asked
to get students to self-report about behaviors they considered dangerous and whether
or not they were engaged in them. According to Alabama’s Department of
Education, 263,944 students participated between 2003 and 2005. The data were
compared, and trends emerged. Initially, from 2003 to 2005, fewer students reported
being afraid at school, from 23.7% down to 21.7%. Students experiencing
threatening behaviors and being hurt at school were down from 41% to 37.9% and
22.7 to 20.8%, respectively (Pride Surveys, 2006).
The dichotomy with regard to this study is that, while more students felt safe
at school and non-threatened, the number of students participating in gangs and gang-
related activity went up. The Alabama Department of Education reported in 2005
that 36.4% of the students surveyed were gang members and sold drugs at school,
38.7% of the gang members said that they had threatened a teacher, and 23.5% of the
gang members claimed that they had been physically violent with other students on
campus, “using a gun, knife, or club” (Pride Surveys, 2006, p. 5).
School Resource Officers
According to the U.S. Department of Justice, local law enforcement agencies
have been asked to play an increasingly prominent role in ensuring school safety. The
federal office for Community Oriented Policing Services (COPS) initiated the School
Resource Officer (SRO) Program in an effort to reduce violence in local school
districts (Ramey, 2004). State and local law enforcement agencies are bringing
42
community policing to schools by hiring SROs who utilize a community-oriented
policing philosophy (Ramey, 2004).
SROs provide another proactive measure against violence on school
campuses. At Kettering City Schools in Ohio, the SRO program has established itself
as a beneficial addition to other security measures instituted by the school. Ramey
(2004) asserted that a study completed by Community Oriented Policing Programs
(COPS) showed that the presence of SROs “satisfied the needs of students, staff, and
parents to feel safe” (p. 71). SRO programs serve as an integral part of overall
school-safety programs. Having an SRO on campus during times of crisis reduces
response time from emergency services and increases perceptions of safety on
campus by students and staff (Booth et al., 2011). Booth et al. (2011) suggested that
“a positive and collaborative relationship between law enforcement personnel and
students can increase information flow and enhance the accuracy and effectiveness of
threat assessments” (p. 8).
Kettering Fairmont High School also used data to determine what kind of
impact the SRO program had on the student body. According to the school, the data
showed “a highly significant difference in student behavior within the school and
community before and after the implementation of the SRO program” (Ramey, 2004,
p. 70). Kettering Fairmont High School revealed two conclusions from its research.
The first was that “students’ behavior changed when law enforcement officers were
present, [and second] the behavior of students in the community also changed with
the increased presence of law enforcement officers in the school” (Ramey, 2004,
43
pp. 71–72). According to school discipline records, suspensions decreased by
19%, expulsions by 26%, and office referrals by 7% (Ramey, 2004, p. 72).
However, in another study, the assignment of police officers on campus
“offers increased risk of resistance and antisocial behaviors as well as erodes the
personal relationships between teachers and students” (Lindle, 2004, p. 36). Watts
and Erevelle (2004) suggested that the visibility of school personnel, especially
teachers rather than SROs, provide the ultimate deterrent to any uncivil or criminal
behavior on school premises. Teachers can be a powerful influence on lowering the
potential for violence if they are perceived as being personally connected to and care
about students (Astor, Meyer, & Beyer, 1999).
School Culture and Climate
School culture is the “quality and frequency of interactions between staff
members in the school and students, among the students, among the staff members
themselves, and between the staff at the school and parents and the community”
(Gorton, Alston, & Snowden, 2007, p. 163). The vision of every high school
administrator should be to provide a peaceful place where a diverse group of people is
able to learn together in cooperation and unity (a place of meaningful instruction),
where academic success flourishes because students know they are safe.
Johnson (2009) provided an insightful look into predictable factors that
contribute to improving school culture and climate in a cross analysis of 25 different
research studies that identified similarities in the reduction of school violence by
improving school culture and environment. His examination produced five specific,
44
overlapping points about reducing school violence. He found that (a) students and
teachers must develop positive relationships of trust with each other, (b) students and
teachers must be well informed of the rules and believe they are just, (c) students
must have ownership in their school and want to be a part of the planning and
learning process, (d) classrooms should be well-organized and conducive to academic
learning, and (e) administrators must constantly work to improve students’
perceptions of safety and order on campus. In contrast, schools that were more
susceptible to violence were viewed by students and staff as employing
administrators who were uncooperative and unsupportive of the staff and lacked basic
security provisions (Johnson, 2009).
Three core beliefs form the underpinnings of a successful and safe
environment. These beliefs are (a) everyone deserves to be respected and to have his
or her opinion valued, no matter what ethnicity, age, gender, or ability; (b) students,
staff, parents, and community members have a stake in keeping the school safe and
each has a vital role to play; and (c) schools must be sanctuaries where all people feel
protected and welcome, whether they are students, parents, staff, administrators, or
community members.
Suspension, Zero Tolerance, and No-Contact Contracts
According to Dufresne and Dorn (2005), the idea that adult supervision makes
students safe is a fallacy. Lindle (2008) also asserted that school safety is a fantasy
that parents and communities want to believe, and when violence occurs, the
perception of safety turns into panic that results in “school policies and rules that,
45
perversely, may exacerbate community fears (p. 28). School officials cannot
guarantee every student’s safety at every moment even if it is a primary responsibility
of schools “to provide a safe and orderly environment that is conducive to learning”
(Ramey, 2004, p. 70). Bullying, violent behavior, and sexual harassment can occur
within 10 feet of a teacher. Just because a coach, teacher, or staff member is present
does not mean that students are being supervised.
In an effort to maintain safety, schools have implemented zero-tolerance
policies as a method of preventing school violence. According to Gregory and
Cornell (2009), “Zero tolerance is the most popular and widespread discipline reform
in American schools today” (p. 106). Gregory and Cornell (2009) suggest that
through zero tolerance, administrators can remove the dangerous students
immediately, therefore making the school safer and sending a stern message to
would-be offenders that the school will not tolerate violence and misbehavior.
Reynolds et al. (2008) suggested that zero tolerance is utilized because school
violence is at crisis levels, and prevention is needed. Zero tolerance increases the
consistency of school discipline and clarifies the message of no nonsense to students.
Removing students who violate school rules creates a climate that is conducive to
learning, and swift punishment has a deterring effect on students, “thus improving
overall student behavior and discipline” (Reynolds et al., 2008, pp. 853–854).
However, Lindle (2008) maintained that zero tolerance does not work because
“the tendency to clamp down on disruptive students merely establishes an escalating
spiral of mayhem that affords little protection to nonviolent students … and in fact,
46
ensures antisocial development among offenders” (p. 38). Kohn (2004) asserted
that “Fear often drives people into rash decisions and wrong-headed policies that may
exacerbate conditions and certainly offer unintended consequences” (p. 23).
Actions based on zero-tolerance policies “appear to be common sense,
pragmatic responses, but are predicated on the assumption that violence can be
stamped out one individual perpetrator at a time through a generic set of
punishments” (Lindle, 2008, p. 33). Lindle emphasized that schools need to
administer the remedy of suspension and expulsion in a very careful manner and,
when utilized, find ways to “reintegrate offenders into educational processes” through
school- and community-based youth programs for social development (p. 39).
Christle, Nelson and Jolivette (2004) found that increased worries over school
safety have led to higher rates of suspension in schools in an effort to make schools
more secure. This research has shown that suspension is not a disciplinary strategy
that eliminates risk. In fact, the data showed that “exclusionary policies such as
suspension may contribute to the risks for youth delinquency” (Christle et al., 2004,
pp. 524–525). The researchers discovered that in 20 Kentucky schools with the
highest suspension rates, compared to 20 schools with the lowest suspensions,
suspension was not an effective method for reducing bad behavior and youth
violence. Christle et al. (2004) maintained that serious violations of school safety
threaten the security of students and require suspension under current policies, but
suspending these students has shown to increase their risk of continuing to engage in
violence and crime.
47
The Josephson Institute of Ethics (2001) discovered in a survey of 15,000
boys and girls of secondary school age “that 75% of the boys and more that 60% of
the girls had hit someone in the past 12 months out of anger” (Thomas & Smith,
2004, p. 135). Therefore, in 2002, Thomas and Smith (2004) conducted a study
comparing violent and nonviolent youth, using categorical variables and a chi-square
analysis of 123 boys and 158 girls with a mean age of 15.3 years. What they
discovered was that 49% of boys and 41% of girls did not think of themselves as
well-liked by their peers and 70% of boys and 65% of girls reported being lonely
which directly correlated with whether they behaved violently or nonviolently in
school. Thomas and Smith (2004) also discovered, “Violent youth compared to
nonviolent youth, were also more likely to perceive school discipline as unfair
(χ2 = 19.95, p < .001)” (p. 140).
Comparisons of violent and nonviolent youths on three anger variables
showed considerable significance. The researchers found violent youth were less
likely to suppress their anger (t=3.55, p=.0005), violent youth were more likely to
vent their anger toward others (t=3.68, p=.0004); and violent youth were less likely to
discuss their anger in a healthy way (t=2.32, p=.02) (Thomas & Smith, 2004, p. 140).
There were only two differences in the anger variables: boys scored higher than girls
on showing and expressing their anger aloud and in the open, while girls scored
higher on internalizing anger and letting it fester within them.
Thomas and Smith (2004) suggested that interventions were needed to work
with alienated students and to find ways to connect them and make them feel a part of
48
the whole student body, school culture, and community. The students who
participated in the study, no matter if they were classified as violent or nonviolent,
suggested that school was like a prison, that it was too rigid with rules, that policing
was overbearing, that metal detectors were oppressive, that video cameras invaded
student privacy, and that zero-tolerance policies meted out disproportionate
punishments using suspensions and expulsions (Thomas & Smith, 2004).
No contact orders are a way for administrators to deal with students that have
exhibited bullying or violent tendencies toward other students. These are legal
contracts enabled to be enforced due to the mandate that school staff has to protect
students—even if it means from other students. No contact orders are being utilized
and enforced at schools around the nation in lieu of suspension. According to Henley
v. Iowa District Court (1995), a student who “violates a no contact order may face a
criminal charge or a civil contempt charge” (Mayes, 2008, pp. 39–40).
In order to assist students in creating optimal conditions for maintaining an
effective no contact order, it may be necessary for school officials to change the
offender’s schedule so that it does not coincide with the victim’s, change the
offender’s locker assignment, inform staff and have a policy in place should they see
the aggressor violate the order, and possibly alter dismissal times for the offender in
order to eliminate all contact with the victim (Mayes, 2008). Doing nothing is not an
option. When a no contact order has been violated and reported to the school, law
enforcement must be contacted and/or suspension must occur. Mayes (2008) asserted
that schools may not be selective in enforcing the order. In an effort to avoid possible
49
violence, students must know that the “school’s disciplinary practices [are]
immediate and certain.… If perpetrators know that school officials selectively or
arbitrarily report no contact order violations, they feel less risk when choosing to
violate an order” (p. 43).
Security of School Facilities
The National Association of Secondary School Principals (2004)
recommended that administrators conduct school security assessments to help reduce
the risk of violence on their campuses. According to Trump (1999), “pre-packaged
programs look good on paper, but the most effective safety measures are the ones
tailored to your school—and a comprehensive assessment will bear out your school’s
needs” (p. 18). Trump suggested that assessments should be piloted by “individuals
with experience in professional security, but in cooperation with administrators”
(p. 20). The components of an assessment should focus on security and police
staffing, security policies, safety procedures, crisis preparedness, education and
training, physical security of staff and students, and linkages to community and
school intervention programs. Trump provided tips for choosing a security
consultant, suggesting that assessors have school-security experience and that they
are independent, meaning that they have no products to sell. Real-world knowledge,
verifiable credentials, professional behavior, and good public relations round out the
final requirements for finding an assessment team.
However, Dufresne and Dorn (2005) maintained that school officials are not
fairly reciprocated for services provided by private-security consultant services. He
50
asserted that, with the assistance of government programs and materials, schools
and communities can do a better job of writing safety plans and establishing
emergency procedures than paid consultants can.
In 2003, at New York City High School, security measures became fully
electronic. Technologically advanced surveillance equipment became so widespread
that the school became known in the community and in the media as the “surveillance
spectacle” (Kress, 2011, p. 17). Students were literally monitored throughout the
school by security guards and police officers via live-feed video cameras. Students
were subject to bag searches with X-ray equipment; they were required to enter the
campus through metal detectors and had to scan an identification card as they entered
and left campus. Teachers “were required to place their hands on a biometric time
clock.… This clock scanned their fingerprints and documented when they entered and
exited the building” (Kress, 2011, p. 18). However, the Journal of School Health
published the results of a study that was an amalgam of seven studies that were
completed over 15 years; in this study, the researchers found that “there is insufficient
data to determine whether the presence of metal detectors in schools reduces the risk
of violent behavior among students, and some research suggests that the presence of
metal detectors may detrimentally impact student perceptions of safety” (Hankin,
Mertz, & Simon, 2011, p. 100).
As far back as 1997, a fatal stabbing at Bayonne High School in New York
prompted the school to initiate broad security measures. As cited by Peterson (1997),
the school’s 40 doors were locked at all times, except for three doors that were
51
supervised by school staff and remained open until 9 a.m. Visitors were allowed
through the front door only, which was monitored by a video camera. Students and
staff were required to wear identification badges, and the school driveways and
parking lots were closed to traffic; however, metal detectors were not installed on the
campus.
In April 2008, the National Clearinghouse for Educational Facilities (NCEF)
authored a security pamphlet titled “Low-Cost Security Measures for School
Facilities.” The purpose of the pamphlet was to provide schools with low-cost ideas
about how to improve school-safety measures. The NCEF identified three areas of
importance that school administrators should address in order to increase safety: the
physical security inside and outside of schools and the general policies that schools
should have in place. First, it is important to identify troubled areas of schools where
security may be an issue and have students stay out of them, if possible. Next, the
NCEF suggested that crisis-response teams be set up at the schools to deal with major
catastrophes and to assist emergency responders. The pamphlet suggested that school
administrators do numerous things outside the buildings, ranging from delineating
school-property boundaries with vegetation, signs, or fencing and establishing clear
lines of sight throughout campus to eliminate hiding places. Schools should have
distinctive markings that identify buildings clearly, and they should have proper
lighting. Inside buildings, the number of entrances should be limited to as few as
possible. Rooms and doors should be numbered in a logical sequence so that first
responders can locate them quickly. Hallways should be kept free from clutter and
52
debris, and all classrooms should have medical supplies and effective
communication lines to the main office.
In Houston, Texas, 16,000 students in the Spring Independent School District
were required to swipe identification tags as they entered school buses. Monitoring
equipment tracked them from the bus, into the schools, and as they left for home.
More than 1,000 security cameras watched students all day long. Visitors had to
surrender their drivers’ licenses to secretaries and waited while their IDs were
reviewed against the national database of sex offenders. According to Toppo (2006),
1 in 3 schools temporarily isolates visitors inside secure entrances, just like the one in
Houston, Texas, until they are approved to enter. Using a security tracking system
designed by Raptor Technologies, if the visitor is a sex offender, Raptor emails a
photo of the subject to the police station, and the school restricts access to the would-
be visitor. Police officers suggested that ID checks are definite deterrents to criminal
activity, but one police chief also acknowledged that, “If somebody’s really
determined to get into a school and they have a high enough caliber weapon, they’re
going to get in” (Toppo, 2006, p. 1).
Due to a high level of street violence in Chicago, Illinois, the City Council
decided to use $30 million in federal stimulus monies to create a program at the
City’s 38 high schools, called “cultures of calm,” which focused on improving
attendance, behavior, and academic success (Kennedy, 2010, p. 17). According to
recent studies completed, in 6 of the 38 high schools, attendance has increased,
discipline issues had decreased, and the D and F list had been reduced. The “cultures
53
of calm” program also includes a program called Safe Passage, where students are
provided transportation to and from school to avoid high-crime neighborhoods.
Additionally, the school is working with the community to establish a School
Community Watch group to assist in keeping students safe and a mentor program for
3,000 students who were determined to have the highest risk for falling victim to
violence (Kennedy, 2010). The Board of Education suggested that the programs have
a two-fold purpose: “to reduce the likelihood that at-risk students will engage in, or
become victims of violence; and creating a safe and supportive environment for
students to improve attendance and excel academically” (Kennedy, 2010, p. 18).
Implementation of security measures on school facilities often follows dire
conflicts and events as schools continue to be reactive rather than proactive. In 2007,
a student shot and wounded two teachers and two students at a Cleveland, Ohio,
school before killing himself. Four days later, students returned to school through a
newly installed metal detector and an X-ray scanner machine to check their
backpacks. Additionally, the Cleveland Police Department assigned 10 additional
officers to the City’s schools (Flask, 2007).
Students’ Perceptions of Security Measures
Bracy (2011) asserted that public schools have changed considerably over the
last 40 years in response to school violence and student safety. Currently, public
schools are high-security environments in which police officers, security cameras,
metal detectors, and strict discipline policies are used to keep students in line and to
maintain safe campuses. These changes undoubtedly influence the social climate of
54
schools, yet very little is known about how students experience and perceive these
measures.
Through ethnographic research in two contemporary public high schools,
Bracy (2011) examined students’ perceptions of high-security school environments,
including perceptions of their SROs, their schools’ discipline policies and
punishments, and the schools’ fairness-in-rule application. The findings in this study
showed that students perceived their schools to be safe places and thought many of
the security strategies the schools used were unnecessary. Students further expressed
feelings of powerlessness as a result of the manner in which their schools enforced
rules and handed down punishments (Bracy, 2011).
Lindle (2008) suggested that students’ perceptions of the likelihood of
violence on school campus is increased with the visibility of security measures such
as SROs, surveillance cameras, fences, and security doors. According to Gastic
(2011), metal detectors may stigmatize the campus and cause students, parents, and
teachers to experience a higher level of fear. Metal detectors are “negatively
correlated with students’ sense of safety at school” (Gastic, 2011, p. 486). The
measures designed to make students feel secure actually have the opposite effect
(Reddy et al., 2001). Actions taken by schools to augment security measures and
student safety are the weakest methods of increasing students’ perceptions of safety
(Kitsantas, Ware, & Martinez, 2004).
55
Student Safety vs. Academic Performance
According to Hantman et al. (2008), a school’s discipline and safety practices
can significantly impact a students’ perceived safety at school, and significantly
impact their academic performance. According to the authors, 6% of students skip
school each day for fear of physical harm coming to them. However, Hantman et al.
reaffirmed that, “Just as safe and healthy school climates contribute to effective
teaching and learning, disruption, violence, and threats of violence greatly impede
learning” (p. 2). Hantman et al. maintained that schools must initiate effective
discipline policies and safety practices in a proactive manner to increase students’
perceptions of safety at school.
Additionally, Goldstein, Young, and Boyd (2008) maintained that student
achievement is dramatically reduced when students perceive their school as unsafe.
When students experience fear, intimidation, or bullying, they are less likely to focus
on academics. Additionally, Wolf (2009) suggested that students’ abilities to solve
cognitive problems are hampered, and they are more likely to fail in the classroom
environment when they are fearful. Freiberg (1998) asserted that an atmosphere of
safety and peace at school can have a positive impact on the academic and social
success of students and can greatly enhance their experience and attitude toward
school.
Classroom Management and Student Safety
In another study, Allen (2010) discovered that classroom management had a
high degree of correlation to bullying. Bullying is more likely to occur in classrooms
56
where burned-out or novice teachers allow student behavior to get out of control.
Research has shown that teasing, harassment, and bullying, which are factors in many
school shootings, begin in the classroom setting. Successful classroom management
establishes “rules and procedures, organizing groups, monitoring and pacing
classroom events, and reacting to misbehavior” (Allen, 2010, p. 2).
Classroom rules are an important part of maintaining control of the school
climate and culture. Rules should be “simple, clear, measurable, limited in number,
and should be created with student input (Allen, 2010, p. 8). However, classroom
rules are not the only line of defense against misbehavior. According to Allen (2010),
the best defense against student bullying and discipline issues is effective instruction.
Engaging students in lessons that differentiate instruction and utilizing strategies they
can relate to in their own lives eliminates many behavior issues that teachers have in
class and helps establish relationships with students in which they feel like partners in
the learning process (Allen, 2010).
The final analysis of this study suggested that, “when teachers care about
students, when they organize classrooms such that positive student relationships
develop, and when they manage learning and behavioral issues in positive educative
ways, students are far less likely to engage in or experience bullying” (Allen, 2010,
p. 10). Classes that do not establish a culture of “understanding, caring, monitoring,
and intervention are likely to be predisposed to bullying” and violence (Allen, 2010,
p. 11).
57
Positive Relationships with School Personnel
Phillips, Pack, and Linney (2008) established that a student-centered approach
to school safety is needed to foster relationships with adults and to reduce, if not
eliminate, school violence. Pollack, Modzeleski, and Rooney (2008) found that
school teachers and administrators that were visible and approachable helped to
create trust and respect which in turn led to increased safety at school. Additionally,
Pollack et al. (2008) revealed that “Simple and genuine measures, such as regularly
greeting students, talking to students, and addressing students by name, help make
students feel connected and part of the school” (p. 8). Phillips et al. (2008) also
revealed that positive, trusting relationships between students and adults on campus
were the key to having students report inappropriate behavior that reduces criminal
activity and fights on campus. Trust encouraged students to share information with
responsible adults concerning threats, bullying, or violence (Pollack et al., 2008).
Furthermore, students submitted that having teachers and administrators whom they
trusted encouraged them to report suspicious activity, fights, sexual or physical
harassment, dangerous situations, bullying, and weapons at school (Wood &
Huffman, 1999).
Further research has shown that teachers have an impact on students’ feelings
of safety on school campuses. Hammond (2002) asserted that students consistently
felt more secure in a school where teachers were perceived to have greater control
over classroom discipline and student behavior. Even teachers who were
considerably stricter than others were viewed favorably in terms of increasing student
58
safety. A firm, fair, consistent teacher was a powerful key to students’ perceptions
of safety within the school (Hammond, 2002). Moreover, Hong and Eamon (2011)
asserted that students recognize their school as a safe place when they have teachers
who are willing to take time to build relationships of trust and understanding with
them. Building trust between students and adults takes time but is imperative in order
for students to obtain the feeling of well-being at school, which enables them to focus
on their academic and personal success.
A study that was carried out in Chicago during the 2009–2010 school year
concluded that “school safety depends far less on the poverty and crime surrounding
the campus than on the academic achievement of its students and their relationships
with adults in the building” (Sparks, 2011b, p. 13). The Consortium on Chicago
Schools Research discovered that students’ academic achievement plays a larger role
in school safety than the neighborhood in which a school resides, and trusting
relationships between students and staff are more important to safety than the rate of
crime in the community where the school is located. Through the study of 120,000
student surveys and 12,500 teacher responses, the researchers found three factors that
students and teachers agreed on. Sparks (2011b) suggested that “schools were safer
when its students came from safer neighborhoods” (p. 13). Additionally, students
with higher levels of academic achievement had a higher perception of school safety
than those students who exhibited lower test scores and grades. Last, the most
significant element in the perception of school safety is the trusting relationships that
students have with their teachers.
59
The Democratic Ideal in Schools and Student Safety
With the massive influx of immigrants to the U.S. through two Industrial
Revolutions, the 19th- and 20th-century American education system evolved into
post-elementary institutions and private academies that taught a broader curriculum
and focused on the “teaching of republican virtues” in order to ensure the social and
intellectual growth of the massive population of newly minted Americans, who, upon
leaving school, were expected to play an active role as citizens in a democratic
society (Foner & Garraty, 1991, p. 314). Social reformers such as Horace Mann “saw
education as a means to prevent poverty, establish good work habits, and instill the
American creed in a growing number of children from immigrant families” (Stevens
et al., 2002, p. 123).
To this day, school culture is a microcosm of American citizenship and
democracy in which students are empowered to take greater responsibility for their
educational environment and school safety. When seeking to create a democratic
society, younger generations need to learn the process of self-government and
problem solving. Varnham (2005) suggested that students should be given more
responsibility upon entering secondary school, allowing them to assist in problem
solving and in participating in student safety and school security issues. Student who
contribute to school policymaking develop communication skills that are essential to
success in life, and they acquire self-confidence and learn responsibility and
independence (Varnham, 2005). This type of student empowerment can lead to
improved school policies and practices and can strengthen the democratic processes
60
within the school, not to mention increasing students’ perceptions of their own
safety (Varnham, 2005).
Students need to have meaningful involvement in their schools; school rules
cannot feel like something being forced upon the students. They must accept rules on
the basis of citizenship, values, and participation in society even though secondary
school is a microcosm of the larger American society (Stevens et al., 2002). Stevens
et al. (2002) asserted that students’ opinions need to be heard and valued, as their
participation builds self-esteem and confidence and leads to improved student
behavior. Edmondson et al. (2007) found that students wanted more leadership roles
that could positively impact the safety and security of their schools.
Varnham (2005) claimed that, when students graduate from high school, they
must engage in the democratic process. However, the question is, whether students
are effectively prepared to accept responsibility and to serve a vital role as informed
citizens who make wise and informed decisions and are actively engaged in making
society a better place for all to live. In secondary schools, authoritarian methods of
discipline are perceived by students as punitive, without regard for due process.
Although school officials have the responsibility of maintaining a safe and secure
environment that is free from bullying and negative hostility, research shows that
traditional rule making and disciplinary methods meet with only partial success in
changing the perceptions of students and their safety within schools. Students’
opinions need to be heard and valued; schools should not be perceived as a
dictatorship where the people have no say in the rules. Students need to buy into the
61
rules for reasons of democratic citizenship, values, and eventual participation in
American society.
Summary
This chapter explored the issue of school security—measures that schools can
implement to make campuses more secure and policies designed to transform
students’ perceptions of their safety and security on high school campuses. Varnham
(2005) maintained that, “Upon leaving school, young people are expected to play an
active part as citizens in a democratic society” (p. 53). However, this statement raises
the question, “In what ways are students learning to take responsibility for the safety
of their school environments?” (p. 53). School officials may try to establish security
measures to create a feeling of well-being for students, but optimum safety will not be
achieved without students being taught to take a participatory role in which they
assume direct responsibility for the welfare of their school (Mirsky, 2007).
Disruptive behavior, discipline issues, suspensions, and expulsions are
“among the symptoms of schools which have lost the bonds of respect” and where
fear and violence fester (Mirsky, 2007, p. 5). Educators face major challenges in
transforming school cultures and instilling perceptions of safety and genuine security.
However, by including students in the implementation of safety measures on
secondary school campuses, educators can ensure that research-based programs and
policies will be more productive in reducing the potential for violence.
Chapter II utilized published research to discuss the efficacy of school safety
and security programs and policies in reducing student fears on campus. Chapter III
62
will discuss the methods and procedures designed to carry out the research study,
including: the sample population, instrumentation, hypotheses, alignment of the
research questions, methodology, and the framework for the statistical analysis.
63
CHAPTER III
METHODS AND PROCEDURES
Having been a teacher in Alternative Education in California, and having
experienced numerous incidents of school violence involving gang activity and drug
abuse, this researcher was motivated to conduct this study about student safety on
secondary school campuses. However, due to recent school shootings, such as the
Virginia Tech shootings in 2007, the Sandy Hook Elementary tragedy in 2012, and 19
incidents of school violence involving a firearm in 2014, this researcher expanded the
present study in an effort to discover how school violence impacts students’ fears and
motivations and what students perceive administration can do to help alleviate their
concerns. The purpose of this study was to utilize student ethnicity/race,
socioeconomic status, grade level, and gender to help determine (a) what personal
safety and security fears high school students have on campus; (b) how those specific
fears impact high school students’ academic, social, and physical well-being; and
(c) what specific safety measures high school students perceive increase their feelings
of safety and well-being at school.
Chapter III is divided into five subcategories. The first section provides a
detailed description of the sample population. The second section defines the survey
instrumentation used to collect the data. The third section explains the research
methodology, including procedures for data collection and steps to ensure fidelity
with this researcher’s stated objectives and hypotheses. The fourth section describes
64
the statistical and inferential tests that were used to analyze the data. The fifth
section summarizes the chapter.
Sample Population
According to the California Department of Education (CDE) (2014),
approximately 6,236,672 K–12 students were enrolled in the State’s public schools
during the 2013–2014 school year. Of that number, 1,952,314 students (491,493
freshmen, 484,993 sophomores, 477,425 juniors, and 498,403 seniors) attended 1,305
comprehensive high schools.
Because of the sensitive nature of the subject, this researcher experienced
some difficulty in obtaining permission to conduct a survey of public high school
students regarding school safety and security. After canvassing 16 potential school
districts and 25 possible secondary schools, one superintendent of a rural, unified
school district accepted this researcher’s invitation to participate. Subsequently, the
high school principal was contacted to discuss the details of the study, review the
research protocols, and request a Letter of Consent to conduct this study in the district
(see Appendix A).
The sample population for this study consisted of 1,690 students (447
freshmen, 474 sophomores, 402 juniors, and 367 seniors) who were enrolled in one
high school that served 9th- through 12th-grade students in a rural bedroom
community of the Bay Area in California’s San Joaquin Valley. The student body
represented many diverse ethnic and socioeconomic backgrounds. Responses were
65
obtained from those students whose parents approved of their participation in the
study.
The research school enrolled 1,690 students during the 2013–2014 school
year. According to data retrieved from educational on-line resources, 395 (23.4%) of
the students were English Language Learners (ELLs), and 1,131 (66.9%) of the
students were considered socioeconomically disadvantaged, as defined by
participation in the free or reduced-price lunch program. Ethnically, 275 (16.3%) of
the students were White, 1,141 (67.5%) were Hispanic, 143 (8.5%) were African
American, 12 (0.7%) were Native American, 41 (2.4%) were Asian, 25 (1.5%) were
Pacific Islander, 32 (1.9%) were Filipino, 20 (1.2%) reported two or more races (not
Hispanic), and 1 (.05%) reported None. The school’s 2014 graduation rate was
94.9% (Ed-Data, 2014).
Instrumentation
This researcher developed a survey in two parts. The first part requested
demographic information regarding the students’ ethnicity/race, socioeconomic
status, grade level, and gender. The second part requested that students respond to 97
statements regarding their perception of safety and security at school. The research-
based underpinnings of the survey instrument were aligned with the outcomes,
conclusions, and findings from the following studies, reports, and conference
presentations: Proceedings of Persistently Safe Schools Conference (2007),
Perceptions and Record of Violence in Middle and High School (2008), Youth Risk
66
Behavior Surveillance Report (2012), and the California Healthy Kids Survey
(2013) by West-Ed for the California Department of Education.
This researcher also acquired firsthand knowledge of the subject matter,
having served 8 years as a secondary school administrator who dealt directly with
student discipline and school safety. Additionally, this researcher interviewed
secondary school principals and assistant principals regarding school violence and
student security. The survey instrument was administered to 10 English- and
Spanish-speaking students who represented a sample of the student population, but
were not included in the research study. Their opinions were requested to improve
the readability and clarity of the survey statements. This researcher also submitted
the survey to two fluent Spanish-speaking parents and a Spanish translator to ensure
proper verification of basic grammar, vocabulary and language usage for the Spanish-
language versions of the documents utilized in the research study. Additionally, this
researcher submitted the survey to his university supervisor, his administrative
colleagues, and SROs. After discussion and debate, many of their recommendations
were incorporated into the final survey.
The student-safety survey utilized a five-point Likert-type interval scale
(5 = Strongly Agree, 4 = Agree, 3 = No Opinion, 2 = Disagree, and 1 = Strongly
Disagree) to quantify the respondents’ levels of agreement to 97 statements that were
related to the research hypotheses (see Table 1).
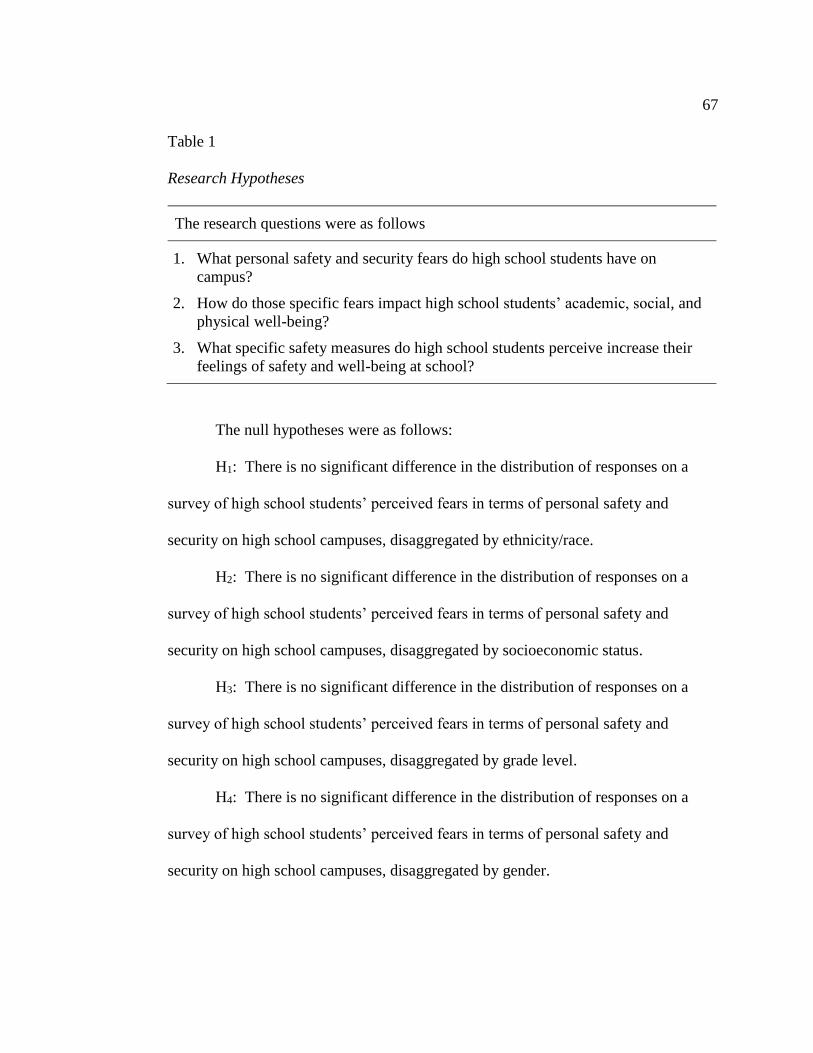
67
Table 1
Research Hypotheses
The research questions were as follows
1. What personal safety and security fears do high school students have on
campus?
2. How do those specific fears impact high school students’ academic, social, and
physical well-being?
3. What specific safety measures do high school students perceive increase their
feelings of safety and well-being at school?
The null hypotheses were as follows:
H1: There is no significant difference in the distribution of responses on a
survey of high school students’ perceived fears in terms of personal safety and
security on high school campuses, disaggregated by ethnicity/race.
H2: There is no significant difference in the distribution of responses on a
survey of high school students’ perceived fears in terms of personal safety and
security on high school campuses, disaggregated by socioeconomic status.
H3: There is no significant difference in the distribution of responses on a
survey of high school students’ perceived fears in terms of personal safety and
security on high school campuses, disaggregated by grade level.
H4: There is no significant difference in the distribution of responses on a
survey of high school students’ perceived fears in terms of personal safety and
security on high school campuses, disaggregated by gender.
68
H5: There is no significant difference in the distribution of responses on a
survey of high school students’ perceptions in terms of how specific fears impact
their academic, social, and physical well-being disaggregated by ethnicity/race.
H6: There is no significant difference in the distribution of responses on a
survey of high school students’ perceptions in terms of how specific fears impact
their academic, social, and physical well-being disaggregated by socioeconomic
status.
H7: There is no significant difference in the distribution of responses on a
survey of high school students’ perceptions in terms of how specific fears impact
their academic, social, and physical well-being disaggregated by grade level.
H8: There is no significant difference in the distribution of responses on a
survey of high school students’ perceptions in terms of how specific fears impact
their academic, social, and physical well-being disaggregated by gender.
H9: There is no significant difference in the distribution of responses on a
survey of high school students’ perceptions in terms of specific safety measures that
are intended to improve their feelings of safety and well-being at school,
disaggregated by ethnicity/race.
H10: There is no significant difference in the distribution of responses on a
survey of high school students’ perceptions in terms of specific safety measures that
are intended to improve their feelings of safety and well-being at school,
disaggregated by socioeconomic status.
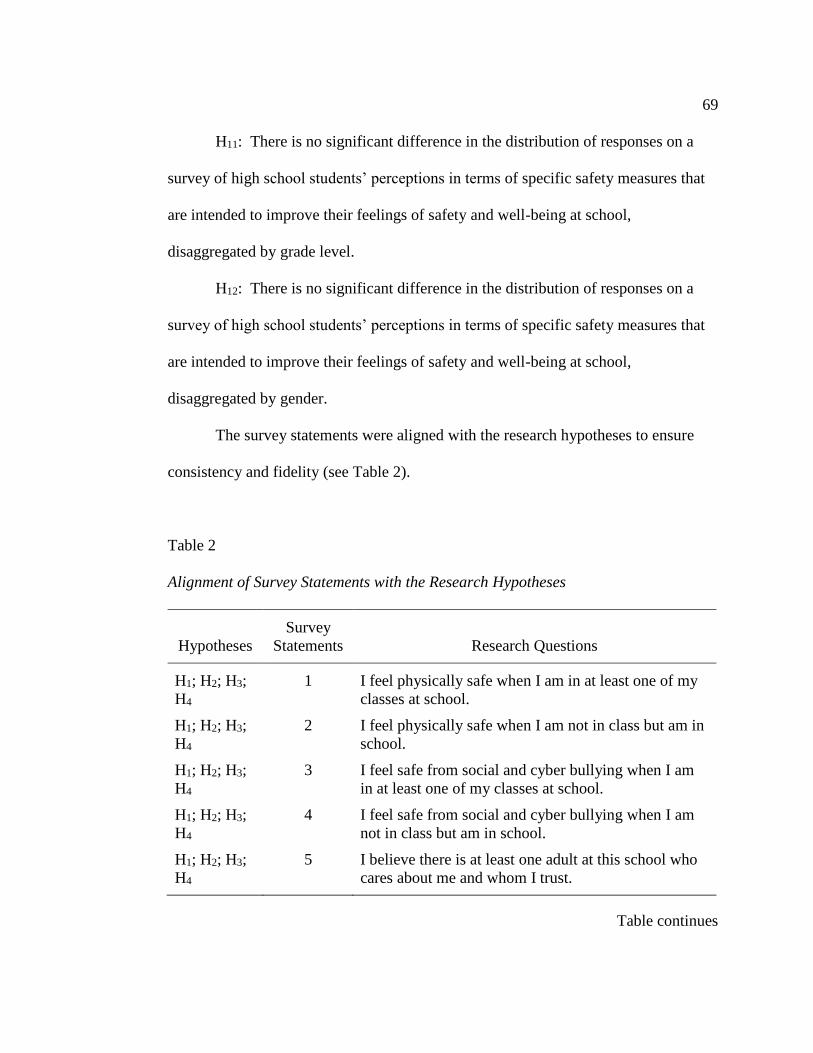
69
H11: There is no significant difference in the distribution of responses on a
survey of high school students’ perceptions in terms of specific safety measures that
are intended to improve their feelings of safety and well-being at school,
disaggregated by grade level.
H12: There is no significant difference in the distribution of responses on a
survey of high school students’ perceptions in terms of specific safety measures that
are intended to improve their feelings of safety and well-being at school,
disaggregated by gender.
The survey statements were aligned with the research hypotheses to ensure
consistency and fidelity (see Table 2).
Table 2
Alignment of Survey Statements with the Research Hypotheses
Hypotheses
Survey
Statements Research Questions
H1; H2; H3;
H4
1 I feel physically safe when I am in at least one of my
classes at school.
H1; H2; H3;
H4
2 I feel physically safe when I am not in class but am in
school.
H1; H2; H3;
H4
3 I feel safe from social and cyber bullying when I am
in at least one of my classes at school.
H1; H2; H3;
H4
4 I feel safe from social and cyber bullying when I am
not in class but am in school.
H1; H2; H3;
H4
5 I believe there is at least one adult at this school who
cares about me and whom I trust.
Table continues
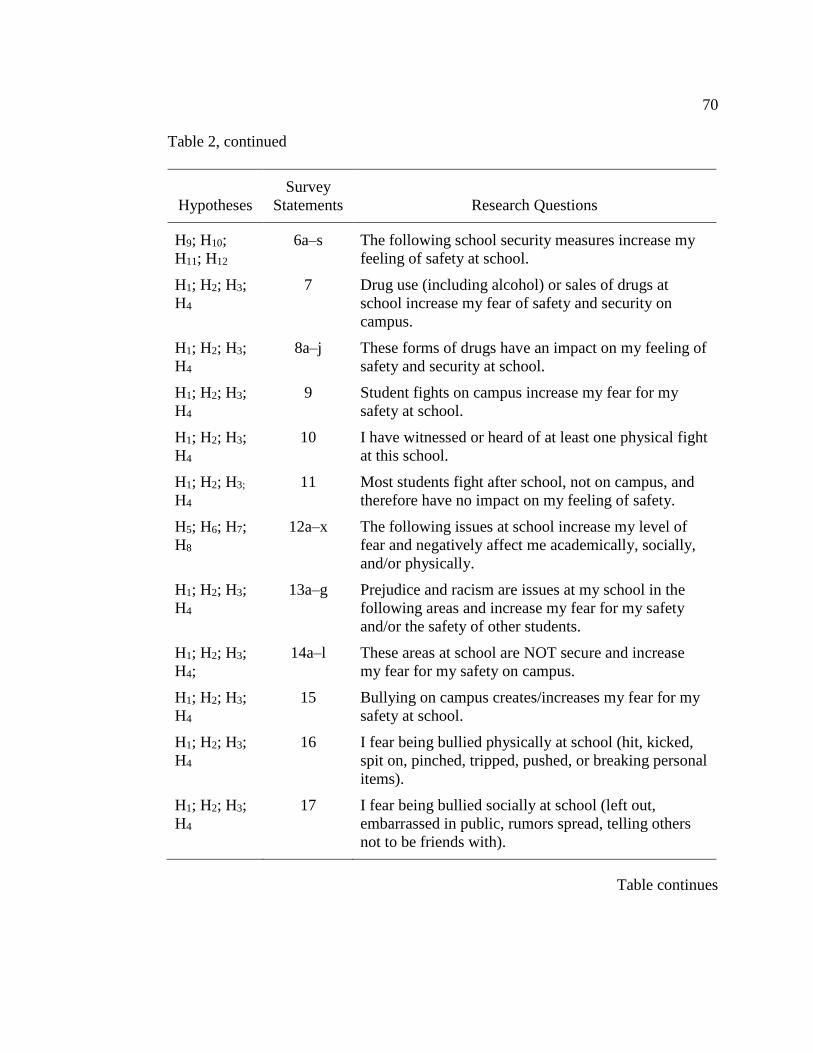
70
Table 2, continued
Hypotheses
Survey
Statements Research Questions
H9; H10;
H11; H12
6a–s The following school security measures increase my
feeling of safety at school.
H1; H2; H3;
H4
7 Drug use (including alcohol) or sales of drugs at
school increase my fear of safety and security on
campus.
H1; H2; H3;
H4
8a–j These forms of drugs have an impact on my feeling of
safety and security at school.
H1; H2; H3;
H4
9 Student fights on campus increase my fear for my
safety at school.
H1; H2; H3;
H4
10 I have witnessed or heard of at least one physical fight
at this school.
H1; H2; H3;
H4
11 Most students fight after school, not on campus, and
therefore have no impact on my feeling of safety.
H5; H6; H7;
H8
12a–x The following issues at school increase my level of
fear and negatively affect me academically, socially,
and/or physically.
H1; H2; H3;
H4
13a–g Prejudice and racism are issues at my school in the
following areas and increase my fear for my safety
and/or the safety of other students.
H1; H2; H3;
H4;
14a–l These areas at school are NOT secure and increase
my fear for my safety on campus.
H1; H2; H3;
H4
15 Bullying on campus creates/increases my fear for my
safety at school.
H1; H2; H3;
H4
16 I fear being bullied physically at school (hit, kicked,
spit on, pinched, tripped, pushed, or breaking personal
items).
H1; H2; H3;
H4
17 I fear being bullied socially at school (left out,
embarrassed in public, rumors spread, telling others
not to be friends with).
Table continues
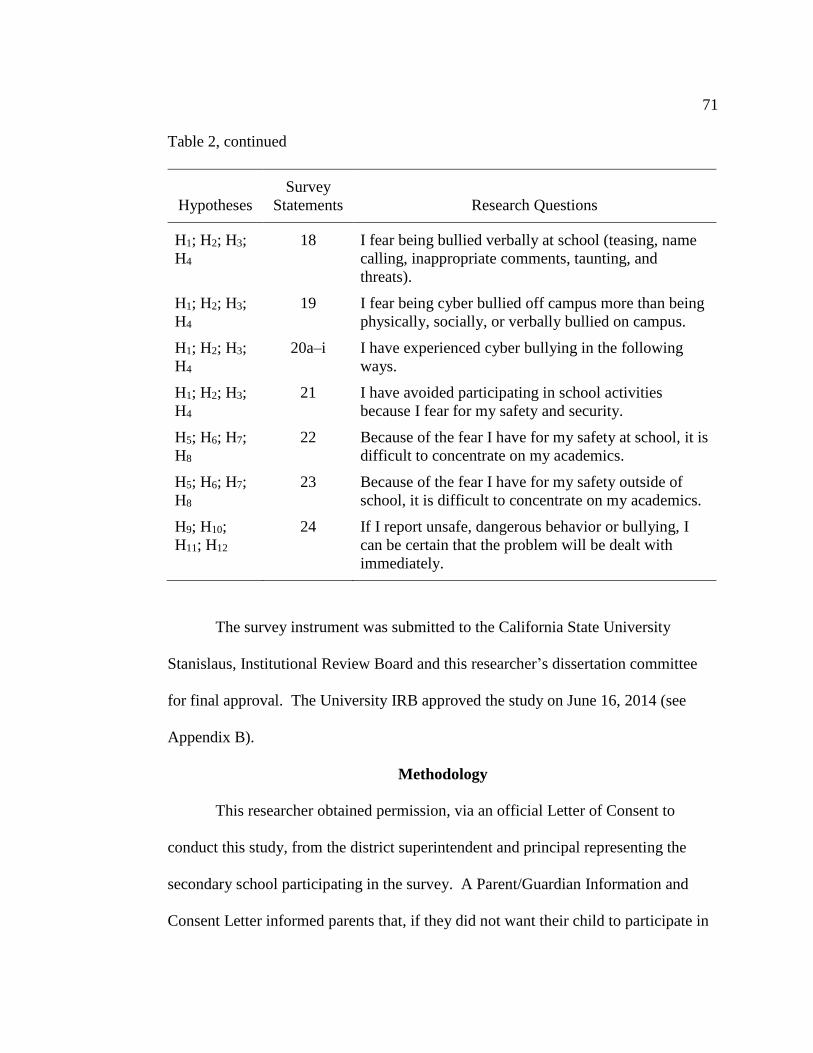
71
Table 2, continued
Hypotheses
Survey
Statements Research Questions
H1; H2; H3;
H4
18 I fear being bullied verbally at school (teasing, name
calling, inappropriate comments, taunting, and
threats).
H1; H2; H3;
H4
19 I fear being cyber bullied off campus more than being
physically, socially, or verbally bullied on campus.
H1; H2; H3;
H4
20a–i I have experienced cyber bullying in the following
ways.
H1; H2; H3;
H4
21 I have avoided participating in school activities
because I fear for my safety and security.
H5; H6; H7;
H8
22 Because of the fear I have for my safety at school, it is
difficult to concentrate on my academics.
H5; H6; H7;
H8
23 Because of the fear I have for my safety outside of
school, it is difficult to concentrate on my academics.
H9; H10;
H11; H12
24 If I report unsafe, dangerous behavior or bullying, I
can be certain that the problem will be dealt with
immediately.
The survey instrument was submitted to the California State University
Stanislaus, Institutional Review Board and this researcher’s dissertation committee
for final approval. The University IRB approved the study on June 16, 2014 (see
Appendix B).
Methodology
This researcher obtained permission, via an official Letter of Consent to
conduct this study, from the district superintendent and principal representing the
secondary school participating in the survey. A Parent/Guardian Information and
Consent Letter informed parents that, if they did not want their child to participate in
72
the survey, all materials could be discarded without penalty, and no further action
was necessary on their part. Since 16.3% of the students were identified as White and
67.5% Hispanic, the Parent Information and Consent Letter and the Student Safety
Survey were provided in both English and Spanish (see Appendices C, D, E, and F).
This researcher, in working with the principal, believed that, given the number
of State tests and benchmark assessments are administered to students throughout the
school year, it would be unwise to conduct the survey during class time. Therefore,
to avoid interrupting instruction, the survey was sent home for the students to
complete on their own time.
This researcher was physically present on campus to supervise the
distribution, collection, and re-distribution (as needed) of survey materials. During
the last instructional period of the designated day for distribution, this researcher and
his team provided each teacher with a large manila envelope containing
(a) Parent/Guardian Information and Consent Letters; (b) Student Safety Surveys; and
(c) letter-sized envelopes for the return of the Parent/Guardian Information and
Consent Form and the completed Student Safety Survey to this researcher. In
addition, teachers were requested to read aloud a brief Information Statement to
students regarding the critical importance of the survey in terms of improved school
safety and to encourage its prompt return. A copy of this statement, in both Spanish
and English, was attached to the survey materials that were sent home to parents (see
Appendices G and H).
73
To protect the anonymity of the students who participated in the survey,
they were asked to seal their responses in the envelope provided with each packet by
this researcher. Students were allocated 1 day to return the Parent/Guardian Consent
Form and the completed Student Safety Survey to this researcher.
Student Incentive to Participate
Every student at the participating school was offered an incentive to
participate in the survey. Those students who returned the signed Parent/Guardian
Information and Consent Letter and the completed Student Safety Survey in the
sealed envelope to this researcher were given a raffle ticket to win one of 25 $20 gift
cards to Starbucks, Taco Bell, iTunes, Subway, Burger King, Google Play, and other
restaurants and stores.
This researcher was physically present on campus for 3 days and a total of
three separate distributions were carried out. The goal of this researcher was three
fold: (a) to ensure that the Parent/Guardian Information and Consent Forms and the
Student Safety Surveys were distributed to the teachers and sent home with the
students; (b) to collect the completed surveys in the sealed envelopes from the
students each day and provide the students with a raffle ticket; and (c) to determine if
a second distribution of survey materials was necessary to ensure a robust return rate.
All survey materials returned by the students were kept in a secure location and
destroyed after the completion of the present study.
74
Data Analysis
Statistical Analysis
This researcher disaggregated the students’ survey responses by demographic
category (ethnicity/race, socioeconomic status, grade level, and gender) and uploaded
these data into the Statistical Package for Social Sciences (SPSS). The data were
analyzed by using the Chi-Square Test for Independence to determine if there was a
significant difference in the distribution of responses between cohorts (for example,
male and female students in the gender demographic category, and White and
Hispanic students in the ethnicity/race category). An alpha of .05 was selected to
determine significance.
Descriptive Analysis
A descriptive analysis was conducted using frequencies and percentages to
illustrate the numerical relationship between response cells for each survey statement.
Notable responses were identified when >67% or more of both cohorts responded in a
like manner to any survey question.
Summary
Chapter III presented the research methodology employed in this study,
including a description of the sample populations. This researcher also described the
instrumentation, methodologies, and statistical and descriptive analyses. Chapter IV
will present the findings and results of the research and will address the hypotheses
and objective of this study.
75
CHAPTER IV
RESULTS
The purpose of this study was to analyze secondary school students’ perceived
fears and specific measures they believed would ameliorate their fears and improve
school-wide safety. Chapter IV will provide the findings generated by the statistical
and descriptive analyses of the Student Safety Survey. The survey statements were
aligned to the following research questions:
1. What personal safety and security fears do high school students have on campus?
2. How do those specific fears impact high school students’ academic, emotional,
and physical well-being?
3. What specific safety measures do high school students perceive increase their
feelings of safety and well-being at school?
This chapter is organized into five sections: (a) demographic information, (b) data
organization, (c) statistical and descriptive analyses, (d) findings, and (e) summary.
Demographic Information
The sample population consisted of 269 secondary school students in grades 9
to 12 who were enrolled in a rural high school in California’s San Joaquin Valley.
Responses were gathered to evaluate students’ perceptions of safety and security on a
high school campus as it related to four demographic categories: ethnicity/race,
socioeconomic status, grade level, and gender (see Tables 3–6).
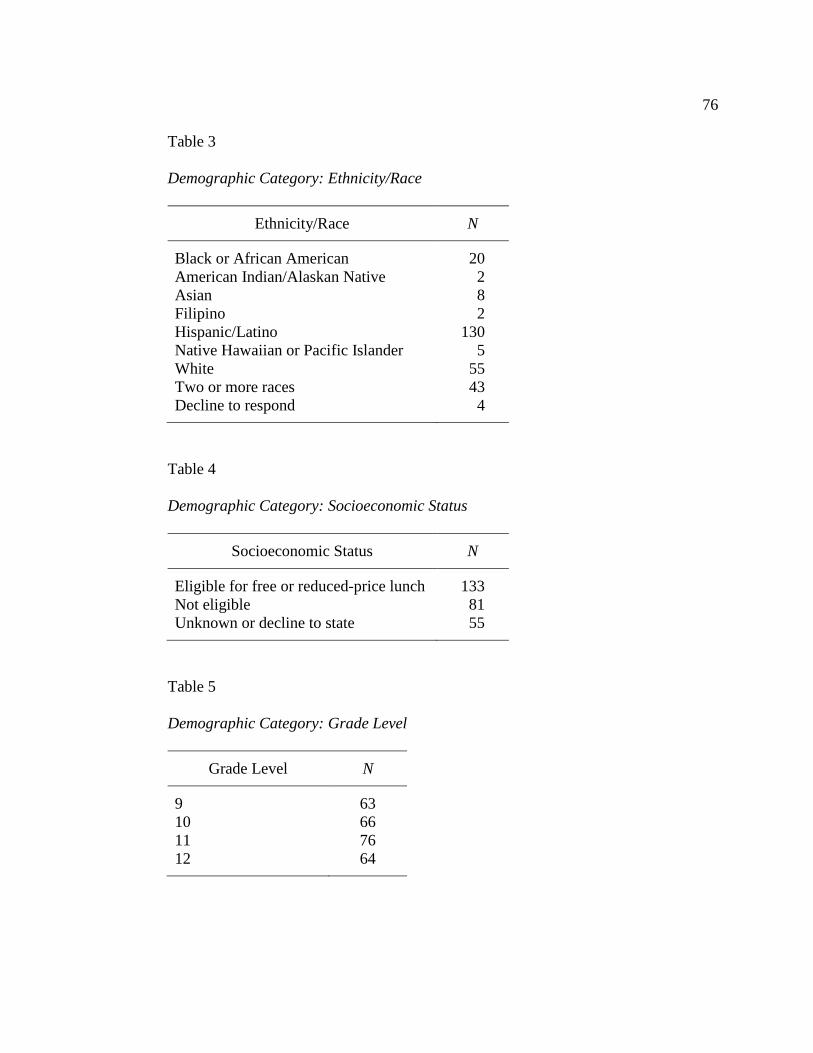
76
Table 3
Demographic Category: Ethnicity/Race
Ethnicity/Race N
Black or African American 20
American Indian/Alaskan Native 2
Asian 8
Filipino 2
Hispanic/Latino 130
Native Hawaiian or Pacific Islander 5
White 55
Two or more races 43
Decline to respond 4
Table 4
Demographic Category: Socioeconomic Status
Socioeconomic Status N
Eligible for free or reduced-price lunch 133
Not eligible 81
Unknown or decline to state 55
Table 5
Demographic Category: Grade Level
Grade Level N
9 63
10 66
11 76
12 64
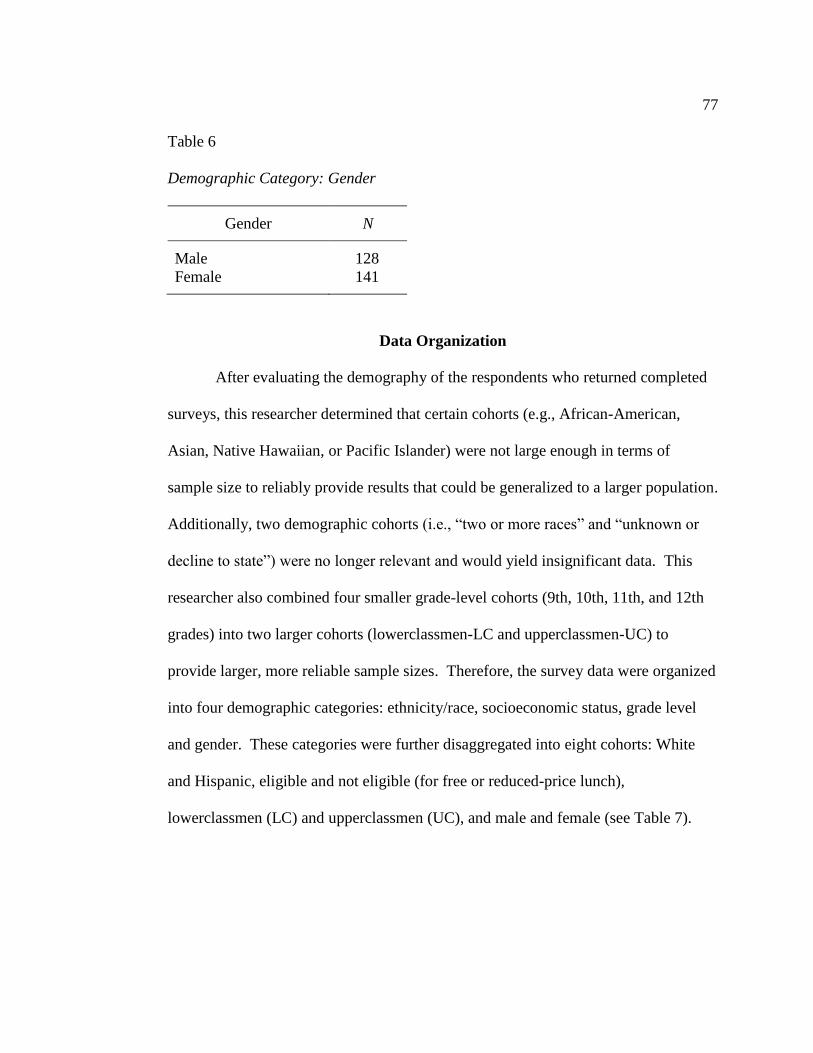
77
Table 6
Demographic Category: Gender
Gender N
Male 128
Female 141
Data Organization
After evaluating the demography of the respondents who returned completed
surveys, this researcher determined that certain cohorts (e.g., African-American,
Asian, Native Hawaiian, or Pacific Islander) were not large enough in terms of
sample size to reliably provide results that could be generalized to a larger population.
Additionally, two demographic cohorts (i.e., “two or more races” and “unknown or
decline to state”) were no longer relevant and would yield insignificant data. This
researcher also combined four smaller grade-level cohorts (9th, 10th, 11th, and 12th
grades) into two larger cohorts (lowerclassmen-LC and upperclassmen-UC) to
provide larger, more reliable sample sizes. Therefore, the survey data were organized
into four demographic categories: ethnicity/race, socioeconomic status, grade level
and gender. These categories were further disaggregated into eight cohorts: White
and Hispanic, eligible and not eligible (for free or reduced-price lunch),
lowerclassmen (LC) and upperclassmen (UC), and male and female (see Table 7).
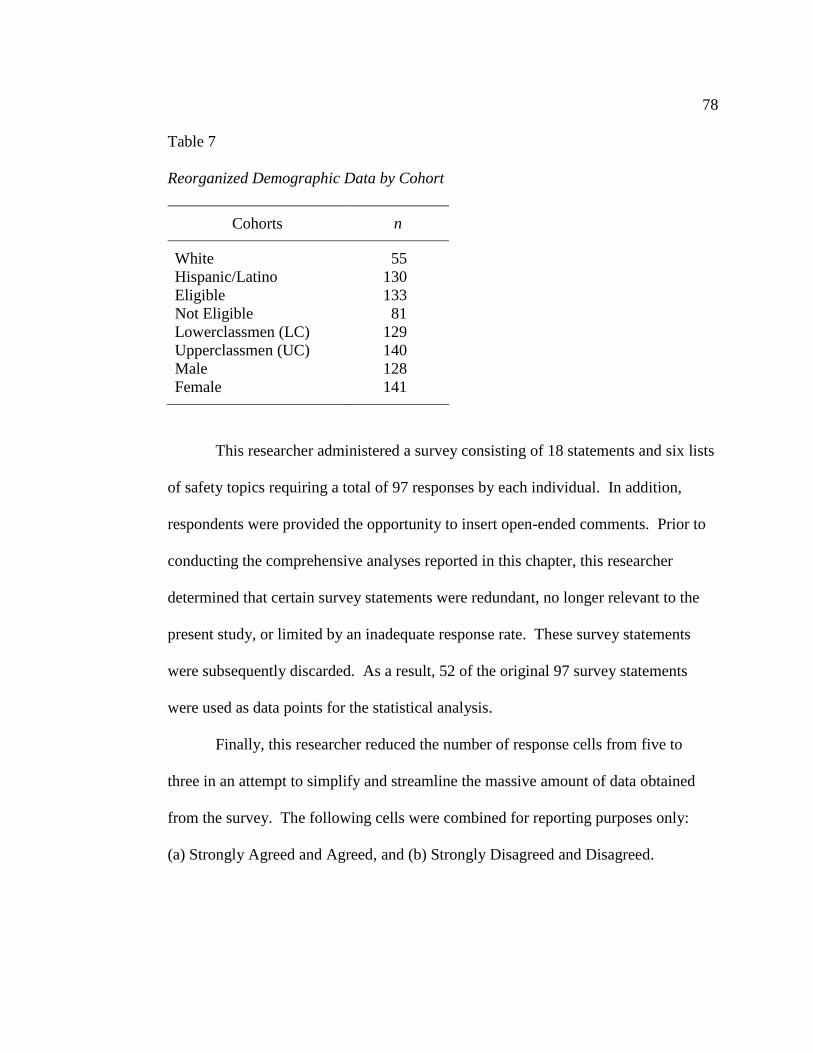
78
Table 7
Reorganized Demographic Data by Cohort
Cohorts n
White 55
Hispanic/Latino 130
Eligible 133
Not Eligible 81
Lowerclassmen (LC) 129
Upperclassmen (UC) 140
Male 128
Female 141
This researcher administered a survey consisting of 18 statements and six lists
of safety topics requiring a total of 97 responses by each individual. In addition,
respondents were provided the opportunity to insert open-ended comments. Prior to
conducting the comprehensive analyses reported in this chapter, this researcher
determined that certain survey statements were redundant, no longer relevant to the
present study, or limited by an inadequate response rate. These survey statements
were subsequently discarded. As a result, 52 of the original 97 survey statements
were used as data points for the statistical analysis.
Finally, this researcher reduced the number of response cells from five to
three in an attempt to simplify and streamline the massive amount of data obtained
from the survey. The following cells were combined for reporting purposes only:
(a) Strongly Agreed and Agreed, and (b) Strongly Disagreed and Disagreed.
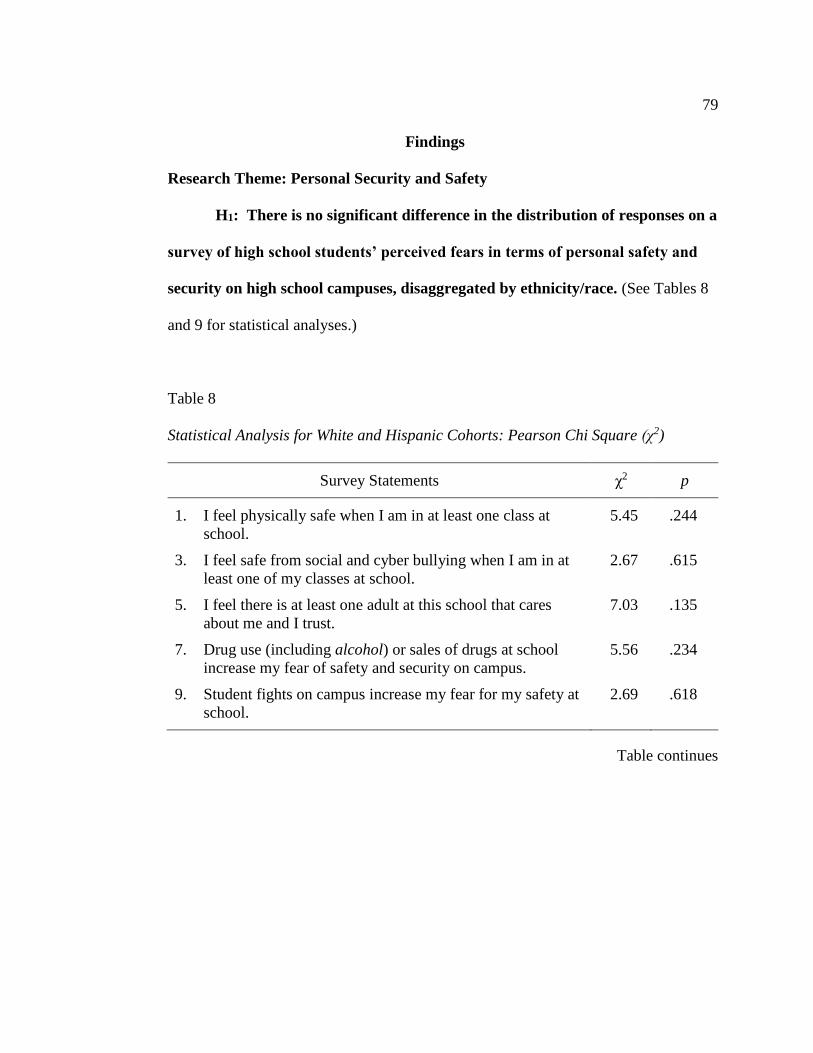
79
Findings
Research Theme: Personal Security and Safety
H1: There is no significant difference in the distribution of responses on a
survey of high school students’ perceived fears in terms of personal safety and
security on high school campuses, disaggregated by ethnicity/race. (See Tables 8
and 9 for statistical analyses.)
Table 8
Statistical Analysis for White and Hispanic Cohorts: Pearson Chi Square (χ2)
Survey Statements χ2 p
1. I feel physically safe when I am in at least one class at
school.
5.45 .244
3. I feel safe from social and cyber bullying when I am in at
least one of my classes at school.
2.67 .615
5. I feel there is at least one adult at this school that cares
about me and I trust.
7.03 .135
7. Drug use (including alcohol) or sales of drugs at school
increase my fear of safety and security on campus.
5.56 .234
9. Student fights on campus increase my fear for my safety at
school.
2.69 .618
Table continues
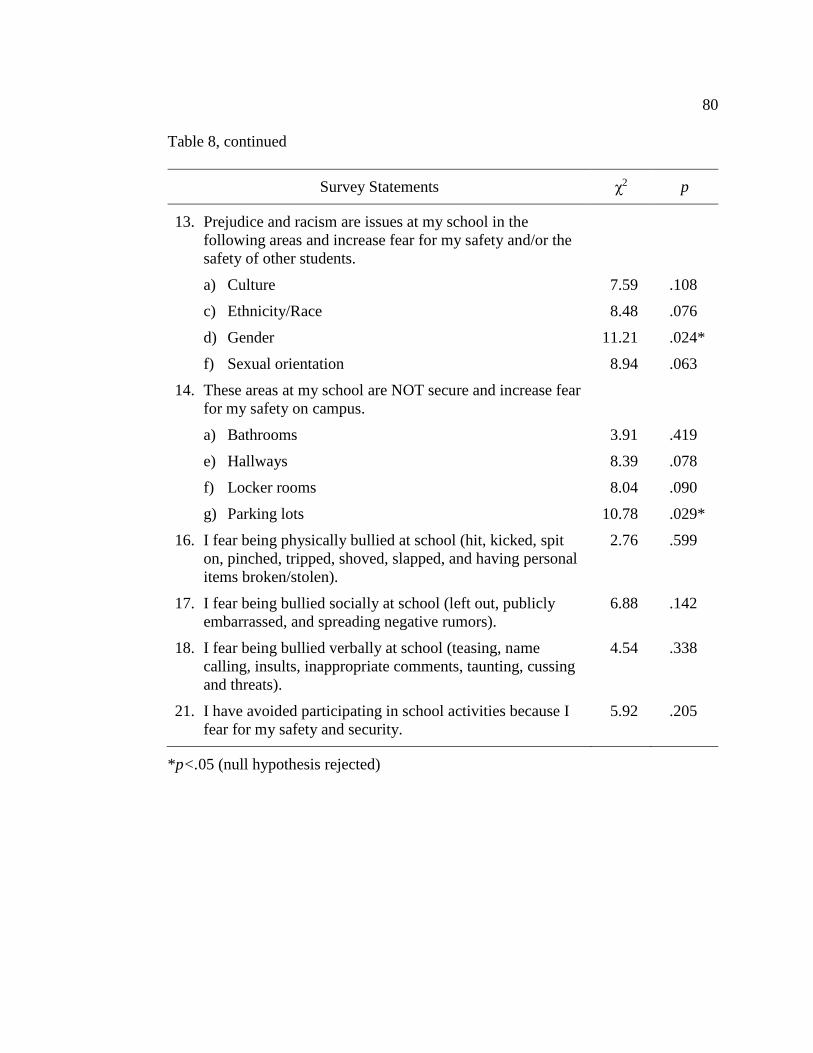
80
Table 8, continued
Survey Statements χ2 p
13. Prejudice and racism are issues at my school in the
following areas and increase fear for my safety and/or the
safety of other students.
a) Culture 7.59 .108
c) Ethnicity/Race 8.48 .076
d) Gender 11.21 .024*
f) Sexual orientation 8.94 .063
14. These areas at my school are NOT secure and increase fear
for my safety on campus.
a) Bathrooms 3.91 .419
e) Hallways 8.39 .078
f) Locker rooms 8.04 .090
g) Parking lots 10.78 .029*
16. I fear being physically bullied at school (hit, kicked, spit
on, pinched, tripped, shoved, slapped, and having personal
items broken/stolen).
2.76 .599
17. I fear being bullied socially at school (left out, publicly
embarrassed, and spreading negative rumors).
6.88 .142
18. I fear being bullied verbally at school (teasing, name
calling, insults, inappropriate comments, taunting, cussing
and threats).
4.54 .338
21. I have avoided participating in school activities because I
fear for my safety and security.
5.92 .205
*p<.05 (null hypothesis rejected)
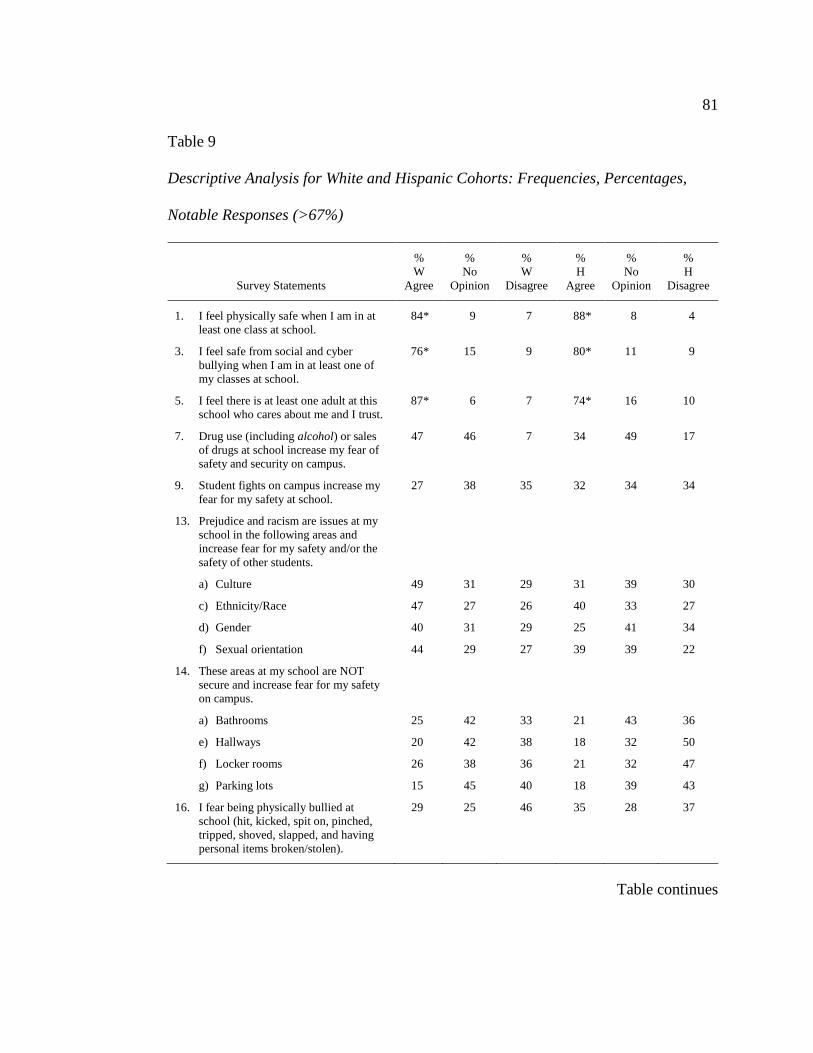
81
Table 9
Descriptive Analysis for White and Hispanic Cohorts: Frequencies, Percentages,
Notable Responses (>67%)
Survey Statements
%
W
Agree
%
No
Opinion
%
W
Disagree
%
H
Agree
%
No
Opinion
%
H
Disagree
1. I feel physically safe when I am in at
least one class at school.
84* 9 7 88* 8 4
3. I feel safe from social and cyber
bullying when I am in at least one of
my classes at school.
76* 15 9 80* 11 9
5. I feel there is at least one adult at this
school who cares about me and I trust.
87* 6 7 74* 16 10
7. Drug use (including alcohol) or sales
of drugs at school increase my fear of
safety and security on campus.
47 46 7 34 49 17
9. Student fights on campus increase my
fear for my safety at school.
27 38 35 32 34 34
13. Prejudice and racism are issues at my
school in the following areas and
increase fear for my safety and/or the
safety of other students.
a) Culture 49 31 29 31 39 30
c) Ethnicity/Race 47 27 26 40 33 27
d) Gender 40 31 29 25 41 34
f) Sexual orientation 44 29 27 39 39 22
14. These areas at my school are NOT
secure and increase fear for my safety
on campus.
a) Bathrooms 25 42 33 21 43 36
e) Hallways 20 42 38 18 32 50
f) Locker rooms 26 38 36 21 32 47
g) Parking lots 15 45 40 18 39 43
16. I fear being physically bullied at
school (hit, kicked, spit on, pinched,
tripped, shoved, slapped, and having
personal items broken/stolen).
29 25 46 35 28 37
Table continues
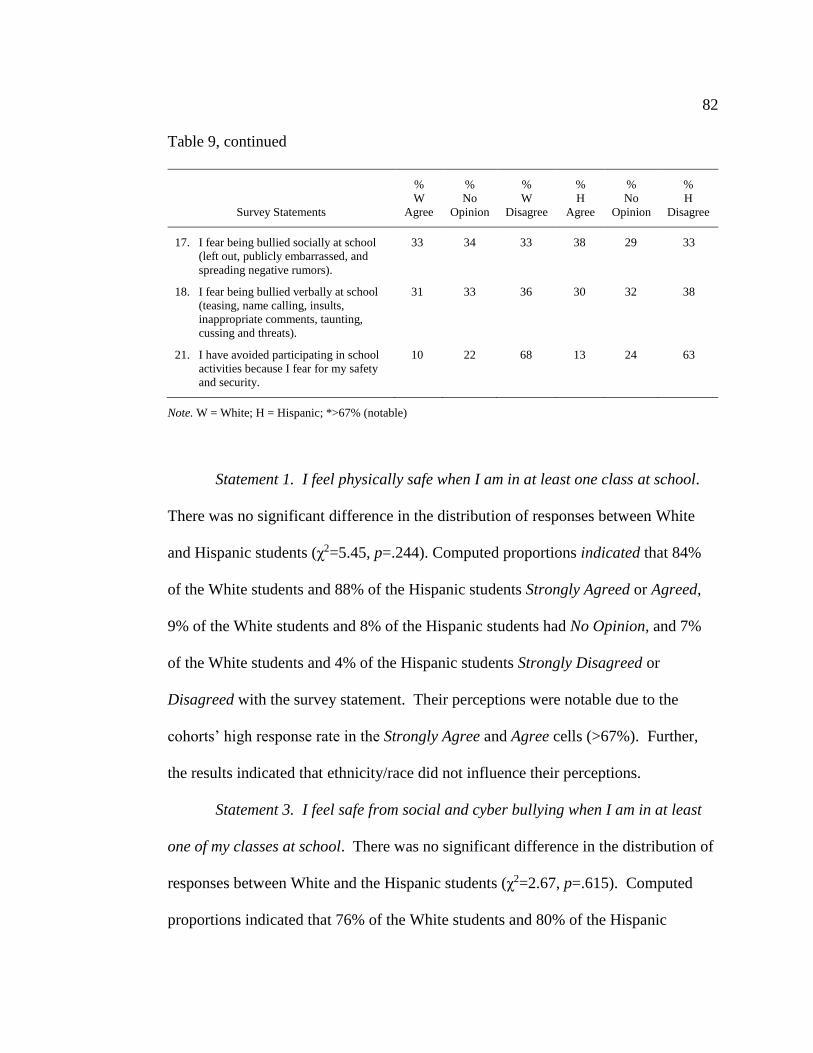
82
Table 9, continued
Survey Statements
%
W
Agree
%
No
Opinion
%
W
Disagree
%
H
Agree
%
No
Opinion
%
H
Disagree
17. I fear being bullied socially at school
(left out, publicly embarrassed, and
spreading negative rumors).
33 34 33 38 29 33
18. I fear being bullied verbally at school
(teasing, name calling, insults,
inappropriate comments, taunting,
cussing and threats).
31 33 36 30 32 38
21. I have avoided participating in school
activities because I fear for my safety
and security.
10 22 68 13 24 63
Note. W = White; H = Hispanic; *>67% (notable)
Statement 1. I feel physically safe when I am in at least one class at school.
There was no significant difference in the distribution of responses between White
and Hispanic students (χ2=5.45, p=.244). Computed proportions indicated that 84%
of the White students and 88% of the Hispanic students Strongly Agreed or Agreed,
9% of the White students and 8% of the Hispanic students had No Opinion, and 7%
of the White students and 4% of the Hispanic students Strongly Disagreed or
Disagreed with the survey statement. Their perceptions were notable due to the
cohorts’ high response rate in the Strongly Agree and Agree cells (>67%). Further,
the results indicated that ethnicity/race did not influence their perceptions.
Statement 3. I feel safe from social and cyber bullying when I am in at least
one of my classes at school. There was no significant difference in the distribution of
responses between White and the Hispanic students (χ2=2.67, p=.615). Computed
proportions indicated that 76% of the White students and 80% of the Hispanic
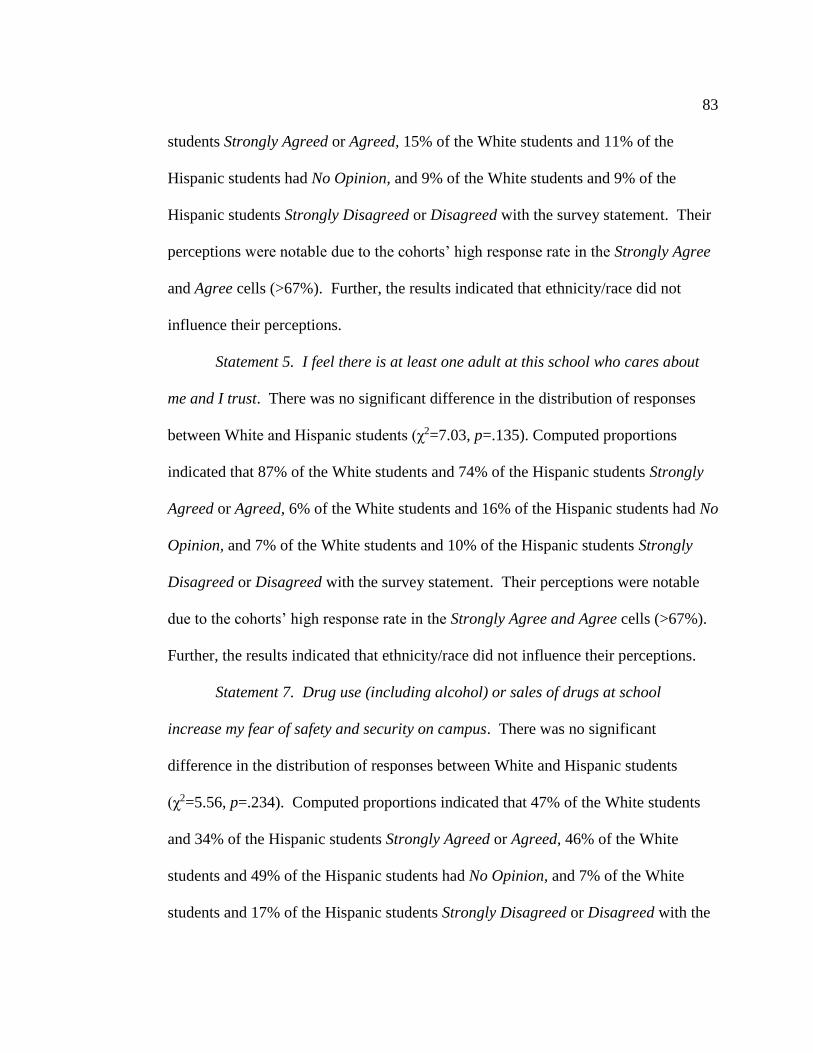
83
students Strongly Agreed or Agreed, 15% of the White students and 11% of the
Hispanic students had No Opinion, and 9% of the White students and 9% of the
Hispanic students Strongly Disagreed or Disagreed with the survey statement. Their
perceptions were notable due to the cohorts’ high response rate in the Strongly Agree
and Agree cells (>67%). Further, the results indicated that ethnicity/race did not
influence their perceptions.
Statement 5. I feel there is at least one adult at this school who cares about
me and I trust. There was no significant difference in the distribution of responses
between White and Hispanic students (χ2=7.03, p=.135). Computed proportions
indicated that 87% of the White students and 74% of the Hispanic students Strongly
Agreed or Agreed, 6% of the White students and 16% of the Hispanic students had No
Opinion, and 7% of the White students and 10% of the Hispanic students Strongly
Disagreed or Disagreed with the survey statement. Their perceptions were notable
due to the cohorts’ high response rate in the Strongly Agree and Agree cells (>67%).
Further, the results indicated that ethnicity/race did not influence their perceptions.
Statement 7. Drug use (including alcohol) or sales of drugs at school
increase my fear of safety and security on campus. There was no significant
difference in the distribution of responses between White and Hispanic students
(χ2=5.56, p=.234). Computed proportions indicated that 47% of the White students
and 34% of the Hispanic students Strongly Agreed or Agreed, 46% of the White
students and 49% of the Hispanic students had No Opinion, and 7% of the White
students and 17% of the Hispanic students Strongly Disagreed or Disagreed with the
84
survey statement. Therefore, White and Hispanic students’ perceptions were
inconclusive and not statistically significant. Further, the results indicated that
ethnicity/race did not influence their perceptions.
Statement 9. Student fights on campus increase my fear for my safety at
school. There was no significant difference in the distribution of responses between
White and Hispanic students (χ2=2.69, p=.618). Computed proportions indicated that
27% of the White students and 32% of the Hispanic students Strongly Agreed or
Agreed, 38% of the White students and 34% of Hispanic students had No Opinion,
and 35% of the White students and 34% of the Hispanic students Strongly Disagreed
or Disagreed with the survey statement. Therefore, White and Hispanic students’
perceptions were inconclusive and not statistically significant. Further, the results
indicated that ethnicity/race did not influence their perceptions.
Statement 13. Prejudice and racism are issues at my school in the following
areas and increase fear for my safety and/or the safety of other students.
Statement 13(a) Culture. There was no significant difference in the
distribution of responses between White and Hispanic students (χ2=7.59, p=.108).
Computed proportions indicated that 40% of the White students and 31% of the
Hispanic students Strongly Agreed or Agreed, 31% of the White students and 39% of
the Hispanic students had No Opinion, and 29% of the White students and 30% of the
Hispanic students Strongly Disagreed or Disagreed with the survey statement.
Therefore, the White and Hispanic students’ perceptions were inconclusive and not
85
statistically significant. Further, the results indicated that ethnicity/race did not
influence their perceptions.
Statement 13(c) Ethnicity/Race. There was no significant difference in the
distribution of responses between White and Hispanic students (χ2=8.48, p=.076).
Computed proportions indicated that 47% of the White students and 40% of the
Hispanic students Strongly Agreed or Agreed, 27% of the White students and 33% of
Hispanic students had No Opinion, and 26% of the White students and 27% of the
Hispanic students Strongly Disagreed or Disagreed with the survey statement.
Therefore, the White and Hispanic students’ perceptions were inconclusive and not
statistically significant. Further, the results indicated that ethnicity/race did not
influence their perceptions.
Statement 13(d) Gender. There was a significant difference in the distribution
of responses between White and Hispanic students (χ2=11.21, p=.024). Computed
proportions indicated that 40% of the White students and 25% of the Hispanic
students Strongly Agreed or Agreed, 31% of the White students and 41% of the
Hispanic students had No Opinion, and 29% of the White students and 34% of the
Hispanic students Strongly Disagreed or Disagreed with the survey statement.
Therefore, the White and Hispanic students’ perceptions were significantly different.
Further, the results indicated that ethnicity/race did influence their perceptions.
Statement 13(f) Sexual orientation. There was no significant difference in the
distribution of responses between White and Hispanic students (χ2=8.94, p=.063).
Computed proportions indicated that 44% of the White students and 39% of the
86
Hispanic students Strongly Agreed or Agreed, 29% of the White students and 39%
of the Hispanic students had No Opinion, and 27% of the White students and 22% of
the Hispanic students Strongly Disagreed or Disagreed with the survey statement.
Therefore, the White and Hispanic students’ perceptions were inconclusive and not
statistically significant. Further, the results indicated that ethnicity/race did not
influence their perceptions.
Statement 14. These areas at my school are NOT secure and increase fear for
my safety on campus.
Statement 14(a) Bathrooms. There was no significant difference in the
distribution of responses between White and Hispanic students (χ2=3.91, p=.419).
Computed proportions indicated that 25% of the White students and 21% of the
Hispanic students Strongly Agreed or Agreed, 42% of the White students and 43% of
the Hispanic students had No Opinion, and 33% of the White students and 36% of the
Hispanic students Strongly Disagreed or Disagreed with the survey statement.
Therefore, the White and Hispanic students’ perceptions were inconclusive and not
statistically significant. Further, the results indicated that ethnicity/race did not
influence their perceptions.
Statement 14(e) Hallways. There was no significant difference in the
distribution of responses between White and Hispanic students (χ2=8.39, p=.078).
Computed proportions indicated that 20% of the White students and 18% of the
Hispanic students Strongly Agreed or Agreed, 42% of the White students and 32% of
the Hispanic students had No Opinion, and 38% of the White students and 50% of the
87
Hispanic students Strongly Disagreed or Disagreed with the survey statement.
Therefore, the White and Hispanic students’ perceptions were inconclusive and not
statistically significant. Further, the results indicated that ethnicity/race did not
influence their perceptions.
Statement 14(f) Locker rooms. There was no significant difference in the
distribution of responses between White and Hispanic students (χ2=8.04, p=.090).
Computed proportions indicated that 26% of the White students and 21% of the
Hispanic students Strongly Agreed or Agreed, 38% of the White students and 32% of
the Hispanic students had No Opinion, and 36% of the White students and 47% of the
Hispanic students Strongly Disagreed or Disagreed with the survey statement.
Therefore, the White and Hispanic students’ perceptions were inconclusive and not
statistically significant. Further, the results indicated that ethnicity/race did not
influence their perceptions.
Statement 14(g) Parking lots. There was a significant difference in the
distribution of responses between White and Hispanic students (χ2=10.78, p=.029).
Computed proportions indicated that 15% of the White students and 18% of the
Hispanic students Strongly Agreed or Agreed, 45% of the White students and 39% of
the Hispanic students had No Opinion, and 40% of the White students and 43% of the
Hispanic students Strongly Disagreed or Disagreed with the survey statement. The
descriptive data illustrates a response pattern of agreement when, in fact, there was
statistical disagreement between the cohorts. Due to the convenience of combining
the number of cells from five to three for descriptive purposes, an important statistical
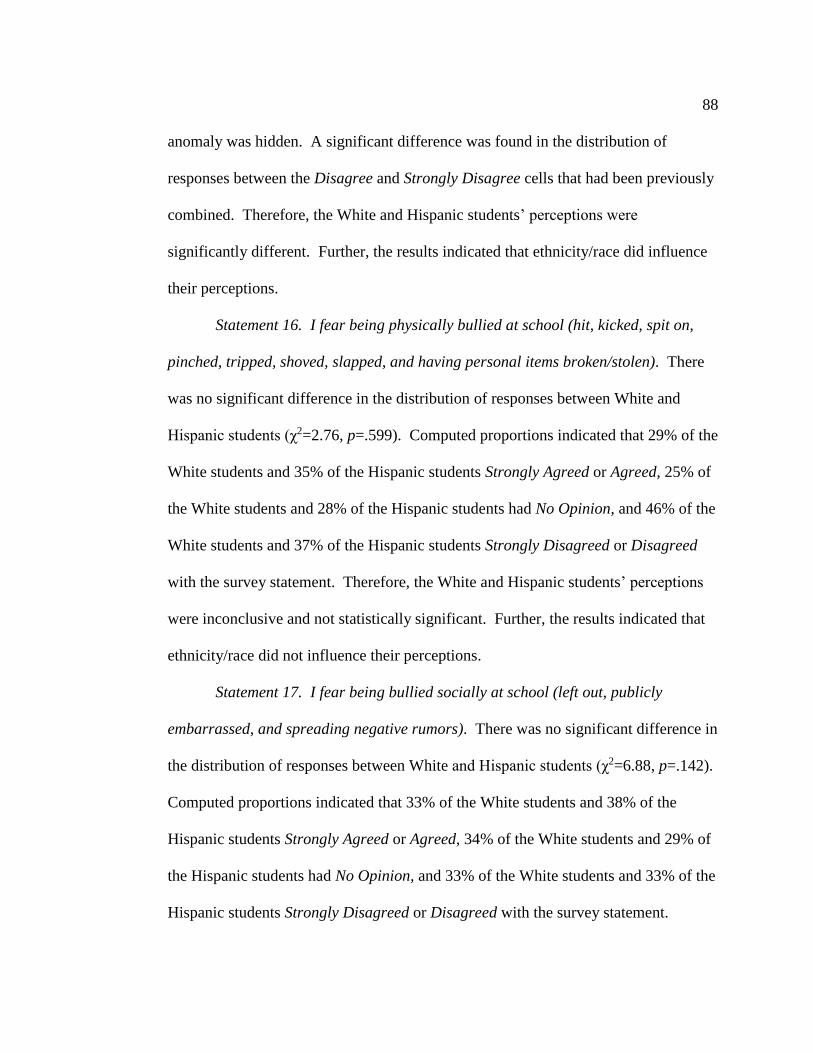
88
anomaly was hidden. A significant difference was found in the distribution of
responses between the Disagree and Strongly Disagree cells that had been previously
combined. Therefore, the White and Hispanic students’ perceptions were
significantly different. Further, the results indicated that ethnicity/race did influence
their perceptions.
Statement 16. I fear being physically bullied at school (hit, kicked, spit on,
pinched, tripped, shoved, slapped, and having personal items broken/stolen). There
was no significant difference in the distribution of responses between White and
Hispanic students (χ2=2.76, p=.599). Computed proportions indicated that 29% of the
White students and 35% of the Hispanic students Strongly Agreed or Agreed, 25% of
the White students and 28% of the Hispanic students had No Opinion, and 46% of the
White students and 37% of the Hispanic students Strongly Disagreed or Disagreed
with the survey statement. Therefore, the White and Hispanic students’ perceptions
were inconclusive and not statistically significant. Further, the results indicated that
ethnicity/race did not influence their perceptions.
Statement 17. I fear being bullied socially at school (left out, publicly
embarrassed, and spreading negative rumors). There was no significant difference in
the distribution of responses between White and Hispanic students (χ2=6.88, p=.142).
Computed proportions indicated that 33% of the White students and 38% of the
Hispanic students Strongly Agreed or Agreed, 34% of the White students and 29% of
the Hispanic students had No Opinion, and 33% of the White students and 33% of the
Hispanic students Strongly Disagreed or Disagreed with the survey statement.
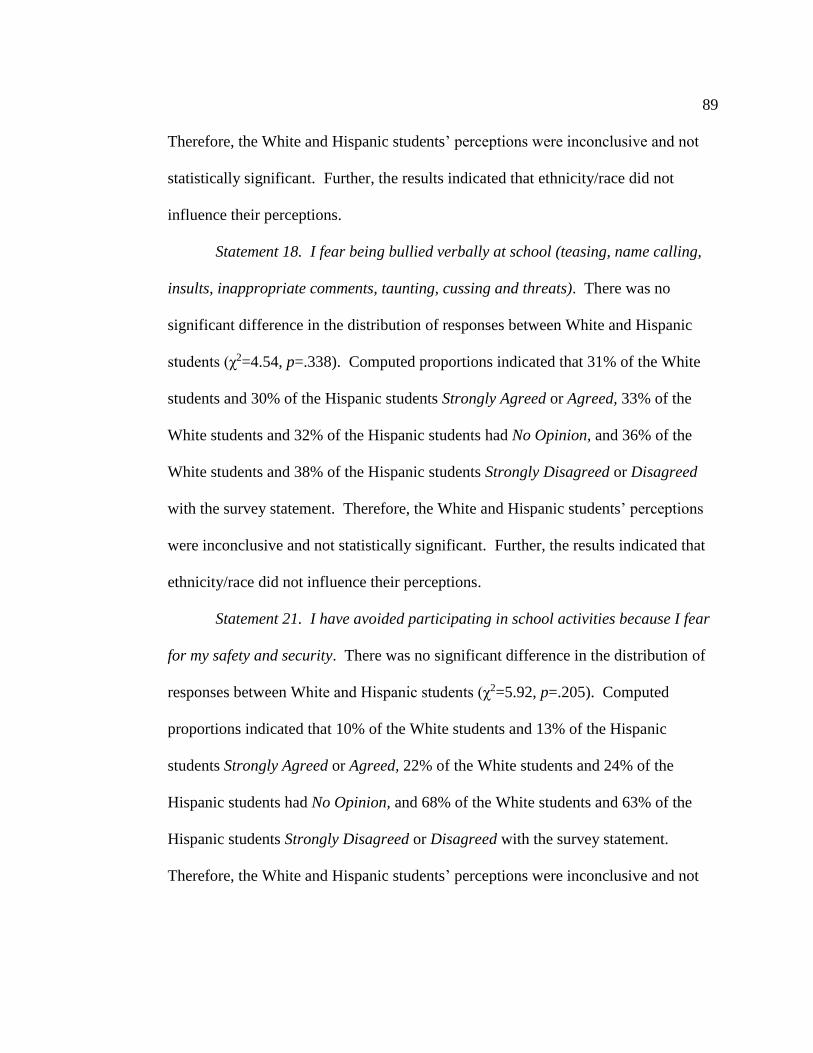
89
Therefore, the White and Hispanic students’ perceptions were inconclusive and not
statistically significant. Further, the results indicated that ethnicity/race did not
influence their perceptions.
Statement 18. I fear being bullied verbally at school (teasing, name calling,
insults, inappropriate comments, taunting, cussing and threats). There was no
significant difference in the distribution of responses between White and Hispanic
students (χ2=4.54, p=.338). Computed proportions indicated that 31% of the White
students and 30% of the Hispanic students Strongly Agreed or Agreed, 33% of the
White students and 32% of the Hispanic students had No Opinion, and 36% of the
White students and 38% of the Hispanic students Strongly Disagreed or Disagreed
with the survey statement. Therefore, the White and Hispanic students’ perceptions
were inconclusive and not statistically significant. Further, the results indicated that
ethnicity/race did not influence their perceptions.
Statement 21. I have avoided participating in school activities because I fear
for my safety and security. There was no significant difference in the distribution of
responses between White and Hispanic students (χ2=5.92, p=.205). Computed
proportions indicated that 10% of the White students and 13% of the Hispanic
students Strongly Agreed or Agreed, 22% of the White students and 24% of the
Hispanic students had No Opinion, and 68% of the White students and 63% of the
Hispanic students Strongly Disagreed or Disagreed with the survey statement.
Therefore, the White and Hispanic students’ perceptions were inconclusive and not
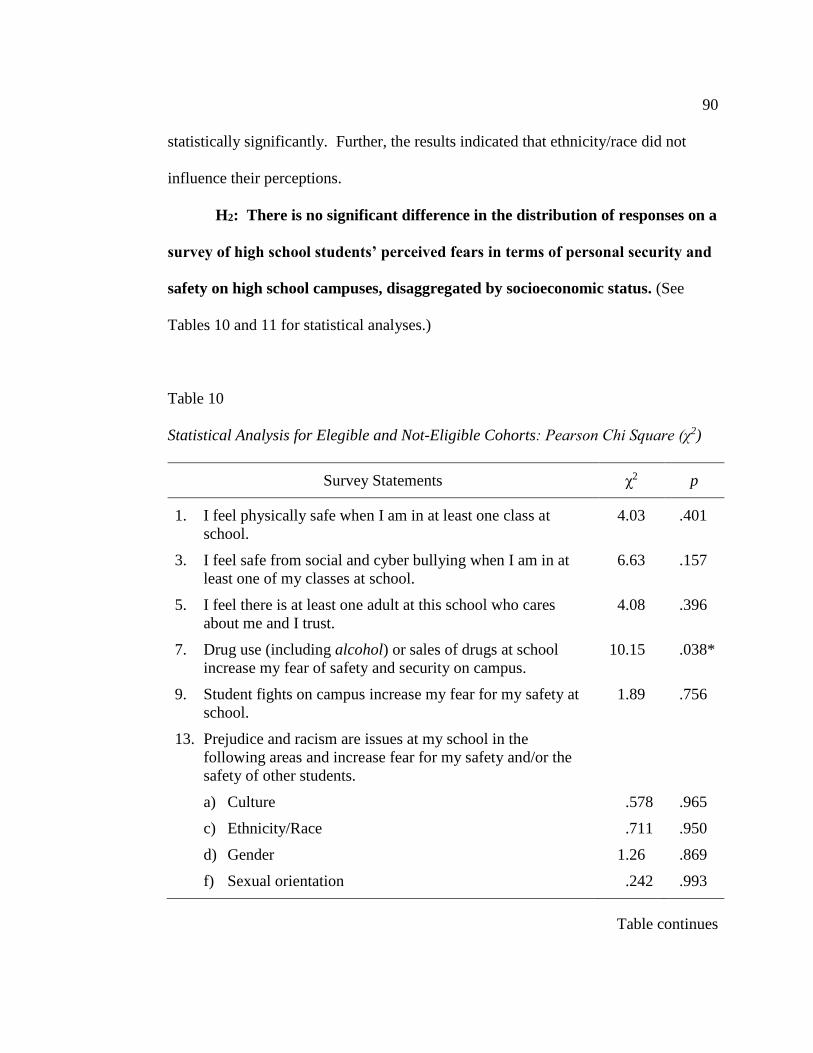
90
statistically significantly. Further, the results indicated that ethnicity/race did not
influence their perceptions.
H2: There is no significant difference in the distribution of responses on a
survey of high school students’ perceived fears in terms of personal security and
safety on high school campuses, disaggregated by socioeconomic status. (See
Tables 10 and 11 for statistical analyses.)
Table 10
Statistical Analysis for Elegible and Not-Eligible Cohorts: Pearson Chi Square (χ2)
Survey Statements χ2 p
1. I feel physically safe when I am in at least one class at
school.
4.03 .401
3. I feel safe from social and cyber bullying when I am in at
least one of my classes at school.
6.63 .157
5. I feel there is at least one adult at this school who cares
about me and I trust.
4.08 .396
7. Drug use (including alcohol) or sales of drugs at school
increase my fear of safety and security on campus.
10.15 .038*
9. Student fights on campus increase my fear for my safety at
school.
1.89 .756
13. Prejudice and racism are issues at my school in the
following areas and increase fear for my safety and/or the
safety of other students.
a) Culture .578 .965
c) Ethnicity/Race .711 .950
d) Gender 1.26 .869
f) Sexual orientation .242 .993
Table continues
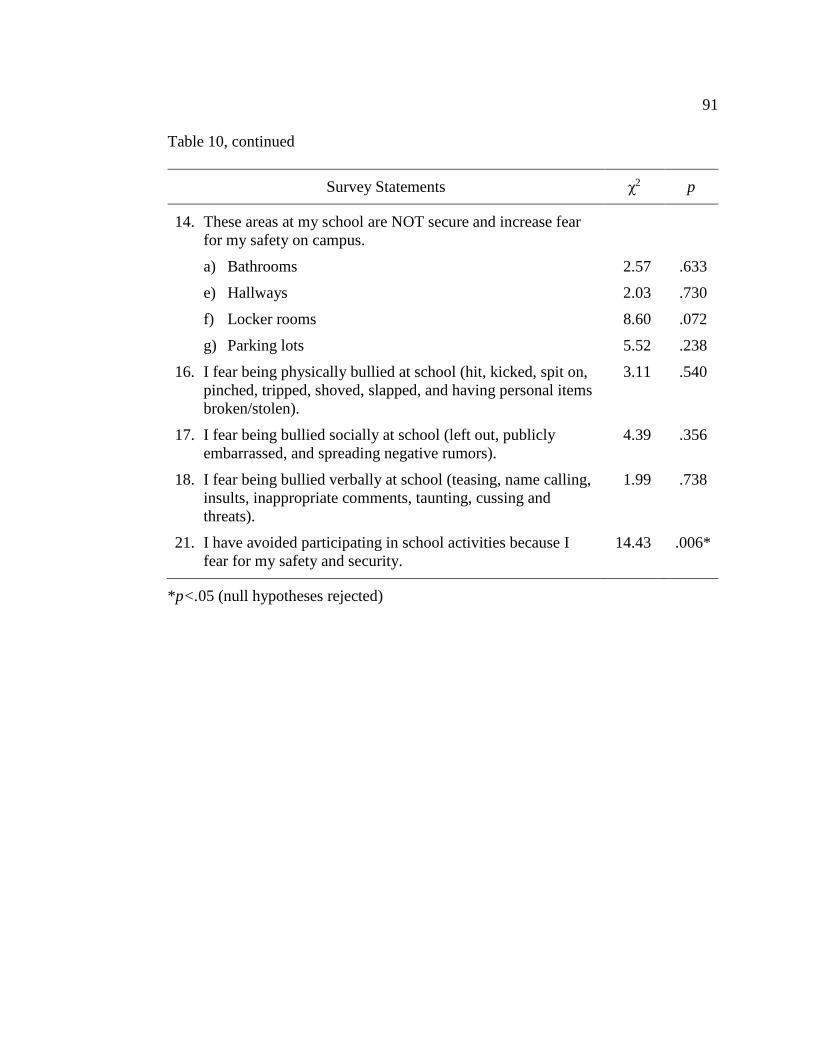
91
Table 10, continued
Survey Statements χ2 p
14. These areas at my school are NOT secure and increase fear
for my safety on campus.
a) Bathrooms 2.57 .633
e) Hallways 2.03 .730
f) Locker rooms 8.60 .072
g) Parking lots 5.52 .238
16. I fear being physically bullied at school (hit, kicked, spit on,
pinched, tripped, shoved, slapped, and having personal items
broken/stolen).
3.11 .540
17. I fear being bullied socially at school (left out, publicly
embarrassed, and spreading negative rumors).
4.39 .356
18. I fear being bullied verbally at school (teasing, name calling,
insults, inappropriate comments, taunting, cussing and
threats).
1.99 .738
21. I have avoided participating in school activities because I
fear for my safety and security.
14.43 .006*
*p<.05 (null hypotheses rejected)
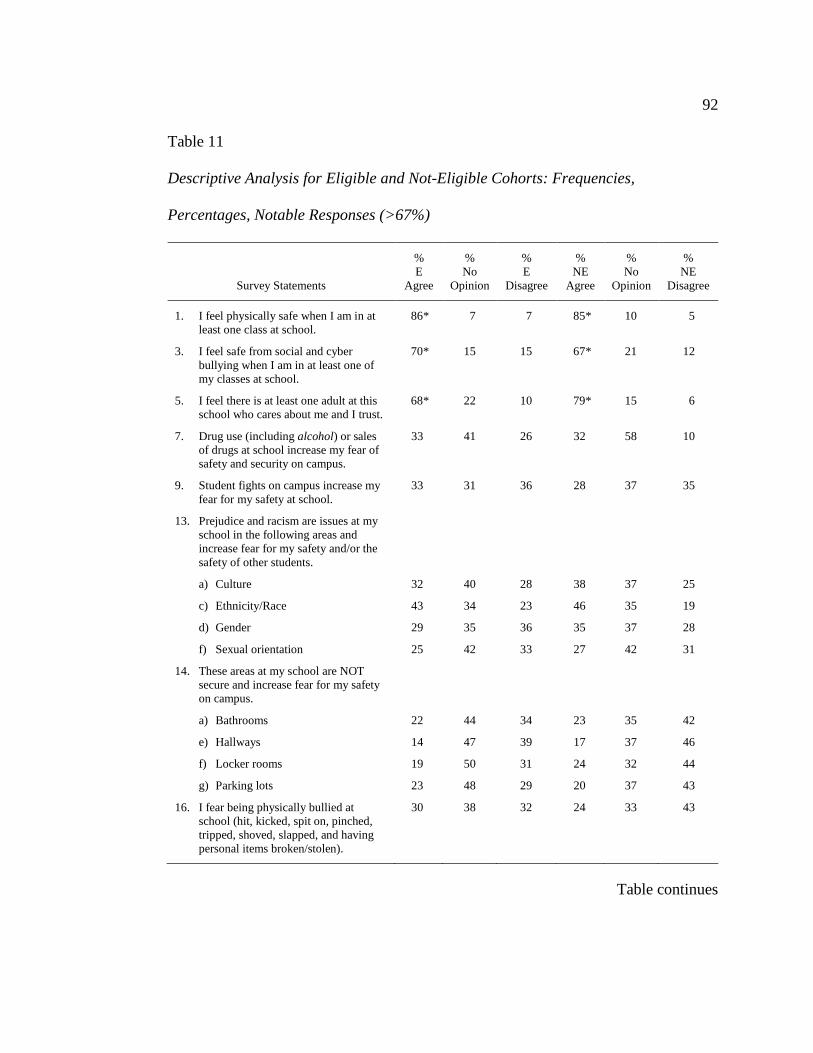
92
Table 11
Descriptive Analysis for Eligible and Not-Eligible Cohorts: Frequencies,
Percentages, Notable Responses (>67%)
Survey Statements
%
E
Agree
%
No
Opinion
%
E
Disagree
%
NE
Agree
%
No
Opinion
%
NE
Disagree
1. I feel physically safe when I am in at
least one class at school.
86* 7 7 85* 10 5
3. I feel safe from social and cyber
bullying when I am in at least one of
my classes at school.
70* 15 15 67* 21 12
5. I feel there is at least one adult at this
school who cares about me and I trust.
68* 22 10 79* 15 6
7. Drug use (including alcohol) or sales
of drugs at school increase my fear of
safety and security on campus.
33 41 26 32 58 10
9. Student fights on campus increase my
fear for my safety at school.
33 31 36 28 37 35
13. Prejudice and racism are issues at my
school in the following areas and
increase fear for my safety and/or the
safety of other students.
a) Culture 32 40 28 38 37 25
c) Ethnicity/Race 43 34 23 46 35 19
d) Gender 29 35 36 35 37 28
f) Sexual orientation 25 42 33 27 42 31
14. These areas at my school are NOT
secure and increase fear for my safety
on campus.
a) Bathrooms 22 44 34 23 35 42
e) Hallways 14 47 39 17 37 46
f) Locker rooms 19 50 31 24 32 44
g) Parking lots 23 48 29 20 37 43
16. I fear being physically bullied at
school (hit, kicked, spit on, pinched,
tripped, shoved, slapped, and having
personal items broken/stolen).
30 38 32 24 33 43
Table continues
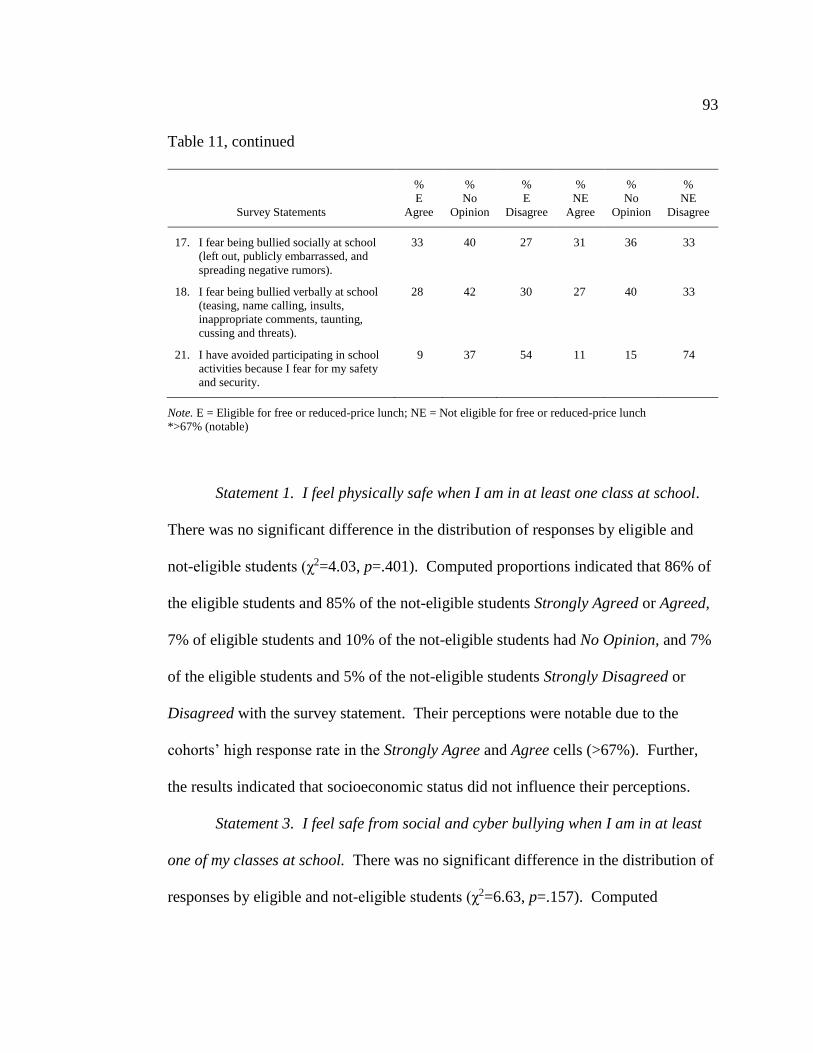
93
Table 11, continued
Survey Statements
%
E
Agree
%
No
Opinion
%
E
Disagree
%
NE
Agree
%
No
Opinion
%
NE
Disagree
17. I fear being bullied socially at school
(left out, publicly embarrassed, and
spreading negative rumors).
33 40 27 31 36 33
18. I fear being bullied verbally at school
(teasing, name calling, insults,
inappropriate comments, taunting,
cussing and threats).
28 42 30 27 40 33
21. I have avoided participating in school
activities because I fear for my safety
and security.
9 37 54 11 15 74
Note. E = Eligible for free or reduced-price lunch; NE = Not eligible for free or reduced-price lunch
*>67% (notable)
Statement 1. I feel physically safe when I am in at least one class at school.
There was no significant difference in the distribution of responses by eligible and
not-eligible students (χ2=4.03, p=.401). Computed proportions indicated that 86% of
the eligible students and 85% of the not-eligible students Strongly Agreed or Agreed,
7% of eligible students and 10% of the not-eligible students had No Opinion, and 7%
of the eligible students and 5% of the not-eligible students Strongly Disagreed or
Disagreed with the survey statement. Their perceptions were notable due to the
cohorts’ high response rate in the Strongly Agree and Agree cells (>67%). Further,
the results indicated that socioeconomic status did not influence their perceptions.
Statement 3. I feel safe from social and cyber bullying when I am in at least
one of my classes at school. There was no significant difference in the distribution of
responses by eligible and not-eligible students (χ2=6.63, p=.157). Computed
94
proportions indicated that 70% of the eligible students and 67% of the not-eligible
students Strongly Agreed or Agreed, 15% of eligible and 21% of the not-eligible
students had No Opinion, and 15% of the eligible and 12% of the not-eligible students
Strongly Disagreed or Disagreed with the survey statement. Their perceptions were
notable due to the cohorts’ high response rate in the Strongly Agree and Agree cells
(>67%). Further, the results indicated that socioeconomic status did not influence
their perceptions.
Statement 5. I feel there is at least one adult at this school who cares about
me and I trust. There was no significant difference in the distribution of responses
between eligible and not-eligible students (χ2=4.08, p=.396). Computed proportions
indicated that 68% of the eligible students and 79% of the not-eligible students
Strongly Agreed or Agreed, 22% of the eligible and 15% of the not-eligible students
had No Opinion, and 10% of the eligible and 6% of the not-eligible students Strongly
Disagreed or Disagreed with the survey statement. Their perceptions were notable
due to the cohorts’ high response rate in the Strongly Agree and Agree cells (>67%).
Further, the results indicated that socioeconomic status did not influence their
perceptions.
Statement 7. Drug use (including alcohol) or sales of drugs at school
increase my fear of safety and security on campus. There was a significant difference
in the distribution of responses between eligible and not-eligible students (χ2=10.15,
p=.038). Computed proportions indicated that 33% of the eligible students and 32%
of the not-eligible students Strongly Agreed and Agreed, 41% of the eligible students
95
and 58% of the not-eligible students had No Opinion, and 26% of the eligible
students and 10% of the not-eligible students Strongly Disagreed or Disagreed with
the survey statement. Therefore, the eligible and not-eligible students’ perceptions
were significantly different. Further, the results indicated that socioeconomic status
did influence their perceptions.
Statement 9. Student fights on campus increase my fear for my safety at
school. There was no significant difference in the distribution of responses between
eligible and not-eligible students (χ2=1.89, p=.756). Computed proportions indicated
that 33% of the eligible students and 28% of the not-eligible students Strongly Agreed
or Agreed, 31% of the eligible students and 37% of the not-eligible students had No
Opinion, and 36% of the eligible students and 35% of the not-eligible students
Strongly Disagreed or Disagreed with the survey statement. Therefore, the eligible
and not-eligible students’ perceptions were inconclusive and not statistically
significant. Further, the results indicated that socioeconomic status did not influence
their perceptions.
Statement 13. Prejudice and racism are issues at my school in the following
areas and increase fear for my safety and/or the safety of other students.
Statement 13(a) Culture. There was no significant difference in the
distribution of responses between eligible and not-eligible students (χ2=.578, p=.965).
Computed proportions indicated that 32% of the eligible students and 38% of the not-
eligible students Strongly Agreed or Agreed, 40% the eligible students and 37% of the
not-eligible students had No Opinion. and 28% of the eligible students and 25% of the
96
not-eligible students Strongly Disagreed or Disagreed with the survey statement.
Therefore, the eligible and not-eligible students’ perceptions were inconclusive and
not statistically significant. Further, the results indicated that socioeconomic status
did not influence their perceptions.
Statement 13(c) Ethnicity/Race. There was no significant difference in the
distribution of responses between eligible and not-eligible students (χ2=.711, p=.950).
Computed proportions indicated that 43% of the eligible students and 46% of the not-
eligible students Strongly Agreed or Agreed, 34% of the eligible students and 35% of
the not-eligible students had No Opinion, and 23% of the eligible students and 19% of
the not-eligible students Strongly Disagreed or Disagreed with the survey statement.
Therefore, the eligible and not-eligible students’ perceptions were inconclusive and
not statistically significant. Further, the results indicated that socioeconomic status
did not influence their perceptions.
Statement 13(d) Gender. There was a significant difference in the distribution
of responses between eligible and not-eligible students (χ2=1.26, p=.869). Computed
proportions indicated that 29% of the eligible students and 35% of the not-eligible
students Strongly Agreed or Agreed, 35% of the eligible students and 37% of the not-
eligible students had No Opinion, and 36% of the eligible students and 28% of the
not-eligible students Strongly Disagreed or Disagreed with the survey statement.
Therefore, the eligible and not-eligible students’ perceptions were inconclusive and
not statistically significant. Further, the results indicated that socioeconomic status
did not influence their perceptions.
97
Statement 13(f) Sexual orientation. There was no significant difference in
the distribution of responses between eligible and not-eligible students (χ2=.242,
p=.993). Computed proportions indicated that 25% of the eligible students and 27%
of the not-eligible students Strongly Agreed or Agreed, 42% of the eligible students
and 42% of the not-eligible students had No Opinion, and 33% of the eligible students
and 31% of the not-eligible students Strongly Disagreed or Disagreed with the survey
statement. Therefore, the eligible and not-eligible students’ perceptions were
inconclusive and not statistically significant. Further, the results indicated that
socioeconomic status did not influence their perceptions.
Statement 14. These areas at my school are NOT secure and increase fear for
my safety on campus.
Statement 14(a) Bathrooms. There was no significant difference in the
distribution of responses between eligible and not-eligible students (χ2=2.57, p=.633).
Computed proportions indicated that 22% of the eligible students and 23% of the not-
eligible students Strongly Agreed or Agreed, 44% of the eligible students and 35% of
the not-eligible students had No Opinion, and 34% of the eligible students and 42% of
the not-eligible students Strongly Disagreed or Disagreed with the survey statement.
Therefore, the eligible and not-eligible students’ perceptions were inconclusive and
not statistically significant. Further, the results indicated that socioeconomic status
did not influence their perceptions.
Statement 14(e) Hallways. There was no significant difference in the
distribution of responses by White and Hispanic students (χ2=2.03, p=.730).
98
Computed proportions indicated that 14% of the eligible students and 17% of the
not-eligible students Strongly Agreed or Agreed, 47% of the eligible students and
37% of the not-eligible students had No Opinion, and 39% of the eligible students and
46% of the not-eligible students Strongly Disagreed or Disagreed with the survey
statement. Therefore, the eligible and not-eligible students’ perceptions were
inconclusive and not statistically significant. Further, the results indicated that
socioeconomic status did not influence their perceptions.
Statement 14(f) Locker rooms. There was no significant difference in the
distribution of responses by White and Hispanic students (χ2=8.60, p=.072).
Computed proportions indicated that 19% of the eligible students and 24% of the not-
eligible students Strongly Agreed or Agreed, 50% of the eligible students and 32% of
the not-eligible students had No Opinion, and 31% of the eligible students and 44% of
the not-eligible students Strongly Disagreed or Disagreed with the survey statement.
Therefore, the eligible and not-eligible students’ perceptions were inconclusive and
not statistically significant. Further, the results indicated that socioeconomic status
did not influence their perceptions.
Statement 14(g) Parking lots. There was a significant difference in the
distribution of responses by White and Hispanic students (χ2=5.52, p=.238).
Computed proportions indicated that 23% of the eligible students and 20% of the not-
eligible students Strongly Agreed or Agreed, 48% of the eligible students and 37% of
the not-eligible students had No Opinion, and 29% of the eligible students and 43% of
the not-eligible students Strongly Disagreed or Disagreed with the survey statement.
99
Therefore, the eligible and not-eligible students’ perceptions were inconclusive and
not statistically significant. Further, the results indicated that socioeconomic status
did not influence their perceptions.
Statement 16. I fear being physically bullied at school (hit, kicked, spit on,
pinched, tripped, shoved, slapped, and having personal items broken/stolen). There
was no significant difference in the distribution of responses between eligible and
not-eligible students (χ2=3.11, p=540.). Computed proportions indicated that 30% of
the eligible students and 24% of the not-eligible students Strongly Agreed or Agreed,
38% of the eligible students and 33% of the not-eligible students had No Opinion, and
32% of the eligible students and 43% of the not-eligible students Strongly Disagreed
or Disagreed with the survey statement. Therefore, the eligible and not-eligible
students’ perceptions were inconclusive and not statistically significant. Further, the
results indicated that socioeconomic status did not influence their perceptions.
Statement 17. I fear being bullied socially at school (left out, publicly
embarrassed, and spreading negative rumors). There was no significant difference in
the distribution of responses between eligible and not-eligible students (χ2=4.39,
p=.356). Computed proportions indicated that 33% of the eligible students and 31%
of the not-eligible students Strongly Agreed or Agreed, 40% of the eligible students
and 36% of the not-eligible students had No Opinion, and 27% of the eligible students
and 33% of the not-eligible students Strongly Disagreed or Disagreed with the survey
statement. Therefore, the eligible and not-eligible students’ perceptions were
100
inconclusive and not statistically significant. Further, the results indicated that
socioeconomic status did not influence their perceptions.
Statement 18. I fear being bullied verbally at school (teasing, name calling,
insults, inappropriate comments, taunting, cussing and threats). There was no
significant difference in the distribution of responses between eligible and not-eligible
students (χ2=1.99, p=.738). Computed proportions indicated that 28% of the eligible
students and 27% of the not-eligible students Strongly Agreed or Agreed, 42% of the
eligible students and 40% of the not-eligible students had No Opinion, and 30% of the
eligible students and 33% of the not-eligible students Strongly Disagreed or
Disagreed with the survey statement. Therefore, the eligible and not-eligible
students’ perceptions were inconclusive and not statistically significant. Further, the
results indicated that socioeconomic status did not influence their perceptions.
Statement 21. I have avoided participating in school activities because I fear
for my safety and security. There was a significant difference in the distribution of
responses by White and Hispanic students (χ2=14.43, p=.006). Computed proportions
indicated that 9% of the eligible students and 11% of the not-eligible students
Strongly Agreed or Agreed, 37% of the eligible students and 15% of the not-eligible
students had No Opinion, and 54% of the eligible students and 74% of the not-eligible
students Strongly Disagreed or Disagreed with the survey statement. Therefore, the
eligible and not-eligible students’ perceptions were significantly different. Further,
the results indicated that socioeconomic status did influence their perceptions.
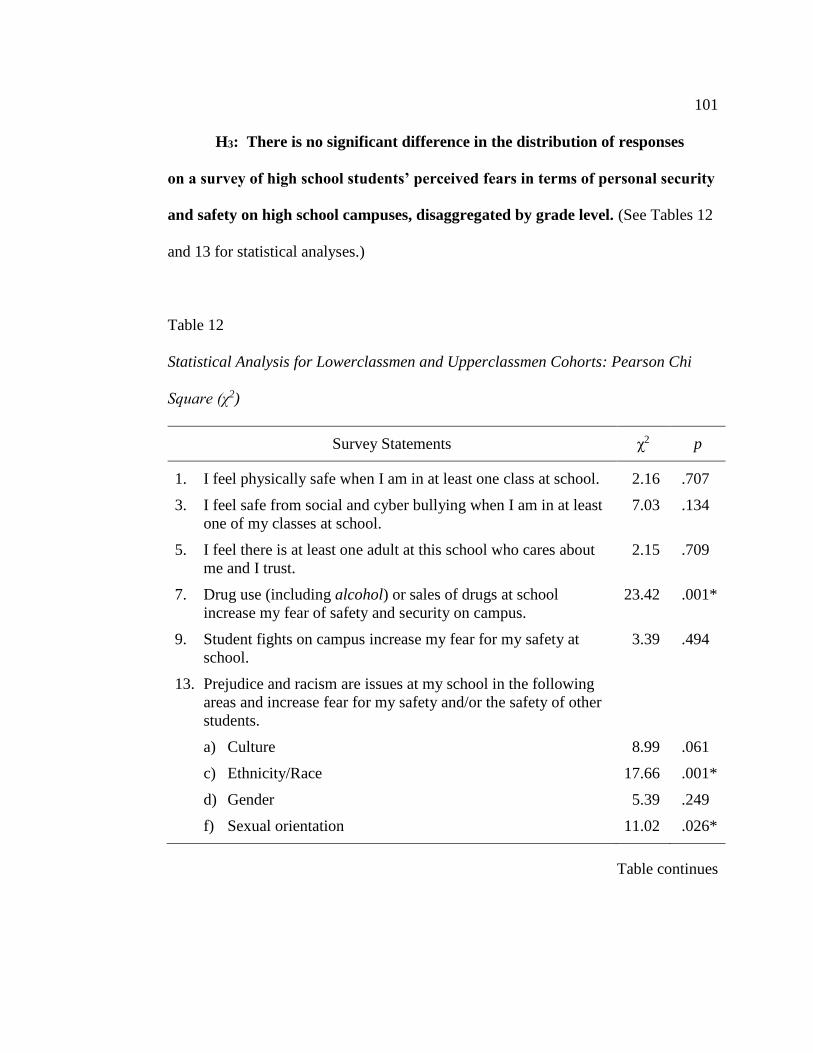
101
H3: There is no significant difference in the distribution of responses
on a survey of high school students’ perceived fears in terms of personal security
and safety on high school campuses, disaggregated by grade level. (See Tables 12
and 13 for statistical analyses.)
Table 12
Statistical Analysis for Lowerclassmen and Upperclassmen Cohorts: Pearson Chi
Square (χ2)
Survey Statements χ2 p
1. I feel physically safe when I am in at least one class at school. 2.16 .707
3. I feel safe from social and cyber bullying when I am in at least
one of my classes at school.
7.03 .134
5. I feel there is at least one adult at this school who cares about
me and I trust.
2.15 .709
7. Drug use (including alcohol) or sales of drugs at school
increase my fear of safety and security on campus.
23.42 .001*
9. Student fights on campus increase my fear for my safety at
school.
3.39 .494
13. Prejudice and racism are issues at my school in the following
areas and increase fear for my safety and/or the safety of other
students.
a) Culture 8.99 .061
c) Ethnicity/Race 17.66 .001*
d) Gender 5.39 .249
f) Sexual orientation 11.02 .026*
Table continues
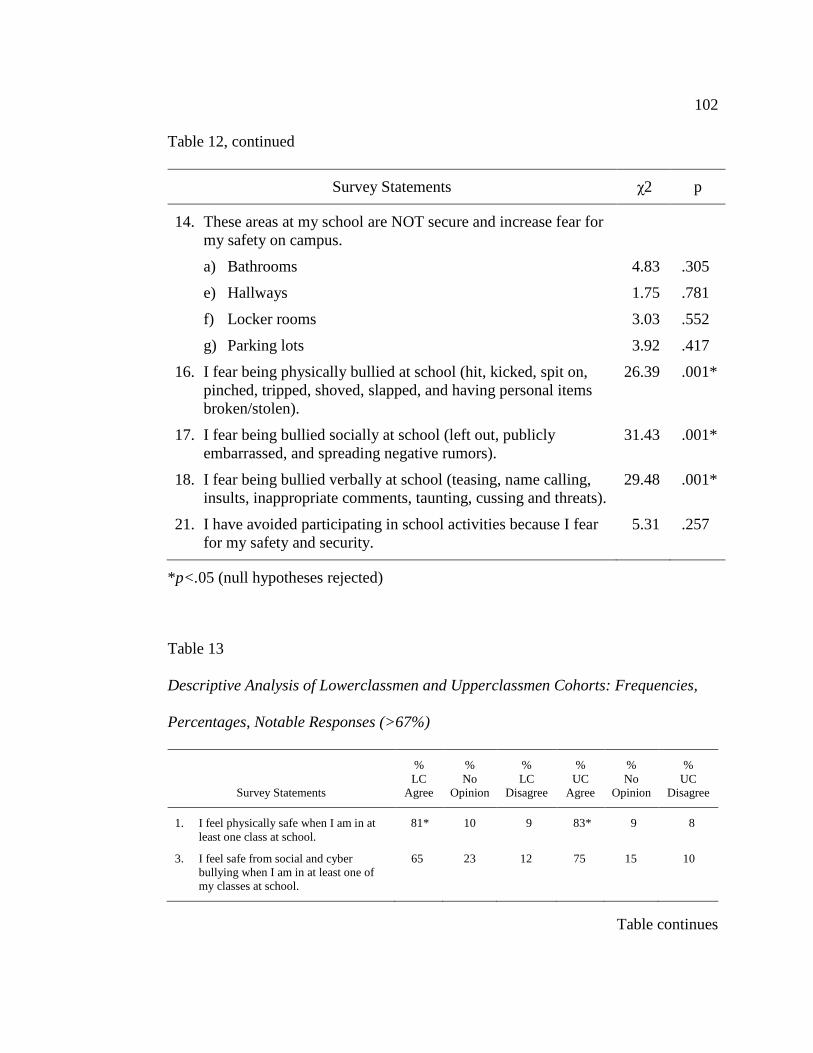
102
Table 12, continued
Survey Statements χ2 p
14. These areas at my school are NOT secure and increase fear for
my safety on campus.
a) Bathrooms 4.83 .305
e) Hallways 1.75 .781
f) Locker rooms 3.03 .552
g) Parking lots 3.92 .417
16. I fear being physically bullied at school (hit, kicked, spit on,
pinched, tripped, shoved, slapped, and having personal items
broken/stolen).
26.39 .001*
17. I fear being bullied socially at school (left out, publicly
embarrassed, and spreading negative rumors).
31.43 .001*
18. I fear being bullied verbally at school (teasing, name calling,
insults, inappropriate comments, taunting, cussing and threats).
29.48 .001*
21. I have avoided participating in school activities because I fear
for my safety and security.
5.31 .257
*p<.05 (null hypotheses rejected)
Table 13
Descriptive Analysis of Lowerclassmen and Upperclassmen Cohorts: Frequencies,
Percentages, Notable Responses (>67%)
Survey Statements
%
LC
Agree
%
No
Opinion
%
LC
Disagree
%
UC
Agree
%
No
Opinion
%
UC
Disagree
1. I feel physically safe when I am in at
least one class at school.
81* 10 9 83* 9 8
3. I feel safe from social and cyber
bullying when I am in at least one of
my classes at school.
65 23 12 75 15 10
Table continues
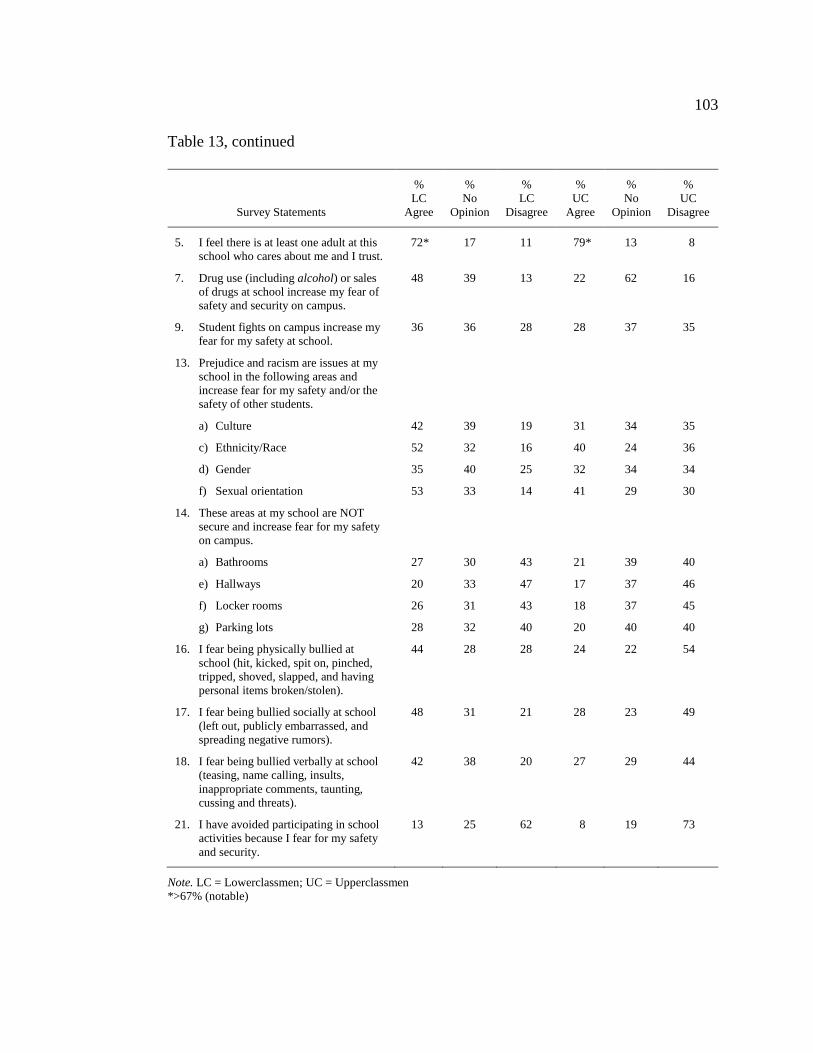
103
Table 13, continued
Survey Statements
%
LC
Agree
%
No
Opinion
%
LC
Disagree
%
UC
Agree
%
No
Opinion
%
UC
Disagree
5. I feel there is at least one adult at this
school who cares about me and I trust.
72* 17 11 79* 13 8
7. Drug use (including alcohol) or sales
of drugs at school increase my fear of
safety and security on campus.
48 39 13 22 62 16
9. Student fights on campus increase my
fear for my safety at school.
36 36 28 28 37 35
13. Prejudice and racism are issues at my
school in the following areas and
increase fear for my safety and/or the
safety of other students.
a) Culture 42 39 19 31 34 35
c) Ethnicity/Race 52 32 16 40 24 36
d) Gender 35 40 25 32 34 34
f) Sexual orientation 53 33 14 41 29 30
14. These areas at my school are NOT
secure and increase fear for my safety
on campus.
a) Bathrooms 27 30 43 21 39 40
e) Hallways 20 33 47 17 37 46
f) Locker rooms 26 31 43 18 37 45
g) Parking lots 28 32 40 20 40 40
16. I fear being physically bullied at
school (hit, kicked, spit on, pinched,
tripped, shoved, slapped, and having
personal items broken/stolen).
44 28 28 24 22 54
17. I fear being bullied socially at school
(left out, publicly embarrassed, and
spreading negative rumors).
48 31 21 28 23 49
18. I fear being bullied verbally at school
(teasing, name calling, insults,
inappropriate comments, taunting,
cussing and threats).
42 38 20 27 29 44
21. I have avoided participating in school
activities because I fear for my safety
and security.
13 25 62 8 19 73
Note. LC = Lowerclassmen; UC = Upperclassmen
*>67% (notable)
104
Statement 1. I feel physically safe when I am in at least one class at
school. There was no significant difference in the distribution of responses between
lowerclassmen (LC) and upperclassmen (UC) (χ2=2.16, p=.707). Computed
proportions indicated that 81% of the LC students and 83% of the UC students
Strongly Agreed or Agreed, 10% of the LC students and 9% of the UC students had
No Opinion, and 9% of the LC students and 8% of the UC students Strongly
Disagreed or Disagreed with the survey statement. Their perceptions were notable
due to the cohorts’ high response rate in the Strongly Agree and Agree cells (>67%).
Further, the results indicated that grade level did not influence their perceptions.
Statement 3. I feel safe from social and cyber bullying when I am in at least
one of my classes at school. There was no significant difference in the distribution of
responses between LC and UC students (χ2=7.03, p=.134). Computed proportions
indicated that 65% of the LC students and 75% of the UC students Strongly Agreed or
Agreed, 23% of the LC students and 15% of the UC students had No Opinion, and
12% of the LC students and 10% of the UC students Strongly Disagreed or Disagreed
with the survey statement. Therefore, both the LC and UC students’ perceptions were
inconclusive and not statistically significant. Further, the results indicated that grade
level did not influence their perceptions.
Statement 5. I feel there is at least one adult at this school who cares about
me and I trust. There was no significant difference in the distribution of responses
between LC and UC students (χ2=2.15, p=.709). Computed proportions indicated that
72% of the LC students and 79% of the UC students Strongly Agreed or Agreed, 17%
105
of the LC students and 13% of the UC students had No Opinion, and 11% of the
LC students and 8% of the UC students Strongly Disagreed or Disagreed with the
survey statement. Their perceptions were notable due to the cohorts’ high response
rate in the Strongly Agree and Agree cells (>67%). Further, the results indicated that
grade level did not influence their perceptions.
Statement 7. Drug use (including alcohol) or sales of drugs at school
increase my fear of safety and security on campus. There was a significant difference
in the distribution of responses between LC and UC students (χ2=23.42, p=.001).
Computed proportions indicated that 48% of the LC students and 22% of the UC
students Strongly Agreed or Agreed, 39% of the LC students and 62% of the UC
students had No Opinion, and 13% of the LC students and 16% of the UC students
Strongly Disagreed or Disagreed with the survey statement. Therefore, the LC and
UC students’ perceptions were significantly different. Further, the results indicated
that grade level did influence their perceptions.
Statement 9. Student fights on campus increase my fear for my safety at
school. There was a significant difference in the distribution of responses between
LC and UC students (χ2=3.39, p=.494). Computed proportions indicated that 36% of
the LC students and 28% of the UC students Strongly Agreed or Agreed, 36% of the
LC students and 37% of the UC students had No Opinion, and 28% of the LC
students and 35% of the UC students Strongly Disagreed or Disagreed with the
survey statement. Therefore, the LC and UC students’ perceptions were inconclusive
106
and not statistically significant. Further, the results indicated that grade level did
not influence their perceptions.
Statement 13. Prejudice and racism are issues at my school in the following
areas and increase fear for my safety and/or the safety of other students.
Statement 13(a) Culture. There was no significant difference in the
distribution of responses between LC and UC students (χ2=8.99, p=.061). Computed
proportions indicated that 42% of the LC students and 31% of the UC students
Strongly Agreed or Agreed, 39% of the LC students and 34% of the UC students had
No Opinion, and 19% of the LC students and 35% of the UC students Strongly
Disagreed or Disagreed with the survey statement. Therefore, the LC and UC
students’ perceptions were inconclusive and not statistically significant. Further, the
results indicated that grade level did not influence their perceptions.
Statement 13(c) Ethnicity/Race. There was a significant difference in the
distribution of responses between LC and UC students (χ2=17.66, p=.001).
Computed proportions indicated that 52% of the LC students and 40% of the UC
students Strongly Agreed or Agreed, 32% of the LC students and 24% of the UC
students had No Opinion, and 16% of the LC students and 36% of the UC students
Strongly Disagreed or Disagreed with the survey statement. Therefore, the LC and
UC students’ perceptions were significantly different. Further, the results indicated
that grade level did influence their perceptions.
Statement 13(d) Gender. There was a significant difference in the distribution
of responses between LC and UC students (χ2=5.39, p=.249). Computed proportions
107
indicated that 35% of the LC students and 32% of the UC students Strongly
Agreed or Agreed, 40% of the LC students and 34% of the UC students had No
Opinion, and 25% of the LC students and 34% of the UC students Strongly Disagreed
or Disagreed with the survey statement. Therefore, the LC and UC students’
perceptions were inconclusive and not statistically significant. Further, the results
indicated that grade level did not influence their perceptions.
Statement 13(f) Sexual orientation. There was a significant difference in the
distribution of responses between LC and UC students (χ2=11.02, p=.026).
Computed proportions indicated that 53% of the LC students and 41% of the UC
students Strongly Agreed or Agreed, 33% of the LC students and 29% of UC students
had No Opinion, and 14% of the LC students and 30% of the UC students Strongly
Disagreed or Disagreed with the survey statement. Therefore, the LC and UC
students’ perceptions were significantly different. Further, the results indicated that
grade level did influence their perceptions.
Statement 14. These areas at my school are NOT secure and increase fear for
my safety on campus.
Statement 14(a) Bathrooms. There was no significant difference in the
distribution of responses between LC and UC students (χ2=4.83, p=.305). Computed
proportions indicated that 27% of the LC students and 21% of the UC students
Strongly Agreed or Agreed, 30% of the LC students and 39% of the UC students had
No Opinion, and 43% of the LC students and 40% of the UC students Strongly
Disagreed or Disagreed with the survey statement. Therefore, the LC and UC
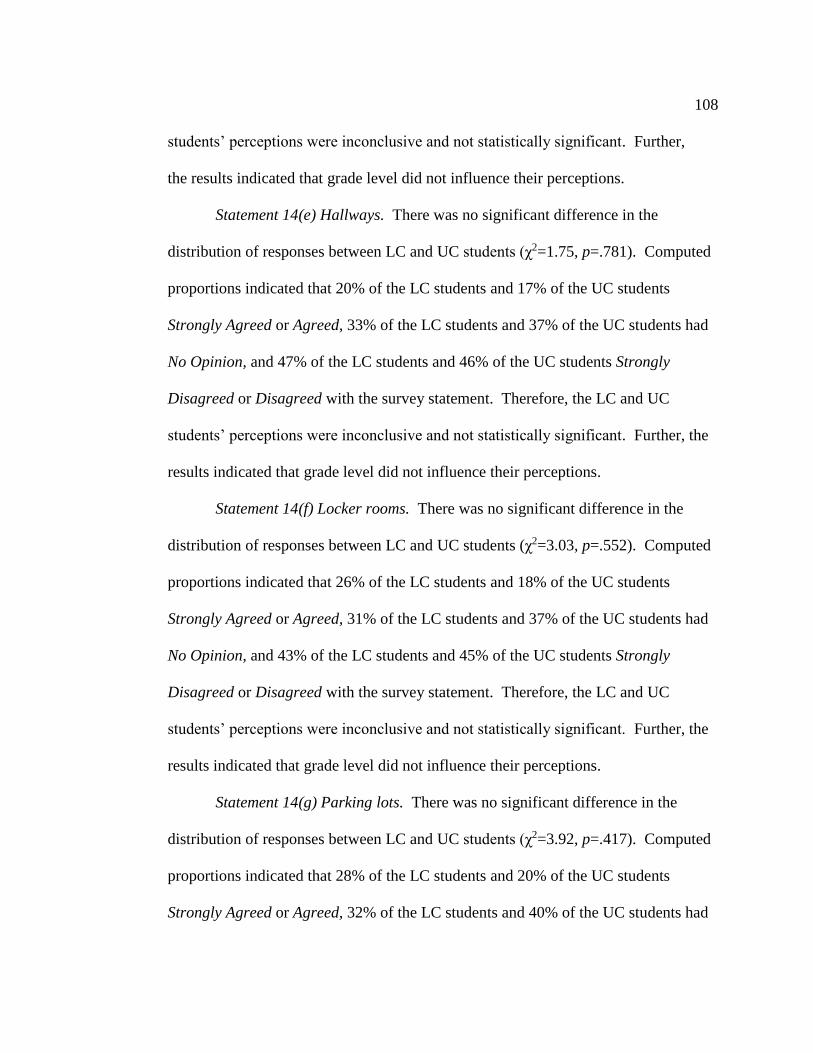
108
students’ perceptions were inconclusive and not statistically significant. Further,
the results indicated that grade level did not influence their perceptions.
Statement 14(e) Hallways. There was no significant difference in the
distribution of responses between LC and UC students (χ2=1.75, p=.781). Computed
proportions indicated that 20% of the LC students and 17% of the UC students
Strongly Agreed or Agreed, 33% of the LC students and 37% of the UC students had
No Opinion, and 47% of the LC students and 46% of the UC students Strongly
Disagreed or Disagreed with the survey statement. Therefore, the LC and UC
students’ perceptions were inconclusive and not statistically significant. Further, the
results indicated that grade level did not influence their perceptions.
Statement 14(f) Locker rooms. There was no significant difference in the
distribution of responses between LC and UC students (χ2=3.03, p=.552). Computed
proportions indicated that 26% of the LC students and 18% of the UC students
Strongly Agreed or Agreed, 31% of the LC students and 37% of the UC students had
No Opinion, and 43% of the LC students and 45% of the UC students Strongly
Disagreed or Disagreed with the survey statement. Therefore, the LC and UC
students’ perceptions were inconclusive and not statistically significant. Further, the
results indicated that grade level did not influence their perceptions.
Statement 14(g) Parking lots. There was no significant difference in the
distribution of responses between LC and UC students (χ2=3.92, p=.417). Computed
proportions indicated that 28% of the LC students and 20% of the UC students
Strongly Agreed or Agreed, 32% of the LC students and 40% of the UC students had
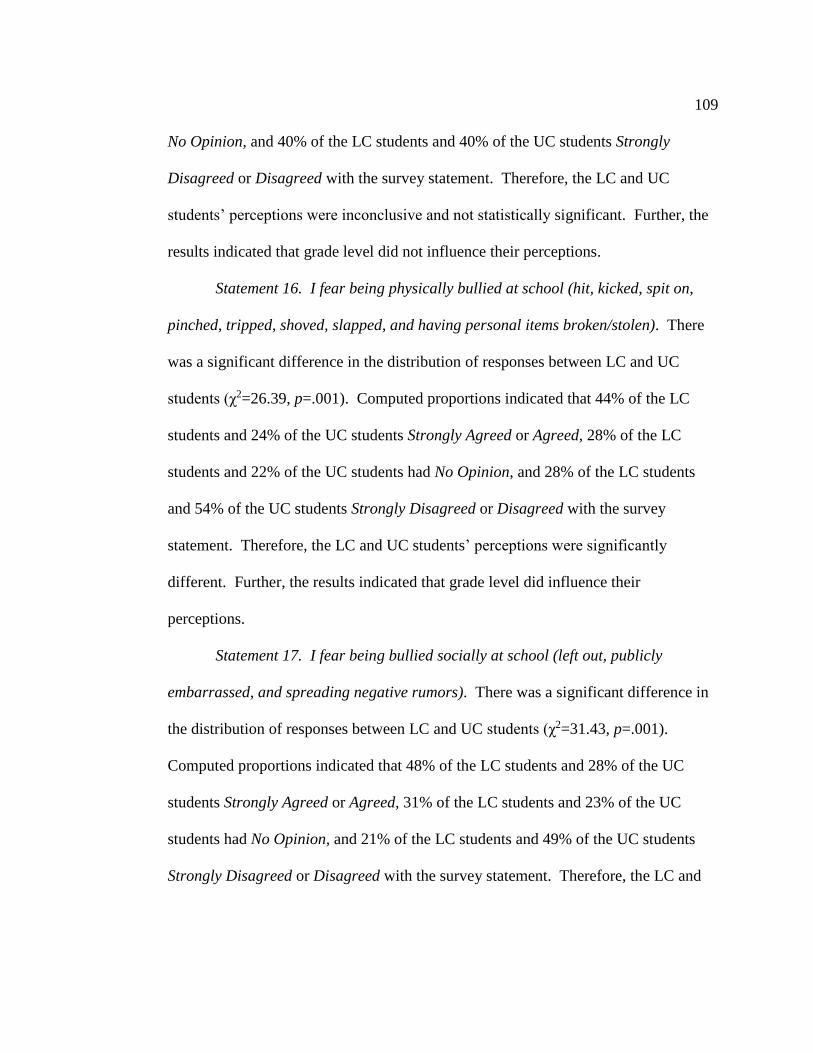
109
No Opinion, and 40% of the LC students and 40% of the UC students Strongly
Disagreed or Disagreed with the survey statement. Therefore, the LC and UC
students’ perceptions were inconclusive and not statistically significant. Further, the
results indicated that grade level did not influence their perceptions.
Statement 16. I fear being physically bullied at school (hit, kicked, spit on,
pinched, tripped, shoved, slapped, and having personal items broken/stolen). There
was a significant difference in the distribution of responses between LC and UC
students (χ2=26.39, p=.001). Computed proportions indicated that 44% of the LC
students and 24% of the UC students Strongly Agreed or Agreed, 28% of the LC
students and 22% of the UC students had No Opinion, and 28% of the LC students
and 54% of the UC students Strongly Disagreed or Disagreed with the survey
statement. Therefore, the LC and UC students’ perceptions were significantly
different. Further, the results indicated that grade level did influence their
perceptions.
Statement 17. I fear being bullied socially at school (left out, publicly
embarrassed, and spreading negative rumors). There was a significant difference in
the distribution of responses between LC and UC students (χ2=31.43, p=.001).
Computed proportions indicated that 48% of the LC students and 28% of the UC
students Strongly Agreed or Agreed, 31% of the LC students and 23% of the UC
students had No Opinion, and 21% of the LC students and 49% of the UC students
Strongly Disagreed or Disagreed with the survey statement. Therefore, the LC and
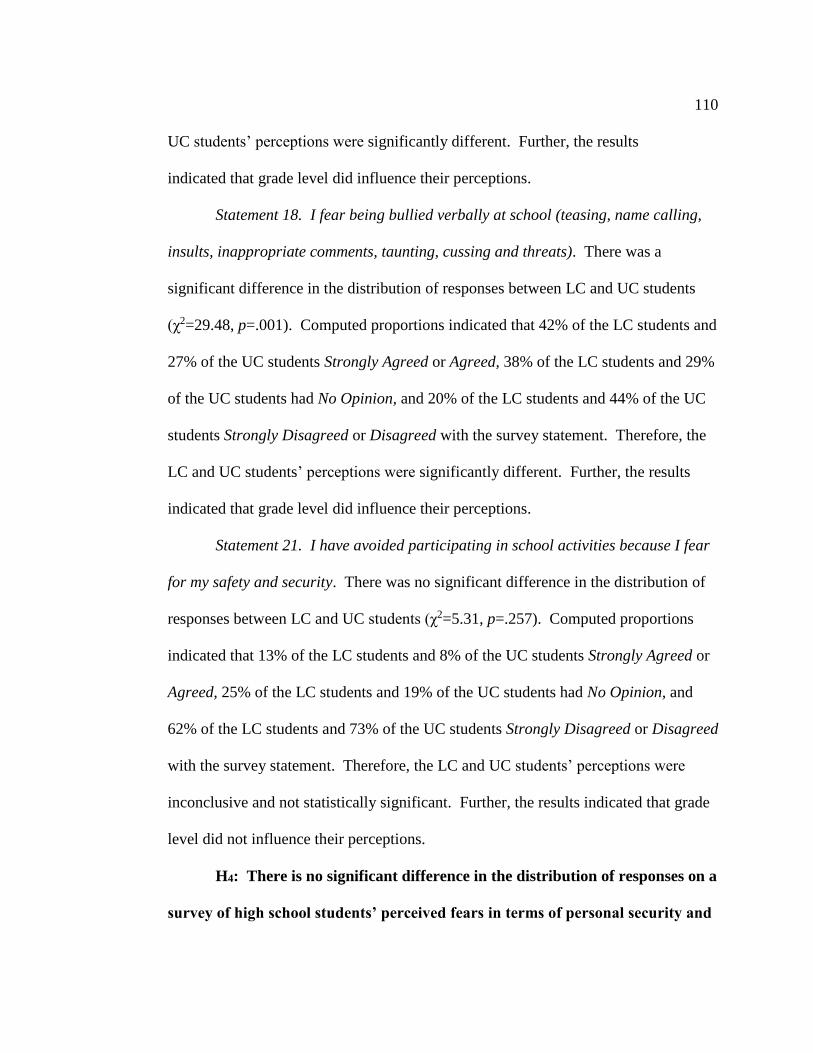
110
UC students’ perceptions were significantly different. Further, the results
indicated that grade level did influence their perceptions.
Statement 18. I fear being bullied verbally at school (teasing, name calling,
insults, inappropriate comments, taunting, cussing and threats). There was a
significant difference in the distribution of responses between LC and UC students
(χ2=29.48, p=.001). Computed proportions indicated that 42% of the LC students and
27% of the UC students Strongly Agreed or Agreed, 38% of the LC students and 29%
of the UC students had No Opinion, and 20% of the LC students and 44% of the UC
students Strongly Disagreed or Disagreed with the survey statement. Therefore, the
LC and UC students’ perceptions were significantly different. Further, the results
indicated that grade level did influence their perceptions.
Statement 21. I have avoided participating in school activities because I fear
for my safety and security. There was no significant difference in the distribution of
responses between LC and UC students (χ2=5.31, p=.257). Computed proportions
indicated that 13% of the LC students and 8% of the UC students Strongly Agreed or
Agreed, 25% of the LC students and 19% of the UC students had No Opinion, and
62% of the LC students and 73% of the UC students Strongly Disagreed or Disagreed
with the survey statement. Therefore, the LC and UC students’ perceptions were
inconclusive and not statistically significant. Further, the results indicated that grade
level did not influence their perceptions.
H4: There is no significant difference in the distribution of responses on a
survey of high school students’ perceived fears in terms of personal security and
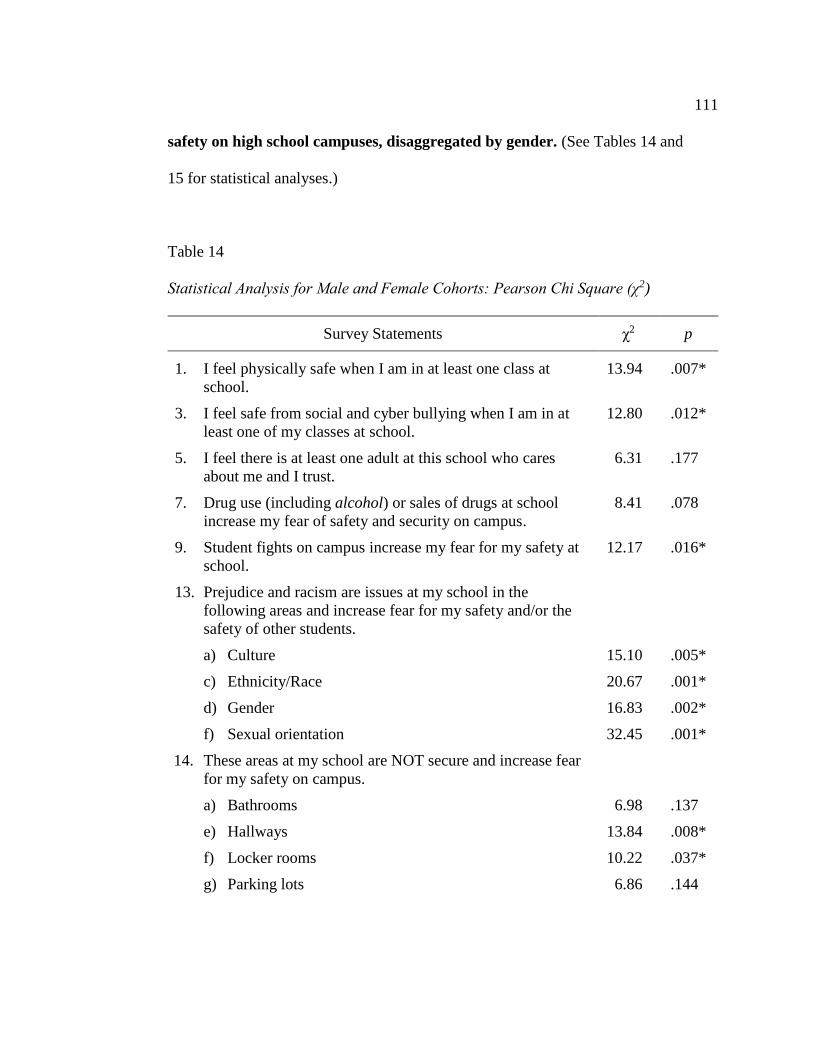
111
safety on high school campuses, disaggregated by gender. (See Tables 14 and
15 for statistical analyses.)
Table 14
Statistical Analysis for Male and Female Cohorts: Pearson Chi Square (χ2)
Survey Statements χ2 p
1. I feel physically safe when I am in at least one class at
school.
13.94 .007*
3. I feel safe from social and cyber bullying when I am in at
least one of my classes at school.
12.80 .012*
5. I feel there is at least one adult at this school who cares
about me and I trust.
6.31 .177
7. Drug use (including alcohol) or sales of drugs at school
increase my fear of safety and security on campus.
8.41 .078
9. Student fights on campus increase my fear for my safety at
school.
12.17 .016*
13. Prejudice and racism are issues at my school in the
following areas and increase fear for my safety and/or the
safety of other students.
a) Culture 15.10 .005*
c) Ethnicity/Race 20.67 .001*
d) Gender 16.83 .002*
f) Sexual orientation 32.45 .001*
14. These areas at my school are NOT secure and increase fear
for my safety on campus.
a) Bathrooms 6.98 .137
e) Hallways 13.84 .008*
f) Locker rooms 10.22 .037*
g) Parking lots 6.86 .144

112
16. I fear being physically bullied at school (hit, kicked, spit on,
pinched, tripped, shoved, slapped, and having personal
items broken/stolen).
16.72 .002*
Table continues
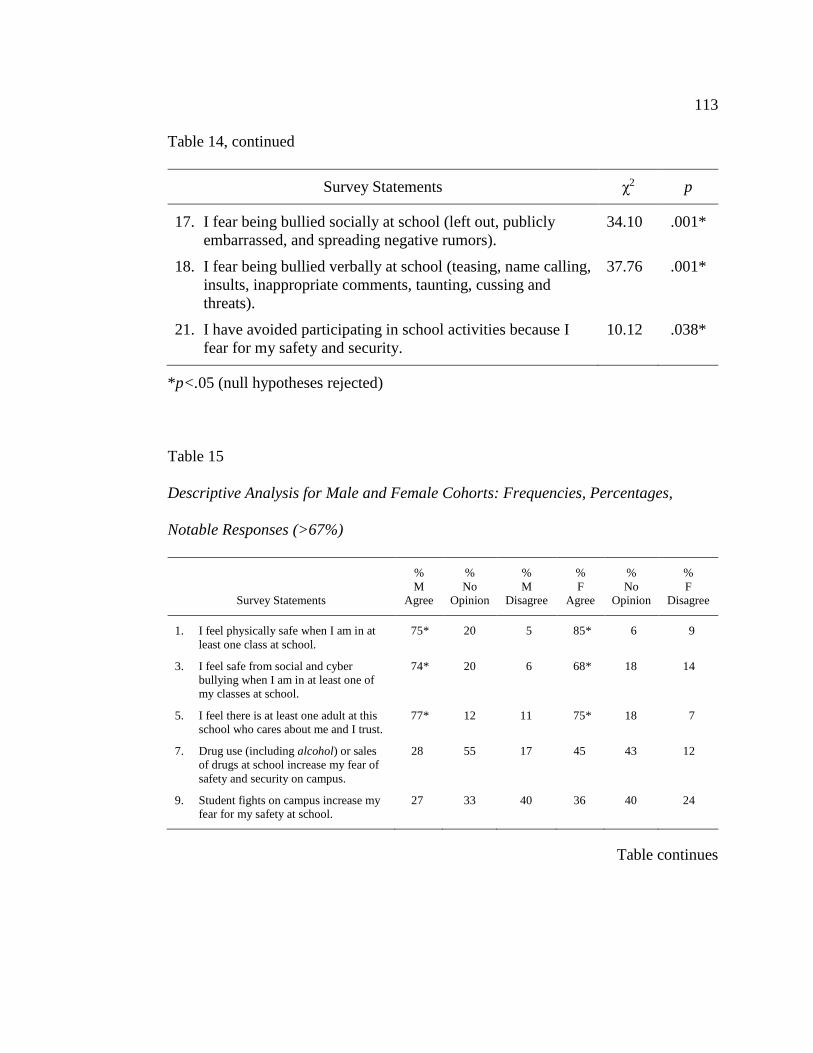
113
Table 14, continued
Survey Statements χ2 p
17. I fear being bullied socially at school (left out, publicly
embarrassed, and spreading negative rumors).
34.10 .001*
18. I fear being bullied verbally at school (teasing, name calling,
insults, inappropriate comments, taunting, cussing and
threats).
37.76 .001*
21. I have avoided participating in school activities because I
fear for my safety and security.
10.12 .038*
*p<.05 (null hypotheses rejected)
Table 15
Descriptive Analysis for Male and Female Cohorts: Frequencies, Percentages,
Notable Responses (>67%)
Survey Statements
%
M
Agree
%
No
Opinion
%
M
Disagree
%
F
Agree
%
No
Opinion
%
F
Disagree
1. I feel physically safe when I am in at
least one class at school.
75* 20 5 85* 6 9
3. I feel safe from social and cyber
bullying when I am in at least one of
my classes at school.
74* 20 6 68* 18 14
5. I feel there is at least one adult at this
school who cares about me and I trust.
77* 12 11 75* 18 7
7. Drug use (including alcohol) or sales
of drugs at school increase my fear of
safety and security on campus.
28 55 17 45 43 12
9. Student fights on campus increase my
fear for my safety at school.
27 33 40 36 40 24
Table continues
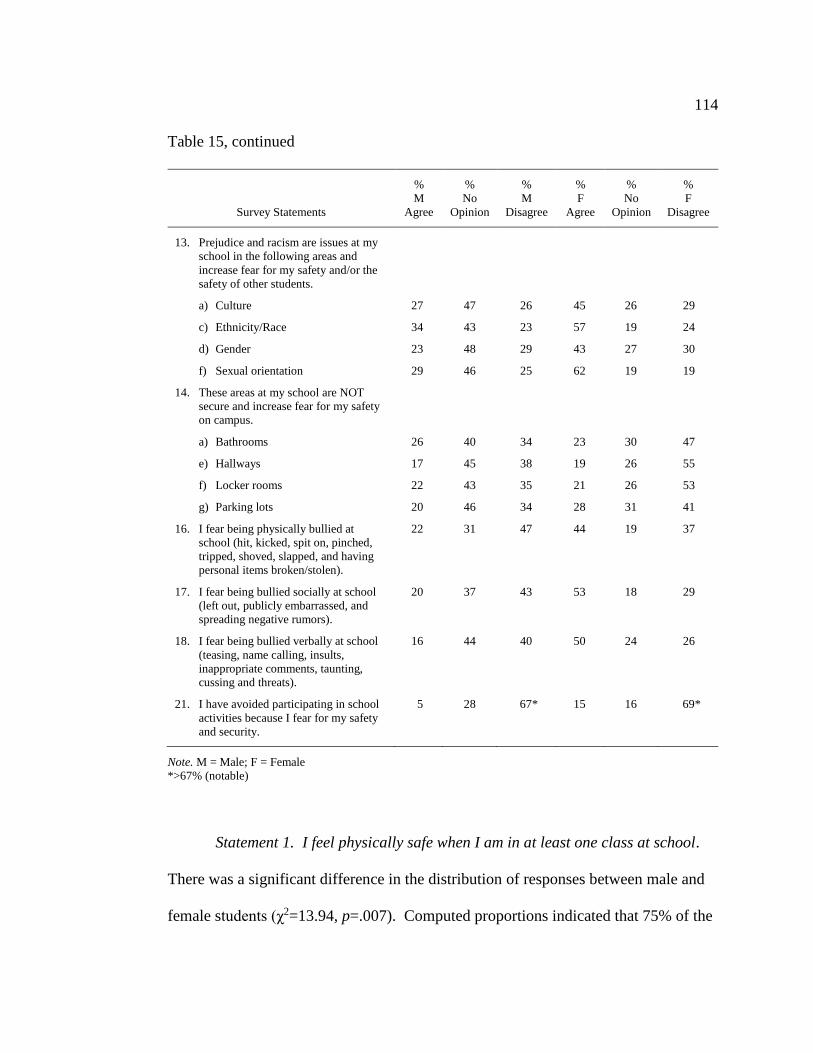
114
Table 15, continued
Survey Statements
%
M
Agree
%
No
Opinion
%
M
Disagree
%
F
Agree
%
No
Opinion
%
F
Disagree
13. Prejudice and racism are issues at my
school in the following areas and
increase fear for my safety and/or the
safety of other students.
a) Culture 27 47 26 45 26 29
c) Ethnicity/Race 34 43 23 57 19 24
d) Gender 23 48 29 43 27 30
f) Sexual orientation 29 46 25 62 19 19
14. These areas at my school are NOT
secure and increase fear for my safety
on campus.
a) Bathrooms 26 40 34 23 30 47
e) Hallways 17 45 38 19 26 55
f) Locker rooms 22 43 35 21 26 53
g) Parking lots 20 46 34 28 31 41
16. I fear being physically bullied at
school (hit, kicked, spit on, pinched,
tripped, shoved, slapped, and having
personal items broken/stolen).
22 31 47 44 19 37
17. I fear being bullied socially at school
(left out, publicly embarrassed, and
spreading negative rumors).
20 37 43 53 18 29
18. I fear being bullied verbally at school
(teasing, name calling, insults,
inappropriate comments, taunting,
cussing and threats).
16 44 40 50 24 26
21. I have avoided participating in school
activities because I fear for my safety
and security.
5 28 67* 15 16 69*
Note. M = Male; F = Female
*>67% (notable)
Statement 1. I feel physically safe when I am in at least one class at school.
There was a significant difference in the distribution of responses between male and
female students (χ2=13.94, p=.007). Computed proportions indicated that 75% of the
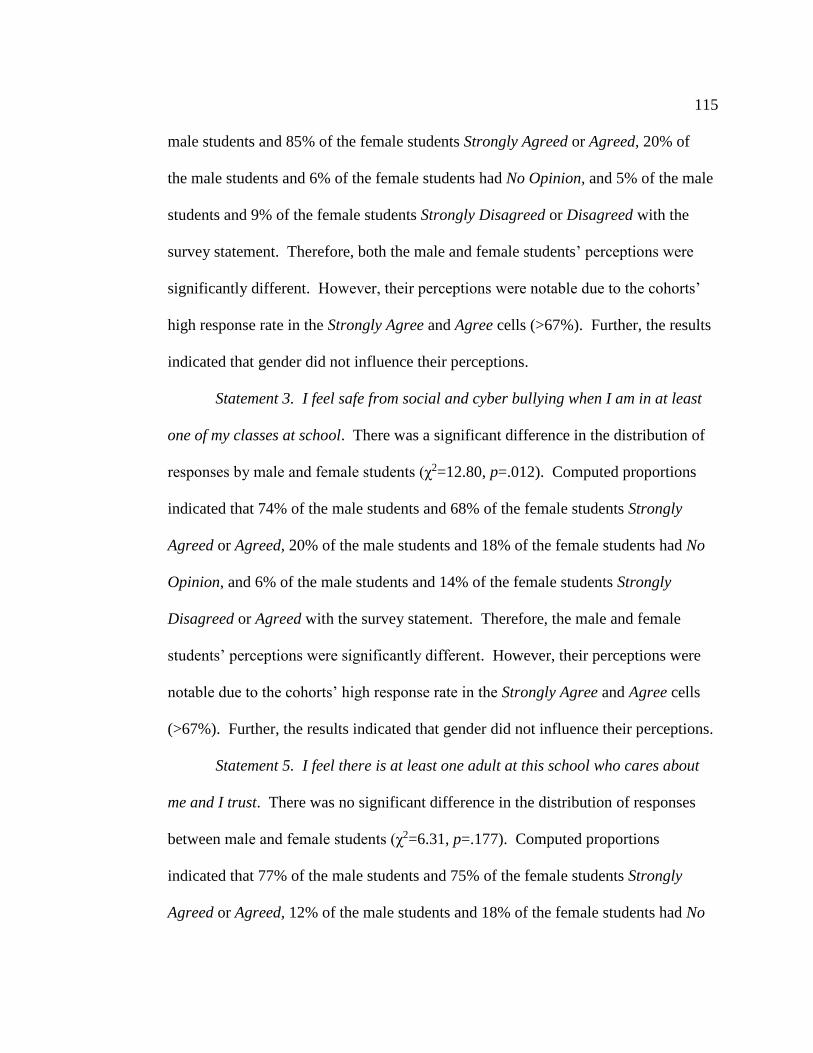
115
male students and 85% of the female students Strongly Agreed or Agreed, 20% of
the male students and 6% of the female students had No Opinion, and 5% of the male
students and 9% of the female students Strongly Disagreed or Disagreed with the
survey statement. Therefore, both the male and female students’ perceptions were
significantly different. However, their perceptions were notable due to the cohorts’
high response rate in the Strongly Agree and Agree cells (>67%). Further, the results
indicated that gender did not influence their perceptions.
Statement 3. I feel safe from social and cyber bullying when I am in at least
one of my classes at school. There was a significant difference in the distribution of
responses by male and female students (χ2=12.80, p=.012). Computed proportions
indicated that 74% of the male students and 68% of the female students Strongly
Agreed or Agreed, 20% of the male students and 18% of the female students had No
Opinion, and 6% of the male students and 14% of the female students Strongly
Disagreed or Agreed with the survey statement. Therefore, the male and female
students’ perceptions were significantly different. However, their perceptions were
notable due to the cohorts’ high response rate in the Strongly Agree and Agree cells
(>67%). Further, the results indicated that gender did not influence their perceptions.
Statement 5. I feel there is at least one adult at this school who cares about
me and I trust. There was no significant difference in the distribution of responses
between male and female students (χ2=6.31, p=.177). Computed proportions
indicated that 77% of the male students and 75% of the female students Strongly
Agreed or Agreed, 12% of the male students and 18% of the female students had No
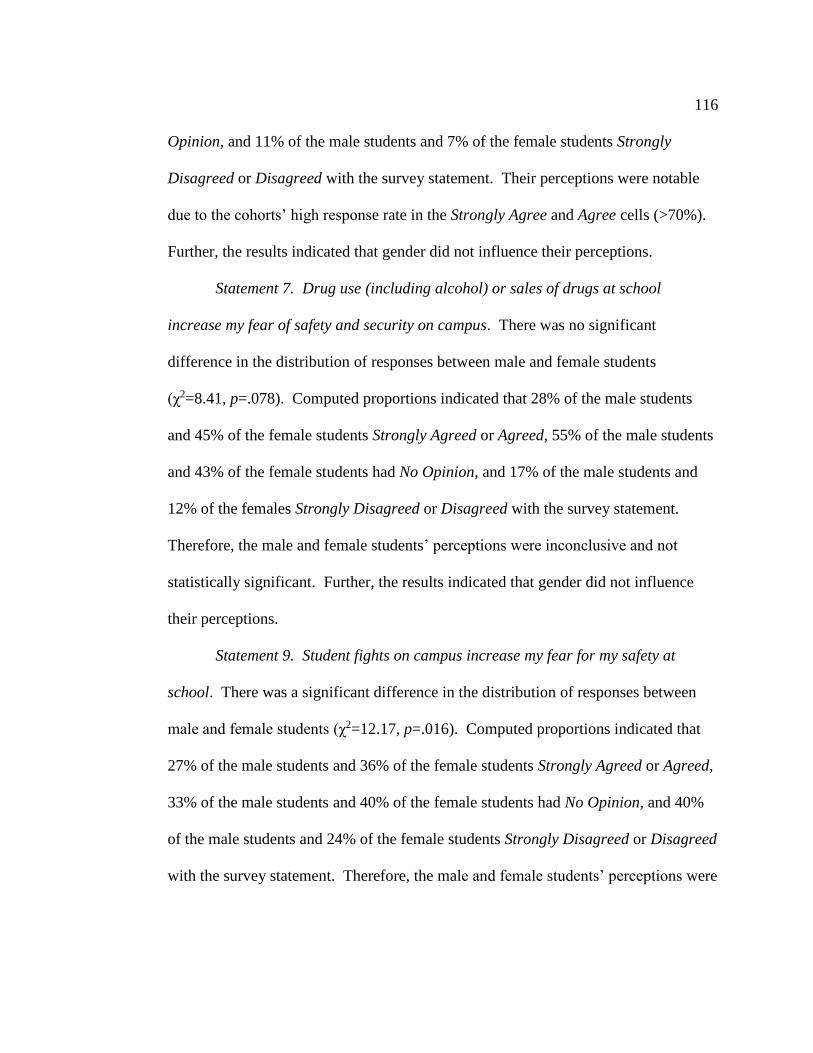
116
Opinion, and 11% of the male students and 7% of the female students Strongly
Disagreed or Disagreed with the survey statement. Their perceptions were notable
due to the cohorts’ high response rate in the Strongly Agree and Agree cells (>70%).
Further, the results indicated that gender did not influence their perceptions.
Statement 7. Drug use (including alcohol) or sales of drugs at school
increase my fear of safety and security on campus. There was no significant
difference in the distribution of responses between male and female students
(χ2=8.41, p=.078). Computed proportions indicated that 28% of the male students
and 45% of the female students Strongly Agreed or Agreed, 55% of the male students
and 43% of the female students had No Opinion, and 17% of the male students and
12% of the females Strongly Disagreed or Disagreed with the survey statement.
Therefore, the male and female students’ perceptions were inconclusive and not
statistically significant. Further, the results indicated that gender did not influence
their perceptions.
Statement 9. Student fights on campus increase my fear for my safety at
school. There was a significant difference in the distribution of responses between
male and female students (χ2=12.17, p=.016). Computed proportions indicated that
27% of the male students and 36% of the female students Strongly Agreed or Agreed,
33% of the male students and 40% of the female students had No Opinion, and 40%
of the male students and 24% of the female students Strongly Disagreed or Disagreed
with the survey statement. Therefore, the male and female students’ perceptions were
117
significantly different. Further, the results indicated that gender did influence
their perceptions.
Statement 13. Prejudice and racism are issues at my school in the following
areas and increase fear for my safety and/or the safety of other students.
Statement 13(a) Culture. There was a significant difference in the distribution
of responses between male and female students (χ2=15.10, p=.005). Computed
proportions indicated that 27% of the male students and 45% of the female students
Strongly Agreed or Agreed, 47% of the male students and 26% of the female students
had No Opinion, and 26% of the male students and 29% of the female students
Strongly Disagreed or Disagreed with the survey statement. Therefore, the male and
female students’ perceptions were significantly different. Further, the results
indicated that gender did influence their perceptions.
Statement 13(c) Ethnicity/Race. There was a significant difference in the
distribution of responses between male and female students (χ2=20.67, p=000).
Computed proportions indicated that 34% of the male students and 57% of the female
students Strongly Agreed or Agreed, 43% of the male students and 19% of the female
students had No Opinion, and 23% of the male students and 24% the female students
Strongly Disagreed or Disagreed with the survey statement. Therefore, the male and
female students’ perceptions were significantly different. Further, the results
indicated that gender did influence their perceptions.
Statement 13(d) Gender. There was a significant difference in the distribution
of responses between male and female students (χ2=16.83, p=.002). Computed
118
proportions indicated that 23% of the male students and 43% of the female
students Strongly Agreed or Agreed, 48% of the males and 27% of the females had
No Opinion, and 29% of the male students and 30% of the female students Strongly
Disagreed or Disagreed with the survey statement. Therefore, the male and female
students’ perceptions were significantly different. Further, the results indicated that
gender did influence their perceptions.
Statement 13(f) Sexual orientation. There was a significant difference in the
distribution of responses between male and female students (χ2=32.45, p=.001).
Computed proportions indicated that 29% of the male students and 62% of the female
students Strongly Agreed or Agreed, 46% of the male students and 19% of the female
students had No Opinion, and 25% the male students and 19% of the female students
Strongly Disagreed or Disagreed with the survey statement. Therefore, the male and
female students’ perceptions were significantly different. Further, the results
indicated that gender did influence their perceptions.
Statement 14. These areas at my school are NOT secure and increase fear for
my safety on campus.
Statement 14(a) Bathrooms. There was no significant difference in the
distribution of responses between male and female students (χ2=6.98, p=.137).
Computed proportions indicated that 26% of the male students and 23% of the female
students Strongly Agreed or Agreed, 40% of the male students and 30% of the female
students had No Opinion, and 34% of the male students and 47% of the female
students Strongly Disagreed or Disagreed. Therefore, the male and female students’
119
perceptions were inconclusive and not statistically significant. Further, the results
indicated that gender did not influence their perceptions.
Statement 14(e) Hallways. There was a significant difference in the
distribution of responses between male and female students (χ2=13.84, p=.008).
Computed proportions indicated that 17% of the male students and 19% of the female
students Strongly Agreed or Agreed, 45% of the male students and 26% of the female
students had No Opinion, and 38% of the male students and 55% of the female
students Strongly Disagreed or Disagreed with the survey statement. Therefore, the
male and female students’ perceptions were significantly different. Further, the results
indicated that gender did influence their perceptions.
Statement 14(f) Locker rooms. There was a significant difference in the
distribution of responses between male and female students (χ2=10.22, p=.037).
Computed proportions indicated that 22% of the male students and 21% of the female
students Strongly Agreed or Agreed, 43% of the male students and 26% of the female
students had No Opinion, and 35% of the male students and 53% of the female
students Strongly Disagreed or Disagreed with the survey statement. Therefore, the
male and female students’ perceptions were significantly different. Further, the
results indicated that gender did influence their perceptions.
Statement 14(g) Parking lots. There was no significant difference in the
distribution of responses between male and female students (χ2=6.86, p=.144).
Computed proportions indicated that 20% of the male students and 28% of the female
students Strongly Agreed or Agreed, 46% of the male students and 31% of the female
120
students had No Opinion, and 34% of the male and 41% of the female students
Strongly Disagreed or Disagreed with the survey statement. Therefore, the male and
female students’ perceptions were inconclusive and not statistically significant.
Further, the results indicated that gender did not influence their perceptions.
Statement 16. I fear being physically bullied at school (hit, kicked, spit on,
pinched, tripped, shoved, slapped, and having personal items broken/stolen). There
was a significant difference in the distribution of responses between male and female
students (χ2=16.72, p=.002). Computed proportions indicated that 22% of the male
students and 44% of the female students Strongly Agreed or Agreed, 31% of the male
students and 19% of the female students had No Opinion, and 47% of the male
students and 37% of the female students Strongly Disagreed or Disagreed with the
survey statement. Therefore, the male and female students’ perceptions were
significantly different. Further, the results indicated that gender did influence their
perceptions.
Statement 17. I fear being bullied socially at school (left out, publicly
embarrassed, and spreading negative rumors). There was a significant difference in
the distribution of responses between male and female students (χ2=34.10, p=.001).
Computed proportions indicated that 20% of the male students and 53% of the female
students Strongly Agreed or Agreed, 37% of the male students and 18% of the female
students had No Opinion, and 43% of the male students and 29% of the female
students Strongly Disagreed or Disagreed with the survey statement. Therefore, the
121
male and female students’ perceptions were significantly different. Further, the
results indicated that gender did influence students’ perceptions.
Statement 18. I fear being bullied verbally at school (teasing, name calling,
insults, inappropriate comments, taunting, cussing and threats). There was a
significant difference in the distribution of responses between male and female
students (χ2=37.76, p=.001). Computed proportions indicated that 16% of the male
students and 50% of the female students Strongly Agreed or Agreed, 44% of the male
students and 24% of the female students had No Opinion, and 40% of the males and
26% of the females Strongly Disagreed or Disagreed with the survey statement.
Therefore, the male and female students’ perceptions were significantly different.
Further, the results indicated that gender did influence students’ perceptions.
Statement 21. I have avoided participating in school activities because I fear
for my safety and security. There was a significant difference in the distribution of
responses between male and female students (χ2=10.12, p=.038). Computed
proportions indicated that 5% of the male students and 15% of the female students
Strongly Agreed or Agreed, 28% of the male students and 16% of the female students
had No Opinion, and 67% of the male students and 69% of the female students
Strongly Disagreed or Disagreed with the survey statement. Therefore, the male and
female students’ perceptions were significantly different. Further, the results
indicated that gender did influence students’ perceptions.
Open-Ended Statements. Open-ended statements specifically focusing on
the research theme of personal security and safety were included in the study as a
122
method of gathering responses from the students that this researcher may have
overlooked. The open-ended statements from the Student Safety Survey that
addressed personal security and safety were 13(g) and 14(l).
Statement 13(g). Prejudice and racism are issues at my school in the
following areas and increase fear for my safety and/or the safety of other students.
Four students responded to this statement with the following comments: deformities
(1), personal style choices (1), and transgender students (2).
Statement 14(l). These areas at school are NOT secure and increase fear for
my safety on campus. Two students responded to this statement with the following
comment: classes (2).
Research Theme: Academic, Social, and Physical Well-being
H5: There is no significant difference in the distribution of responses on a
survey of high school students’ perceptions in terms of how specific fears impact
their academic, social, and physical well-being, disaggregated by ethnicity/race.
(See Tables 16 and 17 for statistical analyses.)

123
Table 16
Statistical Analysis for White and Hispanic Cohorts: Pearson Chi Square (χ2)
Survey Statements χ2 p
12. The following issues at school increase my fear level and
negatively affect me academically, socially, and/or
physically.
a) Alcohol 2.68 .615
c) Cyber bullying 2.76 .599
d) Drugs 5.70 .223
f) Gang activity 6.72 .152
l) Physical bullying 5.22 .265
m) Physical fights 2.45 .654
n) Racism 3.81 .432
p) School shooting 8.49 .075
q) Social bullying 4.79 .310
r) Student suicide 7.87 .096
s) Theft 4.74 .316
t) Vandalism 6.06 .195
u) Verbal bullying 5.20 .267
w) Weapons on campus (knives and guns) 2.59 .628
22. Because of fear I have for my safety at school, it is difficult
to concentrate on my academics.
7.14 .128
*p<.05 (null hypotheses rejected)
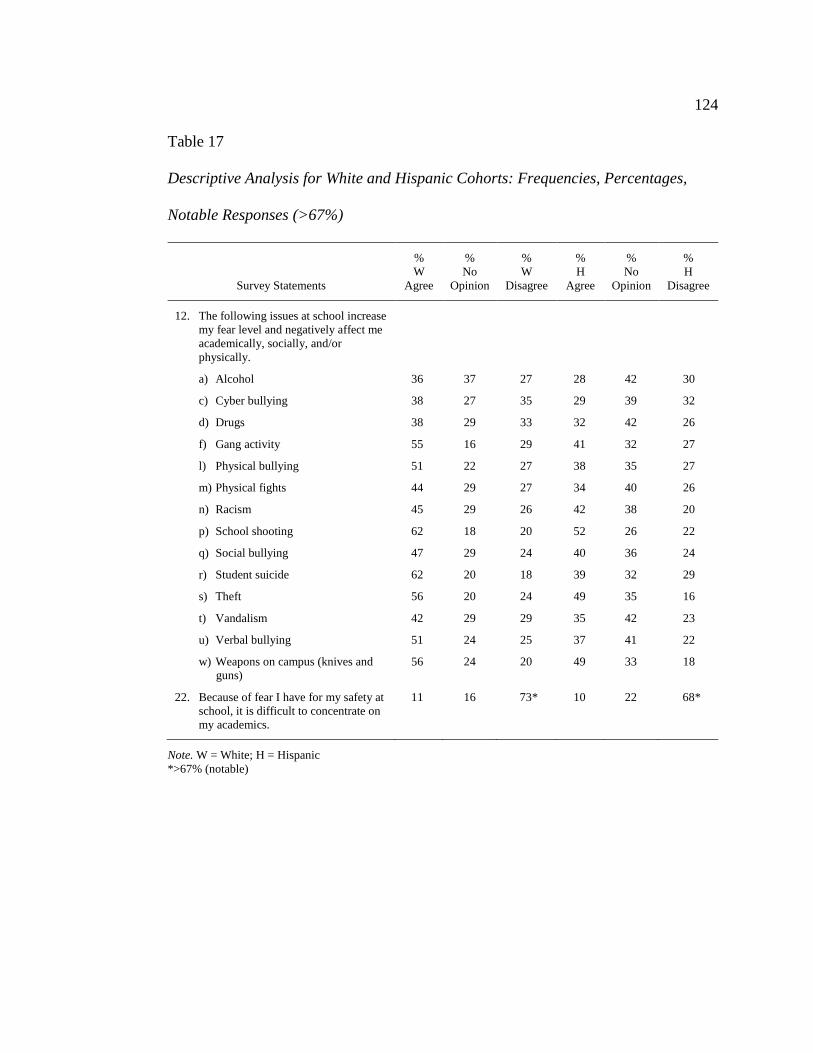
124
Table 17
Descriptive Analysis for White and Hispanic Cohorts: Frequencies, Percentages,
Notable Responses (>67%)
Survey Statements
%
W
Agree
%
No
Opinion
%
W
Disagree
%
H
Agree
%
No
Opinion
%
H
Disagree
12. The following issues at school increase
my fear level and negatively affect me
academically, socially, and/or
physically.
a) Alcohol 36 37 27 28 42 30
c) Cyber bullying 38 27 35 29 39 32
d) Drugs 38 29 33 32 42 26
f) Gang activity 55 16 29 41 32 27
l) Physical bullying 51 22 27 38 35 27
m) Physical fights 44 29 27 34 40 26
n) Racism 45 29 26 42 38 20
p) School shooting 62 18 20 52 26 22
q) Social bullying 47 29 24 40 36 24
r) Student suicide 62 20 18 39 32 29
s) Theft 56 20 24 49 35 16
t) Vandalism 42 29 29 35 42 23
u) Verbal bullying 51 24 25 37 41 22
w) Weapons on campus (knives and
guns)
56 24 20 49 33 18
22. Because of fear I have for my safety at
school, it is difficult to concentrate on
my academics.
11 16 73* 10 22 68*
Note. W = White; H = Hispanic
*>67% (notable)
125
Statement 12. The following issues at school increase my fear level and
negatively affect me academically, socially, and/or physically.
Statement 12(a) Alcohol. There was no significant difference in the
distribution of responses between White and Hispanic students (χ2=2.68, p=.615).
Computed proportions indicated that 36% of the White students and 28% of the
Hispanic students Strongly Agreed or Agreed, 37% of the White students and 42% of
the Hispanic students had No Opinion, and 27% of the White students and 30% of the
Hispanic students Strongly Disagreed or Disagreed with the survey statement.
Therefore, the White and Hispanic students’ perceptions were inconclusive and not
statistically significant. Further, the results indicated that ethnicity or race did not
influence their perceptions.
Statement 12(c) Cyber bullying. There was no significant difference in the
distribution of responses between White and Hispanic students (χ2=2.76, p=.599).
Computed proportions indicated that 38% of the White students and 29% of the
Hispanic students Strongly Agreed or Agreed, 27% of the White students and 39% of
the Hispanic students had No Opinion, and 35% of the White students and 32% of the
Hispanic students Strongly Disagreed or Disagreed with the survey statement.
Therefore, the White and Hispanic students’ perceptions were inconclusive and not
statistically significant. Further, the results indicated that ethnicity or race did not
influence their perceptions.
Statement 12(d) Drugs. There was no significant difference in the distribution
of responses between White and Hispanic students (χ2=5.70, p=.223). Computed
126
proportions indicated that 38% of the White students and 32% of the Hispanic
students Strongly Agreed or Agreed, 29% of the White students and 42% of the
Hispanic students had No Opinion, and 33% of the White students and 26% of the
Hispanic students Strongly Disagreed or Disagreed with the survey statement.
Therefore, the White and Hispanic students’ perceptions were inconclusive and not
statistically significant. Further, the results indicated that ethnicity or race did not
influence their perceptions.
Statement 12(f) Gang activity. There was no significant difference in the
distribution of responses between White and Hispanic students (χ2=6.72, p=.152).
Computed proportions indicated that 55% of the White students and 41% of the
Hispanic students Strongly Agreed or Agreed, 16% of the White students and 32% of
the Hispanic students had No Opinion, and 29% of the White students and 27% of the
Hispanic students Strongly Disagreed or Disagreed with the survey statement.
Therefore, the White and Hispanic students’ perceptions were inconclusive and not
statistically significant. Further, the results indicated that ethnicity or race did not
influence their perceptions.
Statement 12(l) Physical bullying. There was no significant difference in the
distribution of responses between White and Hispanic students (χ2=5.22, p=.265).
Computed proportions indicated that 51% of the White students and 38% of the
Hispanic students Strongly Agreed or Agreed, 22% of the White students and 35% of
the Hispanic students had No Opinion, and 27% of the White students and 27% of the
Hispanic students Strongly Disagreed or Disagreed with the survey statement.
127
Therefore, the White and Hispanic students’ perceptions were inconclusive and
not statistically significant. Further, the results indicated that ethnicity or race did not
influence their perceptions.
Statement 12(m) Physical fights. There was no significant difference in the
distribution of responses between White and Hispanic students (χ2=2.45, p=.654).
Computed proportions indicated that 44% of the White students and 34% of the
Hispanic students Strongly Agreed or Agreed, 29% of the White students and 40% of
the Hispanic students had No Opinion, and 27% of the White students and 26% of the
Hispanic students Strongly Disagreed or Disagreed with the survey statement.
Therefore, the White and Hispanic students’ perceptions were inconclusive and not
statistically significant. Further, the results indicated that ethnicity or race did not
influence their perceptions.
Statement 12(n) Racism. There was no significant difference in the
distribution of responses between White and Hispanic students (χ2=3.81, p=.432).
Computed proportions indicated that 45% of the White students and 42% of the
Hispanic students Strongly Agreed or Agreed, 29% of the White students and 38% of
the Hispanic students had No Opinion, and 26% of the White students and 20% of the
Hispanic students Strongly Disagreed or Disagreed with the survey statement.
Therefore, the White and Hispanic students’ perceptions were inconclusive and not
statistically significant. Further, the results indicated that ethnicity or race did not
influence their perceptions.
128
Statement 12(p) School shooting. There was no significant difference in
the distribution of responses between White and Hispanic students (χ2=8.49, p=.075).
Computed proportions indicated that 62% of the White students and 52% of the
Hispanic students Strongly Agreed or Agreed, 18% of the White students and 26% of
the Hispanic students had No Opinion, and 20% of the White students and 22% of the
Hispanic students Strongly Disagreed or Disagreed with the survey statement.
Therefore, the White and Hispanic students’ perceptions were inconclusive and not
statistically significant. Further, the results indicated that ethnicity or race did not
influence their perceptions.
Statement 12(q) Social bullying. There was no significant difference in the
distribution of responses between White and Hispanic students (χ2=4.79, p=.310).
Computed proportions indicated that 47% of the White students and 40% of the
Hispanic students Strongly Agreed or Agreed, 29% of the White students and 36% of
the Hispanic students had No Opinion, and 24% of the White students and 24% of the
Hispanic students Strongly Disagreed or Disagreed with the survey statement.
Therefore, the White and Hispanic students’ perceptions were inconclusive and not
statistically significant. Further, the results indicated that ethnicity or race did not
influence their perceptions.
Statement 12(r) Student suicide. There was no significant difference in the
distribution of responses between White and Hispanic students (χ2=7.87, p=.096).
Computed proportions indicated that 62% of the White students and 39% of the
Hispanic students Strongly Agreed or Agreed, 20% of the White students and 32% of
129
the Hispanic students had No Opinion, and 18% of the White students and 29% of
the Hispanic students Strongly Disagreed or Disagreed with the survey statement.
Therefore, the White and Hispanic students’ perceptions were inconclusive and not
statistically significant. Further, the results indicated that ethnicity or race did not
influence their perceptions.
Statement 12(s) Theft. There was no significant difference in the distribution
of responses between White and Hispanic students (χ2=4.74, p=.316). Computed
proportions indicated that 56% of the White students and 49% of the Hispanic
students Strongly Agreed or Agreed, 20% of the White students and 35% of the
Hispanic students had No Opinion, and 24% of the White students and 16% of the
Hispanic students Strongly Disagreed or Disagreed with the survey statement.
Therefore, the White and Hispanic students’ perceptions were inconclusive and not
statistically significant. Further, the results indicated that ethnicity or race did not
influence their perceptions.
Statement 12(t) Vandalism. There was no significant difference in the
distribution of responses between White and Hispanic students (χ2=6.06, p=.195).
Computed proportions indicated that 42% of the White students and 35% of the
Hispanic students Strongly Agreed or Agreed, 29% of the White students and 42% of
the Hispanic students had No Opinion, and 29% of the White students and 23% of the
Hispanic students Strongly Disagreed or Disagreed with the survey statement.
Therefore, the White and Hispanic students’ perceptions were inconclusive and not
130
statistically significant. Further, the results indicated that ethnicity or race did not
influence their perceptions.
Statement 12(u) Verbal bullying. There was no significant difference in the
distribution of responses between White and Hispanic students (χ2=5.20, p=.267).
Computed proportions indicated that 51% of the White students and 37% of the
Hispanic students Strongly Agreed or Agreed, 24% of the White students and 41% of
the Hispanic students had No Opinion, and 25% of the White students and 22% of the
Hispanic students Strongly Disagreed or Disagreed with the survey statement.
Therefore, the White and Hispanic students’ perceptions were inconclusive and not
statistically significant. Further, the results indicated that ethnicity or race did not
influence their perceptions.
Statement 12(w) Weapons on campus (knives and guns). There was no
significant difference in the distribution of responses between White and Hispanic
students (χ2=2.59, p=.628). Computed proportions indicated that 56% of the White
students and 49% of the Hispanic students Strongly Agreed or Agreed, 24% of the
White students and 33% of the Hispanic students had No Opinion, and 20% of the
White students and 18% of the Hispanic students Strongly Disagreed or Disagreed
with the survey statement. Therefore, the White and Hispanic students’ perceptions
were inconclusive and not statistically significant. Further, the results indicated that
ethnicity or race did not influence their perceptions.
22. Because of the fear I have for my safety at school, it is difficult to
concentrate on my academics. There was no significant difference in the distribution

131
of responses between White and Hispanic students (χ2=7.14, p=.128). Computed
proportions indicated that 11% of the White students and 10% of the Hispanic
students Strongly Agreed or Agreed, 16% of the White students and 22% of the
Hispanic students had No Opinion, and 73% of the White students and 68% of the
Hispanic students Strongly Disagreed or Disagreed with the survey statement. Their
perceptions were notable due to the cohorts’ high response rate in the Strongly
Disagree and Disagree cells (>67%). Further, the results indicated that ethnicity or
race did not influence their perceptions.
H6: There is no significant difference in the distribution of responses on a
survey of high school students’ perceptions in terms of how specific fears impact
their academic, social, and physical well-being, disaggregated by socioeconomic
status. (See Tables 18 and 19 for statistical analyses.)

132
Table 18
Statistical Analysis for Eligible and Not-Eligible Cohorts: Pearson Chi Square (χ2)
Survey Statements χ2 p
12. The following issues at school increase my fear level and
negatively affect me academically, socially, and/or
physically.
a) Alcohol 1.51 .825
c) Cyber bullying 1.37 .850
d) Drugs 4.31 .365
f) Gang activity 4.24 .375
l) Physical bullying 2.38 .667
m) Physical fights 2.55 .636
n) Racism 1.99 .738
p) School shooting .523 .971
q) Social bullying 3.01 .555
r) Student suicide 3.48 .482
s) Theft 1.22 .875
t) Vandalism 3.52 .476
u) Verbal bullying 1.35 .854
w) Weapons on campus (knives and guns) .556 .968
22. Because of fear I have for my safety at school, it is difficult
to concentrate on my academics.
12.70 .013*
*p<.05 (null hypotheses rejected)
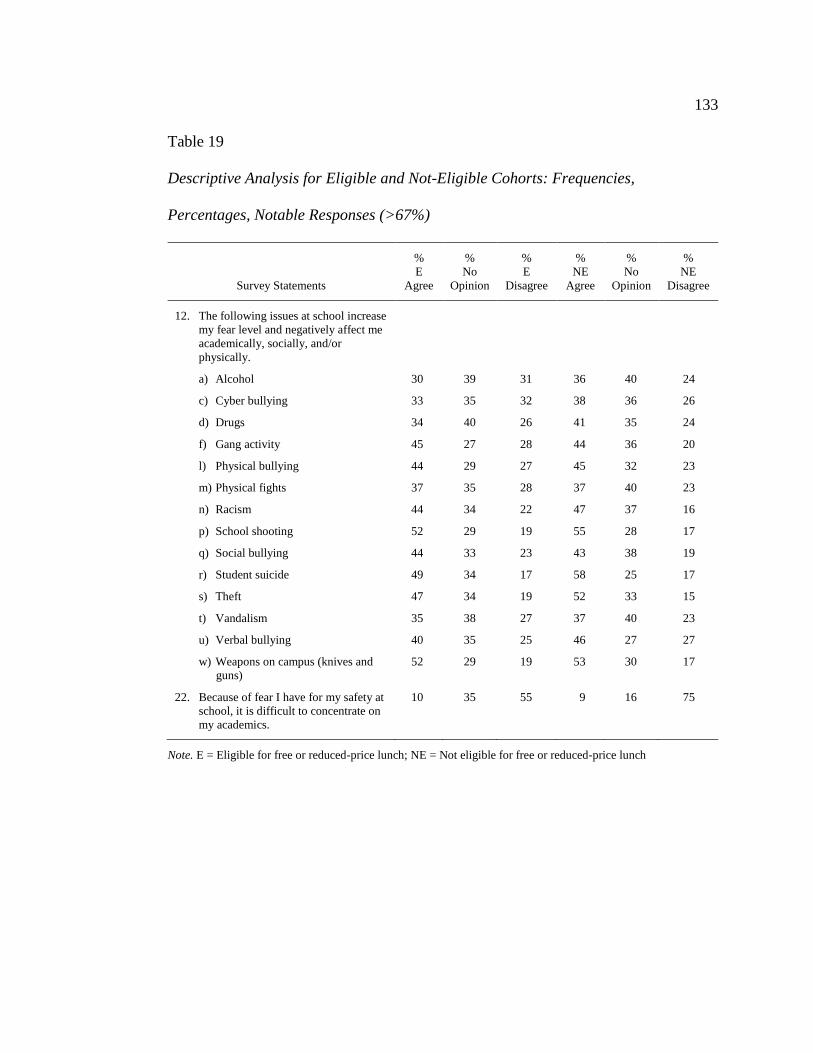
133
Table 19
Descriptive Analysis for Eligible and Not-Eligible Cohorts: Frequencies,
Percentages, Notable Responses (>67%)
Survey Statements
%
E
Agree
%
No
Opinion
%
E
Disagree
%
NE
Agree
%
No
Opinion
%
NE
Disagree
12. The following issues at school increase
my fear level and negatively affect me
academically, socially, and/or
physically.
a) Alcohol 30 39 31 36 40 24
c) Cyber bullying 33 35 32 38 36 26
d) Drugs 34 40 26 41 35 24
f) Gang activity 45 27 28 44 36 20
l) Physical bullying 44 29 27 45 32 23
m) Physical fights 37 35 28 37 40 23
n) Racism 44 34 22 47 37 16
p) School shooting 52 29 19 55 28 17
q) Social bullying 44 33 23 43 38 19
r) Student suicide 49 34 17 58 25 17
s) Theft 47 34 19 52 33 15
t) Vandalism 35 38 27 37 40 23
u) Verbal bullying 40 35 25 46 27 27
w) Weapons on campus (knives and
guns)
52 29 19 53 30 17
22. Because of fear I have for my safety at
school, it is difficult to concentrate on
my academics.
10 35 55 9 16 75
Note. E = Eligible for free or reduced-price lunch; NE = Not eligible for free or reduced-price lunch
134
Statement 12. The following issues at school increase my fear level and
negatively affect me academically, socially, and/or physically.
Statement 12(a) Alcohol. There was no significant difference in the
distribution of responses between eligible and not-eligible students (χ2=1.51, p=.825).
Computed proportions indicated that 30% of the eligible students and 36% of the not-
eligible students Strongly Agreed or Agreed, 39% of the eligible students and 40% of
the not-eligible students had No Opinion, and 31% of the eligible students and 24% of
not-eligible students Strongly Disagreed or Disagreed with the survey statement.
Therefore, the eligible and not-eligible students’ perceptions were inconclusive and
not statistically significant. Further, the results indicated that socioeconomic status
did not influence their perceptions.
Statement 12(c) Cyber bullying. There was no significant difference in the
distribution of responses between eligible and not-eligible students (χ2=1.37, p=.850).
Computed proportions indicated that 33% of the eligible students and 38% of the not-
eligible students Strongly Agreed or Agreed, 35% of the eligible students and 36% of
the not-eligible students had No Opinion, and 32% of the eligible students and 26% of
the not-eligible students Strongly Disagreed or Disagreed with the survey statement.
Therefore, the eligible and not-eligible students’ perceptions were inconclusive and
not statistically significant. Further, the results indicated that socioeconomic status
did not influence their perceptions.
Statement 12(d) Drugs. There was no significant difference in the distribution
of responses between eligible and not-eligible students (χ2=4.31, p=.365). Computed
135
proportions indicated that 34% of the eligible students and 41% of the not-eligible
students Strongly Agreed or Agreed, 40% of the eligible students and 35% of the not-
eligible students had No Opinion, and 26% of the eligible students and 24% of the
not-eligible students Strongly Disagreed or Disagreed with the survey statement.
Therefore, the eligible and not-eligible students’ perceptions were inconclusive and
not statistically significant. Further, the results indicated that socioeconomic status
did not influence their perceptions.
Statement 12(f) Gang activity. There was no significant difference in the
distribution of responses between eligible and not-eligible students (χ2=4.24, p=.375).
Computed proportions indicated that 45% of the eligible students and 44% of the not-
eligible students Strongly Agreed or Agreed, 27% of the eligible students and 36% of
the not-eligible students had No Opinion, and 28% of the eligible students and 20% of
the not-eligible students Strongly Disagreed or Disagreed with the survey statement.
Therefore, the eligible and not-eligible students’ perceptions were inconclusive and
not statistically significant. Further, the results indicated that socioeconomic status
did not influence their perceptions.
Statement 12(l) Physical bullying. There was no significant difference in the
distribution of responses between eligible and not-eligible students (χ2=2.38, p=.667).
Computed proportions indicated that 44% of the eligible students and 45% of the not-
eligible students Strongly Agreed or Agreed, 29% of the eligible students and 32% of
the not-eligible students had no opinion, and 27% of the eligible students and 23% of
the not-eligible students Strongly Disagreed or Disagreed with the survey statement.
136
Therefore, the eligible and not-eligible students’ perceptions were inconclusive
and not statistically significant. Further, the results indicated that socioeconomic
status did not influence their perceptions.
Statement 12(m) Physical fights. There was no significant difference in the
distribution of responses between eligible and not-eligible students (χ2=2.55, p=.636).
Computed proportions indicated that 37% of the eligible students and 37% of the not-
eligible students Strongly Agreed or Agreed, 35% of the eligible students and 40% of
the not-eligible students had No Opinion, and 28% of the eligible students and 23% of
the not-eligible students Strongly Disagreed or Disagreed with the survey statement.
Therefore, the eligible and not-eligible students’ perceptions were inconclusive and
not statistically significant. Further, the results indicated that socioeconomic status
did not influence their perceptions.
Statement 12(n) Racism. There was no significant difference in the
distribution of responses between eligible and not-eligible students (χ2=1.99, p=.738).
Computed proportions indicated that 44% of the eligible students and 47% of the not-
eligible students Strongly Agreed or Agreed, 34% of the eligible students and 37% of
the not-eligible students had No Opinion, and 22% of the eligible students and 16% of
the not-eligible students Strongly Disagreed or Disagreed with the survey statement.
Therefore, eligible and not eligible students’ perceptions were inconclusive and not
statistically significant. Further, the results indicated that socioeconomic status did
not influence their perceptions.
137
Statement 12(p) School shooting. There was no significant difference in
the distribution of responses between eligible and not-eligible students (χ2=.523,
p=.971). Computed proportions indicated that 52% of the eligible students and 55%
of the not-eligible students Strongly Agreed or Agreed, 29% of the eligible students
and 28% of the not-eligible students had No Opinion, and 19% of the eligible students
and 17% of the not-eligible students Strongly Disagreed or Disagreed with the survey
statement. Therefore, the eligible and not-eligible students’ perceptions were
inconclusive and not statistically significant. Further, the results indicated that
socioeconomic status did not influence their perceptions.
Statement 12(q) Social bullying. There was no significant difference in the
distribution of responses between eligible and not-eligible students (χ2=3.01, p=.555).
Computed proportions indicated that 44% of the eligible students and 43% of the not-
eligible students Strongly Agreed or Agreed, 33% of the eligible students and 38% of
the not-eligible students had No Opinion, and 23% of the eligible students and 19% of
the not-eligible students Strongly Disagreed or Disagreed with the survey statement.
Therefore, the eligible and not-eligible students’ perceptions were inconclusive and
not statistically significant. Further, the results indicated that socioeconomic status
did not influence their perceptions.
Statement 12(r) Student suicide. There was no significant difference in the
distribution of responses between eligible and not-eligible students (χ2=3.48, p=.482).
Computed proportions indicated that 49% of the eligible students and 58% of the not-
eligible students Strongly Agreed or Agreed, 34% of the eligible students and 25% of
138
the not-eligible students had No Opinion, and 17% of the eligible students and
17% of the not-eligible students Strongly Disagreed or Disagreed with the survey
statement. Therefore, the eligible and not-eligible students’ perceptions were
inconclusive and not statistically significant. Further, the results indicated that
socioeconomic status did not influence their perceptions.
Statement 12(s) Theft. There was no significant difference in the distribution
of responses between eligible and not-eligible students (χ2=1.22, p=.875). Computed
proportions indicated that 47% of the eligible students and 52% of the not-eligible
students Strongly Agreed or Agreed, 34% of the eligible students and 33% of the not-
eligible students had No Opinion, and 19% of the eligible students and 15% of the
not-eligible students Strongly Disagreed or Disagreed with the survey statement.
Therefore, the eligible and not-eligible students’ perceptions were inconclusive and
not statistically significant. Further, the results indicated that socioeconomic status
did not influence their perceptions.
Statement 12(t) Vandalism. There was no significant difference in the
distribution of responses between eligible and not-eligible students (χ2=3.52, p=.476).
Computed proportions indicated that 35% of the eligible students and 37% of the not-
eligible students Strongly Agreed or Agreed, 38% of the eligible students and 40% of
the not-eligible students had No Opinion, and 27% of the eligible students and 23% of
the not-eligible students Strongly Disagreed or Disagreed with the survey statement.
Therefore, the eligible and not-eligible students’ perceptions were inconclusive and
139
not statistically significant. Further, the results indicated that socioeconomic
status did not influence their perceptions.
Statement 12(u) Verbal bullying. There was no significant difference in the
distribution of responses between eligible and not-eligible students (χ2=1.35, p=.854).
Computed proportions indicated that 40% of the eligible students and 46% of the not-
eligible students Strongly Agreed or Agreed, 35% of the eligible students and 27% of
the not-eligible students had No Opinion, and 25% of the eligible students and 27% of
the not-eligible students Strongly Disagreed or Disagreed with the survey statement.
Therefore, the eligible and not-eligible students’ perceptions were inconclusive and
not statistically significant. Further, the results indicated that socioeconomic status
did not influence their perceptions.
Statement 12(w) Weapons on campus (knives and guns). There was no
significant difference in the distribution of responses between eligible and not-eligible
students (χ2=.556, p=.968). Computed proportions indicated that 52% of the eligible
students and 53% of the not-eligible students Strongly Agreed or Agreed, 29% of the
eligible students and 30% of the not-eligible students had No Opinion, and 19% of the
eligible students and 17% of the not-eligible students Strongly Disagreed or
Disagreed with the survey statement. Therefore, the eligible and not-eligible
students’ perceptions were inconclusive and not statistically significant. Further, the
results indicated that socioeconomic status did not influence their perceptions.
22. Because of the fear I have for my safety at school, it is difficult to
concentrate on my academics. There was a significant difference in the distribution
140
of responses between eligible and not-eligible students (χ2=12.70, p=.013).
Computed proportions indicated that 10% of the eligible students and 9% of the not-
eligible students Strongly Agreed or Agreed, 35% of the eligible students and 16% of
the not-eligible students had No Opinion, and 55% of the eligible students and 75% of
the not-eligible students Strongly Disagreed or Disagreed with the survey statement.
Therefore, the eligible and not-eligible students’ perceptions were significantly
different. Further, the results indicated that socioeconomic status did influence their
perceptions.
H7: There is no significant difference in the distribution of responses on a
survey of high school students’ perceptions in terms of how specific fears impact
their academic, social, and physical well-being, disaggregated by grade level.
(See Tables 20 and 21 for statistical analyses.)
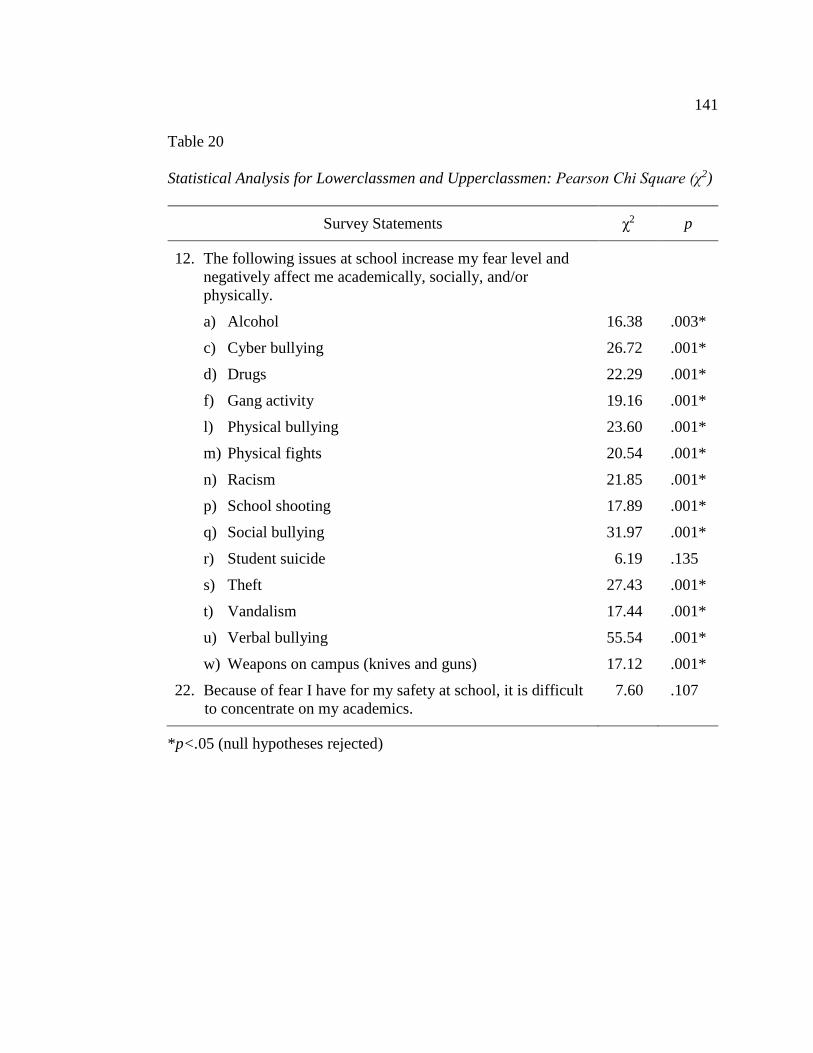
141
Table 20
Statistical Analysis for Lowerclassmen and Upperclassmen: Pearson Chi Square (χ2)
Survey Statements χ2 p
12. The following issues at school increase my fear level and
negatively affect me academically, socially, and/or
physically.
a) Alcohol 16.38 .003*
c) Cyber bullying 26.72 .001*
d) Drugs 22.29 .001*
f) Gang activity 19.16 .001*
l) Physical bullying 23.60 .001*
m) Physical fights 20.54 .001*
n) Racism 21.85 .001*
p) School shooting 17.89 .001*
q) Social bullying 31.97 .001*
r) Student suicide 6.19 .135
s) Theft 27.43 .001*
t) Vandalism 17.44 .001*
u) Verbal bullying 55.54 .001*
w) Weapons on campus (knives and guns) 17.12 .001*
22. Because of fear I have for my safety at school, it is difficult
to concentrate on my academics.
7.60 .107
*p<.05 (null hypotheses rejected)
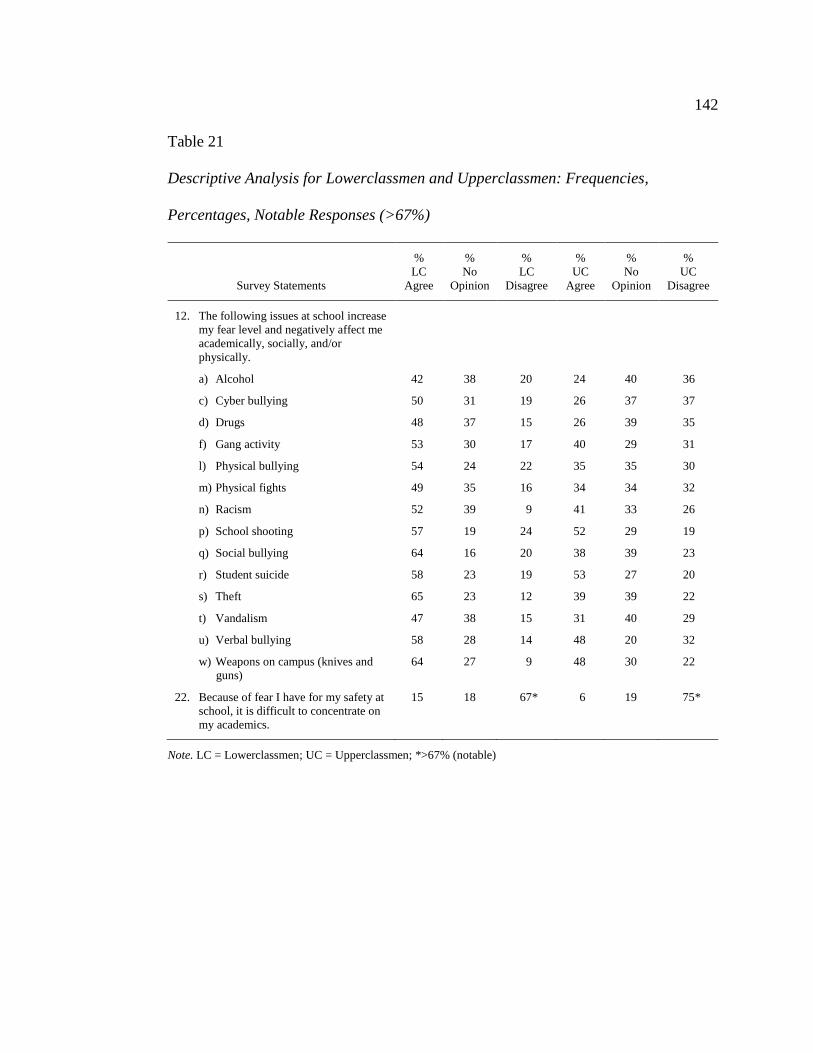
142
Table 21
Descriptive Analysis for Lowerclassmen and Upperclassmen: Frequencies,
Percentages, Notable Responses (>67%)
Survey Statements
%
LC
Agree
%
No
Opinion
%
LC
Disagree
%
UC
Agree
%
No
Opinion
%
UC
Disagree
12. The following issues at school increase
my fear level and negatively affect me
academically, socially, and/or
physically.
a) Alcohol 42 38 20 24 40 36
c) Cyber bullying 50 31 19 26 37 37
d) Drugs 48 37 15 26 39 35
f) Gang activity 53 30 17 40 29 31
l) Physical bullying 54 24 22 35 35 30
m) Physical fights 49 35 16 34 34 32
n) Racism 52 39 9 41 33 26
p) School shooting 57 19 24 52 29 19
q) Social bullying 64 16 20 38 39 23
r) Student suicide 58 23 19 53 27 20
s) Theft 65 23 12 39 39 22
t) Vandalism 47 38 15 31 40 29
u) Verbal bullying 58 28 14 48 20 32
w) Weapons on campus (knives and
guns)
64 27 9 48 30 22
22. Because of fear I have for my safety at
school, it is difficult to concentrate on
my academics.
15 18 67* 6 19 75*
Note. LC = Lowerclassmen; UC = Upperclassmen; *>67% (notable)
143
Statement 12. The following issues at school increase my fear level and
negatively affect me academically, socially, and/or physically.
Statement 12(a) Alcohol. There was a significant difference in the distribution
of responses between LC and UC students (χ2=16.38, p=.003). Computed
proportions indicated that 42% of the LC students and 24% of the UC students
Strongly Agreed or Agreed, 38% of the LC students and 40% of the UC students had
No Opinion, and 20% of the LC students and 36% of the UC students Strongly
Disagreed or Disagreed with the survey statement. Therefore, the LC and UC
students’ perceptions were significantly different. Further, the results indicated that
grade level did influence their perceptions.
Statement 12(c) Cyber bullying. There was a significant difference in the
distribution of responses between LC and UC students (χ2=26.72, p=.001).
Computed proportions indicated that 50% of the LC students and 26% of the UC
students Strongly Agreed or Agreed, 31% of the LC students and 37% of the UC
students had No Opinion, and 19% of the LC students and 37% of the UC students
Strongly Disagreed or Disagreed with the survey statement. Therefore, the LC and
UC students’ perceptions were significantly different. Further, the results indicated
that grade level did influence their perceptions.
Statement 12(d) Drugs. There was a significant difference in the distribution
of responses between LC and UC students (χ2=22.29, p=.001). Computed
proportions indicated that 48% of the LC students and 26% of the UC students
Strongly Agreed or Agreed, 37% of the LC students and 39% of the UC students had
144
no opinion, and 15% of the LC students and 35% of the UC students Strongly
Disagreed or Disagreed with the survey statement. Therefore, the LC and UC
students’ perceptions were significantly different. Further, the results indicated that
grade level did influence their perceptions.
Statement 12(f) Gang activity. There was a significant difference in the
distribution of responses between LC and UC students (χ2=19.16, p=.001).
Computed proportions indicated that 53% of the LC students and 40% of the UC
students Strongly Agreed or Agreed, 30% of the LC students and 29% of the UC
students had No Opinion, and 17% of the LC students and 31% of the UC students
Strongly Disagreed or Disagreed with the survey statement. Therefore, the LC and
UC students’ perceptions were significantly different. Further, the results indicated
that grade level did influence their perceptions.
Statement 12(l) Physical bullying. There was a significant difference in the
distribution of responses between LC and UC students (χ2=23.60, p=.001).
Computed proportions indicated that 54% of the LC students and 35% of the UC
students Strongly Agreed or Agreed, 24% of the LC students and 35% of the UC
students had No Opinion, and 22% of the LC students and 30% of the UC students
Strongly Disagreed or Disagreed with the survey statement. Therefore, the LC and
UC students’ perceptions were significantly different. Further, the results indicated
that grade level did influence their perceptions.
Statement 12(m) Physical fights. There was a significant difference in the
distribution of responses between LC and UC students (χ2=20.54, p=.001).
145
Computed proportions indicated that 49% of the LC students and 34% of the UC
students Strongly Agreed or Agreed, 35% of the LC students and 34% of the UC
students had No Opinion, and 16% of the LC students and 32% of the UC students
Strongly Disagreed or Disagreed with the survey statement. Therefore, the LC and
UC students’ perceptions were significantly different. Further, the results indicated
that grade level did influence their perceptions.
Statement 12(n) Racism. There was a significant difference in the distribution
of responses between LC and UC students (χ2=21.85, p=.001). Computed
proportions indicated that 52% of the LC students and 41% of the UC students
Strongly Agreed or Agreed, 39% of the LC students and 33% of the UC students had
No Opinion, and 9% of the LC students and 26% of the UC students Strongly
Disagreed or Disagreed with the survey statement. Therefore, the LC and UC
students’ perceptions were significantly different. Further, the results indicated that
grade level did influence their perceptions.
Statement 12(p) School shooting. There was a significant difference in the
distribution of responses between LC and UC students (χ2=17.89, p=.001).
Computed proportions indicated that 57% of the LC students and 52% of the UC
students Strongly Agreed or Agreed, 19% of the LC students and 29% of the UC
students had No Opinion, and 24% of the LC students and 19% of the UC students
Strongly Disagreed or Disagreed with the survey statement. Therefore, the LC and
UC students’ perceptions were significantly different. Further, the results indicated
that grade level did influence their perceptions.
146
Statement 12(q) Social bullying. There was a significant difference in the
distribution of responses between LC and UC students (χ2=31.97, p=.001).
Computed proportions indicated that 64% of the LC students and 38% of the UC
students Strongly Agreed or Agreed, 16% of the LC students and 39% of the UC
students had No Opinion, and 20% of the LC students and 23% of the UC students
Strongly Disagreed or Disagreed with the survey statement. Therefore, the LC and
UC students’ perceptions were significantly different. Further, the results indicated
that grade level did influence their perceptions.
Statement 12(r) Student suicide. There was no significant difference in the
distribution of responses between LC and UC students (χ2=6.19, p=.135). Computed
proportions indicated that 58% of the LC students and 53% of the UC students
Strongly Agreed or Agreed, 23% of the LC students and 27% of the UC students had
No Opinion, and 19% of the LC students and 20% of the UC students Strongly
Disagreed or Disagreed with the survey statement. Therefore, the LC and UC
students’ perceptions were inconclusive and not statistically significant. Further, the
results indicated that grade level did not influence their perceptions.
Statement 12(s) Theft. There was a significant difference in the distribution of
responses between LC and UC students (χ2=27.43, p=.001). Computed proportions
indicated that 65% of the LC students and 39% of the UC students Strongly Agreed or
Agreed, 23% of the LC students and 39% of the UC students had No Opinion, and
12% of the LC students and 22% of the UC students Strongly Disagreed or Disagreed
with the survey statement. Therefore, the LC and UC students’ perceptions were
147
significantly different. Further, the results indicated that grade level did influence
their perceptions.
Statement 12(t) Vandalism. There was a significant difference in the
distribution of responses between LC and UC students (χ2=17.44, p=.001).
Computed proportions indicated that 47% of the LC students and 31% of the UC
students Strongly Agreed or Agreed, 38% of the LC students and 40% of the UC
students had No Opinion, and 15% of the LC students and 29% of the UC students
Strongly Disagreed or Disagreed with the survey statement. Therefore, the LC and
UC students’ perceptions were significantly different. Further, the results indicated
that grade level did influence their perceptions.
Statement 12(u) Verbal bullying. There was a significant difference in the
distribution of responses between LC and UC students (χ2=55.54, p=.001).
Computed proportions indicated that 58% of the LC students and 48% of the UC
students Strongly Agreed or Agreed, 28% of the LC students and 20% of the UC
students had No Opinion, and 14% of the LC students and 32% of the UC students
Strongly Disagreed or Disagreed with the survey statement. Therefore, the LC and
UC students’ perceptions were significantly different. Further, the results indicated
that grade level did influence their perceptions.
Statement 12(w) Weapons on campus (knives and guns). There was no
significant difference in the distribution of responses between LC and UC students
(χ2=17.12, p=.001). Computed proportions indicated that 64% of the LC students and
48% of the UC students Strongly Agreed or Agreed, 27% of the LC students and 30%
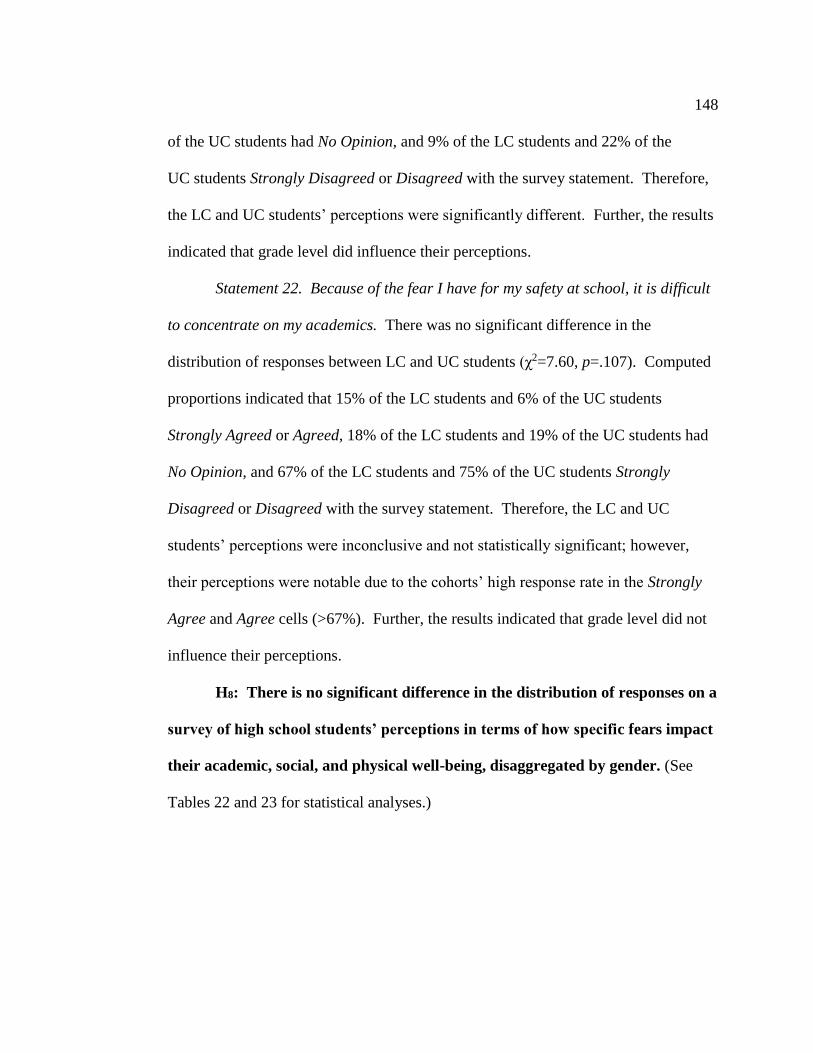
148
of the UC students had No Opinion, and 9% of the LC students and 22% of the
UC students Strongly Disagreed or Disagreed with the survey statement. Therefore,
the LC and UC students’ perceptions were significantly different. Further, the results
indicated that grade level did influence their perceptions.
Statement 22. Because of the fear I have for my safety at school, it is difficult
to concentrate on my academics. There was no significant difference in the
distribution of responses between LC and UC students (χ2=7.60, p=.107). Computed
proportions indicated that 15% of the LC students and 6% of the UC students
Strongly Agreed or Agreed, 18% of the LC students and 19% of the UC students had
No Opinion, and 67% of the LC students and 75% of the UC students Strongly
Disagreed or Disagreed with the survey statement. Therefore, the LC and UC
students’ perceptions were inconclusive and not statistically significant; however,
their perceptions were notable due to the cohorts’ high response rate in the Strongly
Agree and Agree cells (>67%). Further, the results indicated that grade level did not
influence their perceptions.
H8: There is no significant difference in the distribution of responses on a
survey of high school students’ perceptions in terms of how specific fears impact
their academic, social, and physical well-being, disaggregated by gender. (See
Tables 22 and 23 for statistical analyses.)
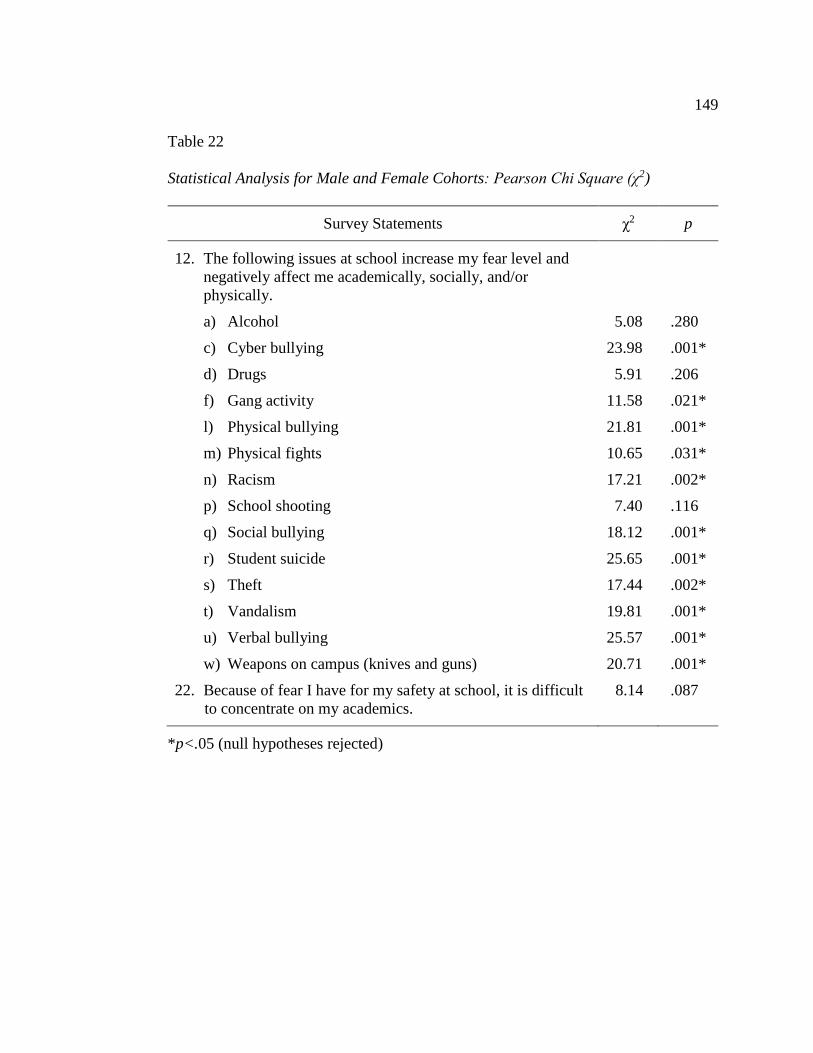
149
Table 22
Statistical Analysis for Male and Female Cohorts: Pearson Chi Square (χ2)
Survey Statements χ2 p
12. The following issues at school increase my fear level and
negatively affect me academically, socially, and/or
physically.
a) Alcohol 5.08 .280
c) Cyber bullying 23.98 .001*
d) Drugs 5.91 .206
f) Gang activity 11.58 .021*
l) Physical bullying 21.81 .001*
m) Physical fights 10.65 .031*
n) Racism 17.21 .002*
p) School shooting 7.40 .116
q) Social bullying 18.12 .001*
r) Student suicide 25.65 .001*
s) Theft 17.44 .002*
t) Vandalism 19.81 .001*
u) Verbal bullying 25.57 .001*
w) Weapons on campus (knives and guns) 20.71 .001*
22. Because of fear I have for my safety at school, it is difficult
to concentrate on my academics.
8.14 .087
*p<.05 (null hypotheses rejected)
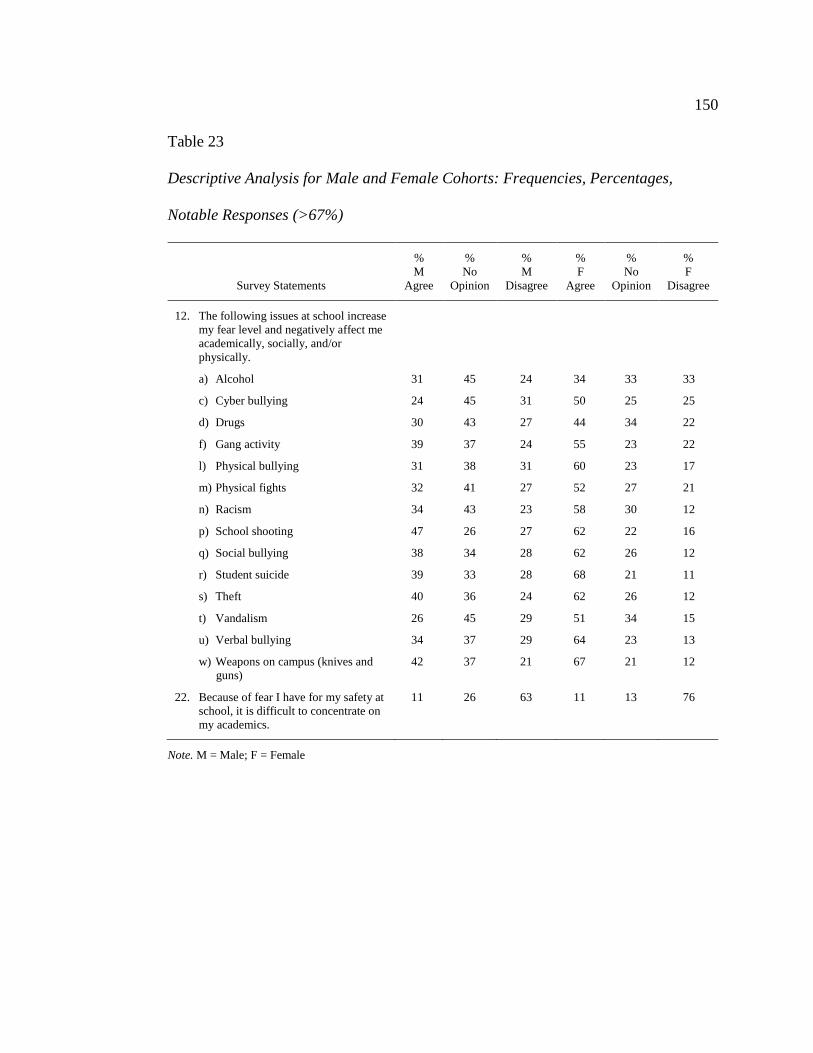
150
Table 23
Descriptive Analysis for Male and Female Cohorts: Frequencies, Percentages,
Notable Responses (>67%)
Survey Statements
%
M
Agree
%
No
Opinion
%
M
Disagree
%
F
Agree
%
No
Opinion
%
F
Disagree
12. The following issues at school increase
my fear level and negatively affect me
academically, socially, and/or
physically.
a) Alcohol 31 45 24 34 33 33
c) Cyber bullying 24 45 31 50 25 25
d) Drugs 30 43 27 44 34 22
f) Gang activity 39 37 24 55 23 22
l) Physical bullying 31 38 31 60 23 17
m) Physical fights 32 41 27 52 27 21
n) Racism 34 43 23 58 30 12
p) School shooting 47 26 27 62 22 16
q) Social bullying 38 34 28 62 26 12
r) Student suicide 39 33 28 68 21 11
s) Theft 40 36 24 62 26 12
t) Vandalism 26 45 29 51 34 15
u) Verbal bullying 34 37 29 64 23 13
w) Weapons on campus (knives and
guns)
42 37 21 67 21 12
22. Because of fear I have for my safety at
school, it is difficult to concentrate on
my academics.
11 26 63 11 13 76
Note. M = Male; F = Female
151
Statement 12. The following issues at school increase my fear level and
negatively affect me academically, socially, and/or physically.
Statement 12(a) Alcohol. There was no significant difference in the
distribution of responses between male and female students (χ2=5.80, p=.280).
Computed proportions indicated that 31% of the male students and 34% of the female
students Strongly Agreed or Agreed, 45% of the male students and 33% of the female
students had No Opinion, and 24% of the male students and 33% of the female
students Strongly Disagreed or Disagreed with the survey statement. Therefore, the
male and female students’ perceptions were inconclusive and not statistically
significant. Further, the results indicated that gender did not influence their
perceptions.
Statement 12(c) Cyber bullying. There was a significant difference in the
distribution of responses between male and female students (χ2=23.98, p=.001).
Computed proportions indicated that 24% of the male students and 50% of the female
students Strongly Agreed or Agreed, 45% of the male students and 25% of the female
students had No Opinion, and 31% of the male students and 25% of the female
students Strongly Disagreed or Disagreed with the survey statement. Therefore, the
male and female students’ perceptions were significantly different. Further, the
results indicated that gender did not influence their perceptions.
Statement 12(d) Drugs. There was no significant difference in the distribution
of responses between male and female students (χ2=5.91, p=.206). Computed
proportions indicated that 30% of the male students and 44% of the female students
152
Strongly Agreed or Agreed, 43% of the male students and 34% of the female
students had No Opinion, and 27% of the male students and 22% of the female
students Strongly Disagreed or Disagreed with the survey statement. Therefore, the
male and female students’ perceptions were inconclusive and not statistically
significant. Further, the results indicated that gender did not influence their
perceptions.
Statement 12(f) Gang activity. There was a significant difference in the
distribution of responses between male and female students (χ2=11.58, p=.021).
Computed proportions indicated that 39% of the male students and 55% of the female
students Strongly Agreed or Agreed, 37% of the male students and 23% of the female
students had No Opinion, and 24% of the male students and 22% of the female
students Strongly Disagreed or Disagreed with the survey statement. Therefore, the
male and female students’ perceptions were significantly different. Further, the
results indicated that gender did influence their perceptions.
Statement 12(l) Physical bullying. There was a significant difference in the
distribution of responses between male and female students (χ2=21.81, p=.001).
Computed proportions indicated that 31% of the male students and 60% of the female
students Strongly Agreed or Agreed, 38% of the male students and 23% of the female
students had No Opinion, and 31% of the male students and 17% of the female
students Strongly Disagreed or Disagreed with the survey statement. Therefore, the
male and female students’ perceptions were significantly different. Further, the
results indicated that gender did influence their perceptions.
153
Statement 12(m) Physical fights. There was a significant difference in the
distribution of responses between male and female students (χ2=10.65, p=.031).
Computed proportions indicated that 32% of the male students and 52% of the female
students Strongly Agreed or Agreed, 41% of the male students and 27% of the female
students had No Opinion, and 27% of the male students and 21% of the female
students Strongly Disagreed or Disagreed with the survey statement. Therefore, the
male and female students’ perceptions were significantly different. Further, the
results indicated that gender did influence their perceptions.
Statement 12(n) Racism. There was a significant difference in the distribution
of responses between male and female students (χ2=17.21, p=.002). Computed
proportions indicated that 34% of the male students and 58% of the female students
Strongly Agreed or Agreed, 43% of the male students and 30% of the female students
had No Opinion, and 23% of the male students and 12% of the female students
Strongly Disagreed or Disagreed with the survey statement. Therefore, the male and
female students’ perceptions were significantly different. Further, the results
indicated that gender did influence their perceptions.
Statement 12(p) School shooting. There was no significant difference in the
distribution of responses between male and female students (χ2=7.40, p=.116).
Computed proportions indicated that 47% of the male students and 62% of the female
students Strongly Agreed or Agreed, 26% of the male students and 22% of the female
students had No Opinion, and 27% of the male students and 16% of the female
students Strongly Disagreed or Disagreed with the survey statement. Therefore, the
154
male and female students’ perceptions were inconclusive and not statistically
significant. Further, the results indicated that gender did not influence their
perceptions.
Statement 12(q) Social bullying. There was a significant difference in the
distribution of responses between male and female students (χ2=18.12, p=.001).
Computed proportions indicated that 38% of the male students and 62% of the female
students Strongly Agreed or Agreed, 34% of the male students and 26% of the female
students had No Opinion, and 28% of the male students and 12% of the female
students Strongly Disagreed or Disagreed with the survey statement. Therefore, the
male and female students’ perceptions were significantly different. Further, the
results indicated that gender did influence their perceptions.
Statement 12(r) Student suicide. There was a significant difference in the
distribution of responses between male and female students (χ2=25.65, p=.001).
Computed proportions indicated that 39% of the male students and 68% of the female
students Strongly Agreed or Agreed, 33% of the male students and 21% of the female
students had No Opinion, and 28% of the male students and 11% of the female
students Strongly Disagreed or Disagreed with the survey statement. Therefore, the
male and female students’ perceptions were significantly different. Further, the
results indicated that gender did not influence their perceptions.
Statement 12(s) Theft. There was a significant difference in the distribution of
responses between male and female students (χ2=17.44, p=.002). Computed
proportions indicated that 40% of the male students and 62% of the female students
155
Strongly Agreed or Agreed, 36% of the male students and 26% of the female
students had No Opinion, and 24% of the male students and 12% of the female
students Strongly Disagreed or Disagreed with the survey statement. Therefore, the
male and female students’ perceptions were significantly different. Further, the
results indicated that gender did influence their perceptions.
Statement 12(t) Vandalism. There was a significant difference in the
distribution of responses between male and female students (χ2=19.81, p=.001).
Computed proportions indicated that 26% of the male students and 51% of the female
students Strongly Agreed or Agreed, 45% of the male students and 34% of the female
students had No Opinion, and 29% of the male students and 15% of the female
students Strongly Disagreed or Disagreed with the survey statement. Therefore, the
male and female students’ perceptions were significantly different. Further, the
results indicated that gender did influence their perceptions.
Statement 12(u) Verbal bullying. There was a significant difference in the
distribution of responses between male and female students (χ2=25.57, p=.001).
Computed proportions indicated that 34% of the male students and 64% of the female
students Strongly Agreed or Agreed, 37% of the male students and 23% of the female
students had No Opinion, and 29% of the male students and 13% of the female
students Strongly Disagreed or Disagreed with the survey statement. Therefore, the
male and female students’ perceptions were significantly different. Further, the
results indicated that gender did influence their perceptions.
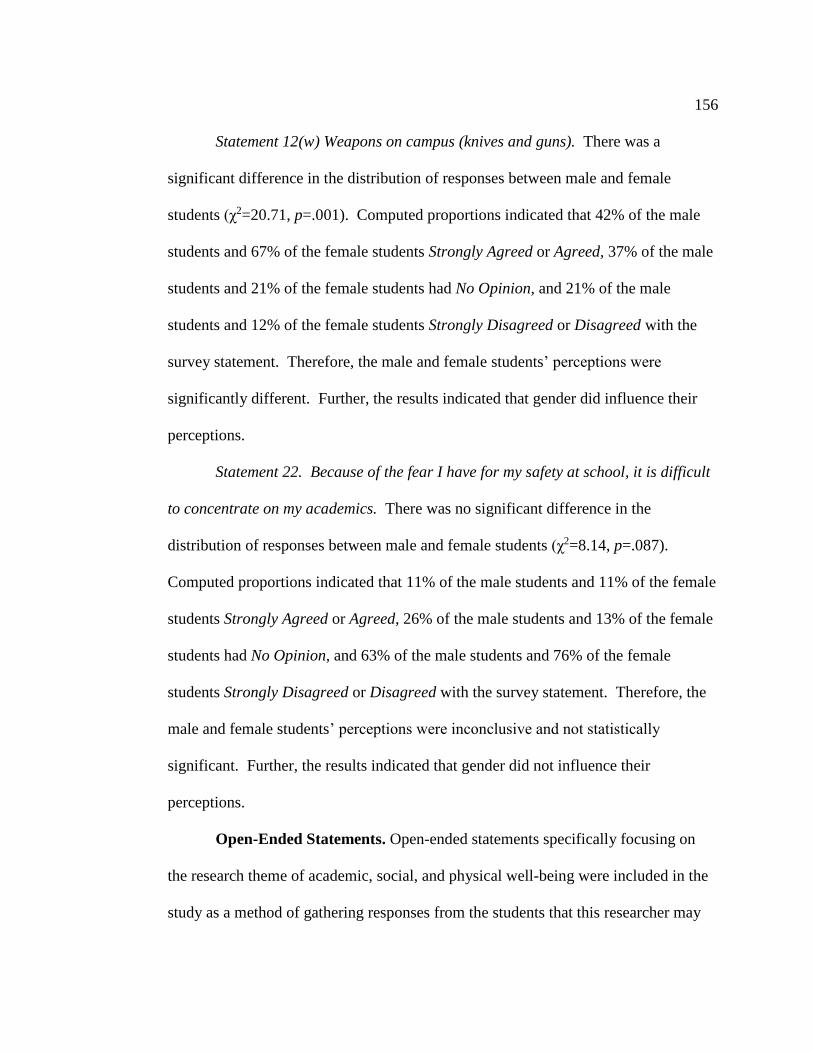
156
Statement 12(w) Weapons on campus (knives and guns). There was a
significant difference in the distribution of responses between male and female
students (χ2=20.71, p=.001). Computed proportions indicated that 42% of the male
students and 67% of the female students Strongly Agreed or Agreed, 37% of the male
students and 21% of the female students had No Opinion, and 21% of the male
students and 12% of the female students Strongly Disagreed or Disagreed with the
survey statement. Therefore, the male and female students’ perceptions were
significantly different. Further, the results indicated that gender did influence their
perceptions.
Statement 22. Because of the fear I have for my safety at school, it is difficult
to concentrate on my academics. There was no significant difference in the
distribution of responses between male and female students (χ2=8.14, p=.087).
Computed proportions indicated that 11% of the male students and 11% of the female
students Strongly Agreed or Agreed, 26% of the male students and 13% of the female
students had No Opinion, and 63% of the male students and 76% of the female
students Strongly Disagreed or Disagreed with the survey statement. Therefore, the
male and female students’ perceptions were inconclusive and not statistically
significant. Further, the results indicated that gender did not influence their
perceptions.
Open-Ended Statements. Open-ended statements specifically focusing on
the research theme of academic, social, and physical well-being were included in the
study as a method of gathering responses from the students that this researcher may
157
have overlooked. The open-ended statements from the Student Safety Survey that
addressed academic, social, and physical well-being was 12(x).
Statement 12(x). The following issues at school increase my fear level and
negatively affect me academically, socially, and/or physically. Two students
responded to this statement with the following comments: sexual harassment and
racist teachers (2).
Research Theme: Specific Safety Measures
H9: There is no significant difference in the distribution of responses on a
survey of high school students’ perceptions in terms of specific safety measures
that are intended to improve their feelings of safety and well-being at school,
disaggregated by ethnicity/race. (See Tables 24 and 25 for statistical analyses.)
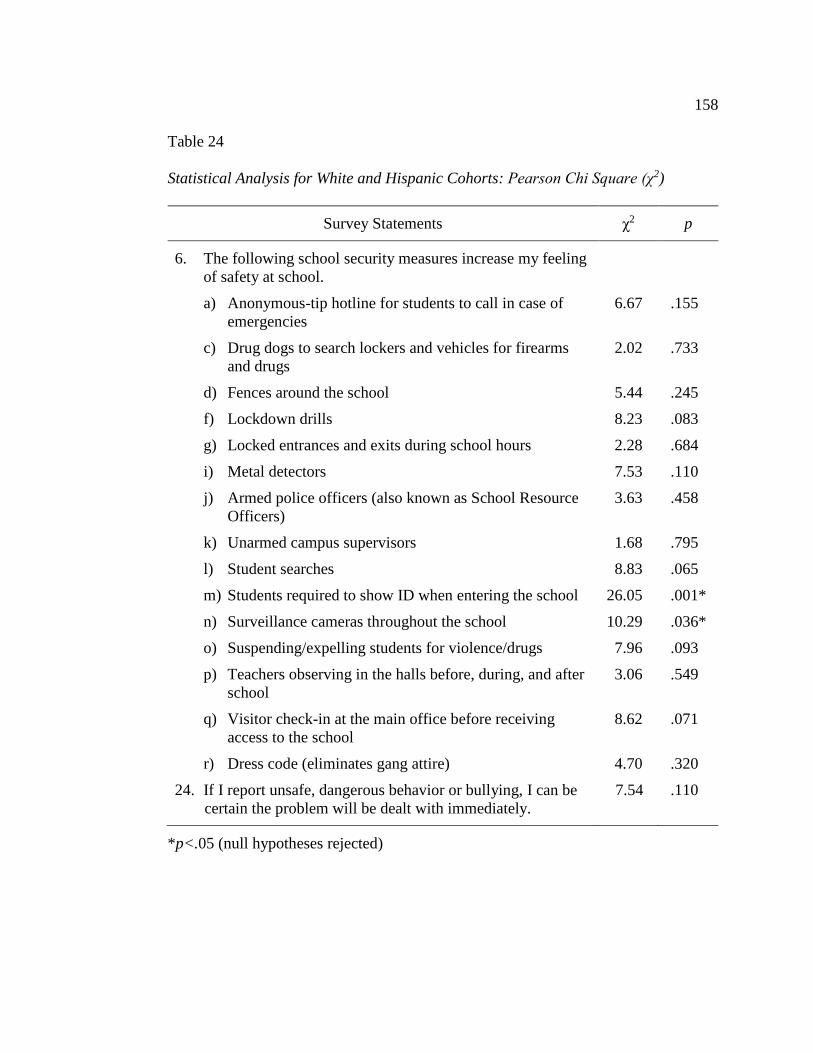
158
Table 24
Statistical Analysis for White and Hispanic Cohorts: Pearson Chi Square (χ2)
Survey Statements χ2 p
6. The following school security measures increase my feeling
of safety at school.
a) Anonymous-tip hotline for students to call in case of
emergencies
6.67 .155
c) Drug dogs to search lockers and vehicles for firearms
and drugs
2.02 .733
d) Fences around the school 5.44 .245
f) Lockdown drills 8.23 .083
g) Locked entrances and exits during school hours 2.28 .684
i) Metal detectors 7.53 .110
j) Armed police officers (also known as School Resource
Officers)
3.63 .458
k) Unarmed campus supervisors 1.68 .795
l) Student searches 8.83 .065
m) Students required to show ID when entering the school 26.05 .001*
n) Surveillance cameras throughout the school 10.29 .036*
o) Suspending/expelling students for violence/drugs 7.96 .093
p) Teachers observing in the halls before, during, and after
school
3.06 .549
q) Visitor check-in at the main office before receiving
access to the school
8.62 .071
r) Dress code (eliminates gang attire) 4.70 .320
24. If I report unsafe, dangerous behavior or bullying, I can be
certain the problem will be dealt with immediately.
7.54 .110
*p<.05 (null hypotheses rejected)
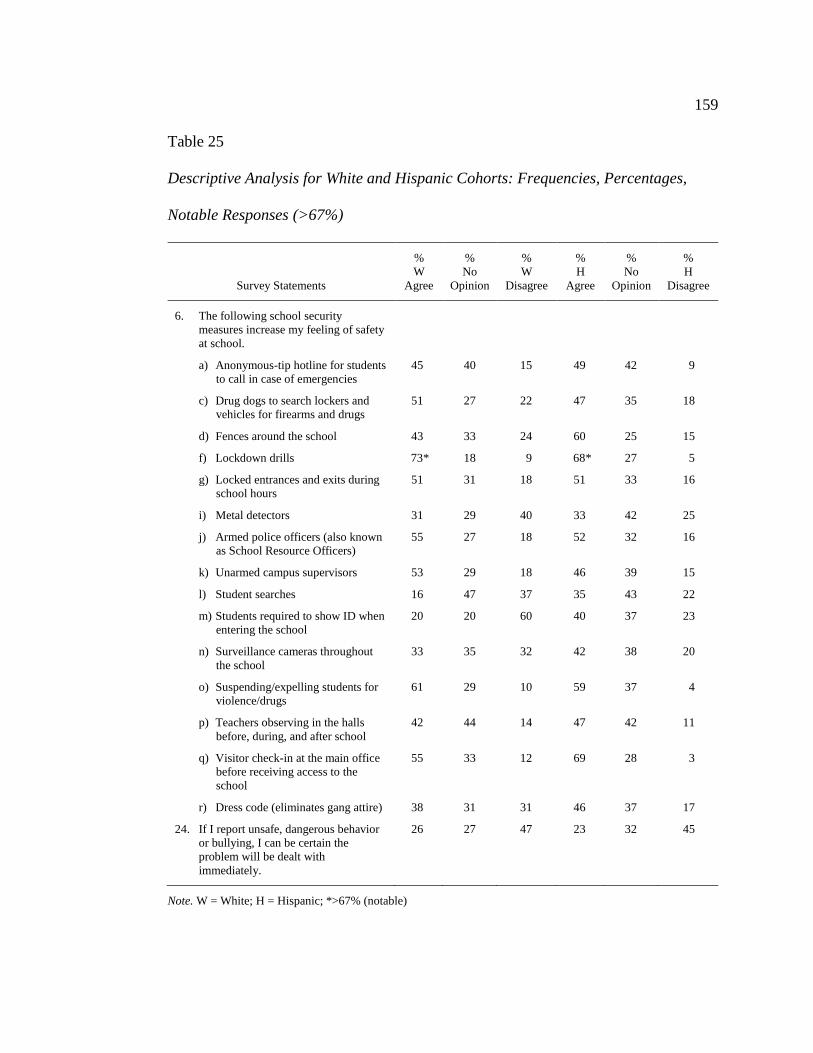
159
Table 25
Descriptive Analysis for White and Hispanic Cohorts: Frequencies, Percentages,
Notable Responses (>67%)
Survey Statements
%
W
Agree
%
No
Opinion
%
W
Disagree
%
H
Agree
%
No
Opinion
%
H
Disagree
6. The following school security
measures increase my feeling of safety
at school.
a) Anonymous-tip hotline for students
to call in case of emergencies
45 40 15 49 42 9
c) Drug dogs to search lockers and
vehicles for firearms and drugs
51 27 22 47 35 18
d) Fences around the school 43 33 24 60 25 15
f) Lockdown drills 73* 18 9 68* 27 5
g) Locked entrances and exits during
school hours
51 31 18 51 33 16
i) Metal detectors 31 29 40 33 42 25
j) Armed police officers (also known
as School Resource Officers)
55 27 18 52 32 16
k) Unarmed campus supervisors 53 29 18 46 39 15
l) Student searches 16 47 37 35 43 22
m) Students required to show ID when
entering the school
20 20 60 40 37 23
n) Surveillance cameras throughout
the school
33 35 32 42 38 20
o) Suspending/expelling students for
violence/drugs
61 29 10 59 37 4
p) Teachers observing in the halls
before, during, and after school
42 44 14 47 42 11
q) Visitor check-in at the main office
before receiving access to the
school
55 33 12 69 28 3
r) Dress code (eliminates gang attire) 38 31 31 46 37 17
24. If I report unsafe, dangerous behavior
or bullying, I can be certain the
problem will be dealt with
immediately.
26 27 47 23 32 45
Note. W = White; H = Hispanic; *>67% (notable)
160
Statement 6. The following issues at school increase my fear level and
negatively affect me academically, socially, and/or physically.
Statement 6(a) Anonymous-tip hot line for students to call in case of
emergencies. There was no significant difference in the distribution of responses
between White and Hispanic students (χ2=6.67, p=.155). Computed proportions
indicated that 45% of the White students and 49% of the Hispanic students Strongly
Agreed or Agreed, 40% of the White students and 42% of the Hispanic students had
No Opinion, and 15% of the White students and 9% of the Hispanic students Strongly
Disagreed or Disagreed with the survey statement. Therefore, the White and
Hispanic students’ perceptions were inconclusive and not statistically significant.
Further, the results indicated that ethnicity or race did not influence their perceptions.
Statement 6(c) Drug dogs to search lockers and vehicles for firearms and
drugs. There was no significant difference in the distribution of responses between
White and Hispanic students (χ2=2.02, p=.733). Computed proportions indicated that
51% of the White students and 47% of the Hispanic students Strongly Agreed or
Agreed, 27% of the White students and 35% of the Hispanic students had No
Opinion, and 22% of the White students and 18% of Hispanic students Strongly
Disagreed or Disagreed with the survey statement. Therefore, the White and
Hispanic students’ perceptions were inconclusive and not statistically significant.
Further, the results indicated that ethnicity or race did not influence their perceptions.
Statement 6(d) Fences around the school. There was no significant difference
in the distribution of responses between White and Hispanic students (χ2=5.44,
161
p=.245). Computed proportions indicated that 43% of the White students and
60% of the Hispanic students Strongly Agreed or Agreed, 33% of the White students
and 25% of the Hispanic students had No Opinion, and 24% of the White students
and 15% of the Hispanic students Strongly Disagreed or Disagreed with the survey
statement. Therefore, the White and Hispanic students’ perceptions were
inconclusive and not statistically significant. Further, the results indicated that
ethnicity or race did not influence their perceptions.
Statement 6(f) Lockdown drills. There was no significant difference in the
distribution of responses between White and Hispanic students (χ2=8.23, p=.083).
Computed proportions indicated that 73% of the White students and 68% of the
Hispanic students Strongly Agreed or Agreed, 18% of the White students and 27% of
the Hispanic students had No Opinion, and 9% of the White students and 5% of the
Hispanic students Strongly Disagreed or Disagreed with the survey statement. Their
perceptions were notable due to the cohorts’ high response rate in the Strongly Agree
and Agree cells (>67%). Further, the results indicated that ethnicity or race did not
influence their perceptions.
Statement 6(g) Locked entrances and exits during school hours. There was no
significant difference in the distribution of responses between White and Hispanic
students (χ2=2.28, p=.684). Computed proportions indicated that 51% of the White
students and 51% of the Hispanic students Strongly Agreed or Agreed, 31% of the
White students and 33% of the Hispanic students had No Opinion, and 18% of the
White students and 16% of the Hispanic students Strongly Disagreed or Disagreed
162
with the survey statement. Therefore, the White and Hispanic students’
perceptions were inconclusive and not statistically significant. Further, the results
indicated that ethnicity or race did not influence their perceptions.
Statement 6(i) Metal detectors. There was no significant difference in the
distribution of responses between White and Hispanic students (χ2=7.53, p=.110).
Computed proportions indicated that 31% of the White students and 33% of the
Hispanic students Strongly Agreed or Agreed, 29% of the White students and 42% of
the Hispanic students had No Opinion, and 40% of the White students and 25% of the
Hispanic students Strongly Disagreed or Disagreed with the survey statement.
Therefore, the White and Hispanic students’ perceptions were inconclusive and not
statistically significant. Further, the results indicated that ethnicity or race did not
influence their perceptions.
Statement 6(j) Armed police officers (also known as School Resource
Officers). There was no significant difference in the distribution of responses
between White and Hispanic students (χ2=3.63, p=.458). Computed proportions
indicated that 55% of the White students and 52% of the Hispanic students Strongly
Agreed or Agreed, 27% of the White students and 32% of the Hispanic students had
No Opinion, and 18% of the White students and 16% of the Hispanic students
Strongly Disagreed or Disagreed with the survey statement. Therefore, the White
and Hispanic students’ perceptions were inconclusive and not statistically significant.
Further, the results indicated that ethnicity or race did not influence their perceptions.
163
Statement 6(k) Unarmed campus supervisors. There was no significant
difference in the distribution of responses between White and Hispanic students
(χ2=1.68, p=.795). Computed proportions indicated that 53% of the White students
and 46% of the Hispanic students Strongly Agreed or Agreed, 29% of the White
students and 39% of the Hispanic students had No Opinion, and 18% of the White
students and 15% of the Hispanic students Strongly Disagreed or Disagreed with the
survey statement. Therefore, the White and Hispanic students’ perceptions were
inconclusive and not statistically significant. Further, the results indicated that
ethnicity or race did not influence their perceptions.
Statement 6(l) Student searches. There was no significant difference in the
distribution of responses between White and Hispanic students (χ2=8.83, p=.065).
Computed proportions indicated that 16% of the White students and 35% of the
Hispanic students Strongly Agreed or Agreed, 47% of the White students and 43% of
the Hispanic students had No Opinion, and 37% of the White students and 22% of the
Hispanic students Strongly Disagreed or Disagreed with the survey statement.
Therefore, the White and Hispanic students’ perceptions were inconclusive and not
statistically significant. Further, the results indicated that ethnicity or race did not
influence their perceptions.
Statement 6(m) Students required to show ID when entering the school. There
was a significant difference in the distribution of responses between White and
Hispanic students (χ2=26.05, p=.001). Computed proportions indicated that 20% of
the White students and 40% of the Hispanic students Strongly Agreed or Agreed, 20%
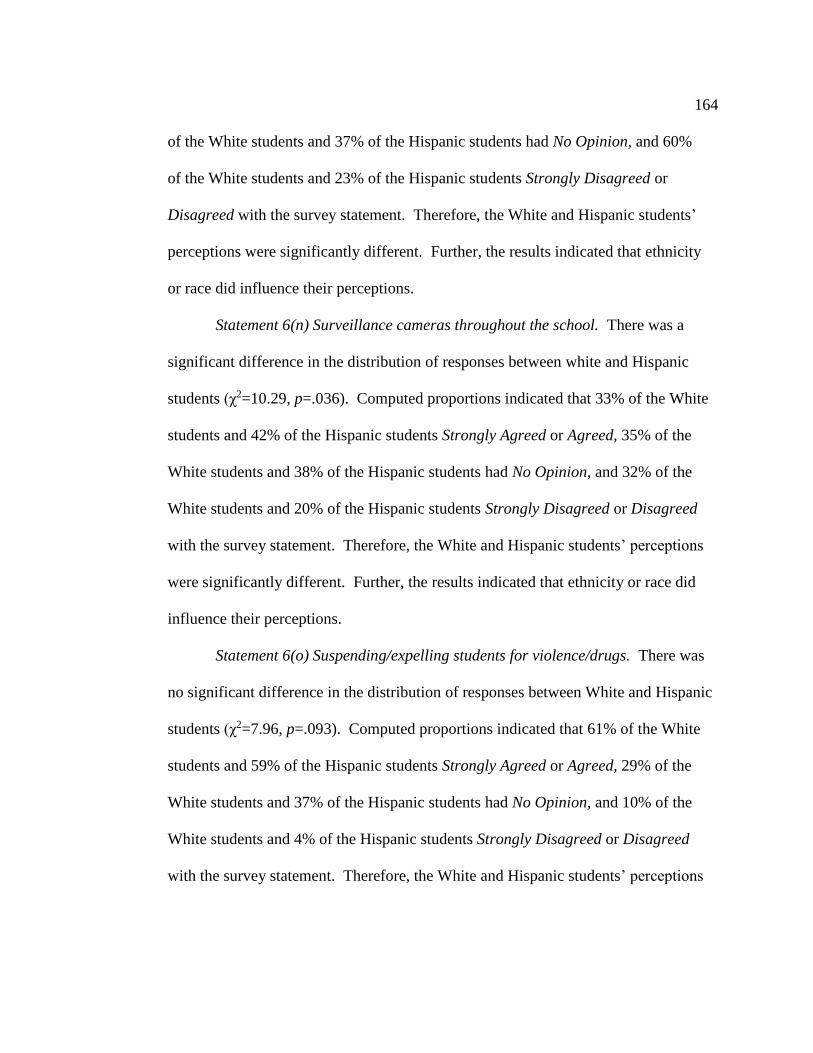
164
of the White students and 37% of the Hispanic students had No Opinion, and 60%
of the White students and 23% of the Hispanic students Strongly Disagreed or
Disagreed with the survey statement. Therefore, the White and Hispanic students’
perceptions were significantly different. Further, the results indicated that ethnicity
or race did influence their perceptions.
Statement 6(n) Surveillance cameras throughout the school. There was a
significant difference in the distribution of responses between white and Hispanic
students (χ2=10.29, p=.036). Computed proportions indicated that 33% of the White
students and 42% of the Hispanic students Strongly Agreed or Agreed, 35% of the
White students and 38% of the Hispanic students had No Opinion, and 32% of the
White students and 20% of the Hispanic students Strongly Disagreed or Disagreed
with the survey statement. Therefore, the White and Hispanic students’ perceptions
were significantly different. Further, the results indicated that ethnicity or race did
influence their perceptions.
Statement 6(o) Suspending/expelling students for violence/drugs. There was
no significant difference in the distribution of responses between White and Hispanic
students (χ2=7.96, p=.093). Computed proportions indicated that 61% of the White
students and 59% of the Hispanic students Strongly Agreed or Agreed, 29% of the
White students and 37% of the Hispanic students had No Opinion, and 10% of the
White students and 4% of the Hispanic students Strongly Disagreed or Disagreed
with the survey statement. Therefore, the White and Hispanic students’ perceptions
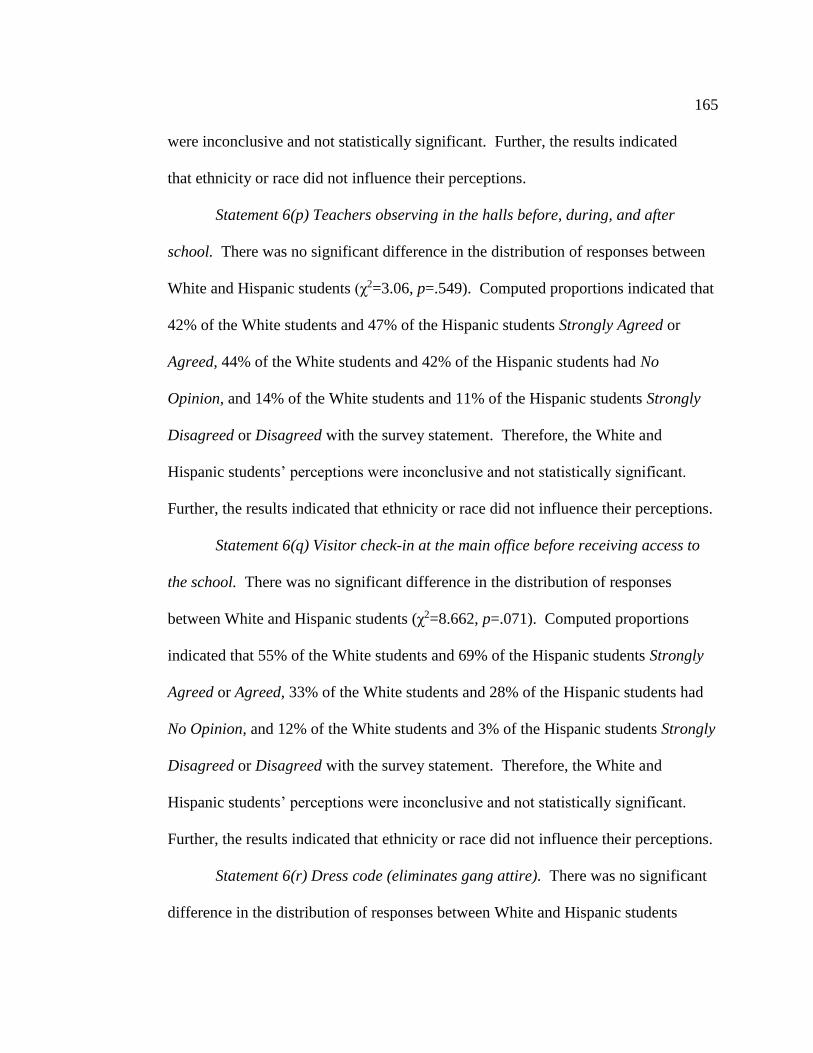
165
were inconclusive and not statistically significant. Further, the results indicated
that ethnicity or race did not influence their perceptions.
Statement 6(p) Teachers observing in the halls before, during, and after
school. There was no significant difference in the distribution of responses between
White and Hispanic students (χ2=3.06, p=.549). Computed proportions indicated that
42% of the White students and 47% of the Hispanic students Strongly Agreed or
Agreed, 44% of the White students and 42% of the Hispanic students had No
Opinion, and 14% of the White students and 11% of the Hispanic students Strongly
Disagreed or Disagreed with the survey statement. Therefore, the White and
Hispanic students’ perceptions were inconclusive and not statistically significant.
Further, the results indicated that ethnicity or race did not influence their perceptions.
Statement 6(q) Visitor check-in at the main office before receiving access to
the school. There was no significant difference in the distribution of responses
between White and Hispanic students (χ2=8.662, p=.071). Computed proportions
indicated that 55% of the White students and 69% of the Hispanic students Strongly
Agreed or Agreed, 33% of the White students and 28% of the Hispanic students had
No Opinion, and 12% of the White students and 3% of the Hispanic students Strongly
Disagreed or Disagreed with the survey statement. Therefore, the White and
Hispanic students’ perceptions were inconclusive and not statistically significant.
Further, the results indicated that ethnicity or race did not influence their perceptions.
Statement 6(r) Dress code (eliminates gang attire). There was no significant
difference in the distribution of responses between White and Hispanic students
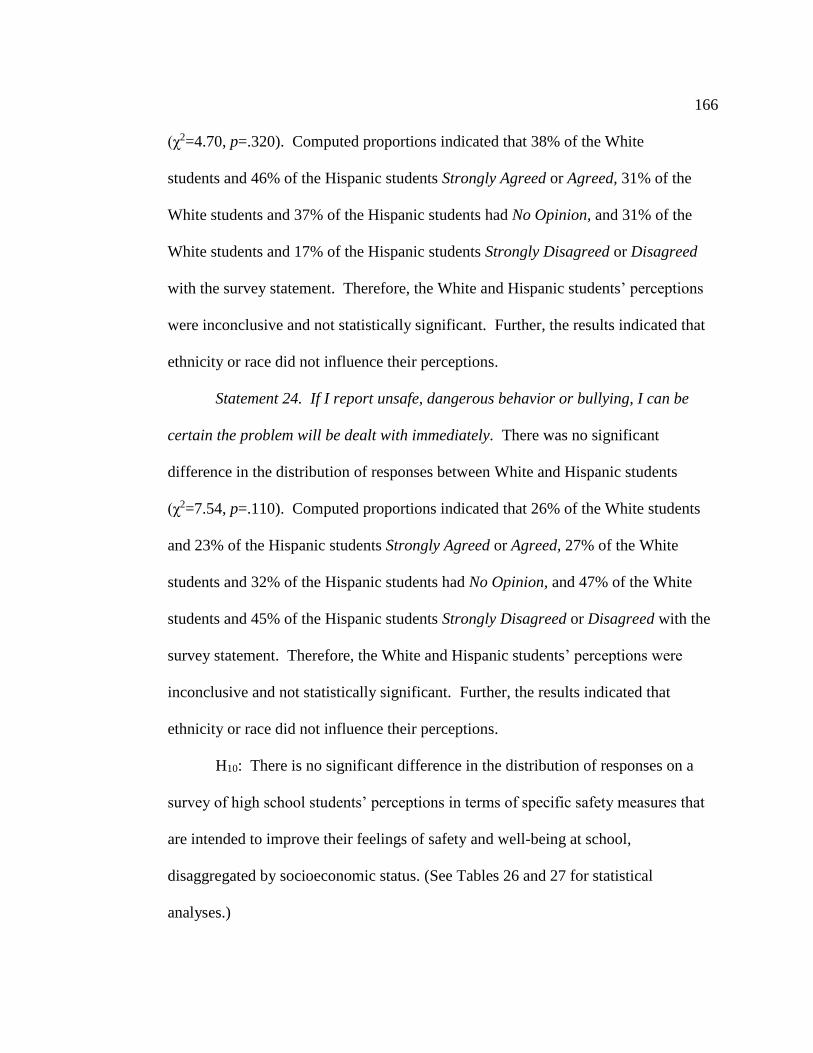
166
(χ2=4.70, p=.320). Computed proportions indicated that 38% of the White
students and 46% of the Hispanic students Strongly Agreed or Agreed, 31% of the
White students and 37% of the Hispanic students had No Opinion, and 31% of the
White students and 17% of the Hispanic students Strongly Disagreed or Disagreed
with the survey statement. Therefore, the White and Hispanic students’ perceptions
were inconclusive and not statistically significant. Further, the results indicated that
ethnicity or race did not influence their perceptions.
Statement 24. If I report unsafe, dangerous behavior or bullying, I can be
certain the problem will be dealt with immediately. There was no significant
difference in the distribution of responses between White and Hispanic students
(χ2=7.54, p=.110). Computed proportions indicated that 26% of the White students
and 23% of the Hispanic students Strongly Agreed or Agreed, 27% of the White
students and 32% of the Hispanic students had No Opinion, and 47% of the White
students and 45% of the Hispanic students Strongly Disagreed or Disagreed with the
survey statement. Therefore, the White and Hispanic students’ perceptions were
inconclusive and not statistically significant. Further, the results indicated that
ethnicity or race did not influence their perceptions.
H10: There is no significant difference in the distribution of responses on a
survey of high school students’ perceptions in terms of specific safety measures that
are intended to improve their feelings of safety and well-being at school,
disaggregated by socioeconomic status. (See Tables 26 and 27 for statistical
analyses.)
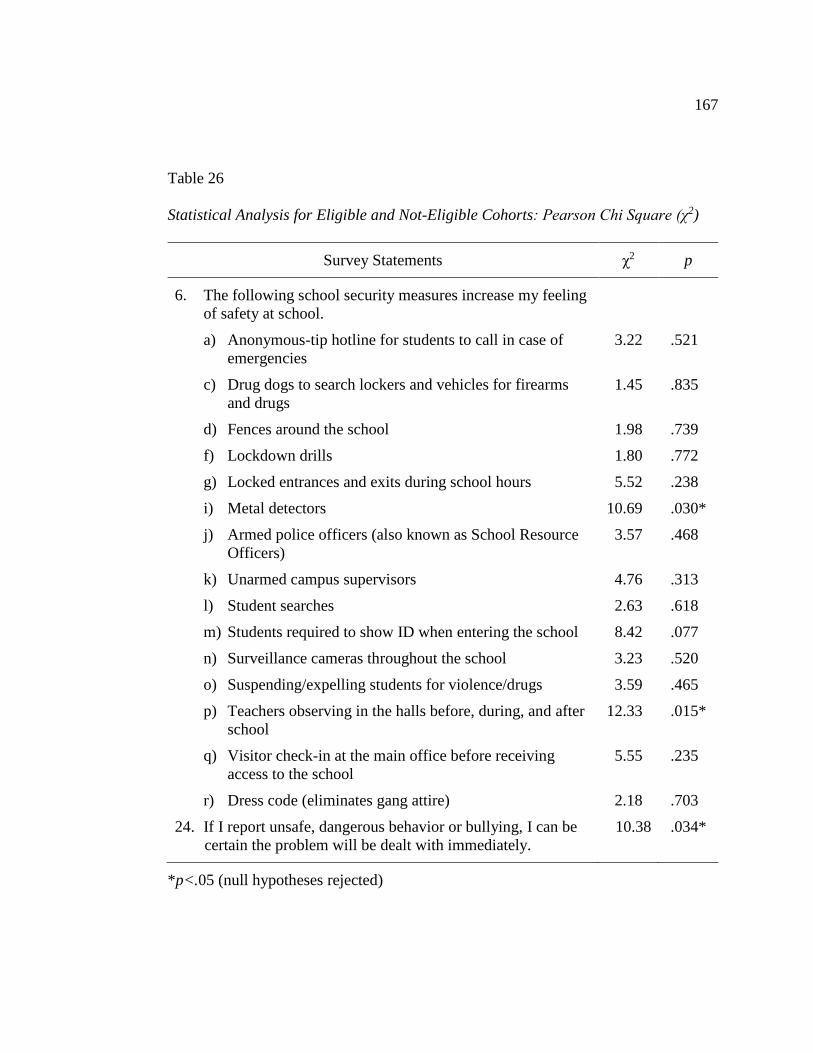
167
Table 26
Statistical Analysis for Eligible and Not-Eligible Cohorts: Pearson Chi Square (χ2)
Survey Statements χ2 p
6. The following school security measures increase my feeling
of safety at school.
a) Anonymous-tip hotline for students to call in case of
emergencies
3.22 .521
c) Drug dogs to search lockers and vehicles for firearms
and drugs
1.45 .835
d) Fences around the school 1.98 .739
f) Lockdown drills 1.80 .772
g) Locked entrances and exits during school hours 5.52 .238
i) Metal detectors 10.69 .030*
j) Armed police officers (also known as School Resource
Officers)
3.57 .468
k) Unarmed campus supervisors 4.76 .313
l) Student searches 2.63 .618
m) Students required to show ID when entering the school 8.42 .077
n) Surveillance cameras throughout the school 3.23 .520
o) Suspending/expelling students for violence/drugs 3.59 .465
p) Teachers observing in the halls before, during, and after
school
12.33 .015*
q) Visitor check-in at the main office before receiving
access to the school
5.55 .235
r) Dress code (eliminates gang attire) 2.18 .703
24. If I report unsafe, dangerous behavior or bullying, I can be
certain the problem will be dealt with immediately.
10.38 .034*
*p<.05 (null hypotheses rejected)
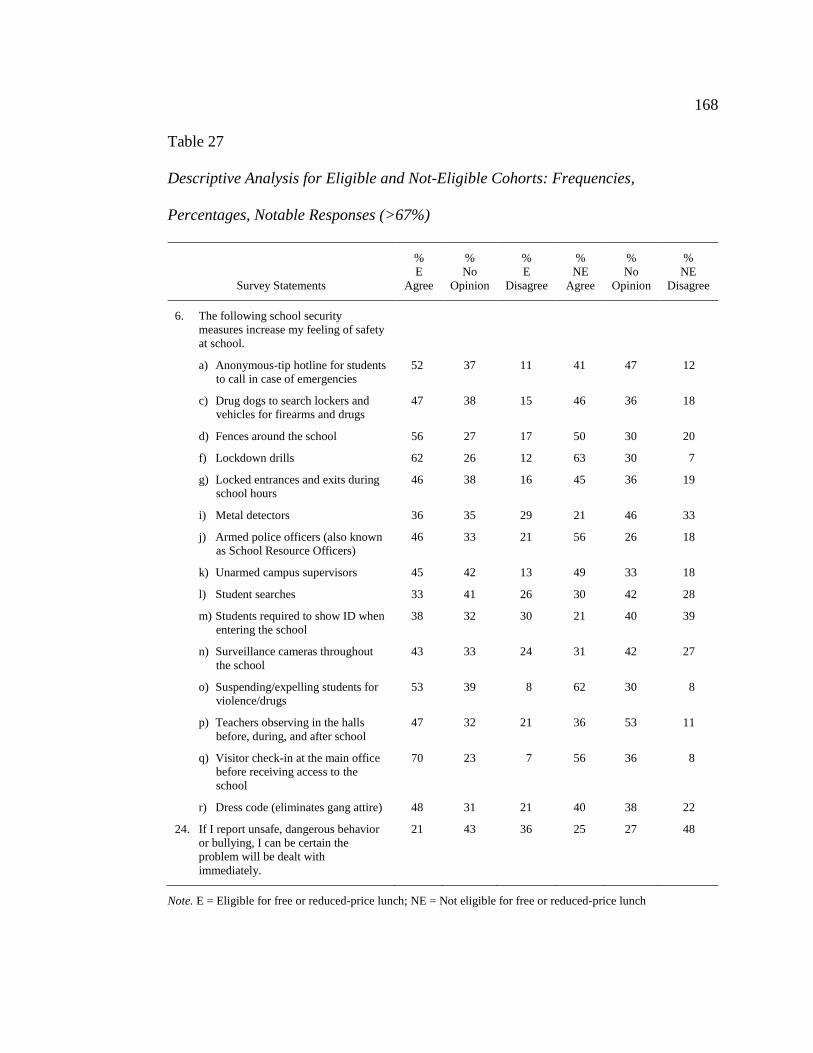
168
Table 27
Descriptive Analysis for Eligible and Not-Eligible Cohorts: Frequencies,
Percentages, Notable Responses (>67%)
Survey Statements
%
E
Agree
%
No
Opinion
%
E
Disagree
%
NE
Agree
%
No
Opinion
%
NE
Disagree
6. The following school security
measures increase my feeling of safety
at school.
a) Anonymous-tip hotline for students
to call in case of emergencies
52 37 11 41 47 12
c) Drug dogs to search lockers and
vehicles for firearms and drugs
47 38 15 46 36 18
d) Fences around the school 56 27 17 50 30 20
f) Lockdown drills 62 26 12 63 30 7
g) Locked entrances and exits during
school hours
46 38 16 45 36 19
i) Metal detectors 36 35 29 21 46 33
j) Armed police officers (also known
as School Resource Officers)
46 33 21 56 26 18
k) Unarmed campus supervisors 45 42 13 49 33 18
l) Student searches 33 41 26 30 42 28
m) Students required to show ID when
entering the school
38 32 30 21 40 39
n) Surveillance cameras throughout
the school
43 33 24 31 42 27
o) Suspending/expelling students for
violence/drugs
53 39 8 62 30 8
p) Teachers observing in the halls
before, during, and after school
47 32 21 36 53 11
q) Visitor check-in at the main office
before receiving access to the
school
70 23 7 56 36 8
r) Dress code (eliminates gang attire) 48 31 21 40 38 22
24. If I report unsafe, dangerous behavior
or bullying, I can be certain the
problem will be dealt with
immediately.
21 43 36 25 27 48
Note. E = Eligible for free or reduced-price lunch; NE = Not eligible for free or reduced-price lunch
169
Statement 6. The following issues at school increase my fear level and
negatively affect me academically, socially, and/or physically.
Statement 6(a) Anonymous-tip hotline for students to call in case of
emergencies. There was no significant difference in the distribution of responses
between eligible and not-eligible students (χ2=3.22, p=.521). Computed proportions
indicated that 52% of the eligible students and 41% of the not-eligible students
Strongly Agreed or Agreed, 37% of the eligible students and 47% of the not-eligible
students had No Opinion, and 11% of the eligible students and 12% of the not-eligible
students Strongly Disagreed or Disagreed with the survey statement. Therefore, the
eligible and not-eligible students’ perceptions were inconclusive and not statistically
significant. Further, the results indicated that socioeconomic status did not influence
their perceptions.
Statement 6(c) Drug dogs to search lockers and vehicles for firearms and
drugs. There was no significant difference in the distribution of responses between
eligible and not-eligible students (χ2=1.45, p=.835). Computed proportions indicated
that 47% of the eligible students and 46% of the not-eligible students Strongly Agreed
or Agreed, 38% of the eligible students and 36% of the not-eligible students had No
Opinion, and 15% of the eligible students and 18% of the not-eligible students
Strongly Disagreed or Disagreed with the survey statement. Therefore, the eligible
and not-eligible students’ perceptions were inconclusive and not statistically
significant. Further, the results indicated that socioeconomic status did not influence
their perceptions.
170
Statement 6(d) Fences around the school. There was no significant
difference in the distribution of responses between eligible and not-eligible students
(χ2=1.98, p=.739). Computed proportions indicated that 56% of the eligible students
and 50% of the not-eligible students Strongly Agreed or Agreed, 27% of the eligible
students and 30% of the not-eligible students had No Opinion, and 17% of the eligible
students and 20% of the not-eligible students Strongly Disagreed or Disagreed with
the survey statement. Therefore, the eligible and not-eligible students’ perceptions
were inconclusive and not statistically significant. Further, the results indicated that
socioeconomic status did not influence their perceptions.
Statement 6(f) Lockdown drills. There was no significant difference in the
distribution of responses between eligible and not-eligible students (χ2=1.80, p=.772).
Computed proportions indicated that 62% of the eligible students and 63% of the not-
eligible students Strongly Agreed or Agreed, 26% of the eligible students and 30% of
the not-eligible students had No Opinion, and 12% of the eligible students and 7% of
the not-eligible students Strongly Disagreed or Disagreed with the survey statement.
Therefore, the eligible and not-eligible students’ perceptions were inconclusive and
not statistically significant. Further, the results indicated that socioeconomic status
did not influence their perceptions.
Statement 6(g) Locked entrances and exits during school hours. There was no
significant difference in the distribution of responses between eligible and not-eligible
students (χ2=5.52, p=.238). Computed proportions indicated that 46% of the eligible
students and 45% of the not-eligible students Strongly Agreed or Agreed, 38% of the
171
eligible students and 36% of the not-eligible students had No Opinion, and 16% of
the eligible students and 19% of the not-eligible students Strongly Disagreed or
Disagreed with the survey statement. Therefore, the eligible and not-eligible
students’ perceptions were inconclusive and not statistically significant. Further, the
results indicated that socioeconomic status did not influence their perceptions.
Statement 6(i) Metal detectors. There was a significant difference in the
distribution of responses between eligible and not-eligible students (χ2=10.69,
p=.030). Computed proportions indicated that 36% of the eligible students and 21%
of the not-eligible students Strongly Agreed or Agreed, 35% of the eligible students
and 46% of the not-eligible students had no opinion, and 29% of the eligible students
and 33% of the not-eligible students Strongly Disagreed and Disagreed with the
survey statement. Therefore, the eligible and not-eligible students’ perceptions were
significantly different. Further, the results indicated that socioeconomic status did
influence their perceptions.
Statement 6(j) Armed police officers (also known as School Resource
Officers). There was no significant difference in the distribution of responses
between eligible and not-eligible students (χ2=3.57, p=.468). Computed proportions
indicated that 46% of the eligible students and 56% of the not-eligible students
Strongly Agreed or Agreed, 33% of the eligible students and 26% of the not-eligible
students had No Opinion, and 21% of the eligible students and 18% of the not-eligible
students Strongly Disagreed or Disagreed with the survey statement. Therefore, the
eligible and not-eligible students’ perceptions were inconclusive and not statistically
172
significant. Further, the results indicated that socioeconomic status did not
influence their perceptions.
Statement 6(k) Unarmed campus supervisors. There was no significant
difference in the distribution of responses between eligible and not-eligible students
(χ2=4.76, p=.313). Computed proportions indicated that 45% of the eligible students
and 49% of the not-eligible students Strongly Agreed or Agreed, 42% of the eligible
students and 33% of the not-eligible students had No Opinion, and 13% of the eligible
students and 18% of the not-eligible students Strongly Disagreed or Disagreed with
the survey statement. Therefore, the eligible and not-eligible students’ perceptions
were inconclusive and not statistically significant. Further, the results indicated that
socioeconomic status did not influence their perceptions.
Statement 6(l) Students searches. There was no significant difference in the
distribution of responses between eligible and not-eligible students (χ2=2.65, p=.618).
Computed proportions indicated that 33% of the eligible students and 30% of the not-
eligible students Strongly Agreed or Agreed, 41% of the eligible students and 42% of
the not-eligible students had No Opinion, and 26% of the eligible students and 28% of
the not-eligible students Strongly Disagreed or Disagreed with the survey statement.
Therefore, the eligible and not-eligible students’ perceptions were inconclusive and
not statistically significant. Further, the results indicated that socioeconomic status
did not influence their perceptions.
Statement 6(m) Students required to show ID when entering the school. There
was no significant difference in the distribution of responses between eligible and
173
not-eligible students (χ2=8.42, p=.077). Computed proportions indicated that 38%
of the eligible students and 21% of the not-eligible students Strongly Agreed or
Agreed, 32% of the eligible students and 40% of the not-eligible students had No
Opinion, and 30% of the eligible students and 39% of the not-eligible students
Strongly Disagreed or Disagreed with the survey statement. Therefore, the eligible
and not eligible students’ perceptions were inconclusive and not statistically
significant. Further, the results indicated that socioeconomic status did not influence
their perceptions.
Statement 6(n) Students required to show ID when entering the school. There
was no significant difference in the distribution of responses between eligible and
not-eligible students (χ2=3.23, p=.520). Computed proportions indicated that 43% of
the eligible students and 31% of the not-eligible students Strongly Agreed or Agreed,
33% of the eligible students and 42% of the not-eligible students had No Opinion, and
24% of the eligible students and 27% of the not-eligible students Strongly Disagreed
or Disagreed with the survey statement. Therefore, the eligible and not-eligible
students’ perceptions were inconclusive and not statistically significant. Further, the
results indicated that socioeconomic status did not influence their perceptions.
Statement 6(o) Students required to show ID when entering the school. There
was no significant difference in the distribution of responses between eligible and
not-eligible students (χ2=3.59, p=.465). Computed proportions indicated that 53% of
the eligible students and 62% of the not-eligible students Strongly Agreed or Agreed,
39% of the eligible students and 30% of the not-eligible students had No Opinion, and
174
8% of the eligible students and 8% of the not-eligible students Strongly Disagreed
or Disagreed with the survey statement. Therefore, the eligible and not-eligible
students’ perceptions were inconclusive and not statistically significant. Further, the
results indicated that socioeconomic status did not influence their perceptions.
Statement 6(p) Students required to show ID when entering the school. There
was a significant difference in the distribution of responses between eligible and not-
eligible students (χ2=12.33, p=.015). Computed proportions indicated that 47% of the
eligible students and 36% of the not-eligible students Strongly Agreed or Agreed,
32% of the eligible students and 53% of the not-eligible students had No Opinion, and
21% of the eligible students and 11% of the not-eligible students Strongly Disagreed
or Disagreed with the survey statement. Therefore, the eligible and not-eligible
students’ perceptions were significantly different. Further, the results indicated that
socioeconomic status did influence their perceptions.
Statement 6(q) Students required to show ID when entering the school. There
was no significant difference in the distribution of responses between eligible and
not-eligible students (χ2=5.55, p=.235). Computed proportions indicated that 70% of
the eligible students and 56% of the not-eligible students Strongly Agreed or Agreed,
23% of the eligible students and 36% of the not-eligible students had No Opinion, and
7% of the eligible students and 8% of the not-eligible students Strongly Disagreed or
Disagreed with the survey statement. Therefore, the eligible and not-eligible
students’ perceptions were inconclusive and not statistically significant. Further, the
results indicated that socioeconomic status did not influence their perceptions.
175
Statement 6(r) Dress code (eliminates gang attire). There was no
significant difference in the distribution of responses between eligible and not-eligible
students (χ2=2.18, p=.703). Computed proportions indicated that 48% of the eligible
students and 40% of the not-eligible students Strongly Agreed or Agreed, 31% of the
eligible students and 38% of the not-eligible students had No Opinion, and 21% of the
eligible students and 22% of the not-eligible students Strongly Disagreed or
Disagreed with the survey statement. Therefore, the eligible and not-eligible
students’ perceptions were inconclusive and not statistically significant. Further, the
results indicated that socioeconomic status did not influence their perceptions.
Statement 24. If I report unsafe, dangerous behavior or bullying, I can be
certain the problem will be dealt with immediately. There was a significant
difference in the distribution of responses between eligible and not-eligible students
(χ2=10.38, p=.034). Computed proportions indicated that 21% of the eligible students
and 25% of the not-eligible students Strongly Agreed or Agreed, 43% of the eligible
students and 27% of the not-eligible students had No Opinion, and 36% of the eligible
students and 48% of the not-eligible students Strongly Disagreed or Disagreed with
the survey statement. Therefore, the eligible and not-eligible students’ perceptions
were significantly different. Further, the results indicated that socioeconomic status
did influence their perceptions.
H11: There is no significant difference in the distribution of responses on
a survey of high school students’ perceptions in terms of specific safety measures
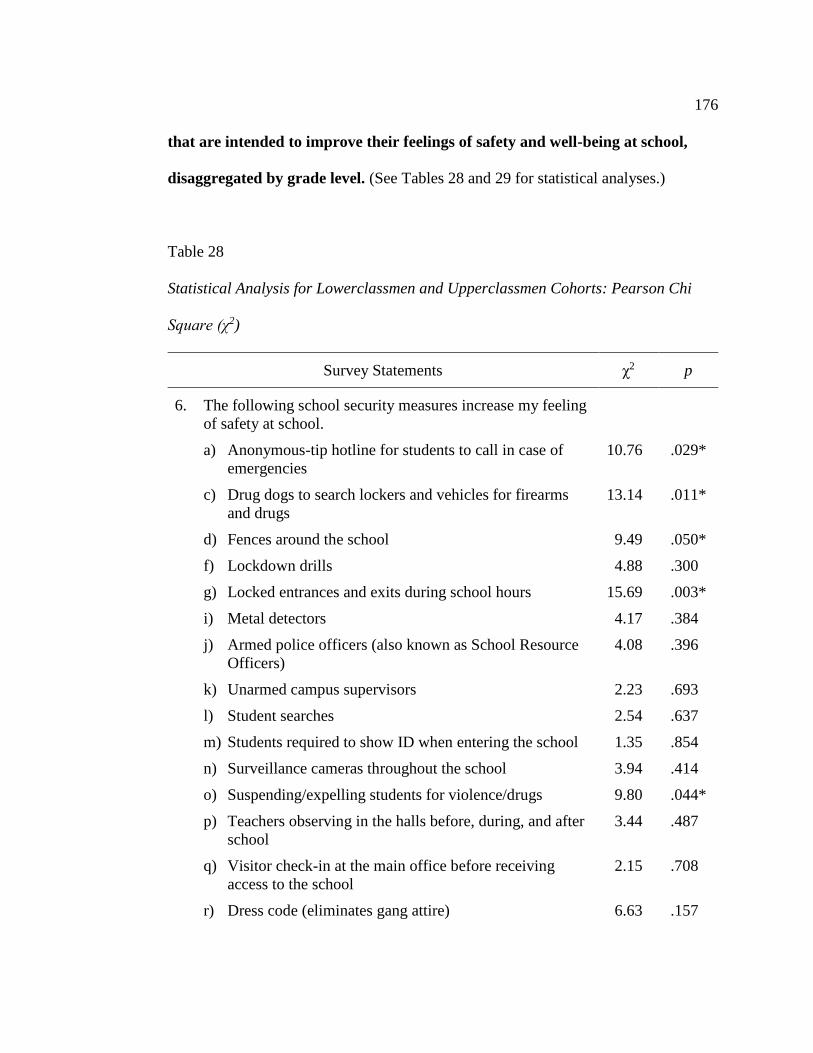
176
that are intended to improve their feelings of safety and well-being at school,
disaggregated by grade level. (See Tables 28 and 29 for statistical analyses.)
Table 28
Statistical Analysis for Lowerclassmen and Upperclassmen Cohorts: Pearson Chi
Square (χ2)
Survey Statements χ2 p
6. The following school security measures increase my feeling
of safety at school.
a) Anonymous-tip hotline for students to call in case of
emergencies
10.76 .029*
c) Drug dogs to search lockers and vehicles for firearms
and drugs
13.14 .011*
d) Fences around the school 9.49 .050*
f) Lockdown drills 4.88 .300
g) Locked entrances and exits during school hours 15.69 .003*
i) Metal detectors 4.17 .384
j) Armed police officers (also known as School Resource
Officers)
4.08 .396
k) Unarmed campus supervisors 2.23 .693
l) Student searches 2.54 .637
m) Students required to show ID when entering the school 1.35 .854
n) Surveillance cameras throughout the school 3.94 .414
o) Suspending/expelling students for violence/drugs 9.80 .044*
p) Teachers observing in the halls before, during, and after
school
3.44 .487
q) Visitor check-in at the main office before receiving
access to the school
2.15 .708
r) Dress code (eliminates gang attire) 6.63 .157
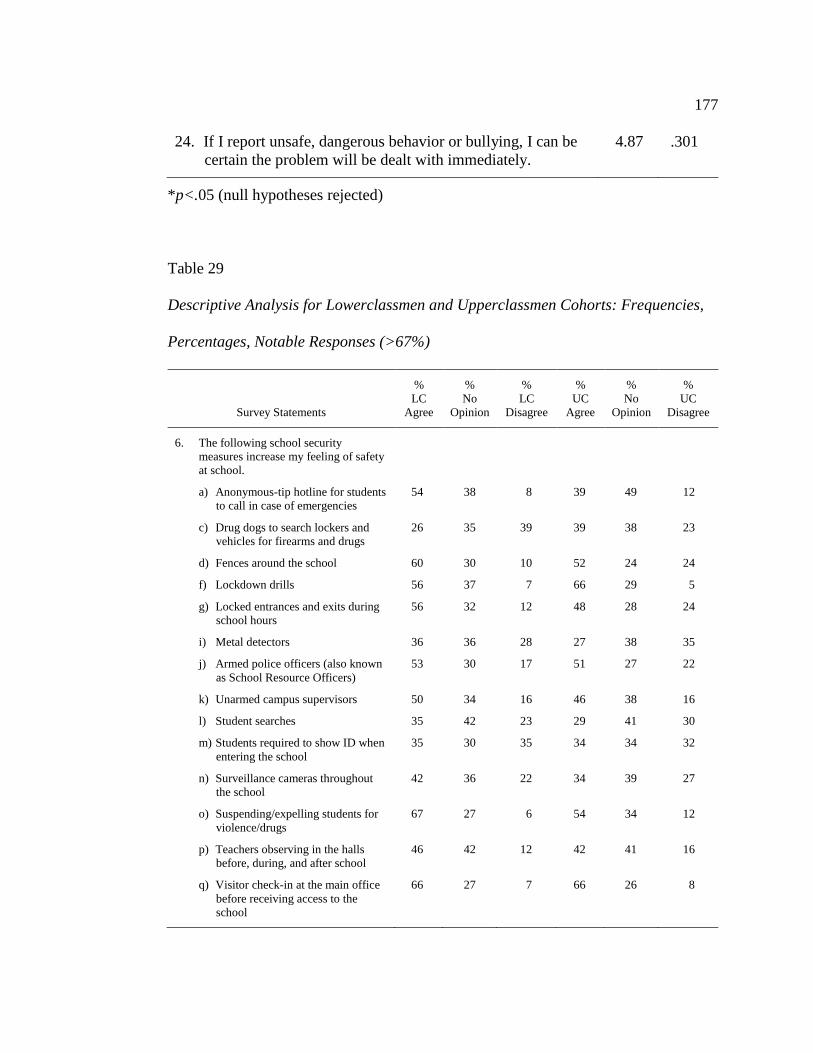
177
24. If I report unsafe, dangerous behavior or bullying, I can be
certain the problem will be dealt with immediately.
4.87 .301
*p<.05 (null hypotheses rejected)
Table 29
Descriptive Analysis for Lowerclassmen and Upperclassmen Cohorts: Frequencies,
Percentages, Notable Responses (>67%)
Survey Statements
%
LC
Agree
%
No
Opinion
%
LC
Disagree
%
UC
Agree
%
No
Opinion
%
UC
Disagree
6. The following school security
measures increase my feeling of safety
at school.
a) Anonymous-tip hotline for students
to call in case of emergencies
54 38 8 39 49 12
c) Drug dogs to search lockers and
vehicles for firearms and drugs
26 35 39 39 38 23
d) Fences around the school 60 30 10 52 24 24
f) Lockdown drills 56 37 7 66 29 5
g) Locked entrances and exits during
school hours
56 32 12 48 28 24
i) Metal detectors 36 36 28 27 38 35
j) Armed police officers (also known
as School Resource Officers)
53 30 17 51 27 22
k) Unarmed campus supervisors 50 34 16 46 38 16
l) Student searches 35 42 23 29 41 30
m) Students required to show ID when
entering the school
35 30 35 34 34 32
n) Surveillance cameras throughout
the school
42 36 22 34 39 27
o) Suspending/expelling students for
violence/drugs
67 27 6 54 34 12
p) Teachers observing in the halls
before, during, and after school
46 42 12 42 41 16
q) Visitor check-in at the main office
before receiving access to the
school
66 27 7 66 26 8
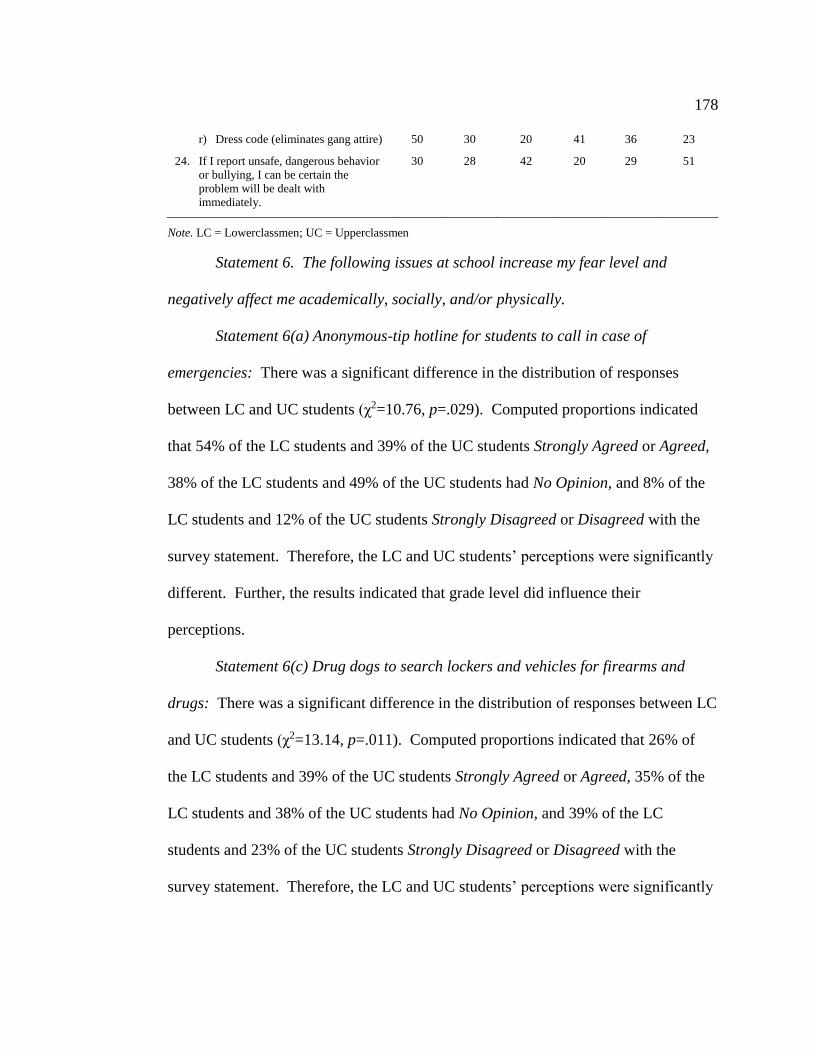
178
r) Dress code (eliminates gang attire) 50 30 20 41 36 23
24. If I report unsafe, dangerous behavior
or bullying, I can be certain the
problem will be dealt with
immediately.
30 28 42 20 29 51
Note. LC = Lowerclassmen; UC = Upperclassmen
Statement 6. The following issues at school increase my fear level and
negatively affect me academically, socially, and/or physically.
Statement 6(a) Anonymous-tip hotline for students to call in case of
emergencies: There was a significant difference in the distribution of responses
between LC and UC students (χ2=10.76, p=.029). Computed proportions indicated
that 54% of the LC students and 39% of the UC students Strongly Agreed or Agreed,
38% of the LC students and 49% of the UC students had No Opinion, and 8% of the
LC students and 12% of the UC students Strongly Disagreed or Disagreed with the
survey statement. Therefore, the LC and UC students’ perceptions were significantly
different. Further, the results indicated that grade level did influence their
perceptions.
Statement 6(c) Drug dogs to search lockers and vehicles for firearms and
drugs: There was a significant difference in the distribution of responses between LC
and UC students (χ2=13.14, p=.011). Computed proportions indicated that 26% of
the LC students and 39% of the UC students Strongly Agreed or Agreed, 35% of the
LC students and 38% of the UC students had No Opinion, and 39% of the LC
students and 23% of the UC students Strongly Disagreed or Disagreed with the
survey statement. Therefore, the LC and UC students’ perceptions were significantly
179
different. Further, the results indicated that grade level did influence their
perceptions.
Statement 6(d) Fences around the school: There was a significant difference
in the distribution of responses between LC and UC students (χ2=9.49, p=.050).
Computed proportions indicated that 60% of the LC students and 52% of the UC
students Strongly Agreed or Agreed, 30% of the LC students and 24% of the UC
students had No Opinion, and 10% of the LC students and 24% of the UC students
Strongly Disagreed or Disagreed with the survey statement. Therefore, the LC and
UC students’ perceptions were significantly different. Further, the results indicated
that grade level did influence their perceptions.
Statement 6(f) Lockdown drills: There was no significant difference in the
distribution of responses between LC and UC students (χ2=4.88, p=.300). Computed
proportions indicated that 56% of the LC students and 66% of the UC students
Strongly Agreed or Agreed, 37% of the LC students and 29% of the UC students had
No Opinion, and 7% of the LC students and 5% of the UC students Strongly
Disagreed or Disagreed with the survey statement. Therefore, the LC and UC
students’ perceptions were convergent but not significantly different. Further, the
results indicated that grade level did not influence their perceptions.
Statement 6(g) Locked entrances and exits during schools hours: There was a
significant difference in the distribution of responses between LC and UC students
(χ2=15.69, p=.003). Computed proportions indicated that 56% of the LC students and
48% of the UC students Strongly Agreed or Agreed, 32% of the LC students and 28%
180
of the UC students had No Opinion, and 12% of the LC students and 24% of the
UC students Strongly Disagreed or Disagreed with the survey statement. Therefore,
the LC and UC students’ perceptions were significantly different. Further, the results
indicated that grade level did influence their perceptions.
Statement 6(i) Metal detectors: There was no significant difference in the
distribution of responses between LC and UC students (χ2=4.17, p=.384). Computed
proportions indicated that 36% of the LC students and 27% of the UC students
Strongly Agreed or Agreed, 36% of the LC students and 38% of the UC students had
No Opinion, and 28% of the LC students and 35% of the UC students Strongly
Disagreed or Disagreed with the survey statement. Therefore, the LC and UC
students’ perceptions were inconclusive and not statistically significant. Further, the
results indicated that grade level did not influence their perceptions.
Statement 6(j) Armed police officers (also known as School Resource
Officers): There was no significant difference in the distribution of responses
between LC and UC students (χ2=4.08, p=.396). Computed proportions indicated that
53% of the LC students and 51% of the UC students Strongly Agreed or Agreed, 30%
of the LC students and 27% of the UC students had no opinion, and 17% of the LC
students and 22% of the UC students Strongly Disagreed or Disagreed with the
survey statement. Therefore, the LC and UC students’ perceptions were inconclusive
and not statistically significant. Further, the results indicated that grade level did not
influence their perceptions.
181
Statement 6(k) Unarmed campus supervisors: There was no significant
difference in the distribution of responses between LC and UC students (χ2=2.23,
p=.693). Computed proportions indicated that 50% of the LC students and 46% of
the UC students Strongly Agreed or Agreed, 34% of the LC students and 38% of the
UC students had No Opinion, and 16% of the LC students and 16% of the UC
students Strongly Disagreed or Disagreed with the survey statement. Therefore, the
LC and UC students’ perceptions were inconclusive and not statistically significant.
Further, the results indicated that grade level did not influence their perceptions.
Statement 6(l) Student searches: There was no significant difference in the
distribution of responses between LC and UC students (χ2=2.54, p=.637). Computed
proportions indicated that 35% of the LC students and 29% of the UC students
Strongly Agreed or Agreed, 42% of the LC students and 41% of the UC students had
No Opinion, and 23% of the LC students and 30% of the UC students Strongly
Disagreed or Disagreed with the survey statement. Therefore, the LC and UC
students’ perceptions were inconclusive and not statistically significant. Further, the
results indicated that grade level did not influence their perceptions.
Statement 6(m) Students required to show ID when entering the school: There
was no significant difference in the distribution of responses between LC and UC
students (χ2=1.35, p=.854). Computed proportions indicated that 35% of the LC
students and 34% of the UC students Strongly Agreed or Agreed, 30% of the LC
students and 34% of the UC students had No Opinion, and 35% of the LC students
and 32% of the UC students Strongly Disagreed or Disagreed with the survey
182
statement. Therefore, the LC and UC students’ perceptions were inconclusive
and not statistically significant. Further, the results indicated that grade level did not
influence their perceptions.
Statement 6(n) Surveillance cameras throughout the school: There was no
significant difference in the distribution of responses between LC and UC students
(χ2=3.94, p=.414). Computed proportions indicated that 42% of the LC students and
34% of the UC students Strongly Agreed or Agreed, 36% of the LC students and 39%
of the UC students had No Opinion, and 22% of the LC students and 27% of the UC
students Strongly Disagreed or Disagreed with the survey statement. Therefore, the
LC and UC students’ perceptions were inconclusive and not statistically significant.
Further, the results indicated that grade level did not influence their perceptions.
Statement 6(o) Suspending/Expelling students for violence/drugs: There was
a significant difference in the distribution of responses between LC and UC students
(χ2=9.80, p=.044). Computed proportions indicated that 67% of the LC students and
54% of the UC students Strongly Agreed or Agreed, 27% of the LC students and 34%
of the UC students had No Opinion, and 6% of the LC students and 12% of the UC
students Strongly Disagreed or Disagreed with the survey statement. Therefore, the
LC and UC students’ perceptions were significantly different. Further, the results
indicated that grade level did influence their perceptions.
Statement 6(p) Teachers observing in the hallways before, during, and after
school: There was no significant difference in the distribution of responses between
LC and UC students (χ2=3.44, p=.487). Computed proportions indicated that 46% of
183
the LC students and 43% of the UC students Strongly Agreed or Agreed, 42% of
the LC students and 41% of the UC students had No Opinion, and 12% of the LC
students and 16% of the UC students Strongly Disagreed or Disagreed with the
survey statement. Therefore, the LC and UC students’ perceptions were inconclusive
and not statistically significant. Further, the results indicated that grade level did not
influence their perceptions.
Statement 6(q) Visitor check-in at the main office before receiving access to
the school: There was no significant difference in the distribution of responses
between LC and UC students (χ2=2.15, p=.708). Computed proportions indicated that
66% of the LC students and 66% of the UC students Strongly Agreed or Agreed, 27%
of the LC students and 26% of the UC students had No Opinion, and 7% of the LC
students and 8% of the UC students Strongly Disagreed or Disagreed with the survey
statement. Therefore, the LC and UC students’ perceptions were inconclusive and
not statistically significant. Further, the results indicated that grade level did not
influence their perceptions.
Statement 6(r) Dress code (eliminates gang attire): There was no significant
difference in the distribution of responses between LC and UC students (χ2=6.63,
p=.157). Computed proportions indicated that 50% of the LC students and 41% of
the UC students Strongly Agreed or Agreed, 30% of the LC students and 36% of the
UC students had No Opinion, and 20% of the LC students and 23% of the UC
students Strongly Disagreed or Disagreed with the survey statement. Therefore, the
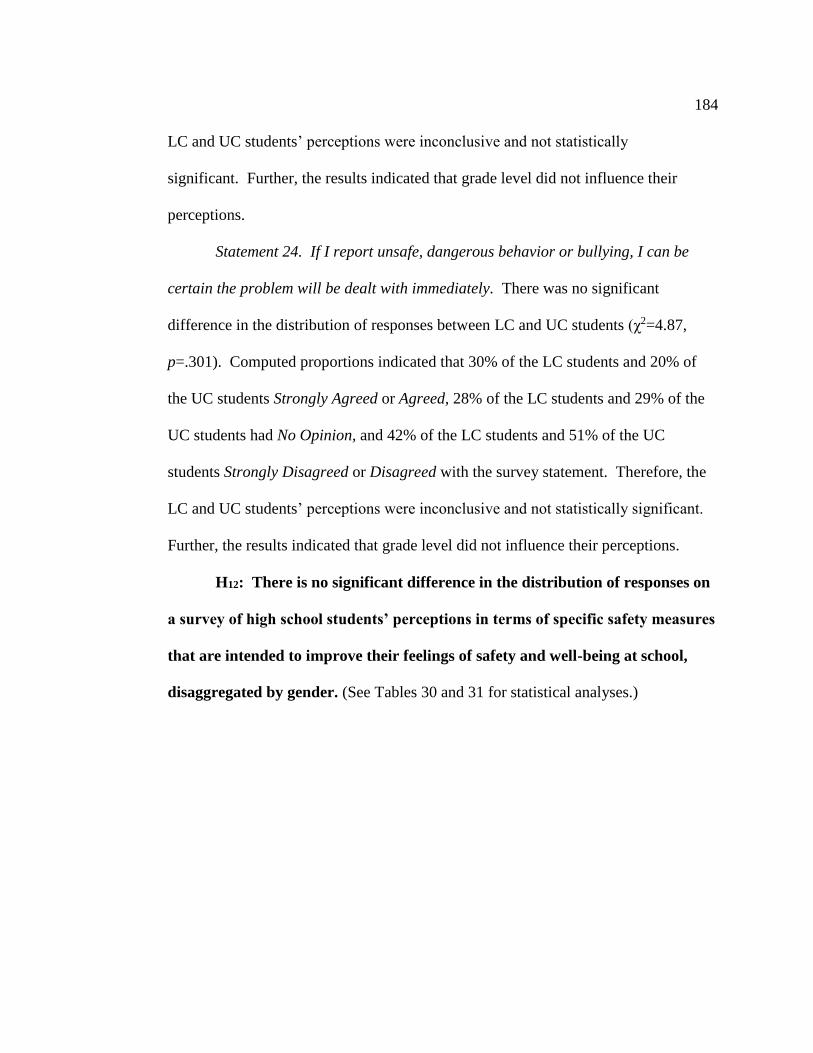
184
LC and UC students’ perceptions were inconclusive and not statistically
significant. Further, the results indicated that grade level did not influence their
perceptions.
Statement 24. If I report unsafe, dangerous behavior or bullying, I can be
certain the problem will be dealt with immediately. There was no significant
difference in the distribution of responses between LC and UC students (χ2=4.87,
p=.301). Computed proportions indicated that 30% of the LC students and 20% of
the UC students Strongly Agreed or Agreed, 28% of the LC students and 29% of the
UC students had No Opinion, and 42% of the LC students and 51% of the UC
students Strongly Disagreed or Disagreed with the survey statement. Therefore, the
LC and UC students’ perceptions were inconclusive and not statistically significant.
Further, the results indicated that grade level did not influence their perceptions.
H12: There is no significant difference in the distribution of responses on
a survey of high school students’ perceptions in terms of specific safety measures
that are intended to improve their feelings of safety and well-being at school,
disaggregated by gender. (See Tables 30 and 31 for statistical analyses.)
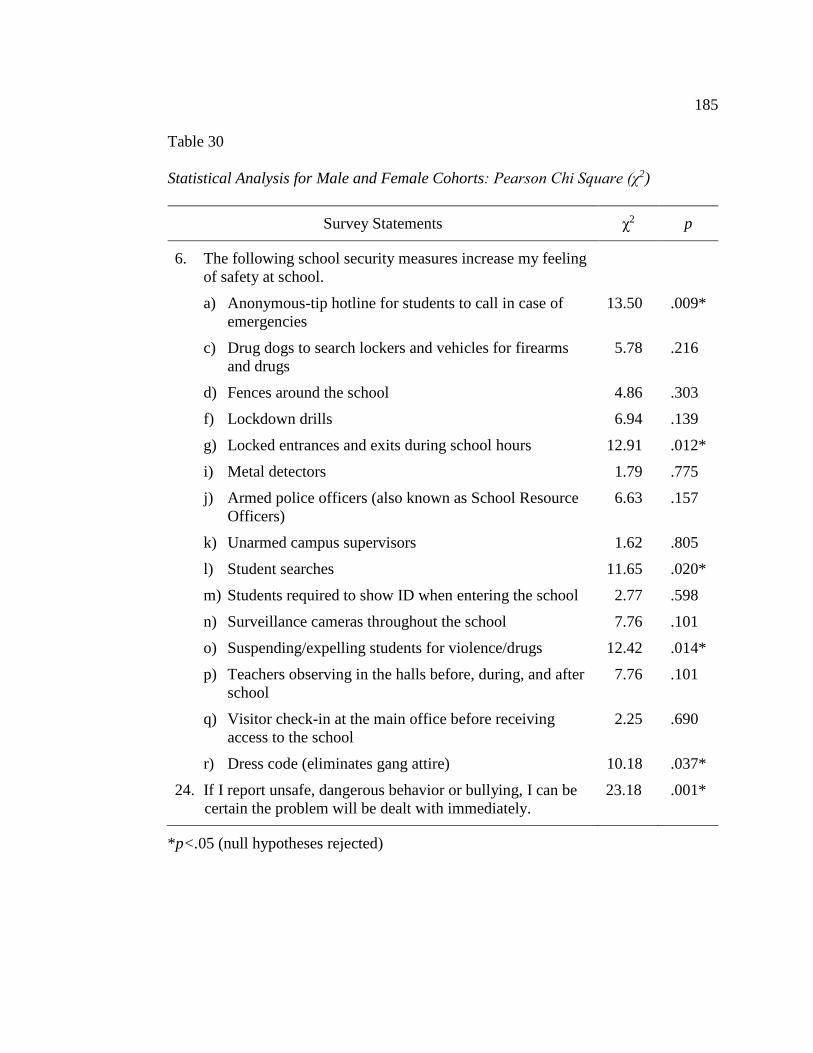
185
Table 30
Statistical Analysis for Male and Female Cohorts: Pearson Chi Square (χ2)
Survey Statements χ2 p
6. The following school security measures increase my feeling
of safety at school.
a) Anonymous-tip hotline for students to call in case of
emergencies
13.50 .009*
c) Drug dogs to search lockers and vehicles for firearms
and drugs
5.78 .216
d) Fences around the school 4.86 .303
f) Lockdown drills 6.94 .139
g) Locked entrances and exits during school hours 12.91 .012*
i) Metal detectors 1.79 .775
j) Armed police officers (also known as School Resource
Officers)
6.63 .157
k) Unarmed campus supervisors 1.62 .805
l) Student searches 11.65 .020*
m) Students required to show ID when entering the school 2.77 .598
n) Surveillance cameras throughout the school 7.76 .101
o) Suspending/expelling students for violence/drugs 12.42 .014*
p) Teachers observing in the halls before, during, and after
school
7.76 .101
q) Visitor check-in at the main office before receiving
access to the school
2.25 .690
r) Dress code (eliminates gang attire) 10.18 .037*
24. If I report unsafe, dangerous behavior or bullying, I can be
certain the problem will be dealt with immediately.
23.18 .001*
*p<.05 (null hypotheses rejected)
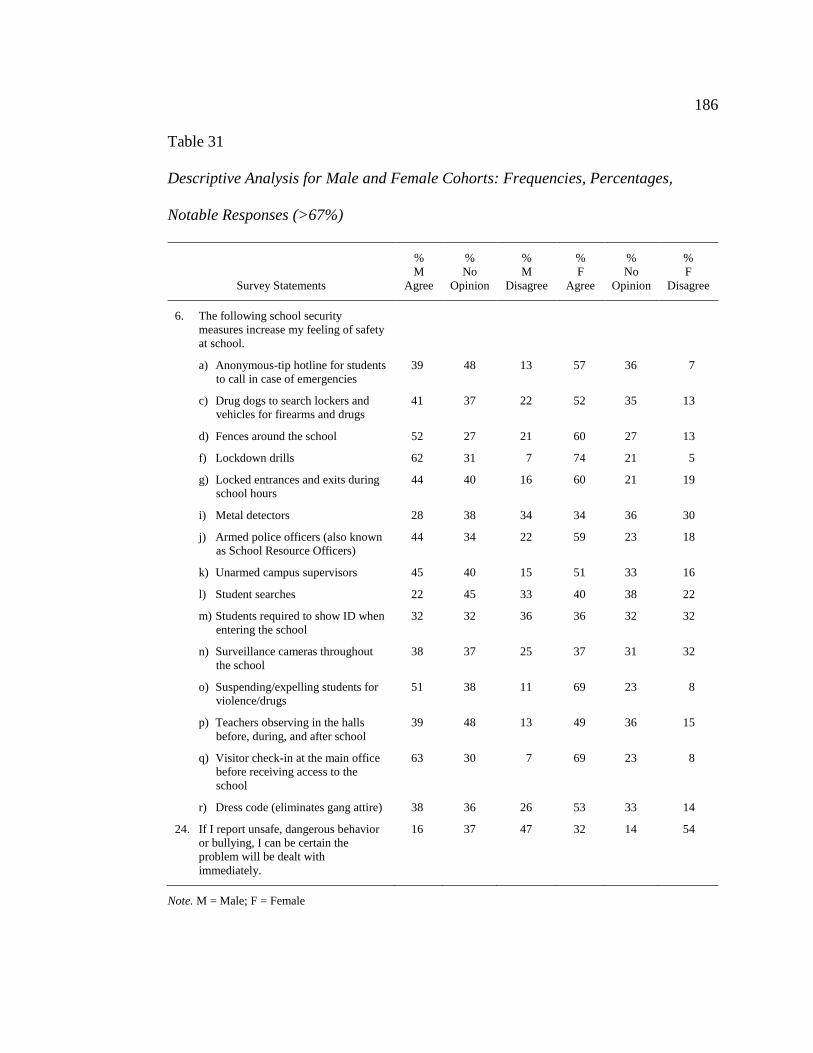
186
Table 31
Descriptive Analysis for Male and Female Cohorts: Frequencies, Percentages,
Notable Responses (>67%)
Survey Statements
%
M
Agree
%
No
Opinion
%
M
Disagree
%
F
Agree
%
No
Opinion
%
F
Disagree
6. The following school security
measures increase my feeling of safety
at school.
a) Anonymous-tip hotline for students
to call in case of emergencies
39 48 13 57 36 7
c) Drug dogs to search lockers and
vehicles for firearms and drugs
41 37 22 52 35 13
d) Fences around the school 52 27 21 60 27 13
f) Lockdown drills 62 31 7 74 21 5
g) Locked entrances and exits during
school hours
44 40 16 60 21 19
i) Metal detectors 28 38 34 34 36 30
j) Armed police officers (also known
as School Resource Officers)
44 34 22 59 23 18
k) Unarmed campus supervisors 45 40 15 51 33 16
l) Student searches 22 45 33 40 38 22
m) Students required to show ID when
entering the school
32 32 36 36 32 32
n) Surveillance cameras throughout
the school
38 37 25 37 31 32
o) Suspending/expelling students for
violence/drugs
51 38 11 69 23 8
p) Teachers observing in the halls
before, during, and after school
39 48 13 49 36 15
q) Visitor check-in at the main office
before receiving access to the
school
63 30 7 69 23 8
r) Dress code (eliminates gang attire) 38 36 26 53 33 14
24. If I report unsafe, dangerous behavior
or bullying, I can be certain the
problem will be dealt with
immediately.
16 37 47 32 14 54
Note. M = Male; F = Female
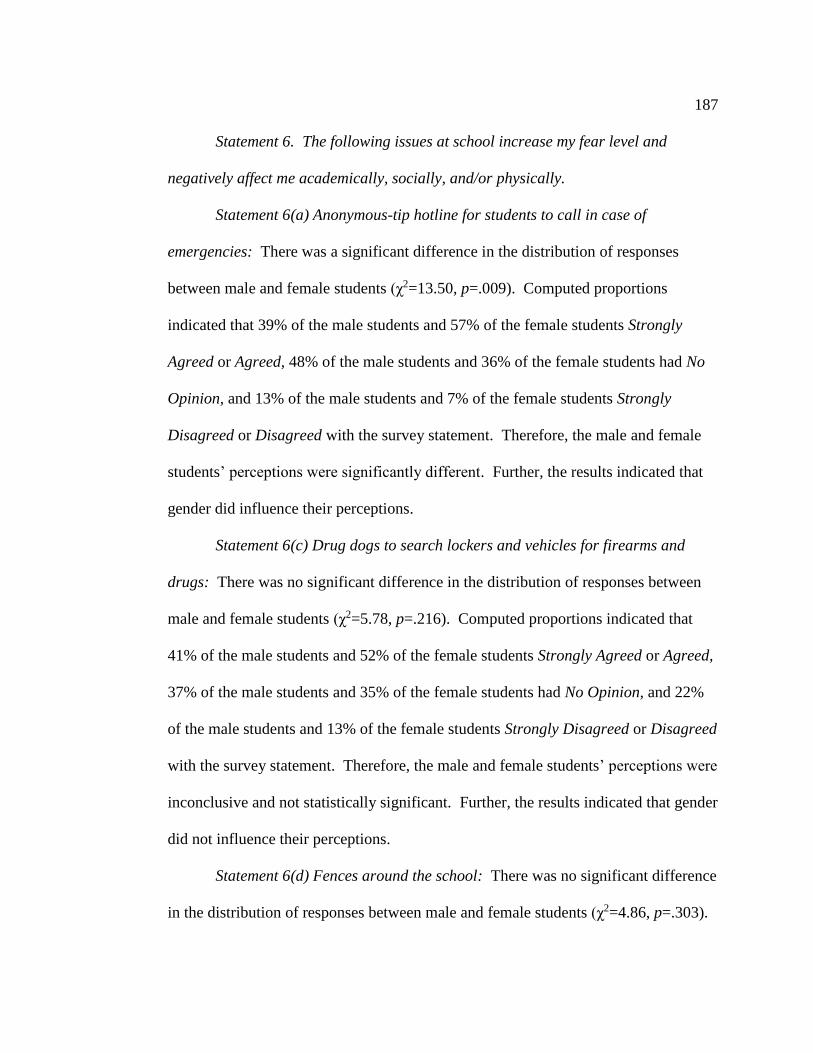
187
Statement 6. The following issues at school increase my fear level and
negatively affect me academically, socially, and/or physically.
Statement 6(a) Anonymous-tip hotline for students to call in case of
emergencies: There was a significant difference in the distribution of responses
between male and female students (χ2=13.50, p=.009). Computed proportions
indicated that 39% of the male students and 57% of the female students Strongly
Agreed or Agreed, 48% of the male students and 36% of the female students had No
Opinion, and 13% of the male students and 7% of the female students Strongly
Disagreed or Disagreed with the survey statement. Therefore, the male and female
students’ perceptions were significantly different. Further, the results indicated that
gender did influence their perceptions.
Statement 6(c) Drug dogs to search lockers and vehicles for firearms and
drugs: There was no significant difference in the distribution of responses between
male and female students (χ2=5.78, p=.216). Computed proportions indicated that
41% of the male students and 52% of the female students Strongly Agreed or Agreed,
37% of the male students and 35% of the female students had No Opinion, and 22%
of the male students and 13% of the female students Strongly Disagreed or Disagreed
with the survey statement. Therefore, the male and female students’ perceptions were
inconclusive and not statistically significant. Further, the results indicated that gender
did not influence their perceptions.
Statement 6(d) Fences around the school: There was no significant difference
in the distribution of responses between male and female students (χ2=4.86, p=.303).
188
Computed proportions indicated that 52% of the male students and 60% of the
female students Strongly Agreed or Agreed, 27% of the male students and 27% of the
female students had No Opinion, and 21% of the male students and 13% of the female
students Strongly Disagreed or Disagreed with the survey statement. Therefore, the
male and female students’ perceptions were inconclusive and not statistically
significant. Further, the results indicated that gender did not influence their
perceptions.
Statement 6(f) Lockdown drills: There was a significant difference in the
distribution of responses between male and female students (χ2=6.94, p=.139).
Computed proportions indicated that 62% of the male students and 74% of the female
students Strongly Agreed or Agreed, 31% of the male students and 21% of the female
students had No Opinion, and 7% of the male students and 5% of the female students
Strongly Disagreed or Disagreed with the survey statement. Therefore, the male and
female students’ perceptions were inconclusive and not statistically significant.
Further, the results indicated that gender did not influence their perceptions.
Statement 6(g) Locked entrances and exits during school hours: There was a
significant difference in the distribution of responses between male and female
students (χ2=12.91, p=.012). Computed proportions indicated that 44% of the male
students and 60% of the female students Strongly Agreed or Agreed, 40% of the male
students and 21% of the female students had No Opinion, and 16% of the male
students and 19% of the female students Strongly Disagreed or Disagreed with the
survey statement. Therefore, the male and female students’ perceptions were
189
significantly different. Further, the results indicated that gender did influence
their perceptions.
Statement 6(i) Metal detectors: There was no significant difference in the
distribution of responses between male and female students (χ2=1.79, p=.775).
Computed proportions indicated that 28% of the male students and 34% of the female
students Strongly Agreed or Agreed, 38% of the male students and 36% of the female
students had No Opinion, and 34% of the male students and 30% of the female
students Strongly Disagreed or Disagreed with the survey statement. Therefore, the
male and female students’ perceptions were inconclusive and not statistically
significant. Further, the results indicated that gender did not influence their
perceptions.
Statement 6(j) Armed police officers (also known as School Resource
Officers): There was no significant difference in the distribution of responses
between male and female students (χ2=6.63, p=.157). Computed proportions
indicated that 44% of the male students and 59% of the female students Strongly
Agreed or Agreed, 34% of the male students and 23% of the female students had No
Opinion, and 22% of the male students and 18% of the female students Strongly
Disagreed or Disagreed with the survey statement. Therefore, the male and female
students’ perceptions were inconclusive and not statistically significant. Further, the
results indicated that gender did influence their perceptions.
Statement 6(k) Unarmed campus supervisors: There was no significant
difference in the distribution of responses between male and female students
190
(χ2=1.62, p=.805). Computed proportions indicated that 45% of the male students
and 51% of the female students Strongly Agreed or Agreed, 40% of the male students
and 33% of the female students had No Opinion, and 15% of the male students and
16% of the female students Strongly Disagreed or Disagreed with the survey
statement. Therefore, the male and female students’ perceptions were inconclusive
and not statistically significant. Further, the results indicated that gender did not
influence their perceptions.
Statement 6(l) Student searches: There was a significant difference in the
distribution of responses between male and female students (χ2=11.65, p=.020).
Computed proportions indicated that 22% of the male students and 40% of the female
students Strongly Agreed or Agreed, 45% of the male students and 38% of the female
students had No Opinion, and 33% of the male students and 22% of the female
students Strongly Disagreed or Disagreed with the survey statement. Therefore, the
male and female students’ perceptions were significantly different. Further, the
results indicated that gender did influence their perceptions.
Statement 6(m) Students required to show ID when entering the school: There
was a significant difference in the distribution of responses between male and female
students (χ2=2.77, p=.598). Computed proportions indicated that 32% of the male
students and 36% of the female students Strongly Agreed or Agreed, 32% of the male
students and 32% of the female students had No Opinion, and 36% of the male
students and 32% of the female students Strongly Disagreed or Disagreed with the
survey statement. Therefore, the male and female students’ perceptions were
191
inconclusive and not statistically significant. Further, the results indicated that
gender did not influence their perceptions.
Statement 6(n) Surveillance cameras throughout the school: There was no
significant difference in the distribution of responses between male and female
students (χ2=7.76, p=.101). Computed proportions indicated that 38% of the male
students and 37% of the female students Strongly Agreed or Agreed, 37% of the male
students and 31% of the female students had No Opinion, and 25% of the male
students and 32% of the female students Strongly Disagreed or Disagreed with the
survey statement. Therefore, the male and female students’ perceptions were
inconclusive and not statistically significant. Further, the results indicated that gender
did not influence their perceptions.
Statement 6(o) Suspending/expelling students for violence/drugs: There was a
significant difference in the distribution of responses between male and female
students (χ2=12.42, p=.014). Computed proportions indicated that 51% of the male
students and 69% of the female students Strongly Agreed or Agreed, 38% of the male
students and 23% of the female students had No Opinion, and 11% of the male
students and 8% of the female students Strongly Disagreed or Disagreed with the
survey statement. Therefore, the male and female students’ perceptions were
significantly different. Further, the results indicated that gender did influence their
perceptions.
Statement 6(p) Teachers observing in the halls before, during, and after
school: There was no significant difference in the distribution of responses between
192
male and female students (χ2=7.76, p=.101). Computed proportions indicated that
39% of the male students and 49% of the female students Strongly Agreed or Agreed,
48% of the male students and 36% of the female students had No Opinion, and 13%
of the male students and 15% of the female students Strongly Disagreed or Disagreed
with the survey statement. Therefore, the male and female students’ perceptions were
inconclusive and not statistically significant. Further, the results indicated that gender
did influence their perceptions.
Statement 6(q) Visitor check-in at the main office before receiving access to
the school: There was no significant difference in the distribution of responses
between male and female students (χ2=2.25, p=.690). Computed proportions
indicated that 63% of the male students and 69% of the female students Strongly
Agreed or Agreed 30% of the male students and 23% of the female students had No
Opinion, and 7% of the male students and 8% of the female students Strongly
Disagreed or Disagreed with the survey statement. Therefore, the male and female
students’ perceptions were inconclusive and not statistically significant. Further, the
results indicated that gender did not influence their perceptions.
Statement 6(r) Dress code (eliminates gang attire): There was a significant
difference in the distribution of responses between male and female students
(χ2=10.18, p=.037). Computed proportions indicated that 38% of the male students
and 53% of the female students Strongly Agreed or Agreed, 36% of the male students
and 33% of the female students had No Opinion, and 26% of the male students and
14% of the female students Strongly Disagreed or Disagreed with the survey
193
statement. Therefore, the male and female students’ perceptions were
significantly different. Further, the results indicated that gender did influence their
perceptions.
Statement 24. Because of the fear I have for my safety at school, it is difficult
to concentrate on my academics. There was a significant difference in the
distribution of responses between male and female students (χ2=23.18, p=.001).
Computed proportions indicated that 16% of the male students and 32% of the female
students Strongly Agreed or Agreed, 37% of the male students and 14% of the female
students had No Opinion, and 47% of the male students and 54% of the female
students Strongly Disagreed or Disagreed with the survey statement. Therefore, the
male and female students’ perceptions were significantly different. Further, the
results indicated that gender did influence their perceptions.
Open-Ended Statements. Open-ended statements specifically focusing on
the research theme of specific safety measures were included in the study as a method
of gathering responses from the students that this researcher may have overlooked.
The open-ended statements from the Student Safety Survey that addressed academic,
social, and physical well-being was 6(s).
Statement 6(s). The following school security measures increase my feeling of
safety at school. Two students responded to this statement with the following
comment: Staff members/teachers that care about students (2).
194
Summary
This chapter presented the statistical and descriptive results of 269 surveys
completed by the student respondents about the fears they might experience on
secondary school campuses and what policies and procedures the respondents
perceived increased their feelings of safety and security on campus. Chapter V
summarizes the results, presents conclusions, provides recommendations for
educators, and proposes recommendations for further study.
195
CHAPTER V
SUMMARY, CONCLUSIONS, AND IMPLICATIONS
The purpose of this study was to ascertain secondary school students’
perceived fears and to identify specific measures that the students believed would
assuage their fears and increase safety school wide. The following research questions
were utilized to gain insight into students’ perceptions: (a) What personal safety and
security fears do high school students have on campus? (b) How do those specific
fears impact high school students’ academic, social, and physical well-being?
(c) What specific safety measures do high school students perceive increase their
feelings of safety and well-being at school?
Summary of Findings
Chapter IV presented the statistical and descriptive analyses of findings based
on 269 Student Safety Surveys that were completed by student respondents regarding
what fears they experienced on secondary school campuses and what policies and
procedures the respondents perceived would improve their feelings of safety and
security on campus. The frequency and percentages of the cohorts’ responses and the
application of the Chi-Square Test of Independence to the response distributions
generated quantifiable findings that lead to the conclusions discussed on the
following pages. Overall, the data generated by the White and Hispanic cohorts and
the eligible and not-eligible free or reduced-price lunch cohorts were generally in
agreement and more uniformly expressed across the response distributions. On the
196
other hand, the data generated by the lowerclassmen (LC) and upperclassmen
(UC) cohorts and the male and female cohorts were both convergent and divergent
and resulted in robust response distributions that were significant (p<.05) and notable
(>67%). (See Appendix I for a chart showing the Research Themes in this study.)
Research Theme 1: Personal Safety and Security
After analyzing the data generated by the Student Safety Survey, this
researcher concluded that Statements 1, 3, 5, 7, 9, 13 (a, c, d and f), 14 (a, e, f, and g),
16, 17, 18, and 21 were most closely aligned with Research Theme 1: Personal Safety
and Security. Further, this researcher identified six critical areas of need based on the
significance and importance of the responses to the Student Safety Survey: (a) general
students’ perceptions of school safety, (b) drug use, (c) physical violence,
(d) bullying, (e) prejudice and racism, and (f) campus locations perceived as safe or
unsafe. These areas of need are organized by demographic category and form the
foundation for the remaining discussion in this chapter.
Demographic Category 1: Ethnicity or Race. General Perceptions of
Students Regarding School Safety. The White and Hispanic students agreed that they
felt safe in at least one class at school, that they felt safe from social and cyber
bullying, and that they thought there was at least one caring adult at the school whom
they trusted. The cohorts consistently and strongly expressed a feeling of safety and
security at their school.
Prejudice and Racism. The White and Hispanic students differed in their
opinions regarding prejudice and racism, as expressed by the students on the basis of
197
gender. The White respondents sensed a stronger level of prejudice based on
gender than did the Hispanic students.
Campus Locations Perceived as Safe or Unsafe. The White and Hispanic
respondents agreed that the parking lots on campus were safe. However, the White
respondents expressed a higher level of confidence in the level of security than did
the Hispanic respondents.
Demographic Category 2: Socioeconomic Status. General Perceptions of
Students Regarding School Safety. The students who were eligible and those who
were not eligible for free or reduced-price lunch agreed that they felt safe in at least
one class at school, that they felt safe from social and cyber bullying, and thought
there was at least one caring adult at the school whom they trusted. Their opinions
consistently and strongly expressed a feeling of safety and security at their school.
Additionally, both cohorts expressed that they did not fear for their safety enough to
avoid participating in school activities.
Drug Use. The students who were eligible and those who were not eligible for
free or reduced-price lunch expressed important, yet differing perceptions regarding
the use and sales of drugs on campus. A majority of the noneligible students
expressed no opinion about the subject compared to the eligible students, who were
more inclined to disagree with the perception that drug use and sales increased
student fears.
Demographic Category 3: Grade Level. General Perceptions of Students
Regarding School Safety. The lowerclassmen (LC) and upperclassmen (UC) agreed
198
that they felt safe in at least one class at school and thought there was at least one
caring adult at the school whom they trusted. Although both cohorts’ perceptions of
safety toward social and cyber bullying were high, they did not reach the level of
notable. Their opinions consistently and strongly expressed a feeling of safety and
security at their school.
Drug Use. The lowerclassmen and upperclassmen expressed opposing
opinions regarding the fear created by the use and sales of drugs on campus. Nearly
half of the lowerclassmen expressed a greater level of fear than did the
upperclassmen, who were more likely to minimize the issue.
Prejudice and Racism. The lowerclassmen and upperclassmen expressed
opposing opinions regarding the level of perceived prejudice based on sexual
orientation. The lowerclassmen believed that prejudice based on sexual orientation
increased their fear for their safety or the safety of other students. Some
upperclassmen felt similarly; however, a majority of the UC respondents thought that
the campus provided an environment free from prejudice based on sexual orientation.
Bullying. The lowerclassmen and upperclassmen expressed opposing opinions
regarding the effect of physical, social, and verbal bullying on student fears at school.
In fact, nearly twice as many lowerclassmen believed that bullying significantly
increased their feelings of fear on campus. The strength of their divergence of
opinion may reflect the effects of chronological age and level of maturation on
students’ feelings of security.
199
Demographic Category 4: Gender. General Perceptions of Students
Regarding School Safety. The male and female students agreed that they felt safe in
at least one class at school, that they felt safe from social and cyber bullying, and
believed that there was at least one caring adult at the school whom they trusted.
Their opinions consistently and strongly expressed a feeling of safety and security at
their school. Additionally, both cohorts expressed that they did not fear for their
safety enough to avoid participating in school activities.
Physical Violence. The males and females differed in their perceptions of
student fights on campus. The males were more likely to disagree with the notion
that fights increased their level of fear, while the females were more likely to perceive
physical fights as a fear-inducing event.
Prejudice and Racism. The males and females expressed conflicting attitudes
toward prejudice and racism based on culture, ethnicity or race, gender, and sexual
orientation. The females overwhelmingly expressed fear for their safety due to
prejudice and racism on campus.
Campus Locations Perceived as Safe or Unsafe. The male and female
students varied in their feelings about their safety and security at specific locations on
campus. The females suggested that hallways and locker rooms were safe, while the
majority of the males had no opinion about the level of security at either location.
Bullying. The males and females had opposing opinions regarding the effect
of physical, social, and verbal bullying on student fears at school. Bullying
significantly increased the females’ safety concerns on campus, while the males
200
appeared to be less apprehensive about their safety. The strength of their
divergence of opinion reflects the effect of gender on students’ feelings of security.
Research Theme 2: Academic, Social, and Physical Well-being
After analyzing the data generated by the Student Safety Survey, this
researcher concluded that Statements 12 (a, c, d, f, l, m, n, p, r, s, t, u, and w) and 22
were most closely aligned with Research Theme 2: Academic, Social, and Physical
Well-being. Further, this researcher identified six critical areas of need based on the
significance and importance of the responses to the Student Safety Survey: (a) general
students’ perceptions of school safety, (b) drug use, (c) physical violence,
(d) bullying, (e) social impact, and (f) school/personal property crimes. These areas
of need are organized by demographic category and form the foundation for the
remaining discussion in this chapter.
Demographic Category 1: Ethnicity/Race. General Perceptions of Students
Regarding School Safety. The White and Hispanic students validated that personal
fears did not affect their ability to concentrate on academics. The cohorts consistently
and strongly expressed a feeling of safety and security at their school.
Demographic Category 2: Socioeconomic Status. General Perceptions of
Students Regarding School Safety. The students who eligible for free or reduced-
price lunch and those who were not eligible generally agreed that personal fears at
school did not affect their ability to concentrate on academics. However, nearly twice
as many eligible students declined to state an opinion, with only a minority
expressing agreement.
201
Demographic Category 3: Grade Level. Drug Use. The lowerclassmen
and upperclassmen expressed opposing opinions regarding the effect of alcohol and
drug use on their academic, social, and/or physical well-being. Nearly half of the
lowerclassmen expressed a greater level of fear than the upperclassmen, who were
more likely to express no opinion and/or disagreed.
Physical Violence. The perceptions of the lowerclassmen and upperclassmen
differed regarding the effect of physical fights, school shootings, and weapons on
their academic, social, and/or physical well-being. Overall, the lowerclassmen were
more fearful than the upperclassmen.
Bullying. The perceptions of the lowerclassmen and upperclassmen differed
regarding the effect of cyber, physical, social, and verbal bullying on their academic,
social, and/or physical well-being. Overall, the lowerclassmen were more fearful
than the upperclassmen.
Social Impact. The perceptions of the lowerclassmen and upperclassmen
differed regarding the effect of gang activity and racism on their academic, social,
and/or physical well-being. Overall, the lowerclassmen were more fearful than the
upperclassmen.
School/Personal Property Crimes. The perceptions of the lowerclassmen and
upperclassmen differed regarding the effect of school and personal property crimes
on their academic, social, and/or physical well-being. Overall, the lowerclassmen
were more fearful than the upperclassmen.
202
Demographic Category 4: Gender. Bullying. The perceptions of the
male and female students differed regarding the effect of cyber, physical, social, and
verbal bullying on their academic, social, and/or physical well-being. Overall, the
female students were more fearful than the male students.
Social Impact. The perceptions of the male and female students differed
regarding the effect of gang activity and racism on their academic, social, and/or
physical well-being. Overall, the female students were more fearful than the male
students.
Physical Violence. The perceptions of the male and female students differed
regarding the effect of physical fights, school shootings, and weapons on campus on
their academic, social, and/or physical well-being. Overall, the female students were
more fearful than the male students.
School/Personal Property Crimes. The perceptions of the male and female
students differed regarding the effect of school and personal property crimes on their
academic, social, and/or physical well-being. Overall, the female students were more
fearful than the male students.
Research Theme 3: Specific Safety Measures
After analyzing the data generated by the Student Safety Survey, this
researcher concluded that Statements 6 (a, c, d, f, g, i, j, k, l, m, n, o, p, q, r) and 24
were most closely aligned with Research Theme 3: Specific Safety Measures.
Further, this researcher identified four critical areas of need based on the significance
and importance of the responses to the Student Safety Survey: (a) facilities,
203
(b) personnel, (c) safety procedures, and (d) school disciplinary policies. These
areas of need are organized by demographic category and form the foundation for the
remaining discussion in this chapter.
Demographic Category 1: Ethnicity/Race. Safety Procedures. The White
and Hispanic students differed in their opinions regarding students showing
identification when entering campus. The Hispanic students suggested that the
procedure increased their feeling of well-being at school, while the White students
disagreed. However, both cohorts strongly agreed that lockdown drills positively
impacted students’ perceptions of safety.
Facilities. The White and Hispanic students exhibited divergent attitudes
about the use of surveillance cameras as a measure of increasing students’ feelings of
safety at school. The Hispanic students agreed, and the White students disagreed, that
the use of cameras increased students’ perceptions of safety.
Demographic Category 2: Socioeconomic Status. Safety Procedures. The
students who were eligible for free or reduced-price lunch and those who were not
eligible disagreed about the use of metal detectors as a means of increasing students’
perceptions of safety at school. The eligible students agreed, while those who were
not eligible had no opinion.
Personnel. The students who were eligible for free or reduced-price lunch and
those who were not eligible recorded a divergence of opinion about teachers
observing in the halls as a measure of increasing students’ feelings of safety. The
eligible students agreed, whereas, those who were not eligible had no opinion.
204
Conversely, the eligible students portrayed no opinion, while those who were not
eligible disagreed with the idea that reporting unsafe behavior would lead to a
solution to the problem.
Demographic Category 3: Grade Level. Safety Procedures. The perceptions
of the lowerclassmen and the upperclassmen differed regarding the implementation of
an anonymous-tip hotline on campus to increase student feelings of safety. Overall,
the lowerclassmen agreed, while the upperclassmen had no opinion.
School Disciplinary Policies. The lowerclassmen and the upperclassmen
expressed divergent feelings about the use of drug dogs to increase students’
perceptions of safety at school. The upperclassmen felt more strongly about this
policy as a means of increasing safety perceptions than did the lowerclassmen.
However, both cohorts agreed that the strategy of suspending or expelling students
for violence/drug use increased students’ perceptions of safety at school.
Facilities. The lowerclassmen and the upperclassmen expressed positive
opinions about the use of fences around the school and locked entrances and exits
during school hours as a means of increasing students’ perceptions of safety at school.
However, a small group of the upperclassmen disagreed that their use increased
student safety.
Demographic Category 4: Gender. Safety Procedures. The males and
females disagreed about the use of an anonymous-tip hotline as a means to increase
students’ perceptions of safety at school. The females strongly supported their use,
while the males remained neutral about the use of these phone numbers.
205
Facilities. The male and female students differed in their opinions about
locked entrances and exits during school hours as a means of increasing students’
perceptions of safety at school. More female students agreed with this as a method of
increasing safety than did male students.
School Disciplinary Policies. The perceptions of the male and female students
differed regarding the application of suspending and/or expelling students for
violence or drug use and the use of a dress code to increase student feelings of safety
at school. A majority of the female students agreed that these measures increased
their safety at school. The males were likely to agree but with less intensity.
Personnel. The perceptions of the male and female students were similar
regarding the belief that reporting unsafe behavior would lead to a solution to the
problem. Both cohorts generally agreed that reporting would not resolve the
complaint; however, more male students expressed no opinion than did female
students.
Conclusions
These critical areas of need (identified by research theme and demographic
group in the summary of findings) provide scaffolding for the remaining discussion.
Survey responses will be compared and contrasted across all demographic groups to
provide a cogent set of assumptions from which to draw conclusions regarding
secondary students’ perceptions of safety and security on their campus.
206
General Perceptions of Students Regarding School Safety
Across all demographic categories and cohorts, the respondents’ perceptions
of school safety was positive: They felt safe in at least one class at school; they felt
safe from social and cyber bullying in at least one class at school; and they believed
that at least one caring adult in school could be trusted. Additionally, White and
Hispanic students as well as students who were eligible and those who were not
eligible for free or reduced-price lunch Strongly Agreed that personal fears at school
did not affect their ability to concentrate on academics. Finally, male and female
students and students who were eligible and those who were not eligible for free or
reduced-price lunch reported that they did not avoid participating in school activities
due to fear for their safety.
Studies conducted by Hong and Eamon (2001), Sparks (2011b), and Hammond
(2002) showed that students recognize their schools as safe places when they have
teachers who are willing to build relationships of trust with them and are firm, fair,
and consistent in classroom management. Additionally, Friedberg (1998) and
Hantman et al. (2008) concluded that a school’s safety practices can positively impact
a student’s academic performance and attitude toward school.
This researcher believes that the findings from the present study validate the
research and strongly reflect the respondents’ collective opinion that they feel
extremely safe on campus and that school officials have implemented effective safety
practices. This researcher suggests that school districts continue to emphasize
professional development, specifically in the area of classroom management and
207
strategies for building relationships of trust with students. Additionally, this
researcher suggests that school districts widely advertise its safety practices and
policies to ensure that these norms are put into daily practice and become part of the
school culture.
Drug Use
Two demographic cohorts expressed differences of opinion regarding the fear
that drug and alcohol use and sales creates on campus. First, students who were
eligible and those who were not eligible for free or reduced-price lunch disagreed and
had no opinion, respectively, that drug use and sales did not increase their fears.
Second, lowerclassmen and upperclassmen expressed opposing views regarding the
perceived impact that drugs and alcohol had on their academic, social, and physical
well-being. Nearly half of the lowerclassmen expressed fear that these substances
would affect their well-being in some way.
Robers et al. (2014) found that drug and illegal substance usage on school
campuses remained unabated, with approximately one fourth of the students in their
study admitting to being offered, sold, or given drugs. These statistics are somewhat
higher for Hispanic students. On a positive note, secondary students in Alabama
experienced a slight decrease in reported incidences (Pride Surveys, 2006).
Though the demography cited in the literature confirms the continued existence
of substance abuse and dangerous behaviors on school campuses, findings that
describe the potential consequences to students are limited (Pride Surveys, 2006;
Robers et al., 2014). This researcher notes that three of the four cohorts identified in
208
this section were not fearful that drugs and substance abuse would have a negative
effect on their security. However, the lowerclassmen were clearly apprehensive.
This researcher suggests that an intensive effort should be made by school officials to
understand why the youngest high school students express such anxiety toward drug
and alcohol use on campus and what strategies may be helpful in assuaging their
fears.
Bullying and Physical Violence
Two demographic cohorts expressed strong feelings about bullying and
physical violence. First, the lowerclassmen and upperclassmen expressed opposing
opinions regarding the harmful consequences of physical, social, and verbal bullying
to their feelings of well-being at school. In fact, nearly twice as many lowerclassmen
thought that bullying significantly increased their feelings of fear on campus.
Second, the male and female students expressed the same contrasting attitudes toward
bullying and physical violence. The female students conveyed nearly twice the fear
and apprehension toward bullying and fighting as did the male students.
The literature is replete with studies that confirm that high school students are
frequently bullied and that females and lowerclassmen are at the greatest risk for
attack, regardless of the source—social media, verbal, or on campus (Akiba, 2008;
Robers et al., 2014). Surprisingly, the number of students who have been actually
threatened or injured with a weapon, such as a gun, knife, or club, is relatively small
and more frequently male (Robers et al., 2014).
209
The present study confirms the demographic and descriptive findings of
Robers et al. (2014). Clearly, the cohorts most susceptible to the fear of bullying and
school violence were the females and lowerclassmen. These findings may reflect the
effects of chronological age, levels of maturation, and established gender norms on
these students’ sense of security. This researcher strongly suggests that safety
strategies be implemented to allow students opportunities to report bullying and
violence and to provide programs to enhance students’ self-esteem and confidence in
responding appropriately to potentially volatile behaviors on campus.
Prejudice and Racism
Three demographic cohorts expressed differences of opinion regarding the
fears that prejudice and racism create for students at school. First, the White
respondents sensed a stronger level of prejudice toward gender than did the Hispanic
students. Second, the lowerclassmen believed that prejudice toward sexual
orientation increased their fear for their safety or the safety of other students, while
the upperclassmen thought the school was mostly free from prejudice based on sexual
orientation. Third, the female respondents feared more for their safety or the safety of
other students based on expressions of prejudice and racism toward culture,
ethnicity/race, gender, and sexual orientation than did their counterparts.
Robers et al. (2014) found that prejudice toward ethnicity or race was more
prevalent among the male Hispanic students. The females were exposed to more
prejudice toward their sexual orientation than were the males; across grade levels,
there was an equal distribution of perceived prejudice and racism in general.
210
The literature confirms the findings of the present study that the well-being
of the cohorts identified in this section are at considerable risk. Ethnicity or race,
grade level, and gender are important cohorts when considering prejudice and racism
at school. This researcher suggests that schools examine closely the impact that
prejudice and racism have on students’ sense of well-being and look at specific
methods of data gathering to accurately determine the students’ needs.
Social Impacts
Fears about student suicide and gang activity differed among two
demographic cohorts—males and females and lowerclassmen and upperclassmen.
First, females maintained that student suicide increased fears about their own well-
being. However, student suicide had no other significance to any other cohort.
Second, the lowerclassmen were more fearful of gang-related activity than were the
upperclassmen, and the female students were more fearful than male students.
Robers et al. (2014) showed that secondary school student suicides are not as
prevalent as some would seem. Pride Surveys (2006) illustrated a decrease in violent
behavior and more students feeling safe at school than ever before, even with an
increasing number of students participating in gang-related activity.
The literature validates the findings of the present study, which depicts that
student suicide, although tragic, does not tend to increase student fears on campus.
Additionally, the fear of gang violence is less prevalent on secondary school
campuses. The present study also suggests that the fear of gang activity is an issue
that affects more than merely ethnicity and race; it also affects specific genders and
211
grade levels. This researcher recommends that (a) schools establish programs that
focus on suicide prevention and policies that delineate what to do in case of a student
suicide, and (b) schools evaluate and identify gang activity on campus and create
policies for dealing with the issue before it negatively affects the students involved
and other student.
Securing Facilities and Campus Locations
Four demographic cohorts expressed differing opinions about technology and
resources that are utilized to make students feel more secure at school. First, the
White and Hispanic students agreed that parking lots on campus were safe; however,
the White respondents expressed a greater degree of confidence. Second, the female
students suggested that hallways and locker rooms were safe. The males had no
opinion. Third, the White and Hispanic students exhibited divergent attitudes about
the use of surveillance cameras at school. More Hispanic students agreed that
cameras increased their safety, while the White students were less committal. Fourth,
the lowerclassmen and upperclassmen expressed positive, convergent opinions about
the use of fencing and locked entrances and exits during school hours to increase
students’ perceptions of safety at school; however, the male and female students
differed in their feelings. The female students agreed with the lowerclassmen and
upperclassmen that fences and locked entrances increased student safety, whereas the
male students did not. Fifth, students who were eligible for free or reduced-price
lunch and those who were not eligible differed in their opinions about metal detectors
212
on campus. The eligible students were more likely to agree that metal detectors
made students feel safer at school, while the noneligible students expressed no
opinion.
Robers et al. (2014) maintained that the majority of students in their study
reported that their schools used security cameras, locked entrances and exits, and
even metal detectors to ensure student safety, but the study does not reveal students’
perceptions of increased safety based on their implementation. However, Thomas
and Smith (2004), Hankin et al. (2011), and Sparks (2011a) discovered that metal
detectors in schools did not necessarily reduce the risk of violence in schools, and
many students viewed surveillance cameras as an invasion of privacy.
The present study validates the literature that students perceive the use of
security measures differently on campus. This researcher suggests that the present
study shows that some security measures that schools implement do not have their
desired impact on students’ perceptions of safety at school such as metal detectors
and security cameras. Additionally, this researcher suggests that schools explore
research data on what security measures are proven to increase students’ perceptions
of safety, and include students in the process of determining and establishing specific
security measures on campus.
School- and Personal-Property Crimes
The perceptions of the lowerclassmen and upperclassmen and the male and
female students differed regarding the effect of theft and vandalism on their feelings
213
of well-being. Overall, the lowerclassmen were more fearful of theft and
vandalism, as were the females.
The study by Robers et al. (2014) depicted that property crimes against students
and schools continue to be an issue that vexes schools, particularly lowerclassmen,
even with a decline in the problem over the years. This decrease could be due to
faculty, staff, and students who are more vigilant about protecting their personal items
or because of students who are less likely to report thefts.
The present study validates the literature which shows a large percentage of
students, both females and lowerclassmen, who are significantly fearful of school-
and personal-property crimes at school, even though thefts and vandalism are
declining in schools. This researcher suggests that schools work with students, staff,
and parents to develop methods for protecting personal property and to deal with
vandalism on campus.
School Personnel
Two demographic cohorts had divergent opinions about personnel matters that
were designed to alleviate students’ fears on campus. First, the students who were
eligible for free or reduced-price lunch and those who were not eligible recorded a
divergence of opinion about teachers observing activities in the halls. The eligible
students asserted that their feelings of safety increased with teachers and staff
observing students, while the noneligible students had no opinion. Second, the
noneligible students and both the male and female students did not believe that
214
reporting unsafe behavior to a responsible staff member would resolve the
complaint or lead to a solution to the problem.
Robers et al. (2014) submitted that students noticed when adult supervision was
present in the hallways at school. Studies conducted by Wood and Huffman (1999);
Phillips, Pack, and Linney (2008); and Pollack, Modzeleski, and Rooney (2008)
showed that positive interactions must take place between students and school staff in
order to build trusting relationships that are key to having students report dangerous
and inappropriate behavior on campus.
This researcher believes the findings of the present study validate the literature
maintaining that adult supervision at school increases feelings of safety for some
students. However, the present study also exposes a vast difference between the
literature and the findings. The students who were eligible for free or reduced-price
lunch and the male and female students did not believe that reporting unsafe behavior
to a responsible adult would result in a timely solution to the problem. This
researcher suggests that schools (a) continue to promote, if not require, teacher and
staff supervision before, during and after school in the hallways and common areas;
(b) create multiple methods for students to report unsafe behavior; and (c) establish
an accountability system to ensure that students’ fears are addressed in order to build
student confidence and trust in teachers, administrators, and staff.
Safety Procedures and Disciplinary Policies
Each demographic cohort expressed a variety of opinions about whether
safety procedures and disciplinary policies increased students’ perceptions of
215
security. First, opinions differed between White and Hispanic students regarding
the policy of showing identification when entering campus and the practice of
lockdown drills. The Hispanic students asserted that showing identification when
entering school improved their feelings of well-being; however, with regard to
lockdown drills, both cohorts affirmed that the training helped to increase students’
perceptions of safety. Second, the perceptions of the lowerclassmen and
upperclassmen and the males and females differed regarding the implementation of
an anonymous-tip hotline. The lowerclassmen and the females agreed that the
practice increased their feelings of safety, while the upperclassmen and the males had
no opinion. Third, the lowerclassmen and upperclassmen expressed divergent
feelings about the use of drug dogs at school. The upperclassmen had a more positive
outlook about this policy as a means of increasing safety perceptions than did the
lowerclassmen. Fourth, the lowerclassmen and upperclassmen and the male and
female students varied in their attitudes about suspending or expelling students for
violence and drug use. The lowerclassmen, upperclassmen, and female students
conveyed feelings of increased safety when violent students and drug offenders were
suspended or expelled from school. The males were likely to agree but with less
intensity. Fifth, the use of a dress code to increase students’ feelings of safety at
school was an area where the male and female students thought the exercise enhanced
their feelings of safety on campus, although more females believed this than did the
males.
216
Studies conducted by Wood and Huffman (1999), Kennedy (2011), Toppo
(2006), Kress (2011), Gregory and Cornell (2009), and Lindle (2008) reported
findings that are both in favor and against all manner of safety procedures and
disciplinary policies ranging from showing identification, to drug dogs, dress code,
and zero tolerance. However, two distinguishing studies by Kitsantas et al., (2004)
and Edmondson et al., (2007) found that designing school safety policies without the
input of students are the feeblest approach to improving students’ perceptions of
safety. Students want to participate in creating a safe and secure environment.
This researcher believes the findings of the present study both validate and
invalidate the literature. Students’ perceptions of safety change depending on the
procedure, policy and demographic cohort being studied. However, what is
conclusive with regard to safety procedures and disciplinary policies is that grade
level and gender play the greatest role in determining what students perceived would
increase their feelings of security and well-being. Based on this information, this
researcher suggests that schools create a student-based safety council that provides
students with the opportunity to interact with school administration to develop
security and disciplinary policies.
Recommendations for Practitioners
This researcher suggests that practitioners implement a number of
recommendations in order to reduce the fears that students have on secondary school
campuses and to increase their feelings of safety and security:
217
1. Emphasize specific professional development in the area of classroom
management and instruct teachers concerning proven strategies for building
relationships of trust with students.
2. Advertise school safety policies to ensure that these norms are put into daily
practice and become part of the school culture by using traditional methods as
well as the Internet and social media to advertise and promote them.
3. Initiate a study about why the youngest high school students express greater
anxiety toward drug and alcohol use and sales on campus and implement proven
strategies that assist students in overcoming their fears.
4. Provide students with multiple methods by which to report bullying and
violence and implement proven programs to enhance students’ self-esteem and
confidence.
5. Examine the impact that prejudice and racism has on students’ sense of well-
being and utilize specific methods of data gathering to accurately determine the
issues specific to their schools that need to be addressed.
6. Establish programs that focus on suicide prevention and policies that delineate
what to do in case of a student suicide.
7. Evaluate and identify gang activity on campus and create policies for dealing
with the issue before it negatively affects the school’s culture.
8. Work with students, staff, and parents to develop methods for protecting
personal property and to deal with vandalism on campus.
218
9. Develop an accountability system to ensure that students’ concerns are
addressed in a timely manner in order to establish and nurture student trust and
confidence in their teachers, administrators, and staff.
10. Create a student-based safety council that provides students with consistent
interaction with school administration to develop security and disciplinary
policies. This student safety council should consist of- and be equally
represented by- male and female students, upperclassmen and lowerclassmen,
and other demographics the school considers significant.
Recommendations for Future Studies
The effects of safety-and-security measures on students and their perceptions
of well-being need to be further researched. This researcher recommends the
following areas of further study:
1. Replicate this study to compare student academic performance and attendance
with their general feelings of safety and well-being.
2. Conduct a comparative analysis of teacher-to-student perceptions of safety and
security at school.
3. Conduct a study that measures students’ feelings of participation in the creation
and implementation of safety, security, and disciplinary measures at school and
how important participation is in the process to the students themselves.
4. Conduct a study to determine what percentage of student bullying is being
reported and why students are choosing to convey or not convey this information
to school officials.

REFERENCES
220
REFERENCES
Adelman, H. S., & Taylor, L. (2007, October). Safe schools in the context of school
improvement. In D. L. White, B. C. Glenn, and A. Wimes (Eds.), Proceedings
of persistently safe schools: The 2007 national conference on safe schools
(pp. 1–10). Washington, DC: Hamilton Fish Institute, George Washington
University.
Akiba, M. (2008). Predictors of student fear of school violence: A comparative study
of eighth graders in 33 countries. School Effectiveness and School
Improvement, 19(1), 51–72. Retrieved from http://web.ebscohost.com
Akiba, M., LeTendre, G., Baker, D., & Goesling, B. (2002). Student victimization:
National and school system effects on school violence in 37 nations.
American Educational Research Journal, 39(4), 829–853.
Allen, K. (2010). Classroom management, bullying, and teacher practices.
Professional Educator, 34(1), 1–15. Retrieved from http://webebscohost.com
Ashford, R., Queen, J. A., Algozzine, B., & Mitchell, G. (2008, August). Perceptions
and record of violence in middle and high school. Behavioral Disorders,
33(4), 222–232.
Astor, R. A., Meyer, H. A., Benenishty, R., Marachi, R., & Rosemond, M. (2005).
School safety interventions: Best practices and programs. Children and Safety,
27(1), 17–32.
221
Astor, R. A., Meyer, H. A., & Beyer, W. J. (1999). Unowned places and times:
Maps and interviews about violence in high schools. American Educational
Research Journal, 36(1), 3–42.
Bayh, B. (1975). Our nation’s schools—A report card: “A” in school violence and
vandalism. Washington: U.S. Government Printing Office.
Berkowitz, R., & Benbenishty, R. (2012). Perceptions of teachers’ support, safety,
and absence from school because of fear among victims, bullies, and bully-
victims. American Journal of Orthopsychiatry, 82(1), 67–74.
Biegel, S. (1987, Summer). The “safe schools” provision: Can a nebulous
constitutional right be a vehicle for change? Hastings Constitutional Law
Quarterly, 14, 789–838.
Booth, B., Van Hasselt, V., & Vecchi, G. (2011). Addressing school violence. FBI
Law Enforcement Bulletin, 50(5), 1–9.
Bosworth, K., Ford, L., & Hernandez, D. (2011). School climate factors contributing
to student and faculty perceptions of safety on select Arizona schools. Journal
of School Health, 81(4), 194–201.
Bowan, N., & Bowan, G. (1999). Effects of crime and violence in neighborhoods and
schools on the school behavior and performance of adolescents. Journal of
Adolescent Research, 14, 319–342.
Bracy, N. L. (2011). Student perceptions of high-security school environments.
Youth & Society, 43(1), 365–395. doi:10.1177/0044118X10365082
222
Bullock, L. M., & Fitzsimons, A. M. (1996). Combating youth violence: An “all
hands on deck” approach to making schools safe again. Preventing School
Failure, 41(1), 34–42.
Bushaw, W. J., & Lopez, S. J. (2011). Highlights of the 2011 Phi Delta
Kappa/Gallup poll: What Americans said about the public schools. Kappan
Magazine, 93(1), 25. Retrieved from www.kappanmagazine.org
Bushaw, W. J, & Lopez, S. J. (2012). Public education in the United States: A nation
divided. The 44th annual pdk/gallup poll of the public’s attitudes toward
public education. Kappan Magazine, 94(1), 8–25. Retrieved from
www.kappanmagazine.org
Bushaw, W. J., & Lopez, S. J. (2013). Which way do we go? The 45th annual
pdk/gallup poll of the public’s attitudes toward public school. Kappan
Magazine, 95(1), 9–25. Retrieved from www.kappanmagazine.org
California Constitution, Article I, § 28, subdivision C “Right to Safe Schools”
Provision. 1982.
California Department of Education. (2002). Aiming high: High schools for the 21st
century. Sacramento, CA: CDE Press.
California Healthy Kids Survey. (2013). Main report. San Francisco, CA: WestEd
Health and Human Development Program for the California Department of
Education.
Cambron-McCabe, N. H., McCarthy, M. M., & Thomas, S. B. (2009). Legal rights of
teachers and students (2nd ed.). Boston, MA: Pearson Education.
223
Cheng, J. C. (2003). Gangs in public schools: A survey of state legislation.
Brigham Young University and Law Journal, 1, 285–298.
Christie, K. (2004). Respecting diversity among states. Phi Delta Kappan, 86(1),
5–6.
Christle, C., Nelson, C. M., & Jolivette, K. (2004). School characteristics related to
the use of suspension. Education and the Treatment of Children, 27(4),
509–526.
Cornell, D. G., & Mayer, M. J. (2010, January/February). Why do school order and
safety matter? Educational Researcher, 39(1), 7–15.
doi:10.3102/0013189X09357616
Cowie, H., & Oztug, O. (2008). Pupils’ perceptions of safety at school. Pastoral Care
in Education, 26(2), 59–67.
Crews, G. A., & Counts, M. R. (1997). The evolution of school disturbance in
America. Westport, CT: Praeger.
Davis, N. Z. (1971, February). The reasons of misrule: Youth groups and charivaris
in sixteenth century France. Past and Present, 50, 41–75.
DeMitchell, T. A. (2012, February 29). Concepts, theories and principals: In loco
parentis. Retrieved from http://educational-law.org/345-in-loco-parentis.html
Denmark, F., Krauss, H., Wesner, R., Midlarsky, E., & Gielen, U. (2005). Violence in
schools: Cross-national and cross-cultural perspectives. New York, NY:
Springer Science + Business Media.
224
DeVoe, J. F., Peter, K., Noonan, M., Snyder, T. D., & Baum, K. (2005).
Indicators of school crime and safety: 2005. (NCES 2006-001/NCJ 210697).
Washington, DC: U.S. Departments of Education and Justice.
Dufresne, J., & Dorn, M. (2005). Keeping students and schools safe. Reclaiming
Children and Youth, 14(2), 93–96. Retrieved from http://web.ebscohost.com
Ed-data. (2014). School reports: Patterson high school. Retrieved from
http://www.ed-data.k12.ca.us/Pages/Home.aspx
Edmondson, L., Fetro, J. V., Drolet, J. C., & Ritzel, D. O. (2007). Perceptions of
physical and psychosocial aspects of a safe school. American Journal of
Health Studies, 22(1), 1–9.
Edwards, C. (2013, September). US government spending 1970–2013. Washington,
DC: Cato Institute. Retrieved from http://www.cato.org/blog/us-government-
spending-1970-2013?gclid=CO3SocaKwb0CFecWMgodVWcAmQ
Ethnicity. (n.d.). Collins English dictionary—Complete & unabridged 10th edition.
Retrieved March 18, 2014, from Dictionary.com Web site:
http://dictionary.reference.com/browse/ethnicity
Fisher, C. (2007, May/June). School violence: Shooting ducks in a pond. Crime &
Justice International, 23(98), 46–47.
Flannery, D. J., Modzeleski, W., & Kretschmar, J. M. (2013). Violence and school
shootings. Current Psychiatry Reports, 15(331), 1–7. doi:10.1007/s11920-
012-0331-6
225
Flask, M. L. (2007, October 24). Site of Cleveland school shooting reopens with
beefed-up security. Education Week, 27(9), 4–5.
Foner, E., & Garraty, J. A. (Eds.). (1991). The reader’s companion to American
history. Boston, MA: Houghton Mifflin.
Freiberg, H. J. (1998). Measuring school climate: Let me count the ways. Educational
Leadership, 56(1), 22–26.
Gastic, B. (2011). Metal detectors and feeling safe at school. Education and Urban
Society, 43(4), 486–498 doi:10.1177/0013124510380717
Glaeser, B., & Calcagnie, K. (2005, November). The ABC’s of school liability in
California: A primer for lawyers, school districts and educators. Consumer
Attorneys of California Forum Magazine, 34–39.
Goldstein, S. E., Young, A., & Boyd, C. (2008). Relational aggression at school:
Associations with school safety and social climate. Journal of Youth
Adolescence, 37, 641.
Greene, B., Barrios, L., Blair, J., & Kolbe, L. (2004). Schools and terrorism: A
supplement to the report of the national advisory committee on children and
terrorism. Journal of School Health, 74(2), 39–51. Retrieved from
http://web.ebscohost.com
Greenhough, S. (2008). School shootings and school violence. Retrieved from
www.faqs.org
226
Gregory, A., & Cornell, D. (2009). “Tolerating” adolescent needs: Moving
beyond zero tolerance policies in high school. Theory Into Practice, 48, 106–
113. doi:10.1080/00405840902776327
Hammond, C. L. (2002, January 1). The impact of school climate on students’
perceptions about safety. Electronic Doctoral Dissertations for Univ. of
Massachusetts, Amherst. Paper AAI3068563.
http://scholarworks.umass.edu/dissertations/AAI3068563
Hankin, A., Mertz, M., & Simon, T. (2011). Impacts of metal detector use in
schools: Insights from 15 years of research. Journal of School Health, 81(2),
100–106.
Hantman, I., Bairu, G., Barwick, A., Smith, B., Mack, B., Meston, S., Rocks, L., &
James, B. (2008). Safety in numbers: Collecting and using incident data to
make a difference in schools. U.S. Department of Education: National Center
for Education Statistics. Washington, DC: U.S. Government Printing Office.
Henry, S. (2000). What is school violence: An integrated definition. Annals of the
American Academy of Political and Social Science, 567, 16–29.
Hong, J., & Eamon, M. (2011). Students’ perceptions of unsafe schools: An
ecological systems analysis. Journal of Child and Family Studies. Advance
online publication. doi:10.1007/s10826-01109494-8
Hong, J. S., Cho, H., Allen-Meares, P., & Espelage, D. (2011). The social ecology of
the columbine high school shootings. Children and Youth Services Review,
33(6), 861–868. doi:10.1016/j.childyouth.2010.12.005
227
Johnson, S. (2009). Improving the school environment to reduce school violence:
A review of the literature. Journal of School Health, 79(10), 451–465.
Retrieved from http://web.ebscohost.com
Johnston, A. (2012, December 18). Gun violence in American schools is nothing
new. Retrieved from: http://www.thenation.com/blog/171838/gun-violence-
american-schools-nothing-new#
Jones, J. M. (2013, August 29). Parents’ school safety fears haven’t receded since
Newtown: One in three k–12 parents fear for child’s safety at school.
Retrieved from: www.gallup.com
Jorgensen, M.A., & Hoffman, J. (2003, December). History of No Child Left Behind
Act of 2001 (NCLB). San Antonio, TX: Pearson Education.
Juvonen, J. (2001). School violence: Prevalence, fears, and prevention. Rand
Corporation. Retrieved from www.rand.org
Kennedy, M. (2010, June). Safe and secure: Managing growing security concerns
under current budget strains. American School & University. Retrieved from
http://asumag.com/security/securitymag
Kennedy, M. (2011, June). School security after 9/11. American School and
University, 83(10), 18–23.
Kesson, K., & Ross, W. E. (Eds.). (2004). Defending public schools: Vol. II.
Teaching for a democratic society. Westport, CT: Praeger Perspectives.
228
Kitsantas, A., Ware, H. W., & Martinez-Arias, R. (2004). Students’ perceptions of
school safety: Effects by community, school environment, and substance use
variables. The Journal of Early Adolescence, 24(4), 412–430.
Knox, G. W., Laske, D. L., & Tromanhauser, E. D. (1992). Schools under siege.
Dubuque, IA: Kendall/Hunt Publishing.
Kohn, A. (2004). Rebuilding school culture to make schools safer. Education Digest:
Essential Readings Condensed for Quick Review, 70, 23–30.
Kress, T. (2011, Spring). Going high tech under high surveillance: Technology
integration, zero tolerance, and implications for access and equity. Radical
Teacher, 90, 15–24.
Lindle, J. C. (2008). School safety: Real or imagined fear? Educational Policy,
22(1), 28–44.
Lyons, L. (2009, March 29). Children and violence. Gallup Poll: Education and
Youth. Retrieved from www.gallup.com
Manning, M., & Bucher, K. (2005, September/October). Classroom management for
middle and secondary schools. Clearing House, 79(1), 5–6. Retrieved from
http://web.ebscohost.com
Marshall, M. L. (2004). Examining school climate: Defining factors and educational
influences. Journal of Experimental Education, 63(3), 217–227. Retrieved
from http://education.gsu.edu/schoolsafety/
May, D. C., & Dunaway, R. G. (2000). Predictors of fear of criminal victimization at
school among adolescents. Sociological Spectrum, 20(2), 149–168.
229
Mayes, T. (2008). Students with no-contact orders against abusive classmates:
Recommendations for educators. Preventing School Failure, 52(4), 37–44.
Retrieved from http://web.ebscohost.com
Mencken, H. L. (1920). Prejudices: Second series. New York, NY: Alfred A. Knopf.
Mirsky, L. (2007). SaferSanerSchools: Transforming school cultures with restorative
practices. Reclaiming Youth and Children, 16(2), 5–12.
Mooij, T. (2005). National campaign effects on secondary pupils’ bullying and
violence. British Journal of Educational Psychology, 75, 489–511. Retrieved
from http://web.ebscohost.com
Mooij, T., Smeets, E., & de Wit, W. (2011, September). Multi-level aspects of social
cohesion of secondary schools and pupils’ feelings of safety. British Journal
of Educational Psychology, 81(3), 369–390.
Myrstol, B. A. (2011). Public perceptions of school resource officer (SRO)
programs. Western Criminology Review, 12(3):20–40. Retrieved from
http://wcr.sonoma.edu/v12n3/Myrstol.pdf
National Association of Secondary School Principals. (2004). Breaking ranks II:
Strategies for leading school reform. Reston, VA: Author.
National Clearinghouse for Educational Facilities (NCEF). (2008, April). Low-cost
security measures for school facilities. Retrieved from www.ncef.org/
pubs/low-cost-security-measures.htm
Neiman, S., & DeVoe, J. F. (2009). Crime, violence, discipline, and safety in U.S.
public schools: Findings from the school survey on crime and safety: 2007–
230
2008. National Center for Educational Statistics, Institute of Educational
Sciences, U.S. Department of Education. Washington, DC: U.S. Government
Printing Office.
Ohlheiser, A. (2014). January’s epidemic: 11 school shootings in 19 days. The Wire.
Retrieved from: http://www.thewire.com/national/2014/01/januarys-school-
shootings/357448/
Paine, S., & McCann, R. (2009, September). Engaging stakeholders: Including
parents and the community to sustain improved reading outcomes. Sustaining
Reading First, 6, 1–16.
Paris, K. (1994). A leadership model for planning and implementing change for
school-to-work transition. Madison, WI: University of Wisconsin-Madison,
Center on Education & Work.
Peterson, M. (1997, March 10). Fatal high school stabbing prompts security
measures. Retrieved from www.nytimes.com/1997/03/10/myregion/fatal-
high-school-stabbing-promotes-security-measures.htm
Phillips, R., Pack, C., & Linney, J. (2008). Safe school ambassadors: Harnessing
student power to stop bullying and violence. San Francisco, CA: Jossey-
Bass/Wiley.
Pollack, W. S., Modzeleski, W., & Rooney, G. (2008). Prior knowledge of potential
school-based violence: Information students learn may prevent a targeted
attack. United States Secret Service and United States Department of
Education. Washington, DC: U.S. Government Printing Office.
231
Pride Surveys. (2006). Bullying, violence, and perceptions of safety: Alabama
students in grades 6–12, 2003–2005. Alabama Department of Education.
Retrieved from www.pridesurveys.com/customercenter/AL_violence_study_06
Ramey, K. (2004). Partners for safety. American School Board Journal, 191(4),
70–72.
Rea, D. W., & Stallworth-Clark, R. (Eds.). (2003). Fostering our youth’s well-being:
Healing the social disease of violence. New York, NY: McGraw Hill Custom
Publishing.
Reddy, M., Borum, R., Berglund, J., Vossekuil, B., Fein, R., & Modzeleski, W.
(2001). Evaluating risk for targeted violence in schools: Comparing risk
assessment, threat assessment, and other approaches. Psychology in the
Schools, 38(2), 157–172.
Reynolds, C. R., Skiba, R. J., Graham, S., Sheras, P., Conoley, J. C., & Garcia-
Vazquez, E. (2008). Are zero tolerance policies effective in schools?
American Psychologist, 63(9), 852–862.
Robers, S., Kemp, J., Rathbun, A., and Morgan, R.E. (2014). Indicators of School
Crime and Safety: 2013 (NCES 2014-042/NCJ 243299). National Center for
Education Statistics, U.S. Department of Education, and Bureau of Justice
Statistics, Office of Justice Programs, U.S. Department of Justice.
Washington, DC.
Rorty, A. O. (Ed.). (1998). Philosophers on education: New historical perspectives.
London, England: Routledge Press.
232
Safra, S. J. (2000). The amended gun-free school zones act: Doubt as to its
constitutionality remains. Duke Law Journal, 50(637), 637–662.
Sawyer, K. (1983). The right to safe schools: A newly recognized inalienable right.
Pacific Law Journal, 14, 1309.
Schneider, T. (2007, September). Ensuring quality school facilities and security
technologies. Washington, DC: The Hamilton Fish Institute on School and
Community Violence & Northwest Regional Educational Laboratory.
Secondary school. (n.d.). Collins English Dictionary - Complete & Unabridged 10th
Edition. Retrieved March 18, 2014, from Dictionary.com website:
http://dictionary.reference.com/browse/secondary school
Shah, N. (2013, January 10). Discipline policies squeezed as views shift on what
works. Retrieved from www.educationweek.org
Shelton, A. J., Owens, E. W., & Song, H. (2009). An examination of public school
safety measures across geographic settings. Journal of School Health, 79(1),
24–29.
Sherman, L. W., Hoff Sommers, C., & Manno, B. (2000). The safe and drug free
schools program. Brookings Papers on Educational Policy, 2000(1),
125–171.
Shumow, L., & Lomax, R. G. (2001). Predicting perceptions of school safety. School
Community Journal, 11(2), 93–112.
233
Socioeconomic status. (n.d.). The American Heritage® New Dictionary of
Cultural Literacy (3rd ed.). Retrieved March 18, 2014, from Dictionary.com
website: http://dictionary.reference.com/browse/socioeconomic status
Sparks, S. D. (2011a). Researchers highlight schools’ differences in security
practices: Minority pupils more likely to face metal detectors. Education
Week, 31(2), 8.
Sparks, S. D. (2011b). Study finds safe schools are high-achieving, closely knit.
Education Week, 30(31), 13.
Stanwood, H. M., & Doolittle, G. (2004). Schools as sanctuaries. Reclaiming
Children and Youth, 13(3), 169–172.
Stephens, R. D. (1994, January). Gangs, guns, and school violence. USA Today
Magazine, 122(2584), 29–34.
Stevens, E., Wood, G., & Sheehan, J. (2002). Justice, ideology, & education: An
introduction to the social foundations of education. New York, NY: McGraw-
Hill.
Studak, C. M., & Workman, J. E. (2007, September). Civil behavior, safe school
planning, and dress codes. Journal of Family & Consumer Sciences, 99(3),
23–28.
Thomas, S. P., & Smith, H. (2004). School connectedness, anger behaviors, and
relationships of violent and non-violent American youth. Perspective in
Psychiatric Care, 40(4), 135–148.
234
Toppo, G. (2006, October 10). High tech security is on the rise. USA Today.
Retrieved from http://www.usatoday.com/news/education/2006-10-09-school-
security_x.htm
Trump, K. S. (1999). Scared or prepared? Reducing risks with school security
assessments. The High School Magazine, 6(7), 18–23.
U.S. Department of Education. (2004). Unsafe school choice option: Non-regulatory
guidance. Washington, DC: Author. Retrieved from http://www.ed.gov/
policy/elsec/guid/unsafeschoolchoice.pdf
Varnham, S. (2005). Citizenship in schools: The gap between theory and practice.
Education and the Law, 17(1–2), 53–64.
Volokh, A., & Snell, L. (1998, January). School violence prevention: Strategies to
keep schools safe (unabridged). Policy study no. 234. Los Angeles, CA.
http://reason.org/files/60b57eac352e529771bfa27d7d736d3f.pdf
Warner, B. S., Weist, M. D., & Krulak, A. (1999). Risk factors for school violence.
Urban Education, 34(1), 52–68.
Warr, M. (2000). Fear of crime in the United States: Avenues for research and policy.
In D. Duffee (Ed.), Measurement and analysis of crime and justice: Criminal
justice 2000 (pp. 451–489). Washington, DC: U.S. Department of Justice.
Winter, M. (2001). Safe schools. Human Ecology, 29(1), 21–23.
Wolf, O. (2009). Stress and memory in humans: Twelve years of progress? Brain
Research, 1293, 142–154. doi:10.1016/jbrainres.2009.04.013
235
Wood, S. F., & Huffman, J. B. (1999). Preventing gang activity and violence in
schools. Contemporary Education, 71(1), 19–27.
Wyatt-Brown, B. (1986). Honor and violence in the old south. New York, NY:
Oxford Univ. Press.

APPENDICES
237
APPENDIX A
INFORMED CONSENT LETTER TO SCHOOL DISTRICT
Dear Superintendent __________________,
My name is James Lake, a doctoral candidate at CSU Stanislaus, and I am in the
process of conducting a research study that explores the perceptions of student fears
on secondary school campuses, how they perceive their safety given the social issues
to which they are exposed, and the measures they believe school districts should
implement to improve student safety and security on high school campuses. This
project is being conducted under the supervision of Dr. Chet Jensen, Professor at
CSU Stanislaus.
I respectfully request your approval to distribute a survey to the parents and students
of _______________ High School in September of 2014. I also request your
permission to contact the school principal to discuss the research protocol and to
solicit his or her cooperation. I have attached a copy of the survey and the informed-
consent document for your review. If you have any concerns or recommendations for
revision, please contact me at the email address below.
The findings of the study will be used for scholarly purposes only. School officials
who choose to participate in the survey may benefit from the research findings. This
study will use a variety of questions and checklists to discover what students fear on a
daily basis. The results may assist school district officials in determining the policies
and procedures that have the greatest influence on students’ perceptions of safety,
security, and well-being.
Any information obtained in connection with this study is confidential and will be
protected from any and all inappropriate disclosure under the law. All data will be
maintained for one year and will be destroyed by September 2015.
Upon the completion of the survey, the data will be compiled, analyzed, and finalized
in defense of my doctoral dissertation. If you wish a copy of the research report for
your school, I would be happy to provide one. If you require further information,
please do not hesitate to contact me, James Lake, at [—], or my faculty supervisor,
Dr. Chet Jensen, at [—]. If you have any questions regarding your rights and
participation as a research subject, please contact the UIRB Administrator by phone
(209)667-3784 or email [email protected].
Thank you for your time and consideration in this matter.
Yours sincerely,
James Lake, CSU Stanislaus
238
APPENDIX B
UNIVERSITY IRB APPROVAL TO CONDUCT STUDY
239
APPENDIX C
INFORMED-CONSENT LETTER TO PARENT/GUARDIAN
(ENGLISH VERSION)
Dear Parent/Guardian and Participant,
This letter is to inform you about a research study your student is being asked to participate in.
This research is being conducted in partial fulfillment of a doctoral degree in Educational
Leadership, through California State University, Stanislaus, in Turlock, California.
This study explores the perceptions of student fears on secondary school campuses; how students
perceive their safety, given the social issues to which they are exposed; and the measures students
believe school districts should implement to improve student safety and security on high school
campuses. A copy of the survey has been attached to this letter for you to read through before
providing parent approval.
Students will take the survey at home which will take approximately 15 to 20 minutes. No
student will be identified, but parent permission must be granted, unless the student is 18 years of
age. This survey is anonymous and voluntary, and students who complete the survey in its
entirety will have their responses combined into a single database and disaggregated through an
electronic data analysis program called Statistical Package for Social Sciences (SPSS).
The findings of the study will be used for scholarly purposes only. The results may assist school
district officials in determining the policies and procedures that have the greatest influence on
students’ perceptions of safety, security, and well-being.
Any information obtained in connection with this study is confidential and will be protected from
any and all inappropriate disclosure under the law and will be held in a secure location. If you
have any questions about the research study, please contact the graduate researcher, James Lake,
at [—], or the faculty supervisor, Dr. Chet Jensen at [—]. If you have any questions regarding
your rights and participation as a research subject, please contact the UIRB Administrator by
phone (209) 667-3784 or email [email protected].
Parents, by signing your name and your students name at the bottom of the page, you provide
permission for your student to participate in this survey. Thank you for your time and
participation.
___________________________________
Student’s Name
___________________________________ _____________________________
Parent’s Signature Date
___________________________________ _____________________________
Student’s Signature (If 18 years of age) Date
240
APPENDIX D
INFORMED-CONSENT LETTER TO PARENT/GUARDIAN
(SPANISH VERSION)
Estimados padres/tutores,
Esta carta es para informarle de un estudio de investigación en que su estudiante se le solicita
participar. Esta investigación se está realizando en cumplimiento parcial de un doctorado en
liderazgo educativo, a través de la Universidad Estatal de California, Stanislaus, en Turlock,
California.
Este estudio explora las percepciones de los temores de estudiante en los campus de la
escuela secundaria; como los estudiantes perciben a su seguridad, dado los problemas
sociales a que están expuestos; y las medidas de los estudiantes que los distritos de escuelas
deben implementar para mejorar la seguridad de los estudiantes y la seguridad en los campus
de la escuela secundaria. Una copia de la encuesta se ha adjuntada a esta carta para que usted
puede leer antes de proporcionar la aprobación de los padres.
Los estudiantes tomarán la encuesta en casa que tomará aproximadamente 15 a 20 minutos.
Ningún estudiante será identificado, pero debe ser concedido el permiso de los padres. Esta
encuesta es anónima y voluntaria, y los estudiantes que completen la encuesta en su totalidad
tendrán sus respuestas combinados en una única base de datos y desglosados a través de un
programa de análisis de datos electrónicos llamado paquete estadístico para las ciencias
sociales (SPSS).
Los resultados del estudio se utilizarán únicamente con fines académicos. Los resultados
pueden ayudar a los funcionarios del distrito de escuela en la determinación de las políticas y
procedimientos que tienen la mayor influencia en las percepciones de los estudiantes de la
seguridad, la seguridad y bienestar.
Cualquiera información obtenida en relación con este estudio es confidencial y estará
protegida de toda divulgación inadecuada antes de la ley. Si usted tiene alguna pregunta sobre
el estudio de investigación, póngase en contacto con el investigador del posgrado, James
Lake, en [—], o el supervisor de la Facultad, el Dr. Chet Jensen en [—].
Los padres, mediante la firma de su nombre y sus estudiantes en la parte inferior de la página,
ustedes dan permiso para que su estudiante puede participar en esta encuesta. Gracias por su
tiempo y su participación.
___________________________________ _______________________
El nombre de estudiante Fecha
__________________________________
Firma del padre otorgamiento de aprobación
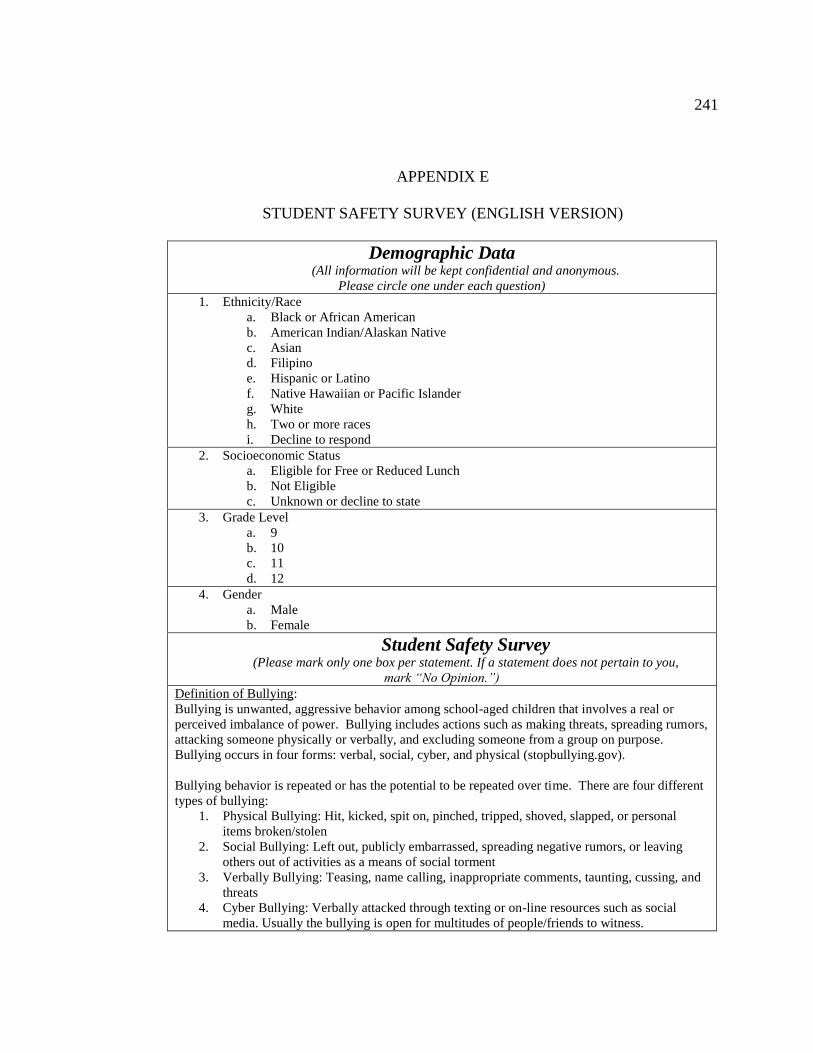
241
APPENDIX E
STUDENT SAFETY SURVEY (ENGLISH VERSION)
Demographic Data (All information will be kept confidential and anonymous.
Please circle one under each question)
1. Ethnicity/Race
a. Black or African American
b. American Indian/Alaskan Native
c. Asian
d. Filipino
e. Hispanic or Latino
f. Native Hawaiian or Pacific Islander
g. White
h. Two or more races
i. Decline to respond
2. Socioeconomic Status
a. Eligible for Free or Reduced Lunch
b. Not Eligible
c. Unknown or decline to state
3. Grade Level
a. 9
b. 10
c. 11
d. 12
4. Gender
a. Male
b. Female
Student Safety Survey (Please mark only one box per statement. If a statement does not pertain to you,
mark “No Opinion.”)
Definition of Bullying:
Bullying is unwanted, aggressive behavior among school-aged children that involves a real or
perceived imbalance of power. Bullying includes actions such as making threats, spreading rumors,
attacking someone physically or verbally, and excluding someone from a group on purpose.
Bullying occurs in four forms: verbal, social, cyber, and physical (stopbullying.gov).
Bullying behavior is repeated or has the potential to be repeated over time. There are four different
types of bullying:
1. Physical Bullying: Hit, kicked, spit on, pinched, tripped, shoved, slapped, or personal
items broken/stolen
2. Social Bullying: Left out, publicly embarrassed, spreading negative rumors, or leaving
others out of activities as a means of social torment
3. Verbally Bullying: Teasing, name calling, inappropriate comments, taunting, cussing, and
threats
4. Cyber Bullying: Verbally attacked through texting or on-line resources such as social
media. Usually the bullying is open for multitudes of people/friends to witness.
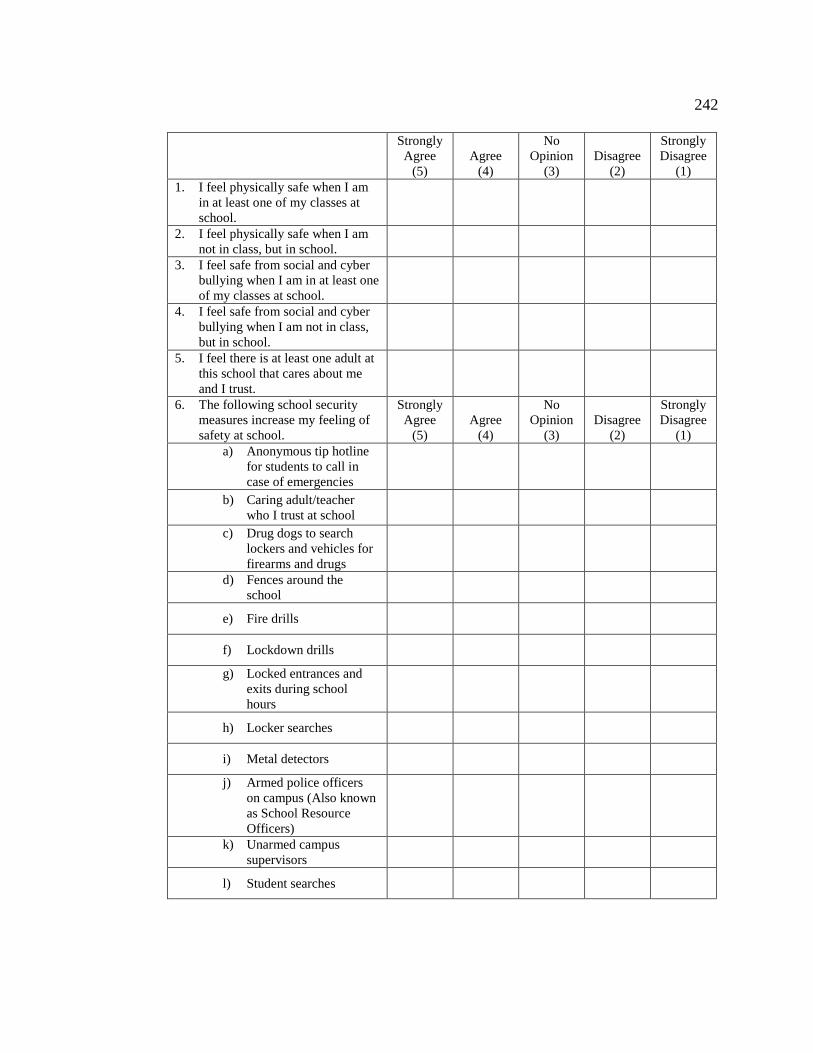
242
Strongly
Agree
(5)
Agree
(4)
No
Opinion
(3)
Disagree
(2)
Strongly
Disagree
(1)
1. I feel physically safe when I am
in at least one of my classes at
school.
2. I feel physically safe when I am
not in class, but in school.
3. I feel safe from social and cyber
bullying when I am in at least one
of my classes at school.
4. I feel safe from social and cyber
bullying when I am not in class,
but in school.
5. I feel there is at least one adult at
this school that cares about me
and I trust.
6. The following school security
measures increase my feeling of
safety at school.
Strongly
Agree
(5)
Agree
(4)
No
Opinion
(3)
Disagree
(2)
Strongly
Disagree
(1)
a) Anonymous tip hotline
for students to call in
case of emergencies
b) Caring adult/teacher
who I trust at school
c) Drug dogs to search
lockers and vehicles for
firearms and drugs
d) Fences around the
school
e) Fire drills
f) Lockdown drills
g) Locked entrances and
exits during school
hours
h) Locker searches
i) Metal detectors
j) Armed police officers
on campus (Also known
as School Resource
Officers)
k) Unarmed campus
supervisors
l) Student searches
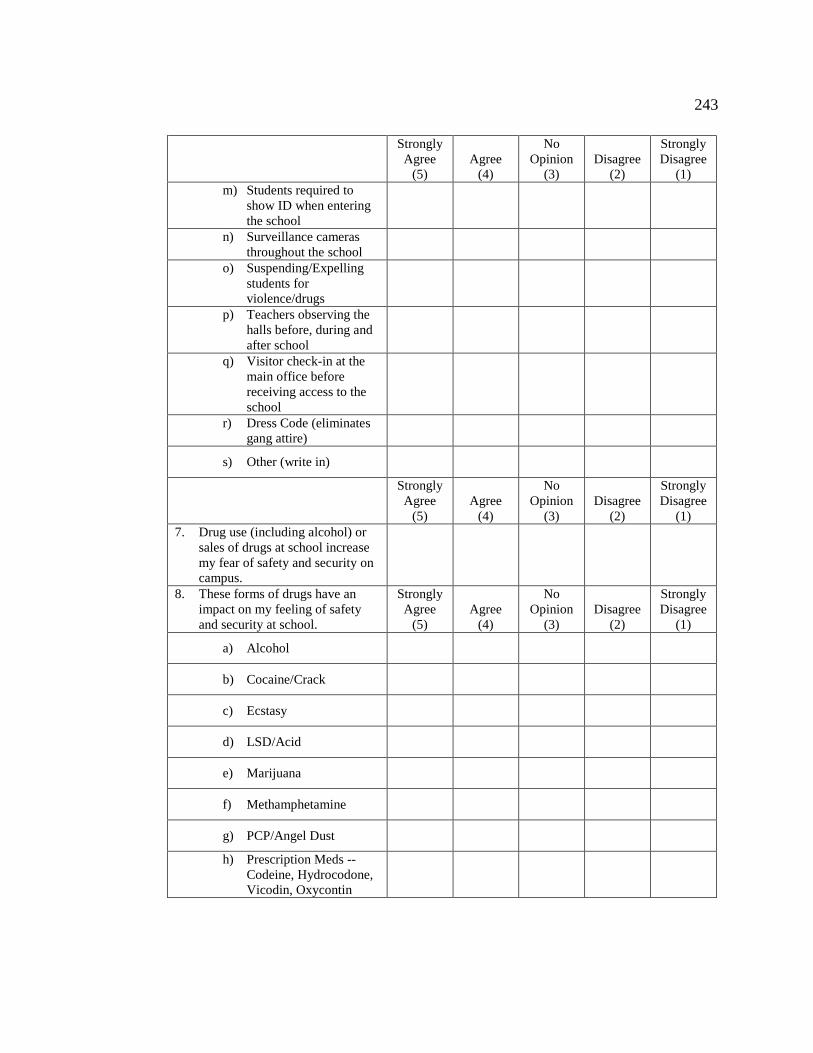
243
Strongly
Agree
(5)
Agree
(4)
No
Opinion
(3)
Disagree
(2)
Strongly
Disagree
(1)
m) Students required to
show ID when entering
the school
n) Surveillance cameras
throughout the school
o) Suspending/Expelling
students for
violence/drugs
p) Teachers observing the
halls before, during and
after school
q) Visitor check-in at the
main office before
receiving access to the
school
r) Dress Code (eliminates
gang attire)
s) Other (write in)
Strongly
Agree
(5)
Agree
(4)
No
Opinion
(3)
Disagree
(2)
Strongly
Disagree
(1)
7. Drug use (including alcohol) or
sales of drugs at school increase
my fear of safety and security on
campus.
8. These forms of drugs have an
impact on my feeling of safety
and security at school.
Strongly
Agree
(5)
Agree
(4)
No
Opinion
(3)
Disagree
(2)
Strongly
Disagree
(1)
a) Alcohol
b) Cocaine/Crack
c) Ecstasy
d) LSD/Acid
e) Marijuana
f) Methamphetamine
g) PCP/Angel Dust
h) Prescription Meds --
Codeine, Hydrocodone,
Vicodin, Oxycontin
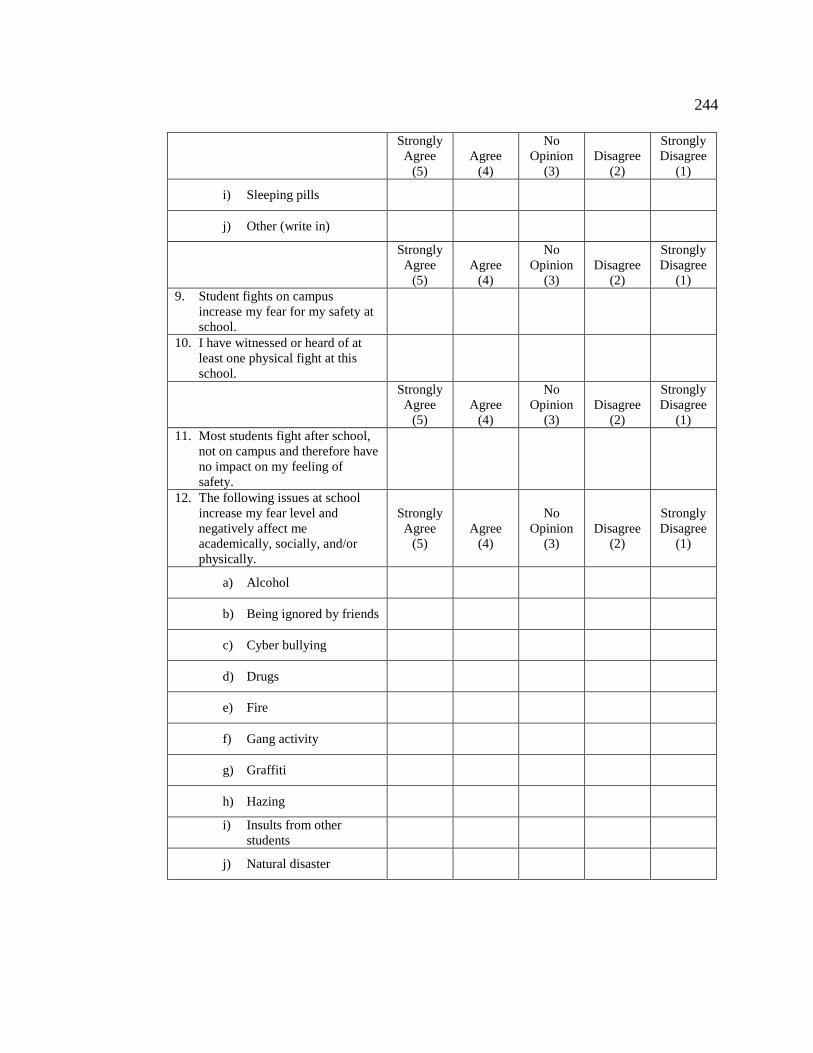
244
Strongly
Agree
(5)
Agree
(4)
No
Opinion
(3)
Disagree
(2)
Strongly
Disagree
(1)
i) Sleeping pills
j) Other (write in)
Strongly
Agree
(5)
Agree
(4)
No
Opinion
(3)
Disagree
(2)
Strongly
Disagree
(1)
9. Student fights on campus
increase my fear for my safety at
school.
10. I have witnessed or heard of at
least one physical fight at this
school.
Strongly
Agree
(5)
Agree
(4)
No
Opinion
(3)
Disagree
(2)
Strongly
Disagree
(1)
11. Most students fight after school,
not on campus and therefore have
no impact on my feeling of
safety.
12. The following issues at school
increase my fear level and
negatively affect me
academically, socially, and/or
physically.
Strongly
Agree
(5)
Agree
(4)
No
Opinion
(3)
Disagree
(2)
Strongly
Disagree
(1)
a) Alcohol
b) Being ignored by friends
c) Cyber bullying
d) Drugs
e) Fire
f) Gang activity
g) Graffiti
h) Hazing
i) Insults from other
students
j) Natural disaster
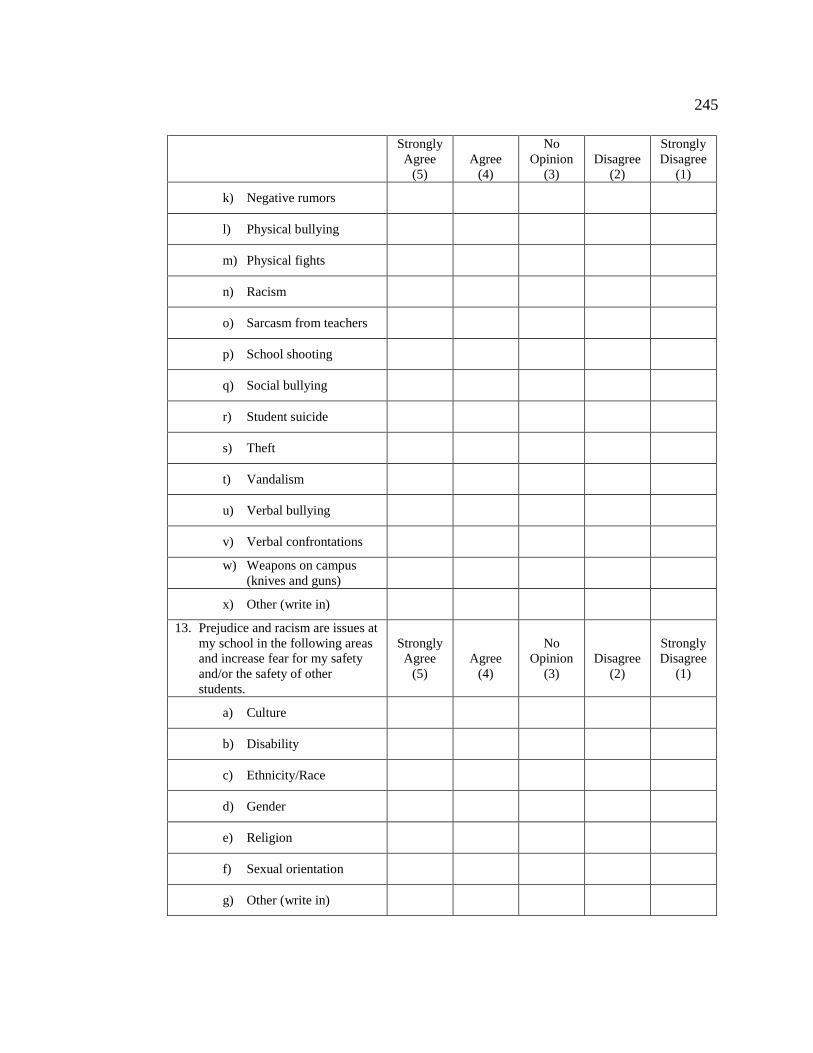
245
Strongly
Agree
(5)
Agree
(4)
No
Opinion
(3)
Disagree
(2)
Strongly
Disagree
(1)
k) Negative rumors
l) Physical bullying
m) Physical fights
n) Racism
o) Sarcasm from teachers
p) School shooting
q) Social bullying
r) Student suicide
s) Theft
t) Vandalism
u) Verbal bullying
v) Verbal confrontations
w) Weapons on campus
(knives and guns)
x) Other (write in)
13. Prejudice and racism are issues at
my school in the following areas
and increase fear for my safety
and/or the safety of other
students.
Strongly
Agree
(5)
Agree
(4)
No
Opinion
(3)
Disagree
(2)
Strongly
Disagree
(1)
a) Culture
b) Disability
c) Ethnicity/Race
d) Gender
e) Religion
f) Sexual orientation
g) Other (write in)
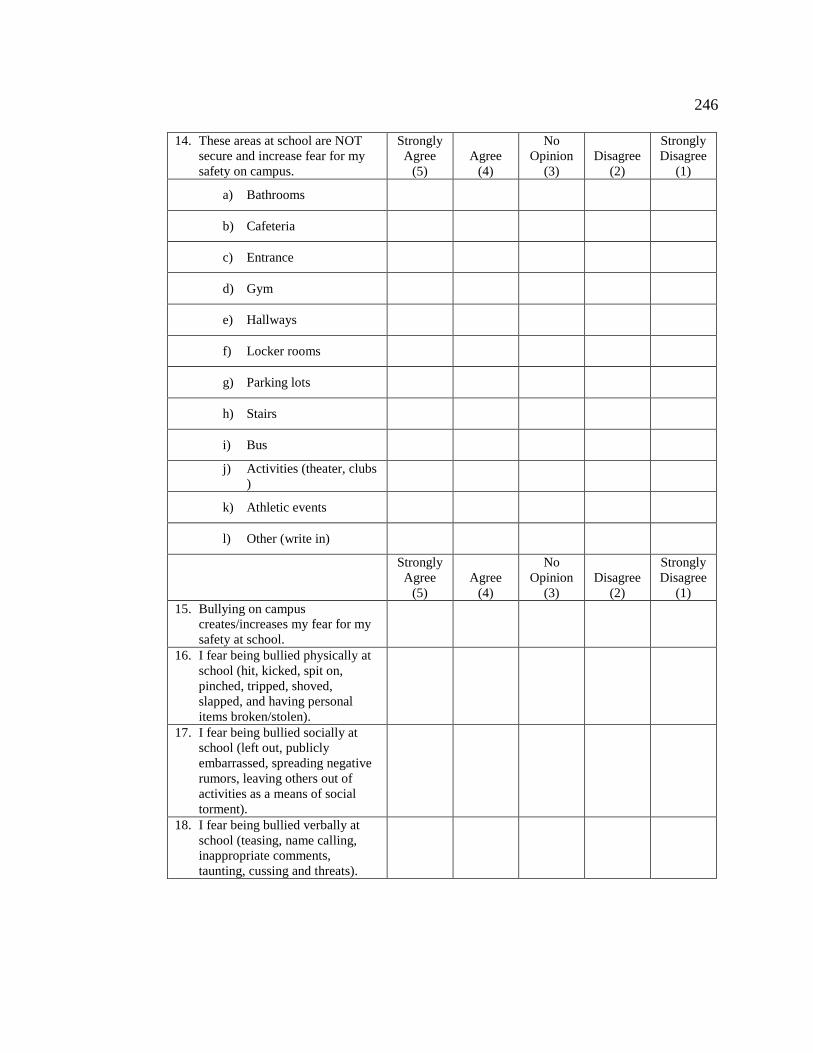
246
14. These areas at school are NOT
secure and increase fear for my
safety on campus.
Strongly
Agree
(5)
Agree
(4)
No
Opinion
(3)
Disagree
(2)
Strongly
Disagree
(1)
a) Bathrooms
b) Cafeteria
c) Entrance
d) Gym
e) Hallways
f) Locker rooms
g) Parking lots
h) Stairs
i) Bus
j) Activities (theater, clubs
)
k) Athletic events
l) Other (write in)
Strongly
Agree
(5)
Agree
(4)
No
Opinion
(3)
Disagree
(2)
Strongly
Disagree
(1)
15. Bullying on campus
creates/increases my fear for my
safety at school.
16. I fear being bullied physically at
school (hit, kicked, spit on,
pinched, tripped, shoved,
slapped, and having personal
items broken/stolen).
17. I fear being bullied socially at
school (left out, publicly
embarrassed, spreading negative
rumors, leaving others out of
activities as a means of social
torment).
18. I fear being bullied verbally at
school (teasing, name calling,
inappropriate comments,
taunting, cussing and threats).
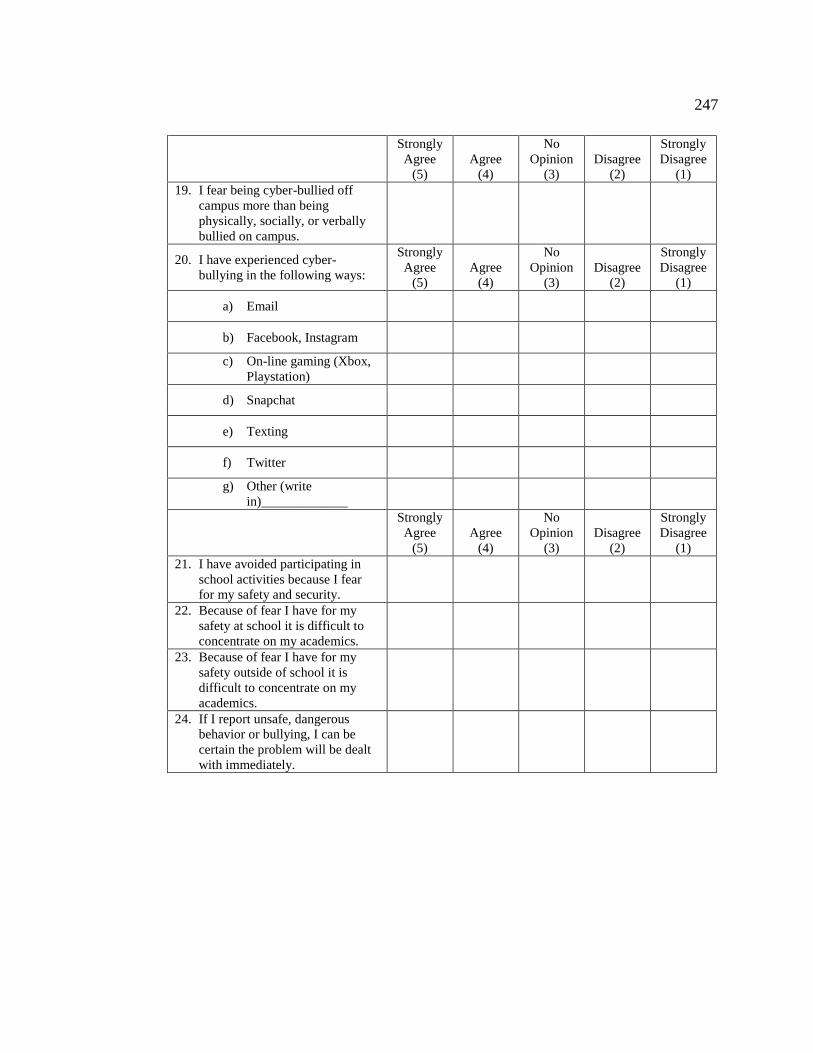
247
Strongly
Agree
(5)
Agree
(4)
No
Opinion
(3)
Disagree
(2)
Strongly
Disagree
(1)
19. I fear being cyber-bullied off
campus more than being
physically, socially, or verbally
bullied on campus.
20. I have experienced cyber-
bullying in the following ways:
Strongly
Agree
(5)
Agree
(4)
No
Opinion
(3)
Disagree
(2)
Strongly
Disagree
(1)
a) Email
b) Facebook, Instagram
c) On-line gaming (Xbox,
Playstation)
d) Snapchat
e) Texting
f) Twitter
g) Other (write
in)_____________
Strongly
Agree
(5)
Agree
(4)
No
Opinion
(3)
Disagree
(2)
Strongly
Disagree
(1)
21. I have avoided participating in
school activities because I fear
for my safety and security.
22. Because of fear I have for my
safety at school it is difficult to
concentrate on my academics.
23. Because of fear I have for my
safety outside of school it is
difficult to concentrate on my
academics.
24. If I report unsafe, dangerous
behavior or bullying, I can be
certain the problem will be dealt
with immediately.
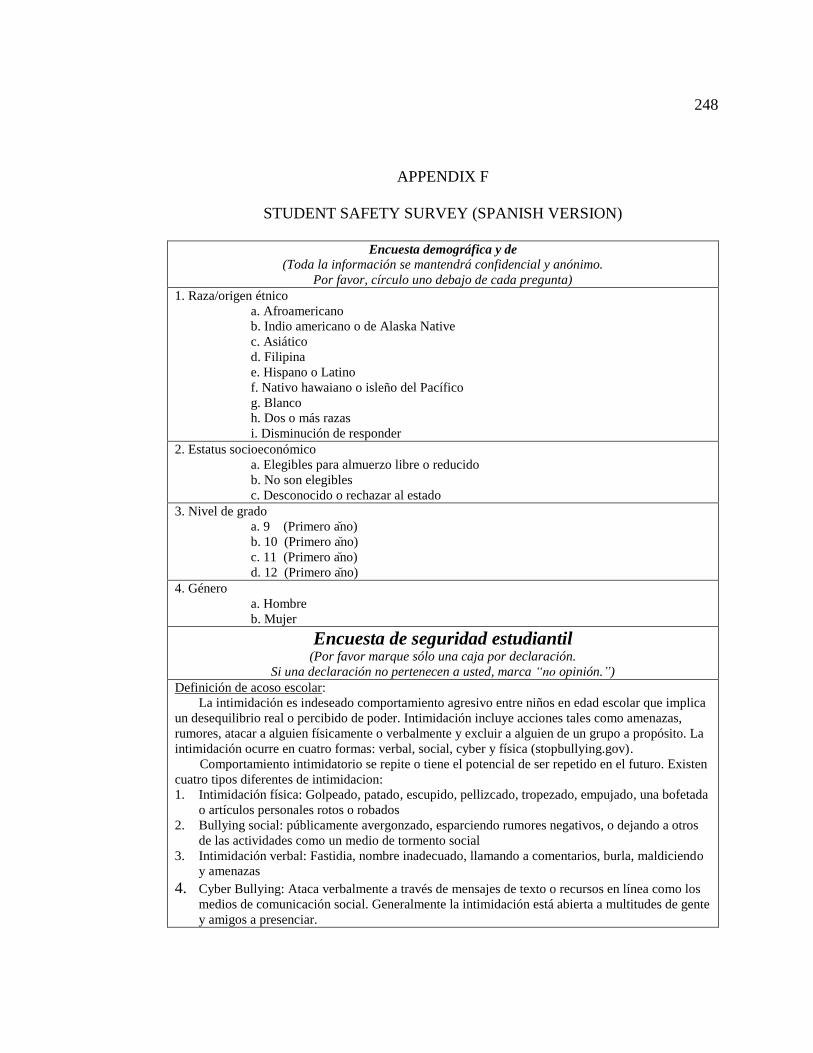
248
APPENDIX F
STUDENT SAFETY SURVEY (SPANISH VERSION)
Encuesta demográfica y de (Toda la información se mantendrá confidencial y anónimo.
Por favor, círculo uno debajo de cada pregunta)
1. Raza/origen étnico
a. Afroamericano
b. Indio americano o de Alaska Native
c. Asiático
d. Filipina
e. Hispano o Latino
f. Nativo hawaiano o isleño del Pacífico
g. Blanco
h. Dos o más razas
i. Disminución de responder
2. Estatus socioeconómico
a. Elegibles para almuerzo libre o reducido
b. No son elegibles
c. Desconocido o rechazar al estado
3. Nivel de grado
a. 9 (Primero a ﬞno)
b. 10 (Primero a ﬞno)
c. 11 (Primero a ﬞno)
d. 12 (Primero a ﬞno)
4. Género
a. Hombre
b. Mujer
Encuesta de seguridad estudiantil (Por favor marque sólo una caja por declaración.
Si una declaración no pertenecen a usted, marca “no opinión.”) Definición de acoso escolar:
La intimidación es indeseado comportamiento agresivo entre niños en edad escolar que implica
un desequilibrio real o percibido de poder. Intimidación incluye acciones tales como amenazas,
rumores, atacar a alguien físicamente o verbalmente y excluir a alguien de un grupo a propósito. La
intimidación ocurre en cuatro formas: verbal, social, cyber y física (stopbullying.gov).
Comportamiento intimidatorio se repite o tiene el potencial de ser repetido en el futuro. Existen
cuatro tipos diferentes de intimidacion:
1. Intimidación física: Golpeado, patado, escupido, pellizcado, tropezado, empujado, una bofetada
o artículos personales rotos o robados
2. Bullying social: públicamente avergonzado, esparciendo rumores negativos, o dejando a otros
de las actividades como un medio de tormento social
3. Intimidación verbal: Fastidia, nombre inadecuado, llamando a comentarios, burla, maldiciendo
y amenazas
4. Cyber Bullying: Ataca verbalmente a través de mensajes de texto o recursos en línea como los
medios de comunicación social. Generalmente la intimidación está abierta a multitudes de gente
y amigos a presenciar.
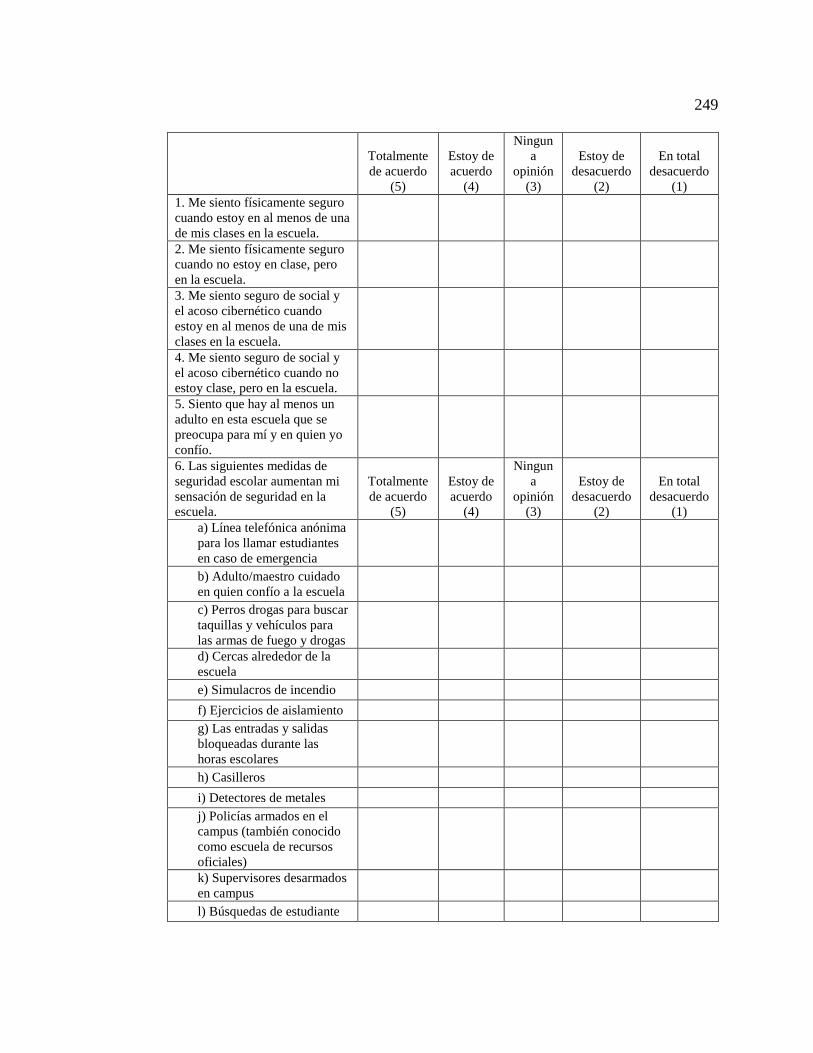
249
Totalmente
de acuerdo
(5)
Estoy de
acuerdo
(4)
Ningun
a
opinión
(3)
Estoy de
desacuerdo
(2)
En total
desacuerdo
(1) 1. Me siento físicamente seguro
cuando estoy en al menos de una
de mis clases en la escuela.
2. Me siento físicamente seguro
cuando no estoy en clase, pero
en la escuela.
3. Me siento seguro de social y
el acoso cibernético cuando
estoy en al menos de una de mis
clases en la escuela.
4. Me siento seguro de social y
el acoso cibernético cuando no
estoy clase, pero en la escuela.
5. Siento que hay al menos un
adulto en esta escuela que se
preocupa para mí y en quien yo
confío.
6. Las siguientes medidas de
seguridad escolar aumentan mi
sensación de seguridad en la
escuela.
Totalmente
de acuerdo (5)
Estoy de
acuerdo (4)
Ningun
a
opinión (3)
Estoy de
desacuerdo (2)
En total
desacuerdo (1)
a) Línea telefónica anónima
para los llamar estudiantes
en caso de emergencia
b) Adulto/maestro cuidado
en quien confío a la escuela
c) Perros drogas para buscar
taquillas y vehículos para
las armas de fuego y drogas
d) Cercas alrededor de la
escuela
e) Simulacros de incendio
f) Ejercicios de aislamiento
g) Las entradas y salidas
bloqueadas durante las
horas escolares
h) Casilleros
i) Detectores de metales
j) Policías armados en el
campus (también conocido
como escuela de recursos
oficiales)
k) Supervisores desarmados
en campus
l) Búsquedas de estudiante
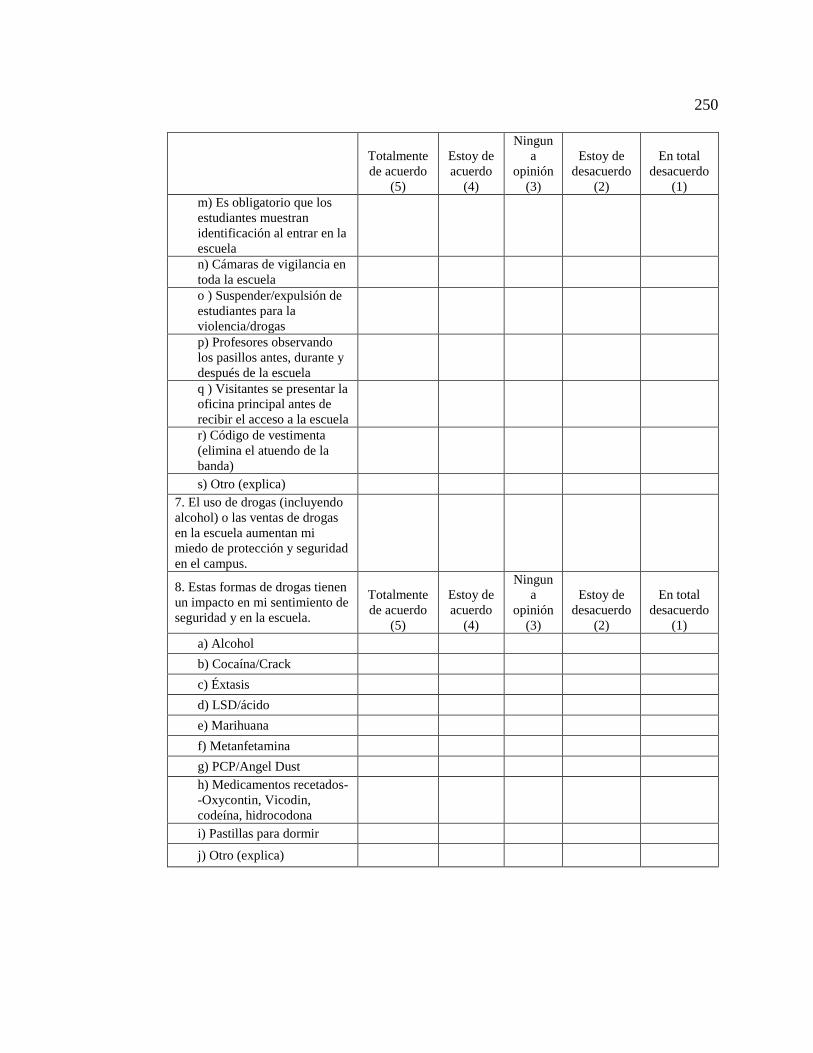
250
Totalmente
de acuerdo
(5)
Estoy de
acuerdo
(4)
Ningun
a
opinión
(3)
Estoy de
desacuerdo
(2)
En total
desacuerdo
(1) m) Es obligatorio que los
estudiantes muestran
identificación al entrar en la
escuela
n) Cámaras de vigilancia en
toda la escuela
o ) Suspender/expulsión de
estudiantes para la
violencia/drogas
p) Profesores observando
los pasillos antes, durante y
después de la escuela
q ) Visitantes se presentar la
oficina principal antes de
recibir el acceso a la escuela
r) Código de vestimenta
(elimina el atuendo de la
banda)
s) Otro (explica)
7. El uso de drogas (incluyendo
alcohol) o las ventas de drogas
en la escuela aumentan mi
miedo de protección y seguridad
en el campus.
8. Estas formas de drogas tienen
un impacto en mi sentimiento de
seguridad y en la escuela.
Totalmente
de acuerdo (5)
Estoy de
acuerdo (4)
Ningun
a
opinión (3)
Estoy de
desacuerdo (2)
En total
desacuerdo (1)
a) Alcohol
b) Cocaína/Crack
c) Éxtasis
d) LSD/ácido
e) Marihuana
f) Metanfetamina
g) PCP/Angel Dust
h) Medicamentos recetados-
-Oxycontin, Vicodin,
codeína, hidrocodona
i) Pastillas para dormir
j) Otro (explica)
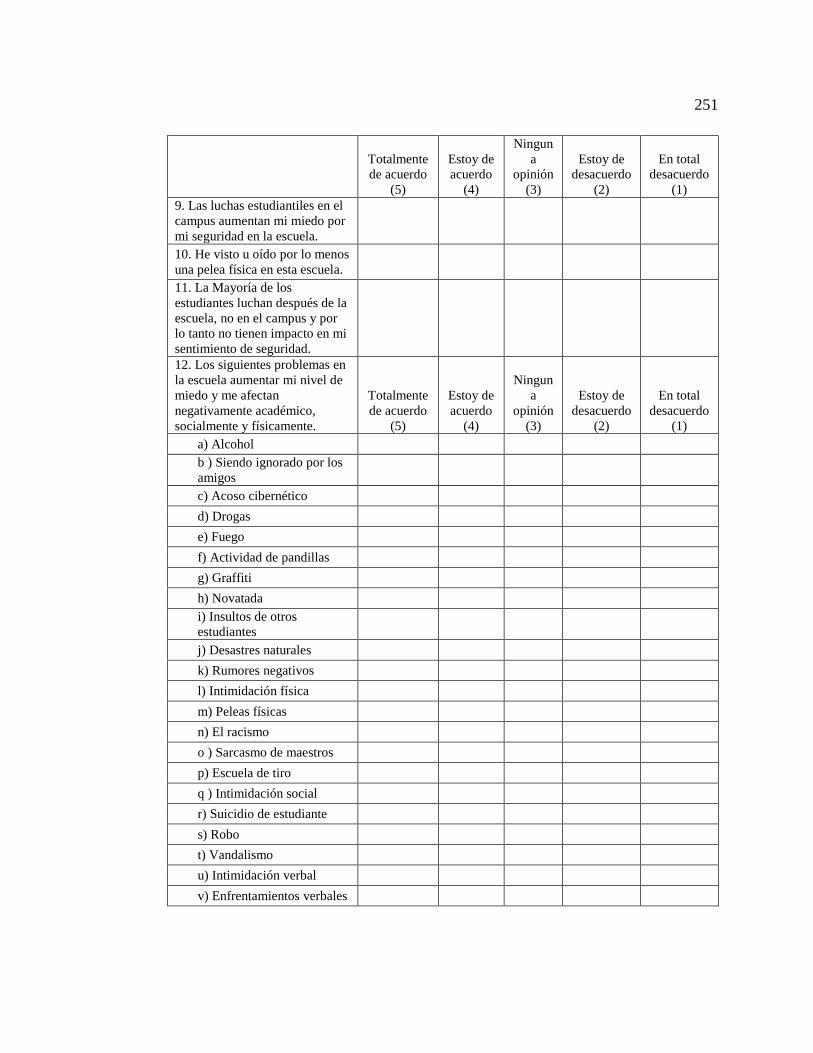
251
Totalmente
de acuerdo
(5)
Estoy de
acuerdo
(4)
Ningun
a
opinión
(3)
Estoy de
desacuerdo (2)
En total
desacuerdo (1)
9. Las luchas estudiantiles en el
campus aumentan mi miedo por
mi seguridad en la escuela.
10. He visto u oído por lo menos
una pelea física en esta escuela.
11. La Mayoría de los
estudiantes luchan después de la
escuela, no en el campus y por
lo tanto no tienen impacto en mi
sentimiento de seguridad.
12. Los siguientes problemas en
la escuela aumentar mi nivel de
miedo y me afectan
negativamente académico,
socialmente y físicamente.
Totalmente
de acuerdo (5)
Estoy de
acuerdo (4)
Ningun
a
opinión (3)
Estoy de
desacuerdo (2)
En total
desacuerdo (1)
a) Alcohol
b ) Siendo ignorado por los
amigos
c) Acoso cibernético
d) Drogas
e) Fuego
f) Actividad de pandillas
g) Graffiti
h) Novatada
i) Insultos de otros
estudiantes
j) Desastres naturales
k) Rumores negativos
l) Intimidación física
m) Peleas físicas
n) El racismo
o ) Sarcasmo de maestros
p) Escuela de tiro
q ) Intimidación social
r) Suicidio de estudiante
s) Robo
t) Vandalismo
u) Intimidación verbal
v) Enfrentamientos verbales
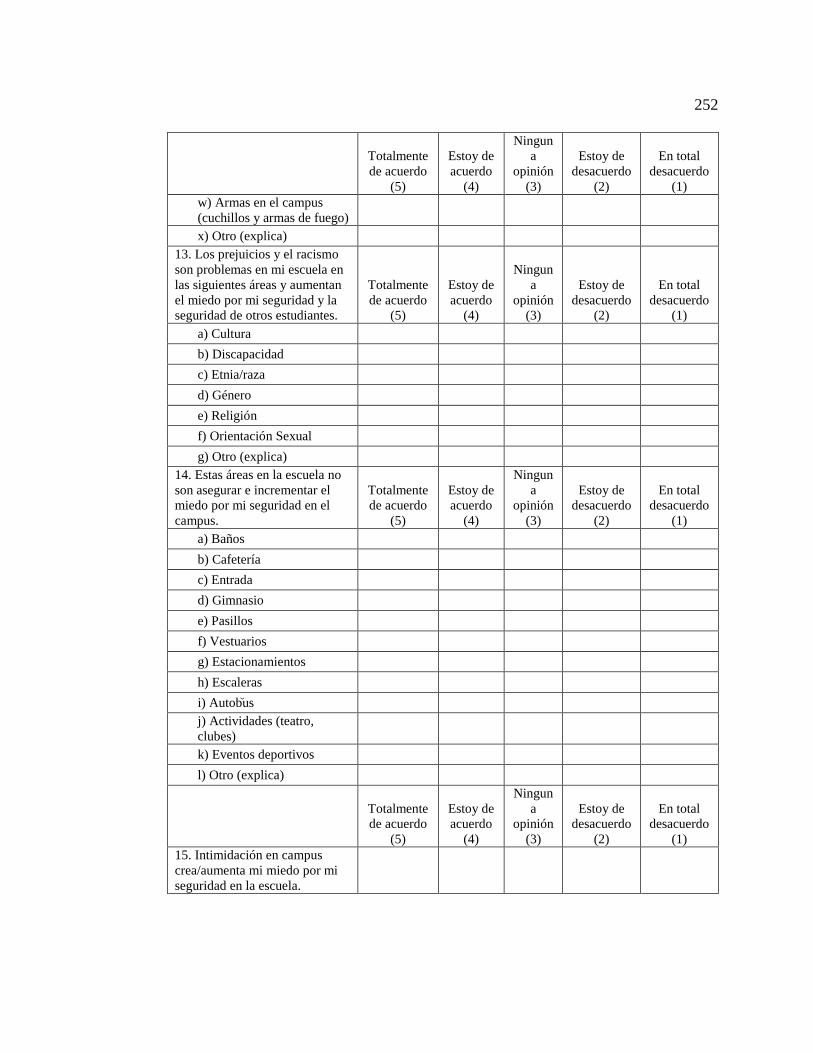
252
Totalmente
de acuerdo (5)
Estoy de
acuerdo (4)
Ningun
a
opinión (3)
Estoy de
desacuerdo (2)
En total
desacuerdo (1)
w) Armas en el campus
(cuchillos y armas de fuego)
x) Otro (explica)
13. Los prejuicios y el racismo
son problemas en mi escuela en
las siguientes áreas y aumentan
el miedo por mi seguridad y la
seguridad de otros estudiantes.
Totalmente
de acuerdo (5)
Estoy de
acuerdo (4)
Ningun
a
opinión (3)
Estoy de
desacuerdo (2)
En total
desacuerdo (1)
a) Cultura
b) Discapacidad
c) Etnia/raza
d) Género
e) Religión
f) Orientación Sexual
g) Otro (explica)
14. Estas áreas en la escuela no
son asegurar e incrementar el
miedo por mi seguridad en el
campus.
Totalmente
de acuerdo (5)
Estoy de
acuerdo (4)
Ningun
a
opinión (3)
Estoy de
desacuerdo (2)
En total
desacuerdo (1)
a) Baños
b) Cafetería
c) Entrada
d) Gimnasio
e) Pasillos
f) Vestuarios
g) Estacionamientos
h) Escaleras
i) Autob ﬞus
j) Actividades (teatro,
clubes)
k) Eventos deportivos
l) Otro (explica)
Totalmente
de acuerdo (5)
Estoy de
acuerdo (4)
Ningun
a
opinión (3)
Estoy de
desacuerdo (2)
En total
desacuerdo (1)
15. Intimidación en campus
crea/aumenta mi miedo por mi
seguridad en la escuela.
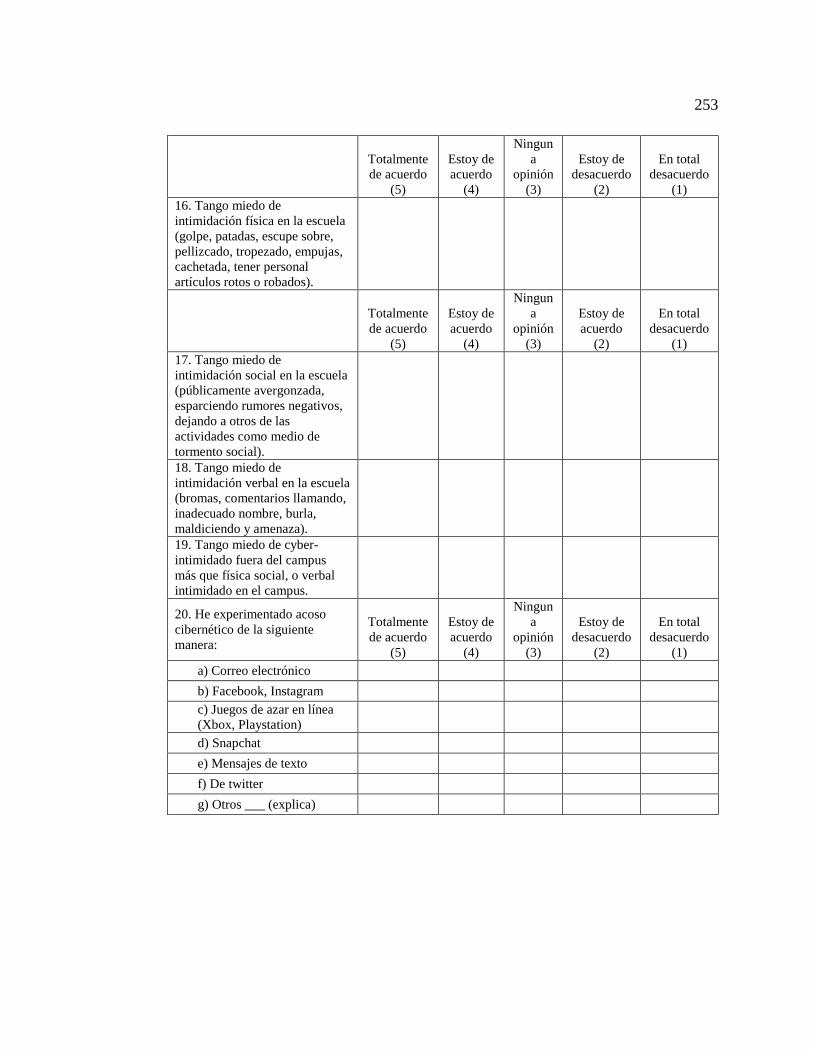
253
Totalmente
de acuerdo (5)
Estoy de
acuerdo (4)
Ningun
a
opinión (3)
Estoy de
desacuerdo (2)
En total
desacuerdo (1)
16. Tango miedo de
intimidación física en la escuela
(golpe, patadas, escupe sobre,
pellizcado, tropezado, empujas,
cachetada, tener personal
artículos rotos o robados).
Totalmente
de acuerdo (5)
Estoy de
acuerdo (4)
Ningun
a
opinión (3)
Estoy de
acuerdo (2)
En total
desacuerdo (1)
17. Tango miedo de
intimidación social en la escuela
(públicamente avergonzada,
esparciendo rumores negativos,
dejando a otros de las
actividades como medio de
tormento social).
18. Tango miedo de
intimidación verbal en la escuela
(bromas, comentarios llamando,
inadecuado nombre, burla,
maldiciendo y amenaza).
19. Tango miedo de cyber-
intimidado fuera del campus
más que física social, o verbal
intimidado en el campus.
20. He experimentado acoso
cibernético de la siguiente
manera:
Totalmente
de acuerdo (5)
Estoy de
acuerdo (4)
Ningun
a
opinión (3)
Estoy de
desacuerdo (2)
En total
desacuerdo (1)
a) Correo electrónico
b) Facebook, Instagram
c) Juegos de azar en línea
(Xbox, Playstation)
d) Snapchat
e) Mensajes de texto
f) De twitter
g) Otros ___ (explica)
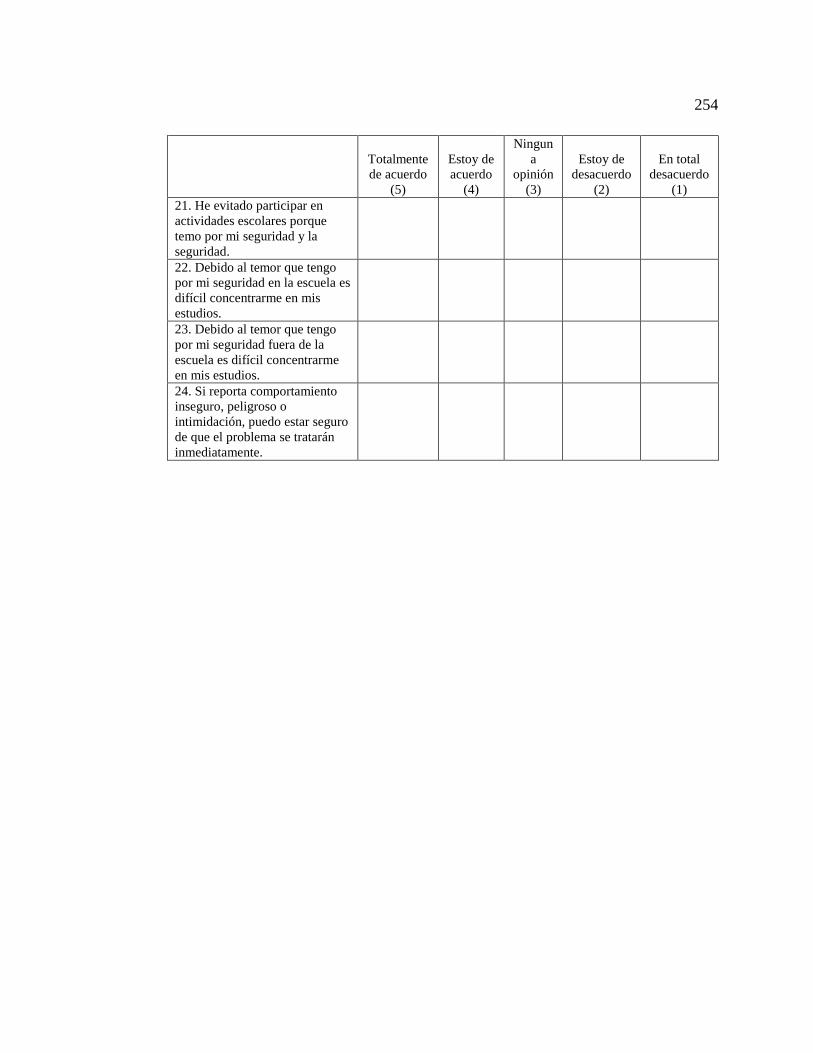
254
Totalmente
de acuerdo (5)
Estoy de
acuerdo (4)
Ningun
a
opinión (3)
Estoy de
desacuerdo (2)
En total
desacuerdo (1)
21. He evitado participar en
actividades escolares porque
temo por mi seguridad y la
seguridad.
22. Debido al temor que tengo
por mi seguridad en la escuela es
difícil concentrarme en mis
estudios.
23. Debido al temor que tengo
por mi seguridad fuera de la
escuela es difícil concentrarme
en mis estudios.
24. Si reporta comportamiento
inseguro, peligroso o
intimidación, puedo estar seguro
de que el problema se tratarán
inmediatamente.
255
APPENDIX G
INFORMATION STATEMENT TO STUDENTS (ENGLISH VERSION)
Dear Students,
The following forms are a part of an important Student Safety Survey the school is
conducting in conjunction with a graduate student researcher at CSU Stanislaus. This
is extremely important for the school in that it will provide us with valuable
information to make your experience at the school as safe and as enjoyable as
possible. Please take this information home for your parent or guardian to review.
Students who participate in this survey will be entered into a raffle to win one of ten
$20 gift cards to Starbucks, Taco Bell, iTunes, Subway, and Burger King.
If you wish to participate in this survey please follow these guidelines:
1. Your parents need to sign the attached Parent Information and Consent Form.
2. After they sign, please take a few minutes to fill out the survey using an ink
pen. If you do not know the answer or do not want to comment, please mark
“No Opinion” on the survey.
3. Do not write your name on it. The surveys are completely anonymous.
4. When you complete the survey enclose it in the attached envelop to ensure
your privacy.
5. Please return your signed parent permission form and the envelope containing
the completed survey to a campus supervisor who will provide you with your
raffle ticket.
Thank you for your assistance in making our school a safer place for everyone.
256
APPENDIX H
INFORMATION STATEMENT TO STUDENTS (SPANISH VERSION)
Estimados estudiantes,
Las formas siguientes son parte de una importante encuesta de seguridad de
estudiantes de la escuela, conjunto con un estudiante de postgrado investigador en
CSU Stanislaus. Éste es extremadamente importante para la escuela en que nos
proporcionará con información valiosa para hacer su experiencia en la escuela como
seguro y lo más agradable posible. Por favor tome a sus padres o tutor revisar esta
información. Los estudiantes que participan en este estudio se incorporarán a una rifa
para ganar uno de los diez tarjetas de regalo de $20 a Starbucks, Taco Bell, iTunes,
Subway y Burger King.
Si usted desea que participa en esta encuesta, por favor siga estas reglas:
1. Sus padres deben firmar información adjuntada: información de Padres y la forma
de consentimiento.
2. Después de firmar, por favor tome unos minutos para llenar la encuesta utilizando
una pluma de tinta.
3. No escribas su nombre en la encuesta. Las encuestas son totalmente anónimas.
4. Cuando usted completa la encuesta encerrarla en sobre para asegurar su
privacidad.
5. Por favor devuelva las formas firmadas de sus padres y el sobre que contiene la
encuesta completada con un supervisor de campus que le proporcionará su boleto
para la rifa.
Gracias por su ayuda en la fabricación de nuestra escuela un lugar más seguro para
todos.
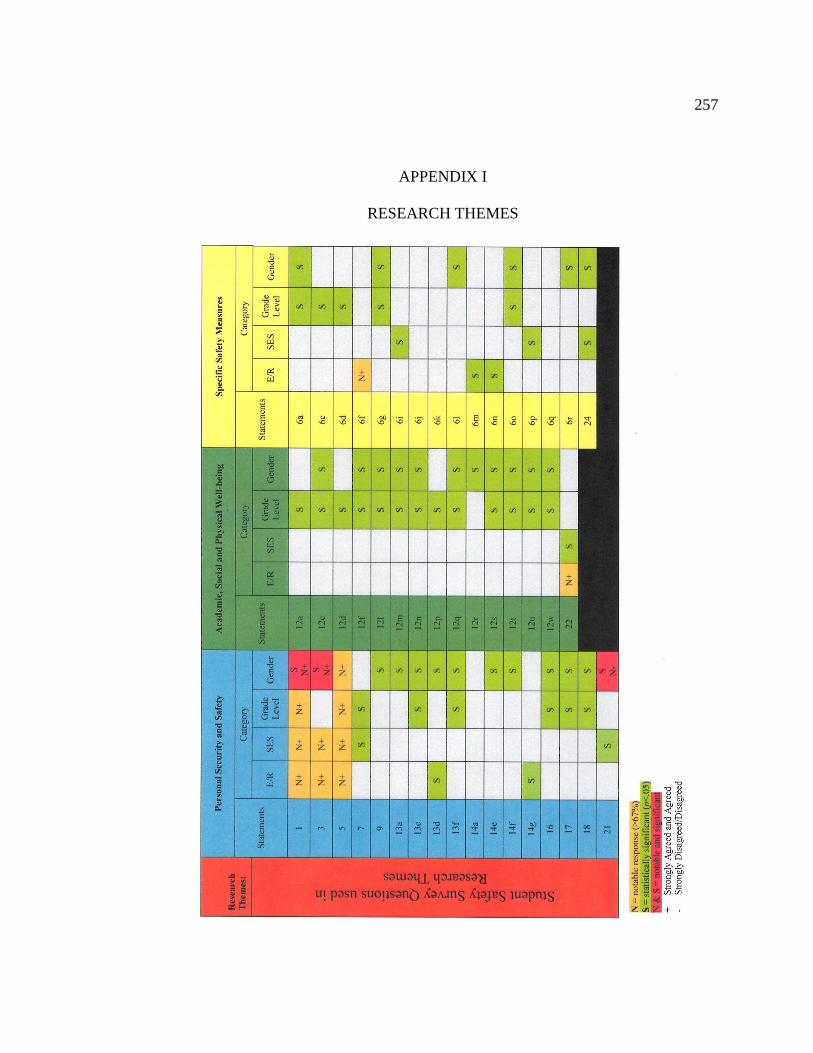
257
APPENDIX I
RESEARCH THEMES