Embed Size (px)
Citation preview
Oecologia (Berlin) (1984) 64:232-240 Oecologia �9 Springer-Verlag 1984
Remote perception of floral nectar by bumblebees James H. Marden Department of Zoology, University of Vermont, Burlington, VT 05405, USA
Summary. On both artificial flowers in the laboratory and certain plant species in the field, bumblebees often closely approached flowers and then departed without probing for nectar. In laboratory experiments where nectar rewards were associated with subtle visual or olfactory cues, bum- blebees approached and avoided non-rewarding flowers. Flowers that bees entered and probed for nectar contained rewards much more frequently than predicted by chance alone. When there were no external cues associated with nectar content, bees visited rewarding flowers by chance alone, provided rewarding flowers were not spatially clumped. In the field, bumblebees approached and rejected a large proportion of dogbane flowers and red clover inflo- rescences. On both species, flowers or inflorescences probed by bees contained more nectar than those rejected by bees or those that I chose at random. On fireweed and monk- shood, bees rarely or never approached and rejected healthy-looking flowers. Predictions generated by an opti- mal foraging model were tested on data from four bumble- bee species foraging on red clover. The model was highly successful in qualitatively predicting the relationship be- tween handling time and proportion of inflorescences re- jected by individual bees, and the relationship between threshold nectar content for acceptance by bees and average resource availability. Thus, bees appeared to use remotely perceived cues to maximize their rates of nectar intake.
Foraging behavior of bumblebees is a decision-making pro- cess (Waddington and Heinrich 1981, Pyke 1981). This pro- cess is hierarchical, progressing from the broadest, most general decisions about when and where to forage, to the most specific decisions about which flowers to visit, the sequence of visits, and the duration of each visit. The entire decision-making process is governed mainly by economics (Heinrich 1979 a). A wealth of recent research demonstrates that when bumblebees are given a choice of alternative be- haviors, they generally display the one that yields the high- est rate of return in terms of caloric intake (see references below).
Bumblebees have been shown to choose among co-oc- curring plant species (Brian 1957, Hobbs 1962, Free 1970, Inouye 1978, Heinrich 1979a, Pleasants 1981) and among patches of plants within a species (Manning 1956, Pyke 1980, Pleasants 1981). Within a patch bumblebees choose among individual plants (Levin 1973, Heinrich 1976; Will-
son and Price 1977, Schaeffer and Schaeffer 1979, Waser and Price 1981), and among individual flowers on a plant (Waddington and Heinrich 1979, Pyke 1979, Hodges 1981, Best and Bierzychudek 1982). This paper will address how bumblebees choose among individual flowers while forag- ing for nectar.
Rate of nectar intake can be affected by choices made at the individual flower level because flowers, even within species and individual plants, are highly heterogeneous in the amounts of nectar they contain. Area-restricted forag- ing by bees (Schaal 1977, Pyke 1978, Heinrich 1979b, Waddington 1980) and interplant differences in nectar-se- cretion rates (Pleasants and Chaplin 1983) create patchiness in the spatial distribution of nectar (Zimmerman 1981, Brink 1982, Pleasants and Zimmerman 1983), such that flowers in some areas have large nectar rewards, whereas flowers in most areas contain little nectar.
Bess have behaviors that exploit patchiness in nectar distributions (Pyke 1978, Heinrich 1979b, Waddington 1980). After visits to relatively richly-rewarding flowers, bees fly short distances to near-neighbor flowers. After visits to poorly-rewarding flowers, bees fly longer distances, bypassing near-neighbor flowers. The angle of a flight away from a flower, with respect to the direction from which a bee arrived at that flower, also differs in relation to the reward obtained. Bees are equally likely to proceed in any direction after obtaining a large reward, whereas they gen- erally proceed in a forward direction after obtaining little reward. As a result, bees tend to move quickly through poor areas and concentrate their efforts in rich areas. Simi- larly, the decision of whether to visit another flower on an inflorescence or to leave and fly to a different inflores- cence depends on the amount of nectar a bee obtained in the last flower it visited (Pyke 1979, Hodges 1981). Thus, bees appear to integrate information on past and current rates of reward, and the spatial predictability of rewards in order to move between flowers in a way that maximizes their net rate of food intake. The greatest penalty to a bee that chooses to ignore spatial information and move between flowers randomly is the amount of time spent land- ing on, entering, and probing flowers that contain little or no nectar.
On some plant species, bumblebees often hover briefly near a flower, and then fly away. In such cases it appears that bees might be able to remotely assess the food value of a flower without either investing time handling the flow- er, or relying on the amount of nectar received in the pre-
233
vious flower as a predictor of nectar contained in the pres- ent flower. Although this behavior has been noted pre- viously (Heinrich 1979 b), its significance has yet to be deter- mined. That is the goal of this study.
If bees can assess nectar content remotely, optimal for- aging theory predicts that they should use that information to maximize net rate of nectar intake (Pyke et al. 1977, Krebs et al. 1981). Results of this study will be analyzed in regard to that prediction.
Methods-laboratory experiments
Laboratory experiments were performed using artificial flowers constructed from cylindrical, flat-bottomed glass vials 45 mm in height and t3 mm inside diameter. These vials were wrapped with blue plastic tape, A small, 4 mm thick, square piece of plexiglas with a 2.5 mm diameter well drilled into its center was placed in the bottom of each "flower". A Hamilton pushbutton repeating dispenser was used to put nectar rewards or water blanks in the nectar wells.
A total of 361 flowers were uniformly arranged in 19 rows and 19 columns on a 1.22 i"171 2 styrofoam board painted green. Flowers were 6.35 cm from their four nearest neigh- boring flowers. Each flower position in the board had a hole 27 mm deep and 16 mm diameter that held the flower in place and upright even when the board was jarred.
The board holding the flowers was placed inside a cage consisting of a plexiglas top 0.5 m above the board and nylon screen sides tucked under the board's outer edges. Foraging experiments were performed with bees inside this enclosure.
Bombus edwardsii workers from a captive colony, with no previous foraging experience, were trained to visit artifi- cial flowers in a separate enclosure. When a bee had learned to fly between, enter, and probe ~0 consecutive flowers, the bee was placed in the experimental foraging arena to begin foraging bouts. Each experimental foraging bout was limited to 50 ~flower visits, where a visit was defined as entry into a flower and probing of the nectar well. Each bee performed 0-4 foraging bouts per day over 5-10 days until a maximum of 10 bouts per bee was performed. Some bees died before completing 10 foraging bouts. Each bee was used with only one set of experimental conditions.
During each foraging bout, the coordinates of each flower visited by a bee (i.e. row 3. column 15) were re- corded. Each bout was ended either after 50 visits or earlier if the bee became satiated and stopped foraging. The se- quence of flower visits was analyzed by a computer pro- gram for (1) distance between consecutively visited flowers; (2) angle to the next-visited flower, in relation to the pre- vious flower visited: and (3) presence or absence of nectar reward in each flower visited. Flights that ended on a flower located on the periphery of the array (rows 1 and 19, col- umns 1 and 19) were not measured for flight or angle be- cause the bees flight was necessarily constrained by the border of the array. Interflower flights that were interrupted by attempts to escape from the arena were not analyzed for distance or angle of departure. Thus an attempt was made to analyze flight patterns of bees without actually tracing all their movement within the arena. The accuracy of these measures depended on the degree to which bees flew straight paths between consecutively visited flowers.
Each experimental foraging bout began with 60 of the
361 flowers containing a 2 gl nectar reward. Depending on the experiment, the spatial arrangement of the 60 re- warding flowers was either random or clumped. Random arrays were generated using a random-numbers table to choose flower coordinates to receive rewards. Clumped ar- rays were generated by choosing 20 rewarding flowers ran- domly and subsequently placing rewards in two nearest neighbors of each initially chosen rewarding flower. This method generated 20 patches of three rewarding flowers, located randomly on the board. These small patches often abutted, forming larger patches. Each bee encountered a specific array only once, or if more than once, never on consecutive foraging bouts.
Composition of nectar, presence or absence of water in non-rewarding nectar wells, and spatial arrangement of rewarding flowers varied among the five experiments per- formed.
Results-laboratory experiments
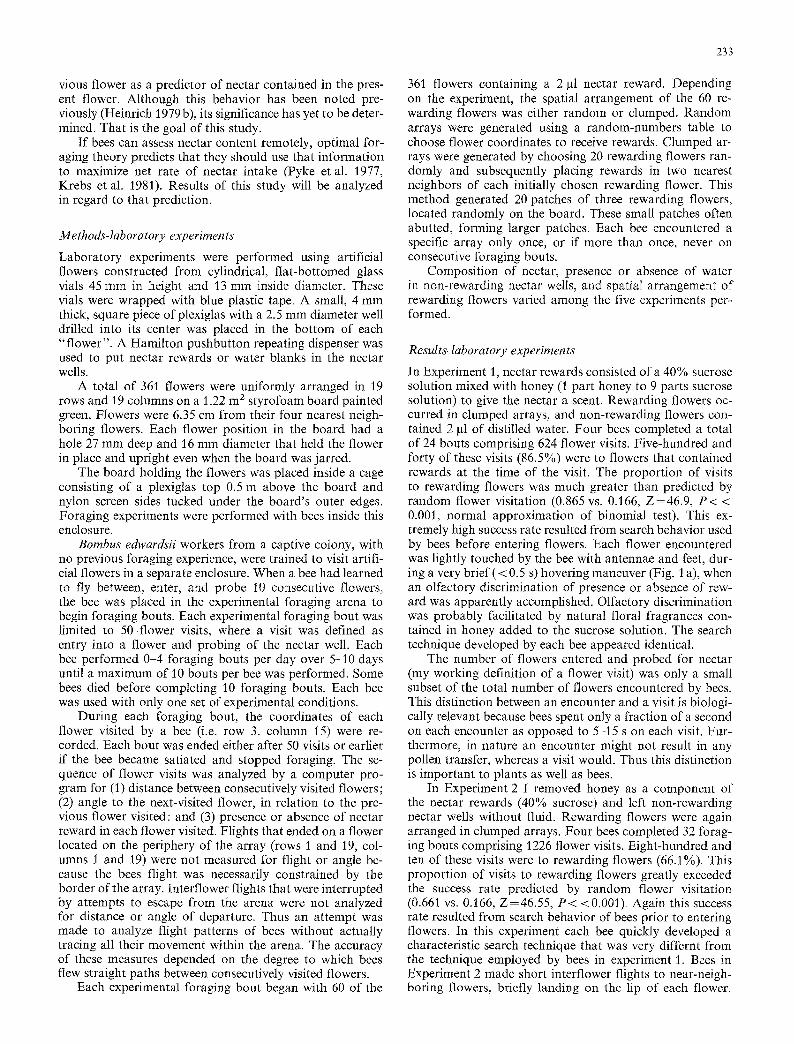
In Experiment 1, nectar rewards consisted of a 40% sucrose solution mixed with honey (1 part honey to 9 parts sucrose solution) to give the nectar a scent. Rewarding flowers oc- curred in clumped arrays, and non-rewarding flowers con- tained 2 gl of distilled water. Four bees completed a total of 24 bouts comprising 624 flower visits. Five-hundred and forty of these visits (86.5%) were to flowers that contained rewards at the time of the visit. The proportion of visits to rewarding flowers was much greater than predicted by random flower visitation (0.865 vs. 0.166, Z=46.9, P < < 0,001, normal approximation of binomial test). This ex- tremely high success rate resulted from search behavior used by bees before entering flowers. Each flower encountered was lightly touched by the bee with antennae and feet, dur- ing a very brief (< 0.5 s) hovering maneuver (Fig. 1 a), when an olfactory discrimination of presence or absence of rew- ard was apparently accomplished. Olfactory discrimination was probably facilitated by natural floral fragrances con- tained in honey added to the sucrose solution. The search technique developed by each bee appeared identical.
The number of flowers entered and probed for nectar (my working definition of a flower visit) was only a small subset of the total number of flowers encountered by bees. This distinction between an encounter and a visit is biologi- cally relevant because bees spent only a fraction of a second on each encounter as opposed to 5-15 s on each visit. Fur- thermore, in nature an encounter might not result in any pollen transfer, whereas a visit would. Thus this distinction is important to plants as well as bees.
In Experiment 2 I removed honey as a component of the nectar rewards (40% sucrose) and left non-rewarding nectar wells without fluid. Rewarding flowers were again arranged in clumped arrays. Four bees completed 32 forag- ing bouts comprising 1226 flower visits. Eight-hundred and ten of these visits were to rewarding flowers (66.1%). This proportion of visits to rewarding flowers greatly exceeded the success rate predicted by random flower visitation (0.661 vs. 0.166, Z=46.55, P < <0.001). Again this success rate resulted from search behavior of bees prior to entering flowers. In this experiment each bee quickly developed a characteristic search technique that was very differnt from the technique employed by bees in experiment 1. Bees in Experiment 2 made short interflower flights to near-neigh- boring flowers, briefly landing on the lip of each flower.
A
B
234
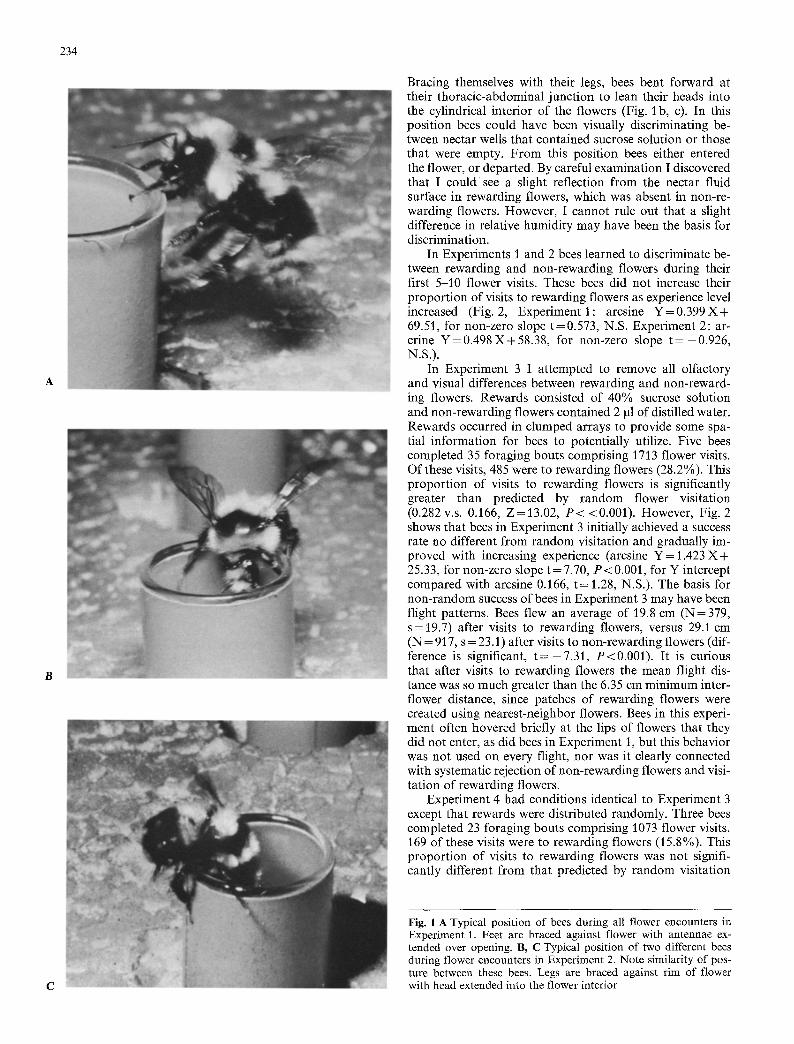
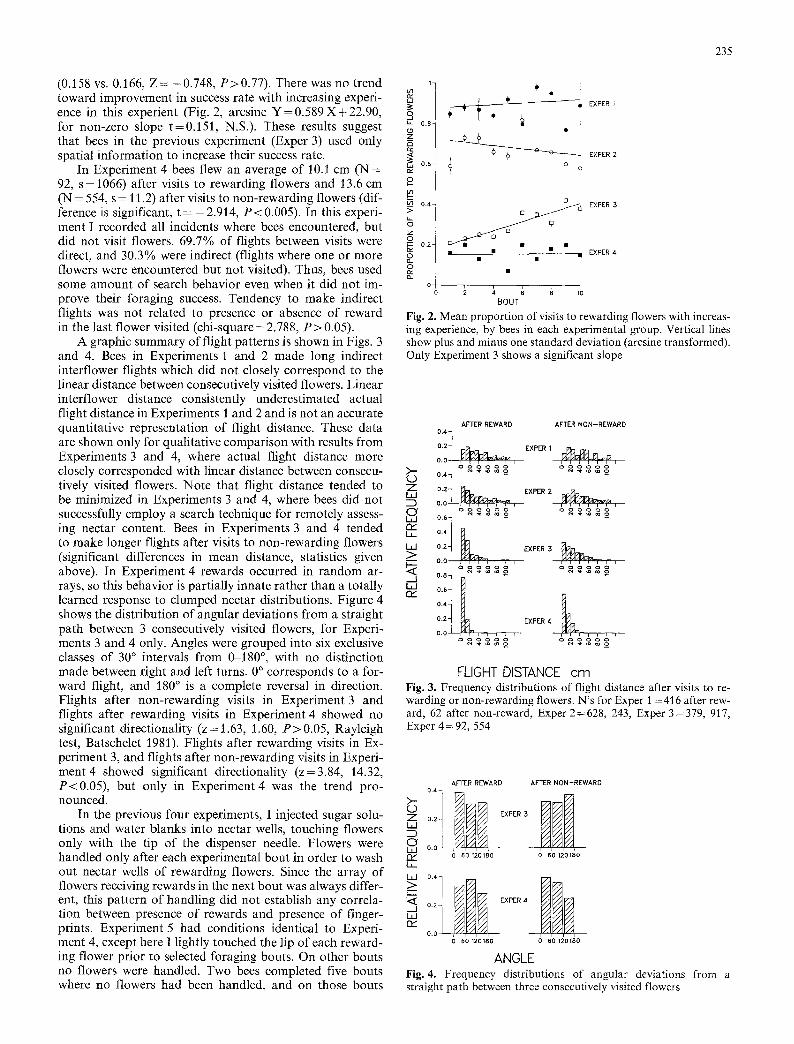
Bracing themselves with their legs, bees bent forward at their thoracic-abdominal junction to lean their heads into the cylindrical interior of the flowers (Fig. 1 b, c). In this position bees could have been visually discriminating be- tween nectar wells that contained sucrose solution or those that were empty. From this position bees either entered the flower, or departed. By careful examination I discovered that I could see a slight reflection from the nectar fluid surface in rewarding flowers, which was absent in non-re- warding flowers. However, I cannot rule out that a slight difference in relative humidity may have been the basis for discrimination.
In Experiments 1 and 2 bees learned to discriminate be- tween rewarding and non-rewarding flowers during their first 5-10 flower visits. These bees did not increase their proportion of visits to rewarding flowers as experience level increased (Fig. 2, Experiment 1: arcsine Y = 0 . 3 9 9 X + 69.51, for non-zero slope t=0.573, N.S. Experiment 2: ar- crine Y=0.498X+58.38 , for non-zero slope t = - 0 . 9 2 6 , N.S.).
In Experiment 3 I attempted to remove all olfactory and visual differences between rewarding and non-reward- ing flowers. Rewards consisted of 40% sucrose solution and non-rewarding flowers contained 2 ~tl of distilled water. Rewards occurred in clumped arrays to provide some spa- tial information for bees to potentially utilize. Five bees completed 35 foraging bouts comprising 1713 flower visits. Of these visits, 485 were to rewarding flowers (28.2%). This proportion of visits to rewarding flowers is significantly greater than predicted by random flower visitation (0.282 v.s. 0.166, Z=13.02, P < <0.001). However, Fig. 2 shows that bees in Experiment 3 initially achieved a success rate no different from random visitation and gradually im- proved with increasing experience (arcsine Y = 1.423 X + 25.33, for non-zero slope t = 7.70, P < 0.001, for Y intercept compared with arcsine 0.166, t = 1.28, N.S.). The basis for non-random success of bees in Experiment 3 may have been flight patterns. Bees flew an average of 19.8 cm (N = 379, s= 19.7) after visits to rewarding flowers, versus 29.1 cm (N = 917, s = 23.1) after visits to non-rewarding flowers (dif- ference is significant, t = - 7 . 3 1 , P<0.001). It is curious that after visits to rewarding flowers the mean flight dis- tance was so much greater than the 6.35 cm minimum inter- flower distance, since patches of rewarding flowers were created using nearest-neighbor flowers. Bees in this experi- ment often hovered briefly at the lips of flowers that they did not enter, as did bees in Experiment 1, but this behavior was not used on every flight, nor was it clearly connected with systematic rejection of non-rewarding flowers and visi- tation of rewarding flowers.
Experiment 4 had conditions identical to Experiment 3 except that rewards were distributed randomly. Three bees completed 23 foraging bouts comprising 1073 flower visits. 169 of these visits were to rewarding flowers (15.8%). This proportion of visits to rewarding flowers was not signifi- cantly different from that predicted by random visitation
C
Fig. ! A Typical position of bees during all flower encounters in Experiment 1. Feet are braced against flower with antennae ex- tended over opening. B, C Typical position of two different bees during flower encounters in Experiment 2. Note similarity of pos- ture between these bees. Legs are braced against rim of flower with head extended into the flower interior
235
(0.158 vs. 0.166, Z = -0 .748 , P>0.77) . There was no trend toward improvement in success rate with increasing experi- ence in this experient (Fig. 2, arcsine Y = 0 . 5 8 9 X + 2 2 . 9 0 , ~ for non-zero slope t=0.151, N.S.). These results suggest
z_ t h a t bees in the previous experiment (Exper 3) used only spatial information to increase their success rate. <
In Experiment 4 bees flew an average of 10.1 cm (N = 92, s = 1066) after visits to rewarding flowers and 13.6 cm o (N = 554, s = 11.2) after visits to non-rewarding flowers (dif- ference is significant, t = -2 .914 , P<0.005) . In this experi- > ment I recorded all incidents where bees encountered, but
z
did not visit flowers. 69.7% of flights between visits were direct, and 30.3% were indirect (flights where one or more
o _
flowers were encountered but not visited). Thus, bees used some amount of search behavior even when it did not im- prove their foraging success. Tendency to make indirect flights was not related to presence or absence o f reward in the last flower visited (chi-square = 2.788, P > 0.05).
A graphic summary of flight patterns is shown in Figs. 3 and 4. Bees in Experiments 1 and 2 made long indirect interflower flights which did not closely correspond to the linear distance between consecutively visited flowers. Linear inter flower distance consistently underestimated actual flight distance in Experiments 1 and 2 and is not an accurate quantitative representation of flight distance. These data are shown only for qualitative comparison with results from Experiments 3 and 4, where actual flight distance more closely corresponded with linear distance between consecu- tively visited flowers. Note that flight distance tended to be minimized in Experiments 3 and 4, where bees did not successfully employ a search technique for remotely assess- ing nectar content. Bees in Experiments 3 and 4 tended to make longer flights after visits to non-rewarding flowers (significant differences in mean distance, statistics given above). In Experiment 4 rewards occurred in random ar- rays, so this behavior is partially innate rather than a totally learned response to clumped nectar distributions. Figure 4 shows the distribution o f angular deviations from a straight path between 3 consecutively visited flowers, for Experi- ments 3 and 4 only. Angles were grouped into six exclusive classes of 30 ~ intervals from 0-180 ~ , with no distinction made between right and left turns. 0 ~ corresponds to a for- ward flight, and 180 ~ is a complete reversal in direction. Flights after non-rewarding visits in Experiment 3 and flights after rewarding visits in Experiment 4 showed no significant directionality ( z= 1.63, 1.60, P>0 .05 , Rayleigh test, Batschelet 1981). Flights after rewarding visits in Ex- periment 3, and flights after non-rewarding visits in Experi- ment 4 showed significant directionality (z=3.84, 14.32, P<0.05) , but only in Exper iment4 was the trend pro- nounced. >--
o In the previous four experiments, I injected sugar solu- z tions and water blanks into nectar wells, touching flowers uz only with the tip of the dispenser needle. Flowers were O handled only after each experimental bout in order to wash out nectar wells of rewarding flowers. Since the array of flowers receiving rewards in the next bout was always differ- >__ ent, this pattern of handling did not establish any correla- tion between presence o f rewards and presence o f finger- ~-z prints. Experiment 5 had conditions identical to Experi- ment 4, except here I lightly touched the lip of each reward- ing flower prior to selected foraging bouts. On other bouts no flowers were handled. Two bees completed five bouts where no flowers had been handled, and on those bouts
0 . ~
0 � 9
0 . 4 -
0 . 2 -
@ EXPER I
~5 ~-------~-~--~ EXPER 2
o o
~ EXPER 3
. EXPER 4
BOUT
Fig. 2. Mean proportion of visits to rewarding flowers with increas- ing experience, by bees in each experimental group. Vertical lines show plus and minus one standard deviation (arcsine transformed). Only Experiment 3 shows a significant slope
AFTER REWARD AFTER NON-REWARD
0'4 t 0.2 El~l~l~. , ,r , EXPER I ~ - m . , ~
Z 0.2 EXPER 2
00 ~ , ,~' �9 i i i i i i i , i i i
~ La_ 0 , 4
I , I 0,2 EXPER 3 ~ P l m
~--- o .o , , , , , , , ~ , , , ~ - , ' - , - ,
LLI 0.6 r~ 0 . 4
o.2 EXPER 4
o o
FLIGHT DISTANCE cm Fig. 3. Frequency distributions of flight distance after visits to re- warding or non-rewarding flowers. N's for Exper 1 =416 after rew- ard, 62 after non-reward, Exper 2=628, 243, Exper 3=379, 917, Exper 4 = 92, 554
AFTER REWARD AFTER NON-REWARD
EXPER 3 0.2
O0 0 60 120180 0 60 120180
0.2 EXPER 4
Oil �9 i ~ i i i L l ,
0 60 120180 0 60 120180
ANGLE Fig. 4. Frequency distributions of angular deviations from a straight path between three consecutively visited flowers
236
made 24 of 169 flower visits to rewarding flowers (14.2%). This success rate was not significantly different from ran- 70- dom visitation ( Z = -0.838, P>0.4) . On eight bouts when 60- fingerprints corresponded with rewards, bees made 179 of >- 50-
300 visits to rewarding flowers (59.7%). This success rate ,z~ 40- was significantly greater than random visitation (Z = 20.05, ~ 30~ P < <0.001). These bees searched for flowers with finger- prints just as bees in Experiment 1 searched for flowers ,. 20- with honey in the nectar (Fig. 1 a). Fingerprints placed on ~o- flowers were not contaminated with honey or sucrose solu- o tion, so bees must have learned to detect body oils, scents from soaps or shampoos, or other such weak odors.
Methods - f ie ld experiments
In the field I observed bumblebees foraging on Apocynum androsaemifolium, Trifolium pratense, Aconitum napellus, and Epilobium angustifolium. In each case I determined if nectar-collecting bees frequently approached and then de- parted from (without visiting) flowers that were similar in appearance to the majority of healthy flowers of that species (at least to a human observer). It was quickly apparent that bees either rarely or never rejected flowers, or con- sistently rejected a large proportion of flowers (>20%), depending on the plant species. With plant species where flowers were frequently rejected, I used 1 gl micropipets to sample nectar volumes in rejected flowers, flowers which bees accepted, and flowers that I chose randomly. Accepted flowers were ones on which bees landed and began to extend their proboscis to imbibe nectar. I quickly knocked bees off accepted flowers before they removed any nectar. Thus I could compare amounts of nectar contained in flowers visited by bees, flowers rejected by bees, and flowers that I chose randomly with no knowledge of nectar content. Laboratory results showed that bees could remotely assess nectar rewards, hence I expected to find more nectar in accepted flowers than either rejected or randomly chosen flowers, and less nectar in rejected flowers than in randomly chosen flowers. Because these expectations were formed prior to field experiments, I used a priori statistical tech- niques and one-tailed statistical tests to analyze results.
On T. pratense (red clover) I was able to follow individ- ual bees for many consecutive inflorescence (head) visits. For each bee followed I recorded its species, time spent on each head, number of florets probed per head, number of heads accepted, and number of heads rejected. These data were compared with qualitative predictions derived from optimal foraging theory.
Observations on A. androsaemifolium, E. angustifolium, and A. napellus were made during July 1982 near Weld, Maine. A. napellus plants grew in a garden, E. angustifolium on a roadside, and A. androsaemifolium in an old field. Ob- servations on T. pratense were made during August to No- vember of 1982 and 1983 near Burlington, Vermont, in cultivated fields.
Results-field experiments
During four to 6 h of observation of hundreds of bumblebee visits to flowers of both Epilobium angustifoIium (fireweed) and Aconitum napellus (monkshood), I did not observe any nectar collecting bumblebees that frequently approached and rejected healthy flowers. Observations of E. angustifo- lium were conducted starting at 0700 h when many sampled
ACCEPTED REJECTED RANDOM
L~I I I L l I I I
d o e ; D e ; c 5 d o d d d d d o d d d d
NECTAR VOLUME ul
Fig. 5. Frequency distributions of nectar volume in accepted, re- jected, and randomly chosen dogbane flowers. N = 80 for each cate- gory. All volumes greater than 0.5 #1 are grouped together
flowers contained large quantites of nectar presumably ac- cumulated overnight (range = 0-0.68 gl, mean = 0.25 gl, s = 0.27 gl, N=40) , and at 1000 h when all flowers sampled contained less than 0.05 gl (N = 50) due to heavy bee activi- ty. In both situations bumblebees of four species (B. vagans, B. terricola, B. ternarius, B. perplexus) did not display any tendency to approach and reject healthy flowers. Observa- tions of B. vagans and B. fervidus foraging on A. napellus were conducted starting at 1000 h when sampled flowers contained a wide range of nectar volumes (0-1.39 gl, mean = 0.27 ~tl, s = 0.30 gl, N = 30). Here again bees showed no behaviors to suggest remote perception of nectar rew- ards.
On Apocynum androsaemifolium (dogbane), B. terricola and B. ternarius workers frequently approached and re- jected healthy flowers. On July 18, 19 and 23 of 1982 I sampled nectar volumes in flowers that were accepted or rejected by bees, and in flowers that I chose randomly (N = 80 for each category). The distribution of nectar volumes in each category of flower is shown in Fig. 5. Accepted flowers contained more nectar than either rejected (Z = - 6.579, Mann-Whitney U Test corrected for ties, P<0.001, one-tailed) or randomly chosen flowers ( Z = - 4 . 1 4 7 , P < 0.001, one-tailed), whereas rejected flowers contained less nectar than randomly chosen flowers ( Z = - 2 . 4 5 6 , P < 0.007, one-tailed).
During August to November of 1982 and 1983 I ob- served B. terrieola, B. fervidus, B. impatiens, and B. affinis workers foraging on Trifolium pratense (red clover). As on A. androsaemifolium, bees often approached and rejected healthy heads (inflorescences). On eight days at four sepa- rate sites I sampled nectar volumes in ten florets per head from accepted, rejected, and randomly chosen heads ( N = 86 for each category). Frequency distributions of nectar volumes in the three categories of heads are shown in Fig. 6. As predicted, heads accepted by bees contained more nectar than heads rejected by bees (Z= -4 .37, Mann-Whitney U Test corrected for ties, P < 0.001, one-tailed), or heads that I chose randomly (Z= -2 .74, P < 0.003, one-tailed). Heads rejected by bees contained less nectar than heads chosen randomly (Z = - 1.98, P < 0.03, one-tailed).
On October 5, 1982, August 24, and September 1, 1983 I followed individual workers of four different bumblebee species foraging in large dense fields of red clover. 54 indi- vidual bees were observed for an average of 62 head en- counters (s =28.3, N = 54) and timed for probing speed on an average of 56 florets (s=27.6, N=54) . Mean probing
237
ACCEPTED REJECTED RANDOM
30-
Z
i i i i i ~ i i - - i i
d Oc; 6 c;cg c; o cg c~ c~ c~ d o c~ c~ c; c~
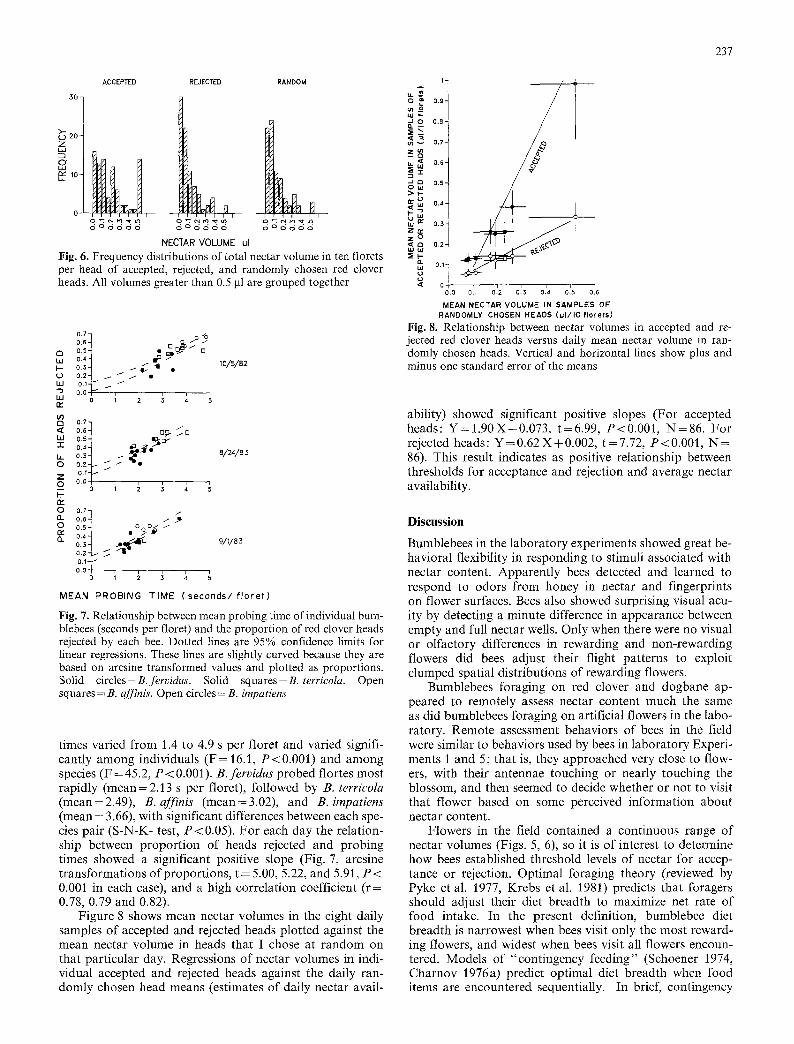
NECTAR VOLUME ul Fig. 6. Frequency distributions of total nectar volume in ten florets per head of accepted, rejected, and randomly chosen red clover heads. All volumes greater than 0.5 gl are grouped together
r~
W N- L) W
W r~
g F -
o7 l 0.5 O o, . t ~ : ~ 0.3 ~ --I~o'll �9 0.2 ~ ~ i 0.1 i
0,0 ~
lo/5/82
0.7
0,6 Op. / O 0.5 ~.E~"
o.~ ~ t , ~ ' 8/24/~3 Om~ ~ ~ ~O 0 . 0 |
0.6 /" o.~ o~0~ .- 0.4 �9 0.3 9/7/83
/ 0.2 / o.1 o,o
o ~ ~ ~ ~
MEAN PROBING T IME ( s e c o n d s / f l e r e t )
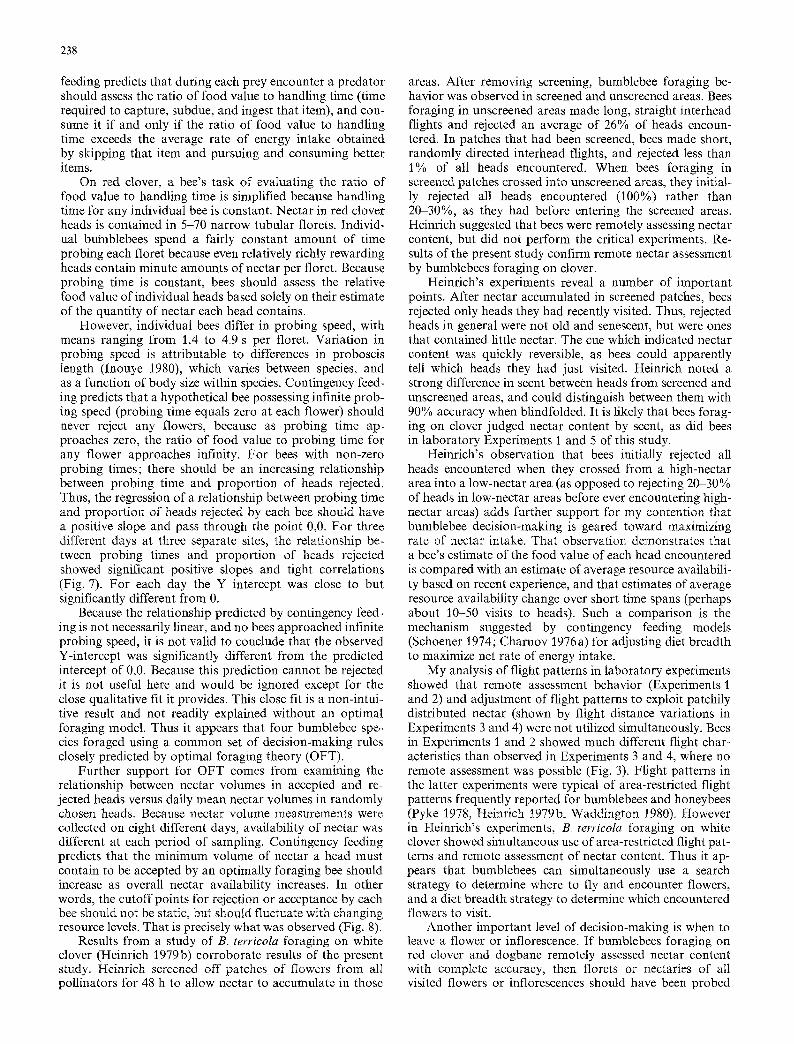
Fig. 7. Relationship between mean probing time of individual bum- blebees (seconds per floret) and the proportion of red clover heads rejected by each bee. Dotted lines are 95% confidence limits for linear regressions. These lines are slightly curved because they are based on arcsine transformed values and plotted as proportions. Solid circles = B. fervidus. Solid squares = B. terrieoIa. Open squares = B. affinis. Open circles = B. impatiens
times varied from 1.4 to 4.9 s per floret and varied signifi- cantly among individuals ( F = 16.1, P<0.001) and among species (F = 45.2, P < 0.001) . B . f e r v i d u s probed tor tes most rapidly (mean = 2.13 s per floret), followed by B. terr icola (mean=2.49), B. a f f in i s (mean=3.02), and B. impa t i ens (mean = 3.66), with significant differences between each spe- cies pair (S-N-K- test, P<0.05). For each day the relation- ship between proportion of heads rejected and probing times showed a significant positive slope (Fig. 7, arcsine transformations of proportions, t = 5.00, 5.22, and 5.91, P < 0.001 in each case), and a high correlation coefficient ( r= 0.78, 0.79 and 0.82).
Figure 8 shows mean nectar volumes in the eight daily samples of accepted and rejected heads plotted against the mean nectar volume in heads that I chose at random on that particular day. Regressions of nectar volumes in indi- vidual accepted and rejected heads against the daily ran- domly chosen head means (estimates of daily nectar avail-
i- !
0 ~ 0.9-
0 Ore8 --
~ 0.7-
-r
F-
0.2 ) ~ o.,
o,o d.~ o22 o.<3 oi~ o~5 o/~ MEAN NECTAR V O L U M E iN S A M P L E S OF
RANDOMLY CHOSEN HEADS ( u l / I O f l o r e f s )
Fig. 8. Relationship between nectar volumes in accepted and re- jected red clover heads versus daily mean nectar volume in ran- domly chosen heads. Vertical and horizontal lines show plus and minus one standard error of the means
ability) showed significant positive slopes (For accepted heads: Y = l . 9 0 X - 0 . 0 7 3 , t=6.99, P<0.001, N=86 . For rejected heads: Y=0.62 X+0.002, t=7.72, P<0.001, N = 86). This result indicates as positive relationship between thresholds for acceptance and rejection and average nectar availability.
D i s c u s s i o n
Bumblebees in the laboratory experiments showed great be- havioral flexibility in responding to stimuli associated with nectar content. Apparently bees detected and learned to respond to odors from honey in nectar and fingerprints on flower surfaces. Bees also showed surprising visual acu- ity by detecting a minute difference in appearance between empty and full nectar wells. Only when there were no visual or olfactory differences in rewarding and non-rewarding flowers did bees adjust their flight patterns to exploit clumped spatial distributions of rewarding flowers.
Bumblebees foraging on red clover and dogbane ap- peared to remotely assess nectar content much the same as did bumblebees foraging on artificial flowers in the labo- ratory. Remote assessment behaviors of bees in the field were similar to behaviors used by bees in laboratory Experi- ments 1 and 5; that is, they approached very close to flow- ers, with their antennae touching or nearly touching the blossom, and then seemed to decide whether or not to visit that flower based on some perceived information about nectar content.
Flowers in the field contained a continuous range of nectar volumes (Figs. 5, 6), so it is of interest to determine how bees established threshold levels of nectar for accep- tance or rejection. Optimal foraging theory (reviewed by Pyke et al. 1977, Krebs et al. 1981) predicts that foragers should adjust their diet breadth to maximize net rate of food intake. In the present definition, bumblebee diet breadth is narrowest when bees visit only the most reward- ing flowers, and widest when bees visit all flowers encoun- tered. Models of "contingency feeding" (Schoener 1974, Charnov 1976a) predict optimal diet breadth when food items are encountered sequentially. In brief, contingency
238
feeding predicts that during each prey encounter a predator should assess the ratio of food value to handling time (time required to capture, subdue, and ingest that item), and con- sume it if and only if the ratio of food value to handling time exceeds the average rate of energy intake obtained by skipping that item and pursuing and consuming better items.
On red clover, a bee's task of evaluating the ratio of food value to handling time is simplified because handling time for any individual bee is constant. Nectar in red clover heads is contained in 5-70 narrow tubular florets. Individ- ual bumblebees spend a fairly constant amount of time probing each floret because even relatively richly rewarding heads contain minute amounts of nectar per floret. Because probing time is constant, bees should assess the relative food value of individual heads based solely on their estimate of the quantity of nectar each head contains.
However, individual bees differ in probing speed, with means ranging from 1.4 to 4.9 s per floret. Variation in probing speed is attributable to differences in proboscis length (Inouye 1980), which varies between species, and as a function of body size within species. Contingency feed- ing predicts that a hypothetical bee possessing infinite prob- ing speed (probing time equals zero at each flower) should never reject any flowers, because as probing time a p - proaches zero, the ratio of food value to probing time for any flower approaches infinity. For bees with non-zero probing times; there should be an increasing relationship between probing time and proportion of heads rejected. Thus, the regression of a relationship between probing time and proportion of heads rejected by each bee should have a positive slope and pass through the point 0,0. For three different clays at three separate sites, the relationship be- tween probing times and proportion of heads rejected showed significant positive slopes and tight correlations (Fig. 7). For each day the Y intercept was close to but significantly different from 0.
Because the relationship predicted by contingency feed- ing is not necessarily linear, and no bees approached infinite probing speed, it is not valid to conclude that the observed Y-intercept was significantly different from the predicted intercept of 0,0. Because this prediction cannot be rejected it is not useful here and would be ignored except for the close qualitative fit it provides. This close fit is a non-intui- tive result and not readily explained without an optimal foraging model. Thus it appears that four bumblebee spe- cies foraged using a common set of decision-making rules closely predicted by optimal foraging theory (OFT).
Further support for OFT comes from examining the relationship between nectar volumes in accepted and re- jected heads versus daily mean nectar volumes in randomly chosen heads. Because nectar volume measurements were collected on eight different days, availability of nectar was different at each period of sampling. Contingency feeding predicts that the minimum volume of nectar a head must contain to be accepted by an optimally foraging bee should increase as overall nectar availability increases. In other words, the cutoff points for rejection or acceptance by each bee should not be static, but Should fluctuate with changing resource levels. That is precisely what was observed (Fig. 8).
Results from a study of B. terricola foraging on white clover (Heinrich 1979b) corroborate results of the present study. Heinrich screened off patches of flowers from all pollinators for 48 h to allow nectar to accumulate in those
areas. After removing screening, bumblebee foraging be- havior was observed in screened and unscreened areas. Bees foraging in unscreened areas made long, straight interhead flights and rejected an average of 26% of heads encoun- tered. In patches that had been screened, bees made short, randomly directed interhead flights, and rejected less than 1% of all heads encountered. When bees foraging in screened patches crossed into unscreened areas, they initial- ly rejected all heads encountered (100%) rather than 20-30%, as they had before entering the screened areas. Heinrich suggested that bees were remotely assessing nectar content, but did not perform the critical experiments. Re- sults of the present study confirm remote nectar assessment by bumblebees foraging on clover.
Heinrich's experiments reveal a number of important points. After nectar accumulated in screened patches, bees rejected only heads they had recently visited. Thus, rejected heads in general were not old and senescent, but were ones that contained little nectar. The cue which indicated nectar content was quickly reversible, as bees could apparently tell which heads they had just visited. Heinrich noted a strong difference in scent between heads from screened and unscreened areas, and could distinguish between them with 90% accuracy when blindfolded. It is likely that bees forag- ing on clover judged nectar content by scent, as did bees in laboratory Experiments 1 and 5 of this study.
Heinrich's observation that bees initially rejected all heads encountered when they crossed from a high-nectar area into a low-nectar area (as opposed to rejecting 21~30% of heads in low-nectar areas before ever encountering high- nectar areas) adds further support for my contention that bumblebee decision-making is geared toward maximizing rate of nectar intake. That observation demonstrates that a bee's estimate of the food value of each head encountered is compared with an estimate of average resource availabili- ty based on recent experience, and that estimates of average resource availability change over short time spans (perhaps about 10-50 visits to heads). Such a comparison is the mechanism suggested by contingency feeding models (Schoener 1974; Charnov 1976 a) for adjusting diet breadth to maximize net rate of energy intake.
My analysis of flight patterns in laboratory experiments showed that remote assessment behavior (Experiments 1 and 2) and adjustment of flight patterns to exploit patchily distributed nectar (shown by flight distance variations in Experiments 3 and 4) were not utilized simultaneously. Bees in Experiments 1 and 2 showed much different flight char- acteristics than observed in Experiments 3 and 4, where no remote assessment was possible (Fig. 3). Flight patterns in the latter experiments were typical of area-restricted flight patterns frequently reported for bumblebees and honeybees (Pyke 1978, Heinrich 1979b, Waddington 1980). However in Heinrich's experiments, B terricola foraging on white clover showed simultaneous use of area-restricted flight pat- terns and remote assessment of nectar content. Thus it ap- pears that bumblebees can simultaneously use a search strategy to determine where to fly and encounter flowers, and a diet breadth strategy to determine which encountered flowers to visit.
Another important level of decision-making is when to leave a flower or inflorescence. I f bumblebees foraging on red clover and dogbane remotely assessed nectar content with complete accuracy, then florets or nectaries of all visited flowers or inflorescences should have been probed
239
until reprobing reduced the rate of nectar intake to the average rate of nectar intake of the optimal diet (Charnov 1976b). F rom this prediction I expected bumblebees to probe a fairly constant proport ion of florets or nectaries on each head or flower visited. However, I observed that bees frequently probed only one or two florets among 5-50 florets available on red clover heads, or only one or two of the five nectaries on dogbane flowers. These observations suggest that remote assessment was not completely accu- rate, since bees frequently departed early from flowers or heads that they had begun to probe. It is probable that remote assessment served as a first estimate of the amount of nectar contained in red clover and dogbane flowers, while the first few florets or nectaries probed served as an updated and more accurate predictor of the nectar content of re- maining florets or nectaries.
F rom this theory follows the testable hypothesis that reliability of remotely perceived floral signals and handling times of flowers should be interrelated in determining the extent to which bees " t ru s t " remote assessments versus ac- tually spending time sampling the nectar content of flowers. When reliability of remote signals is high and handling times are long, bees should reject many flowers and seldom be observed departing from visited flowers without probing all nectar sources. When reliability of remote signals is low and handling times are short, then bees might do best by never rejecting flowers and always sampling each flower encountered. This latter case may be what occurs on fire- weed (E. angustifolium). Probing times of bees on fireweed flowers average about i s per flower. With such short han- dling times it may be optimal for bees to never reject flowers if there is even a small degree of unreliability in remotely perceivable cues about nectar content. On monkshood flow- ers (A. napeIlus), it takes bees an average of 7 s to enter and probe the deeply recessed nectaries. Here there should be much greater impetus for bees to remotely assess nectar content than on fireweed. Monkshood flowers must fully mask any information about nectar content, or bees would quickly learn to use such information to increase their rate of nectar intake, as shown by their behavior in laboratory experiments.
It is curious that natural selection favors remote cues in some plant species, while selecting against them in others. On species such as fireweed and monkshood, where flowers are arranged on vertical inflorescences, bumblebees are well known to start at the bot tommost flowers and work their way upwards (Pyke 1978, Heinrich 1979 b, Waddington and Heinrich 1979, Hodges 1981, Best and Bierzychudek 1982). This pattern of visitation brings bees to the lower female phase flowers first, and the upper male flowers later. Be- cause this pattern o f visitation is thought to maximize out- crossing efficiency, selection may oppose any characteristic that causes bees to skip over flowers and visit only reward- ing ones.
Pollinators in general are well known for avoiding flow- ers which have changed in color, shape, odor, or orientation due to age, and have stopped producing nectar or pollen (reviewed by Gori 1983). Gori speculatively and empirically explores what factors might favor flowers that signal their nectar content to pollinators. Results of the present study, in combination with those of Heinrich (1979b), demon- strate that floral signals are not always irreversibly con- nected with flower age, and that foraging economics play a central role in pollinator responses to floral signals.
The question of when and why selection favors flowers that provide signals about nectar content is extremely com- plex. Remote signals clearly allow bees to increase their net rate of nectar intake, but as a result flowers might re- ceive fewer visits and achieve less pollen transfer. Future work should include surveys of plant communities to see which plants provide signals about nectar content, and what characteristics they have in common. Concurrent manipula- tive experiments could be used to test hypotheses generated from those surveys. In the final analysis, this coevolved system appears unusually accessible in terms of data gather- ing, hypothesis testing, model building, and potential for further advances in understanding.
Acknowledgements. B. Heinrich deserves much credit for his timely advice and contagious thirst for discovery. Field assistance from P. Marden and S. Smith is greatly appreciated. M. Heinrich wrote the computer program that analyzed flight patterns, and G. Hein- rich provided use of his farm and garden. This project was sup- ported by NSF grant DEB-8116662 to B. Heinrich. This paper constitutes part of a M.S. thesis submitted to the University of Vermont.
References
Batschelet E (1981) Circular statistics in biology. Academic Press, New York
Best LS, Bierzychudek P (1982) Pollinator foraging on foxglove (Digitalispupurrea): A test of a new model. Evolution 36:70-79
Brian AD (1967) Differences in the flowers visited by four species of bumblebees and their causes. J Anita Ecol 26:71-98
Brink D (1982) A bonanza-blank pollinator reward schedule in Delphinium nelsonii (Ranunculaceae). Oecologia (Berlin) 52: 29~294
Charnov EL (1976a) Optimal foraging: Attack strategy of a man- tid. Amer Nat 110:141-151
Charnov EL (1976b) Optimal foraging: The marginal value theo- rem. Theor Pop Biol 9:129-136
Free JB (1970) The flower constancy of bumblebees. J Anita Ecol 39 : 395402
Gori DF (1983) Post-pollination phenomena and adaptive floral changes. In: Jones CE, Little RJ (eds) Handbook of Experimen- tal Pollination Biology, Van Nostrand-Reinhold, New York, pp 31-49
Heinrich B (1976) The foraging specializations of individual bum- blebees. Ecol Monographs 46:105 128
Heinrich B (1979a) Bumblebee Economics. Harvard University Press, Cambridge, Mass
Heinrich B (1979b) Resource heterogeneity and patterns of move- ment in foraging bumblebees. Oecologia 40:235-246
Hobbs GA (1962) Further studies on the food-gathering behaviour of bumble bees (Hymenoptera: Apidae). Canad Entomol 94:538-541
Hodges CM (1981) Optimal foraging in bumblebees: Hunting by expectation. Anim Behav 29 : 1166-1171
Inouye DW (1978) Resource partitioning in bumblebees: experi- mental studies of foraging behavior. Ecology 59 : 67~678
Inouye DW (1980) The effect of proboscis and corolla tube lengths on patterns and rates of flower visitation by bumblebees. Oeco- logia (Berlin) 45:197-201
Krebs JR, Houston AI, Charnov EL (1981) Some recent develop- ments in optimal foraging. In: Kamil AC, Sargent TD (eds) Foraging Behavior: Ecological, Ethological, and Psychological Approaches. Garland Press, New York
Levin DA (1973) Assortative pollination for stature in Lythrum salicaria. Evolution 27:144-152
Manning A (1956) Some aspects of the foraging behaviour of bum- blebees. Behaviour 9:164-201
Pleasants JM (1981) Bumblebee response to variation in nectar availability. Ecology 62: 1648-1661
240
Pleasants JM, Chaplin SJ (1983) Nectar production rates of Ascle- pias quadrifolia: causes and consequences of individual varia- tion. Oecologia (Berlin) 59:232-238
Pleasants JM, Zimmerman M (1983) The distribution of standing crop nectar: what does it really tell us? Oecologia (Berlin) 57:412-414
Pyke GH (1978) Optimal foraging: Movement patterns of bumble- bees between inflorescences. Theor Pop Biol 13 : 72-98
Pyke GH (1979) Optimal foraging in bumblebees: Rule of move- ment between flowers within infloresceuces. Anim Behav 27:1167-1181
Pyke GH (1981) Optimal foraging in nectar-feeding animals and coevolution with their plants. In: Kamil AC, Sargent TD (eds) Foraging Behavior: Ecological, Ethological, and Psychological Approaches. Garland Press, New York
Pyke GH, Pulliam HR, Charnov EL (1977) Optimal foraging: A selective review of theory and tests. Quat Rev Biol 52:137-154
Schaal BA (1977) Density dependent foraging on Liatruspycnostra- chya. Evolution 32:452-454
Schaeffer WM, Schaeffer MV (1979) The adaptive significance of
variations in reproductive habit in Agavaceae II: Pollinator foraging behavior and selection for increased reproductive ex- penditure. Ecology 60:1051-1069
Schoener TW (1974) The compression hypothesis and temporal resource partitioning. Proc Nat Acad Sci 71:4169--4172
Waddington KD (1980) Flight patterns of foraging honeybees in relation to artificial flower density and distribution of nectar. Oecologia (Berlin) 44:199-204
Waddington KD, Heinrich B (1979) The foraging movements of bumblebees on vertical inflorescences : an experimental analysis. J Comp Physiol 134:113-117
Waser NM, Price MV (1981) Pollinator choice and stabilizing selec- tion for flower color in Delphinium nelsonii. Evolution 35:376-390
Willson MF, Price PW (1977) The evolution of inflorescence size of Asclepias (Asclepiadaceae). Evolution 31 : 495-511
Zimmerman M (1981) Patchiness in the dispersion of nectar re- sources: probable causes. Oecologia (Berlin) 49 : 154-157
Received March 23, 1984


![Brice Marden : [brochure] a retrospective of paintings and ... · Brice Marden: A Retrospective of Paintings and Drawings is the first overview of Marden s over forty-year career](https://img.pdfslide.us/doc/110x75/5ec0ca76d90d851dde2a00f5/brice-marden-brochure-a-retrospective-of-paintings-and-brice-marden-a-retrospective.jpg)