Embed Size (px)
Citation preview
Research & Forecast Report
4Q 2013Jakarta | Office
Jakarta Property Market Report
Research & Forecast Report
4th Quarter 2014
Accelerating success.
2 Research & Forecast Report | 4Q 2014 | Contents | Colliers International
Contents
Office Sector 3
Apartment Sector 13
Expatriate Housing Sector 23
Retail Sector 23
Industrial Estate Sector 32
3 Research & Forecast Report | 4Q 2014 | Office | Colliers International
Office SectorThe slowing economy and the election has brought occupancy rates down modestly by 1% YoY to 95.4%. In response to the sluggish market, several premium and grade A office buildings lowered their overly optimistic asking base rents by 10 to 20%. This restrained the growth of average base rents in the CBD. Nevertheless, the asking base rents for US dollar denominated buildings grew by 6.9% YoY to USD36.84.
Apartment SectorOnly 51% or 10,701 units of the previously projected supply for the whole 2014 of 20,899 units came onto the market in 2014. As a result, the remaining 49% (or 10,188 units) will be completed this year for a total potential supply in 2015 of 38,562 units representing 25% of the total existing supply. Take-up rates of projects under development dropped moderately this year to 72.1%.
Retail SectorThere are a limited number of new retail properties completed in 2014 in DKI Jakarta bringing cumulative supply to 4.44 million sq m for a 3.2% increase YoY. The YoY occupancy was down modestly and was recorded at 86.3% at end of 2014 because the physical occupancy in contrast with the leased spaces of newly operating shopping center was still relatively low. Given this situation, the asking base rent only grew by 7.3% YoY to IDR510,562/sq m/month.
Industrial Estate SectorAlthough the downturn in the economy and political uncertainty characterized 2014, total industrial land sales during the year reached 421 ha which was almost equal to total sales in 2013. Another surprising fact is that land prices continued to increase, albeit moderately, by 9.8% YoY, mainly driven by adjustments occurring in several estates located in Bekasi, Serang and Tangerang.
Highlight
Colliers International
is a leader in global real estate services, defined by our spirit of enterprise. Through a culture of service excellence and collaboration, we integrate the resources of real estate specialists worldwide to accelerate the success of our partners. We represent property investors, developers and occupiers in local and global markets. Our expertise spans all property sectors–office, industrial, retail, residential, rural & agribusiness, healthcare & retirement living, hotels & leisure.
By Ferry SalantoAssociate Director | [email protected]
4
OFFICE SECTORLeased Office
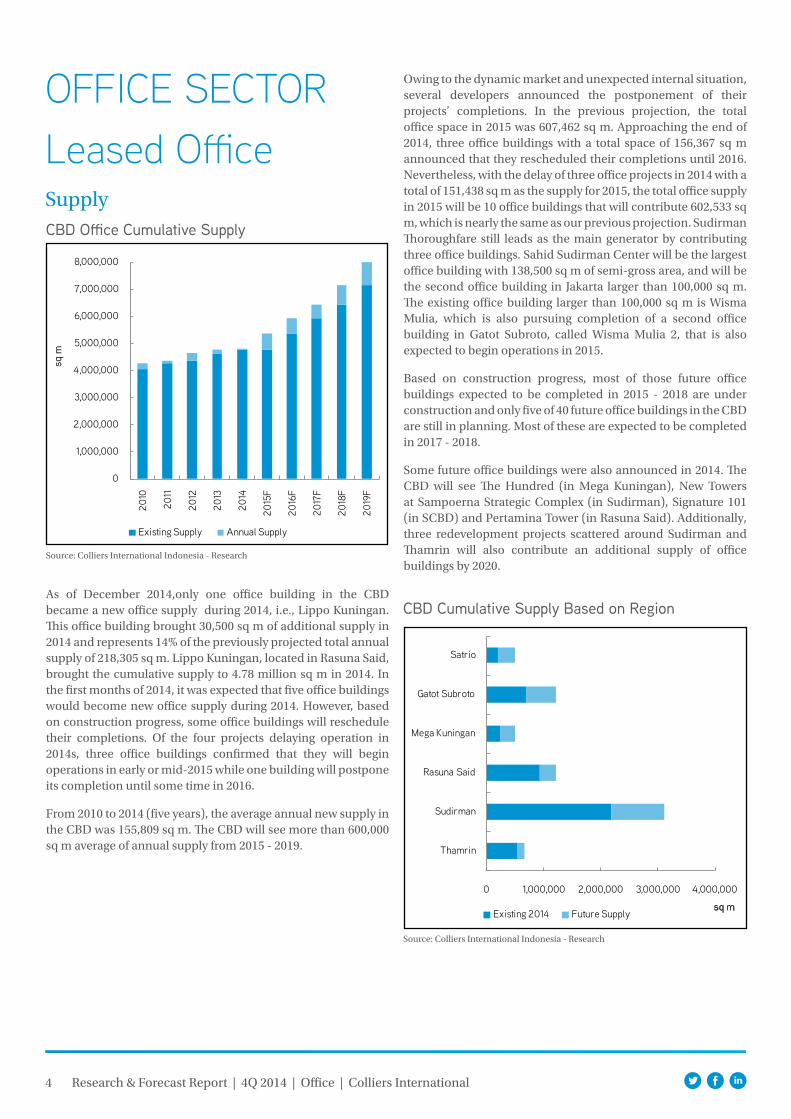
CBD Office Cumulative Supply
Source: Colliers International Indonesia - Research
Supply
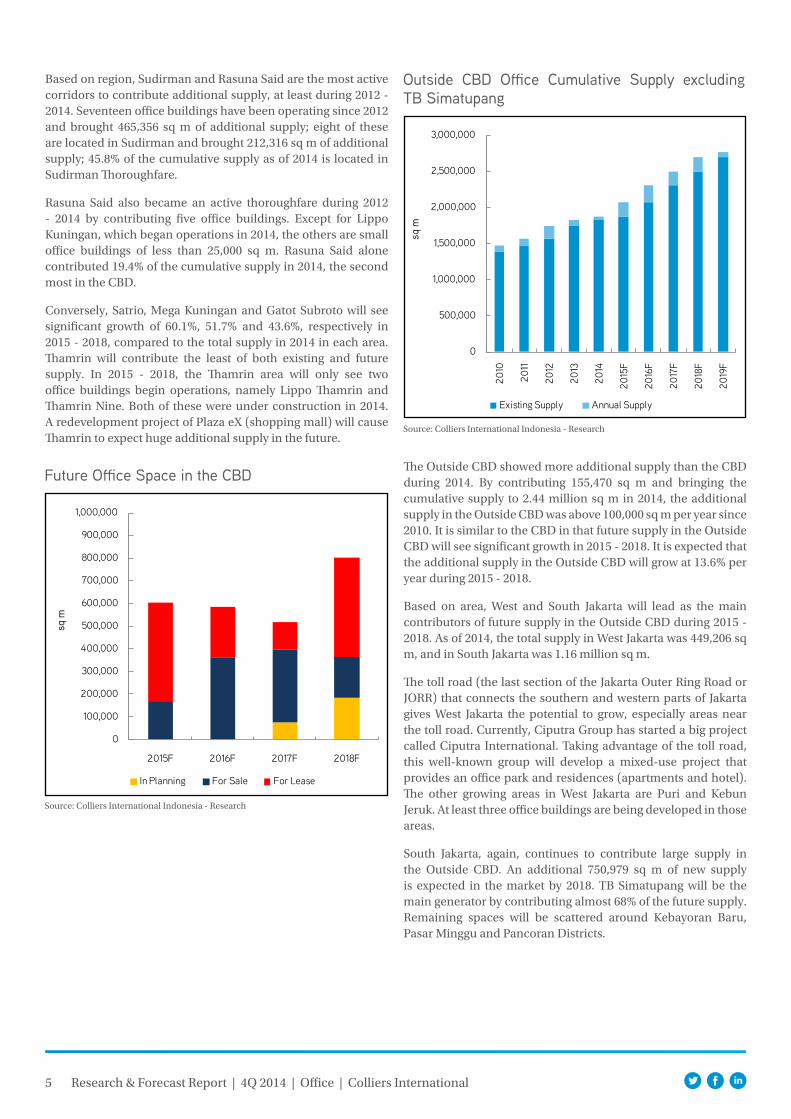
As of December 2014,only one office building in the CBD became a new office supply during 2014, i.e., Lippo Kuningan. This office building brought 30,500 sq m of additional supply in 2014 and represents 14% of the previously projected total annual supply of 218,305 sq m. Lippo Kuningan, located in Rasuna Said, brought the cumulative supply to 4.78 million sq m in 2014. In the first months of 2014, it was expected that five office buildings would become new office supply during 2014. However, based on construction progress, some office buildings will reschedule their completions. Of the four projects delaying operation in 2014s, three office buildings confirmed that they will begin operations in early or mid-2015 while one building will postpone its completion until some time in 2016.
From 2010 to 2014 (five years), the average annual new supply in the CBD was 155,809 sq m. The CBD will see more than 600,000 sq m average of annual supply from 2015 - 2019.
0
1,000,000
2,000,000
3,000,000
4,000,000
5,000,000
6,000,000
7,000,000
8,000,000
2010
2011
2012
2013
2014
2015
F
2016
F
2017
F
2018
F
2019
F
sq m
Existing Supply Annual Supply
CBD Cumulative Supply Based on Region
Source: Colliers International Indonesia - Research
Owing to the dynamic market and unexpected internal situation, several developers announced the postponement of their projects’ completions. In the previous projection, the total office space in 2015 was 607,462 sq m. Approaching the end of 2014, three office buildings with a total space of 156,367 sq m announced that they rescheduled their completions until 2016. Nevertheless, with the delay of three office projects in 2014 with a total of 151,438 sq m as the supply for 2015, the total office supply in 2015 will be 10 office buildings that will contribute 602,533 sq m, which is nearly the same as our previous projection. Sudirman Thoroughfare still leads as the main generator by contributing three office buildings. Sahid Sudirman Center will be the largest office building with 138,500 sq m of semi-gross area, and will be the second office building in Jakarta larger than 100,000 sq m. The existing office building larger than 100,000 sq m is Wisma Mulia, which is also pursuing completion of a second office building in Gatot Subroto, called Wisma Mulia 2, that is also expected to begin operations in 2015.
Based on construction progress, most of those future office buildings expected to be completed in 2015 - 2018 are under construction and only five of 40 future office buildings in the CBD are still in planning. Most of these are expected to be completed in 2017 - 2018.
Some future office buildings were also announced in 2014. The CBD will see The Hundred (in Mega Kuningan), New Towers at Sampoerna Strategic Complex (in Sudirman), Signature 101 (in SCBD) and Pertamina Tower (in Rasuna Said). Additionally, three redevelopment projects scattered around Sudirman and Thamrin will also contribute an additional supply of office buildings by 2020.
0 1,000,000 2,000,000 3,000,000 4,000,000
Thamrin
Sudirman
Rasuna Said
Mega Kuningan
Gatot Subroto
Satrio
sq mExisting 2014 Future Supply
Research & Forecast Report | 4Q 2014 | Office | Colliers International
5
Based on region, Sudirman and Rasuna Said are the most active corridors to contribute additional supply, at least during 2012 - 2014. Seventeen office buildings have been operating since 2012 and brought 465,356 sq m of additional supply; eight of these are located in Sudirman and brought 212,316 sq m of additional supply; 45.8% of the cumulative supply as of 2014 is located in Sudirman Thoroughfare.
Rasuna Said also became an active thoroughfare during 2012 - 2014 by contributing five office buildings. Except for Lippo Kuningan, which began operations in 2014, the others are small office buildings of less than 25,000 sq m. Rasuna Said alone contributed 19.4% of the cumulative supply in 2014, the second most in the CBD.
Conversely, Satrio, Mega Kuningan and Gatot Subroto will see significant growth of 60.1%, 51.7% and 43.6%, respectively in 2015 - 2018, compared to the total supply in 2014 in each area. Thamrin will contribute the least of both existing and future supply. In 2015 - 2018, the Thamrin area will only see two office buildings begin operations, namely Lippo Thamrin and Thamrin Nine. Both of these were under construction in 2014. A redevelopment project of Plaza eX (shopping mall) will cause Thamrin to expect huge additional supply in the future.
Future Office Space in the CBD
Source: Colliers International Indonesia - Research
0
100,000
200,000
300,000
400,000
500,000
600,000
700,000
800,000
900,000
1,000,000
2015F 2016F 2017F 2018F
sq m
In Planning For Sale For Lease
Outside CBD Office Cumulative Supply excluding TB Simatupang
Source: Colliers International Indonesia - Research
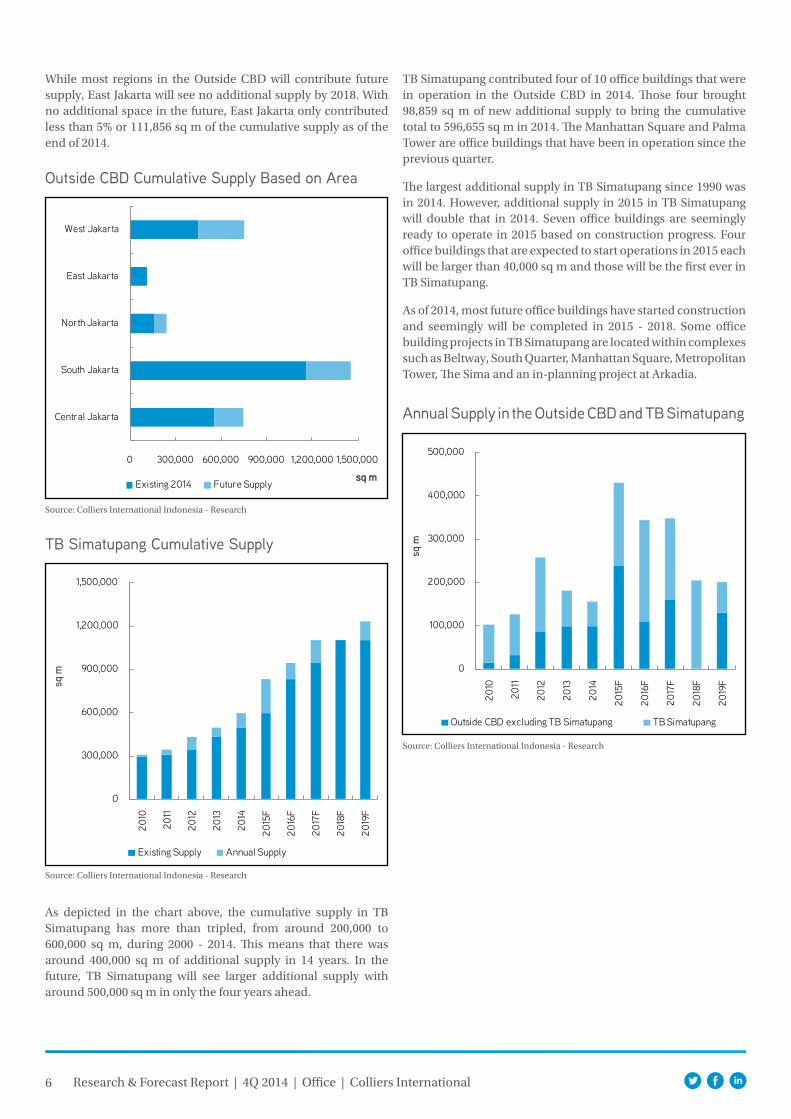
The Outside CBD showed more additional supply than the CBD during 2014. By contributing 155,470 sq m and bringing the cumulative supply to 2.44 million sq m in 2014, the additional supply in the Outside CBD was above 100,000 sq m per year since 2010. It is similar to the CBD in that future supply in the Outside CBD will see significant growth in 2015 - 2018. It is expected that the additional supply in the Outside CBD will grow at 13.6% per year during 2015 - 2018.
Based on area, West and South Jakarta will lead as the main contributors of future supply in the Outside CBD during 2015 - 2018. As of 2014, the total supply in West Jakarta was 449,206 sq m, and in South Jakarta was 1.16 million sq m.
The toll road (the last section of the Jakarta Outer Ring Road or JORR) that connects the southern and western parts of Jakarta gives West Jakarta the potential to grow, especially areas near the toll road. Currently, Ciputra Group has started a big project called Ciputra International. Taking advantage of the toll road, this well-known group will develop a mixed-use project that provides an office park and residences (apartments and hotel). The other growing areas in West Jakarta are Puri and Kebun Jeruk. At least three office buildings are being developed in those areas.
South Jakarta, again, continues to contribute large supply in the Outside CBD. An additional 750,979 sq m of new supply is expected in the market by 2018. TB Simatupang will be the main generator by contributing almost 68% of the future supply. Remaining spaces will be scattered around Kebayoran Baru, Pasar Minggu and Pancoran Districts.
0
500,000
1,000,000
1,500,000
2,000,000
2,500,000
3,000,000
2010
2011
2012
2013
2014
2015
F
2016
F
2017
F
2018
F
2019
F
sq m
Existing Supply Annual Supply
Research & Forecast Report | 4Q 2014 | Office | Colliers International
6
Outside CBD Cumulative Supply Based on Area
Source: Colliers International Indonesia - Research
0 300,000 600,000 900,000 1,200,000 1,500,000
Central Jakarta
South Jakarta
North Jakarta
East Jakarta
West Jakarta
sq mExisting 2014 Future Supply
TB Simatupang Cumulative Supply
Source: Colliers International Indonesia - Research
0
300,000
600,000
900,000
1,200,000
1,500,000
2010
2011
2012
2013
2014
2015
F
2016
F
2017
F
2018
F
2019
F
sq m
Existing Supply Annual Supply
As depicted in the chart above, the cumulative supply in TB Simatupang has more than tripled, from around 200,000 to 600,000 sq m, during 2000 - 2014. This means that there was around 400,000 sq m of additional supply in 14 years. In the future, TB Simatupang will see larger additional supply with around 500,000 sq m in only the four years ahead.
While most regions in the Outside CBD will contribute future supply, East Jakarta will see no additional supply by 2018. With no additional space in the future, East Jakarta only contributed less than 5% or 111,856 sq m of the cumulative supply as of the end of 2014.
TB Simatupang contributed four of 10 office buildings that were in operation in the Outside CBD in 2014. Those four brought 98,859 sq m of new additional supply to bring the cumulative total to 596,655 sq m in 2014. The Manhattan Square and Palma Tower are office buildings that have been in operation since the previous quarter.
The largest additional supply in TB Simatupang since 1990 was in 2014. However, additional supply in 2015 in TB Simatupang will double that in 2014. Seven office buildings are seemingly ready to operate in 2015 based on construction progress. Four office buildings that are expected to start operations in 2015 each will be larger than 40,000 sq m and those will be the first ever in TB Simatupang.
As of 2014, most future office buildings have started construction and seemingly will be completed in 2015 - 2018. Some office building projects in TB Simatupang are located within complexes such as Beltway, South Quarter, Manhattan Square, Metropolitan Tower, The Sima and an in-planning project at Arkadia.
Annual Supply in the Outside CBD and TB Simatupang
Source: Colliers International Indonesia - Research
0
100,000
200,000
300,000
400,000
500,000
2010
2011
2012
2013
2014
2015
F
2016
F
2017
F
2018
F
2019
F
sq m
Outside CBD excluding TB Simatupang TB Simatupang
Research & Forecast Report | 4Q 2014 | Office | Colliers International
7 Research & Forecast Report | 4Q 2014 | Office | Colliers International
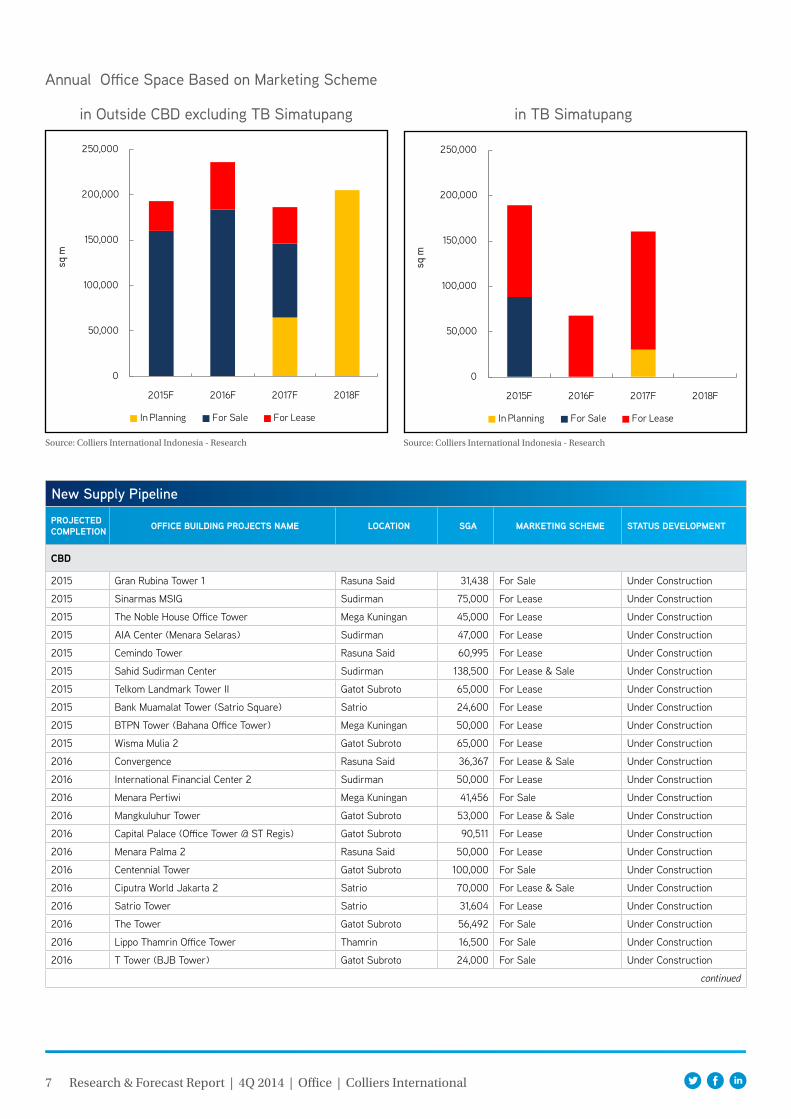
Annual Office Space Based on Marketing Scheme
in Outside CBD excluding TB Simatupang in TB Simatupang
Source: Colliers International Indonesia - Research Source: Colliers International Indonesia - Research
0
50,000
100,000
150,000
200,000
250,000
2015F 2016F 2017F 2018F
sq m
In Planning For Sale For Lease
0
50,000
100,000
150,000
200,000
250,000
2015F 2016F 2017F 2018F
sq m
In Planning For Sale For Lease
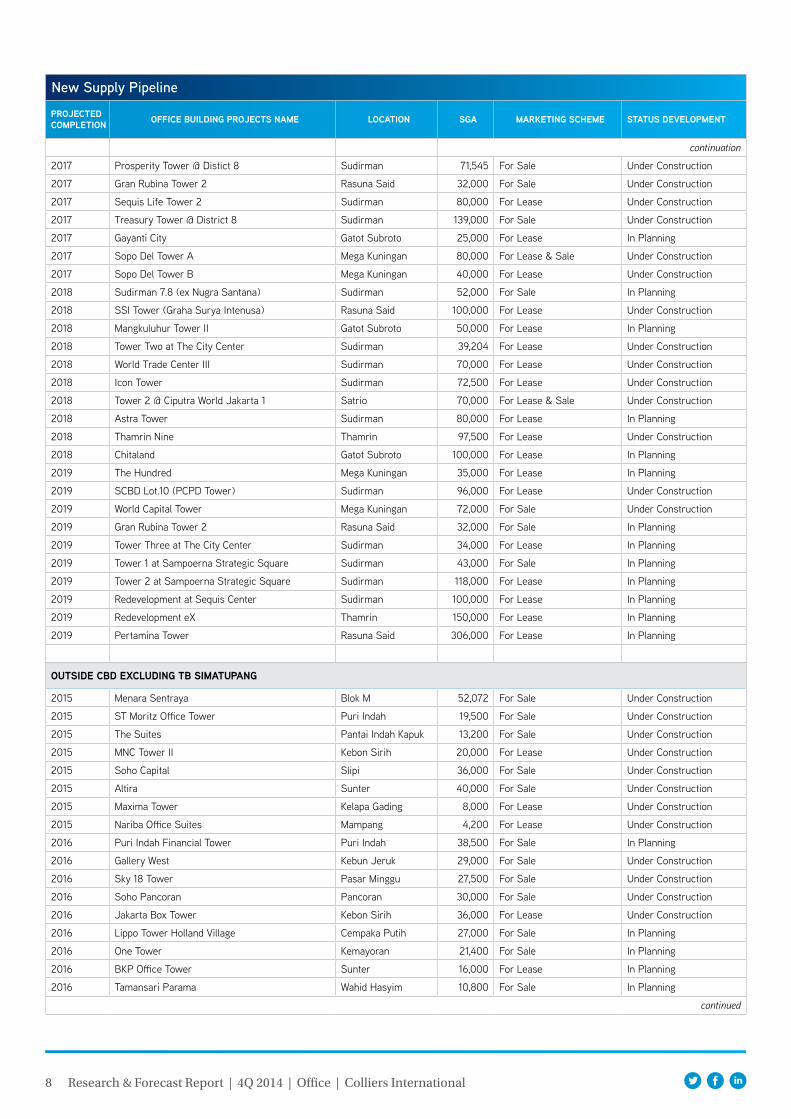
New Supply Pipeline
projected completion oFFice Building projectS name location Sga marketing Scheme StatuS development
cBd
2015 Gran Rubina Tower 1 Rasuna Said 31,438 For Sale Under Construction
2015 Sinarmas MSIG Sudirman 75,000 For Lease Under Construction
2015 The Noble House Office Tower Mega Kuningan 45,000 For Lease Under Construction
2015 AIA Center (Menara Selaras) Sudirman 47,000 For Lease Under Construction
2015 Cemindo Tower Rasuna Said 60,995 For Lease Under Construction
2015 Sahid Sudirman Center Sudirman 138,500 For Lease & Sale Under Construction
2015 Telkom Landmark Tower II Gatot Subroto 65,000 For Lease Under Construction
2015 Bank Muamalat Tower (Satrio Square) Satrio 24,600 For Lease Under Construction
2015 BTPN Tower (Bahana Office Tower) Mega Kuningan 50,000 For Lease Under Construction
2015 Wisma Mulia 2 Gatot Subroto 65,000 For Lease Under Construction
2016 Convergence Rasuna Said 36,367 For Lease & Sale Under Construction
2016 International Financial Center 2 Sudirman 50,000 For Lease Under Construction
2016 Menara Pertiwi Mega Kuningan 41,456 For Sale Under Construction
2016 Mangkuluhur Tower Gatot Subroto 53,000 For Lease & Sale Under Construction
2016 Capital Palace (Office Tower @ ST Regis) Gatot Subroto 90,511 For Lease Under Construction
2016 Menara Palma 2 Rasuna Said 50,000 For Lease Under Construction
2016 Centennial Tower Gatot Subroto 100,000 For Sale Under Construction
2016 Ciputra World Jakarta 2 Satrio 70,000 For Lease & Sale Under Construction
2016 Satrio Tower Satrio 31,604 For Lease Under Construction
2016 The Tower Gatot Subroto 56,492 For Sale Under Construction
2016 Lippo Thamrin Office Tower Thamrin 16,500 For Sale Under Construction
2016 T Tower (BJB Tower) Gatot Subroto 24,000 For Sale Under Construction
continued
8 Research & Forecast Report | 4Q 2014 | Office | Colliers International
New Supply Pipeline
projected completion oFFice Building projectS name location Sga marketing Scheme StatuS development
continuation
2017 Prosperity Tower @ Distict 8 Sudirman 71,545 For Sale Under Construction
2017 Gran Rubina Tower 2 Rasuna Said 32,000 For Sale Under Construction
2017 Sequis Life Tower 2 Sudirman 80,000 For Lease Under Construction
2017 Treasury Tower @ District 8 Sudirman 139,000 For Sale Under Construction
2017 Gayanti City Gatot Subroto 25,000 For Lease In Planning
2017 Sopo Del Tower A Mega Kuningan 80,000 For Lease & Sale Under Construction
2017 Sopo Del Tower B Mega Kuningan 40,000 For Lease Under Construction
2018 Sudirman 7.8 (ex Nugra Santana) Sudirman 52,000 For Sale In Planning
2018 SSI Tower (Graha Surya Intenusa) Rasuna Said 100,000 For Lease Under Construction
2018 Mangkuluhur Tower II Gatot Subroto 50,000 For Lease In Planning
2018 Tower Two at The City Center Sudirman 39,204 For Lease Under Construction
2018 World Trade Center III Sudirman 70,000 For Lease Under Construction
2018 Icon Tower Sudirman 72,500 For Lease Under Construction
2018 Tower 2 @ Ciputra World Jakarta 1 Satrio 70,000 For Lease & Sale Under Construction
2018 Astra Tower Sudirman 80,000 For Lease In Planning
2018 Thamrin Nine Thamrin 97,500 For Lease Under Construction
2018 Chitaland Gatot Subroto 100,000 For Lease In Planning
2019 The Hundred Mega Kuningan 35,000 For Lease In Planning
2019 SCBD Lot.10 (PCPD Tower) Sudirman 96,000 For Lease Under Construction
2019 World Capital Tower Mega Kuningan 72,000 For Sale Under Construction
2019 Gran Rubina Tower 2 Rasuna Said 32,000 For Sale In Planning
2019 Tower Three at The City Center Sudirman 34,000 For Lease In Planning
2019 Tower 1 at Sampoerna Strategic Square Sudirman 43,000 For Sale In Planning
2019 Tower 2 at Sampoerna Strategic Square Sudirman 118,000 For Lease In Planning
2019 Redevelopment at Sequis Center Sudirman 100,000 For Lease In Planning
2019 Redevelopment eX Thamrin 150,000 For Lease In Planning
2019 Pertamina Tower Rasuna Said 306,000 For Lease In Planning
outSide cBd eXcluding tB Simatupang
2015 Menara Sentraya Blok M 52,072 For Sale Under Construction
2015 ST Moritz Office Tower Puri Indah 19,500 For Sale Under Construction
2015 The Suites Pantai Indah Kapuk 13,200 For Sale Under Construction
2015 MNC Tower II Kebon Sirih 20,000 For Lease Under Construction
2015 Soho Capital Slipi 36,000 For Sale Under Construction
2015 Altira Sunter 40,000 For Sale Under Construction
2015 Maxima Tower Kelapa Gading 8,000 For Lease Under Construction
2015 Nariba Office Suites Mampang 4,200 For Lease Under Construction
2016 Puri Indah Financial Tower Puri Indah 38,500 For Sale In Planning
2016 Gallery West Kebun Jeruk 29,000 For Sale Under Construction
2016 Sky 18 Tower Pasar Minggu 27,500 For Sale Under Construction
2016 Soho Pancoran Pancoran 30,000 For Sale Under Construction
2016 Jakarta Box Tower Kebon Sirih 36,000 For Lease Under Construction
2016 Lippo Tower Holland Village Cempaka Putih 27,000 For Sale In Planning
2016 One Tower Kemayoran 21,400 For Sale In Planning
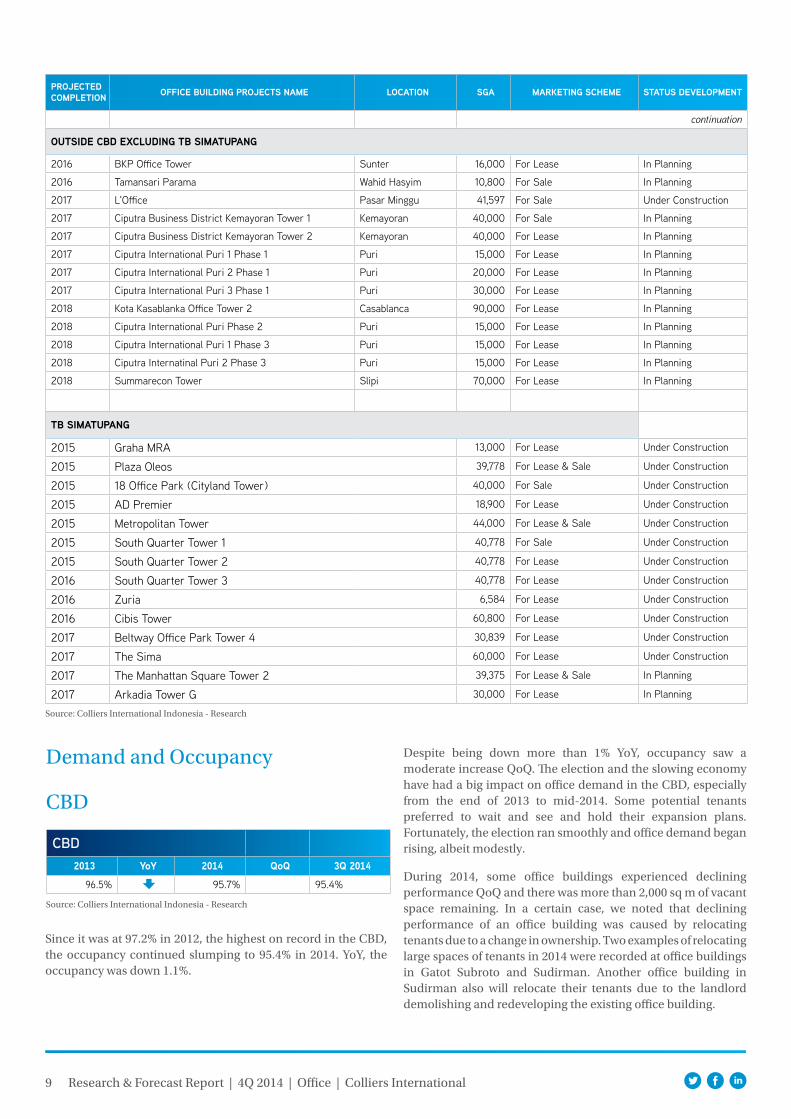
2016 BKP Office Tower Sunter 16,000 For Lease In Planning
2016 Tamansari Parama Wahid Hasyim 10,800 For Sale In Planning
continued
9 Research & Forecast Report | 4Q 2014 | Office | Colliers International
Source: Colliers International Indonesia - Research
Source: Colliers International Indonesia - Research
CBD2013 YoY 2014 QoQ 3Q 2014
96.5% 95.7% 95.4%
Demand and Occupancy Despite being down more than 1% YoY, occupancy saw a moderate increase QoQ. The election and the slowing economy have had a big impact on office demand in the CBD, especially from the end of 2013 to mid-2014. Some potential tenants preferred to wait and see and hold their expansion plans. Fortunately, the election ran smoothly and office demand began rising, albeit modestly.
During 2014, some office buildings experienced declining performance QoQ and there was more than 2,000 sq m of vacant space remaining. In a certain case, we noted that declining performance of an office building was caused by relocating tenants due to a change in ownership. Two examples of relocating large spaces of tenants in 2014 were recorded at office buildings in Gatot Subroto and Sudirman. Another office building in Sudirman also will relocate their tenants due to the landlord demolishing and redeveloping the existing office building.
CBD
Since it was at 97.2% in 2012, the highest on record in the CBD, the occupancy continued slumping to 95.4% in 2014. YoY, the occupancy was down 1.1%.
projected completion oFFice Building projectS name location Sga marketing Scheme StatuS development
continuation
outSide cBd eXcluding tB Simatupang
2016 BKP Office Tower Sunter 16,000 For Lease In Planning
2016 Tamansari Parama Wahid Hasyim 10,800 For Sale In Planning
2017 L'Office Pasar Minggu 41,597 For Sale Under Construction
2017 Ciputra Business District Kemayoran Tower 1 Kemayoran 40,000 For Sale In Planning
2017 Ciputra Business District Kemayoran Tower 2 Kemayoran 40,000 For Lease In Planning
2017 Ciputra International Puri 1 Phase 1 Puri 15,000 For Lease In Planning
2017 Ciputra International Puri 2 Phase 1 Puri 20,000 For Lease In Planning
2017 Ciputra International Puri 3 Phase 1 Puri 30,000 For Lease In Planning
2018 Kota Kasablanka Office Tower 2 Casablanca 90,000 For Lease In Planning
2018 Ciputra International Puri Phase 2 Puri 15,000 For Lease In Planning
2018 Ciputra International Puri 1 Phase 3 Puri 15,000 For Lease In Planning
2018 Ciputra Internatinal Puri 2 Phase 3 Puri 15,000 For Lease In Planning
2018 Summarecon Tower Slipi 70,000 For Lease In Planning
tB Simatupang
2015 Graha MRA 13,000 For Lease Under Construction
2015 Plaza Oleos 39,778 For Lease & Sale Under Construction
2015 18 Office Park (Cityland Tower) 40,000 For Sale Under Construction
2015 AD Premier 18,900 For Lease Under Construction
2015 Metropolitan Tower 44,000 For Lease & Sale Under Construction
2015 South Quarter Tower 1 40,778 For Sale Under Construction
2015 South Quarter Tower 2 40,778 For Lease Under Construction
2016 South Quarter Tower 3 40,778 For Lease Under Construction
2016 Zuria 6,584 For Lease Under Construction
2016 Cibis Tower 60,800 For Lease Under Construction
2017 Beltway Office Park Tower 4 30,839 For Lease Under Construction
2017 The Sima 60,000 For Lease Under Construction
2017 The Manhattan Square Tower 2 39,375 For Lease & Sale In Planning
2017 Arkadia Tower G 30,000 For Lease In Planning
10 Research & Forecast Report | 4Q 2014 | Office | Colliers International
0%
10%
20%
30%
40%
50%
60%
70%
80%
90%
100%
0
500,000
1,000,000
1,500,000
2,000,000
2,500,000
3,000,000
3,500,000
4,000,000
4,500,000
5,000,000
2010 2011 2012 2013 2014
sq m
Space Absorbed Vacant Space Occupancy
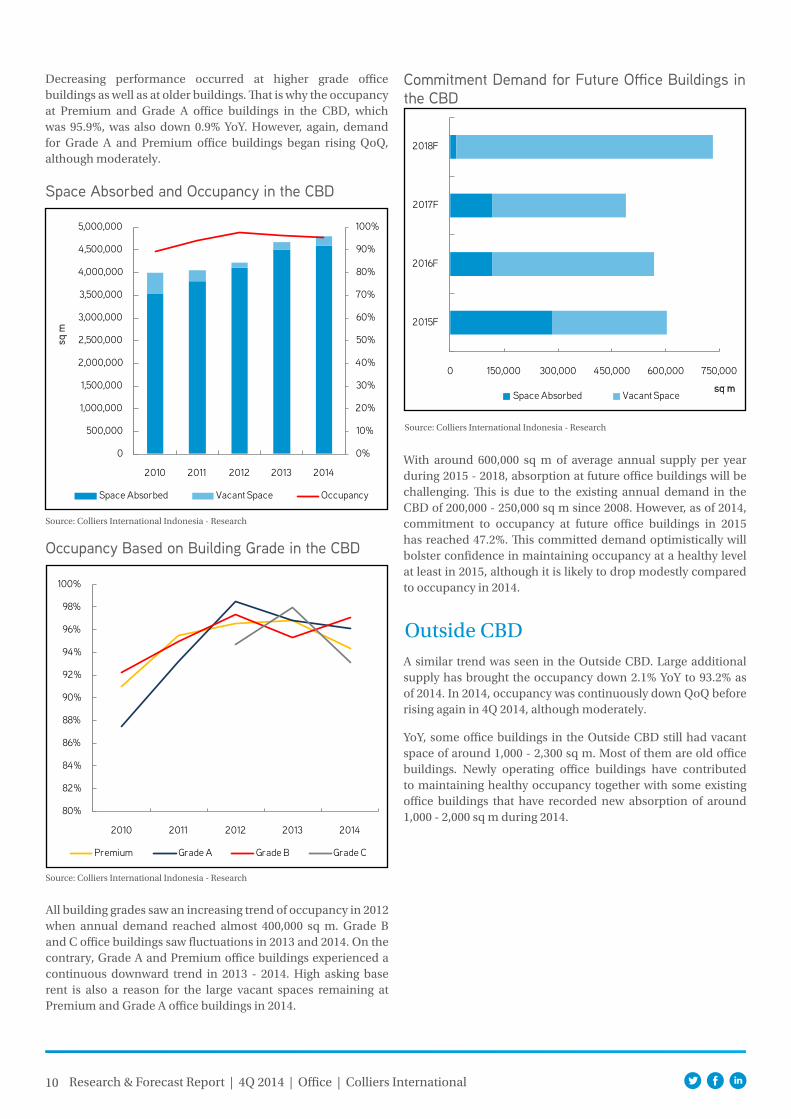
Decreasing performance occurred at higher grade office buildings as well as at older buildings. That is why the occupancy at Premium and Grade A office buildings in the CBD, which was 95.9%, was also down 0.9% YoY. However, again, demand for Grade A and Premium office buildings began rising QoQ, although moderately.
Space Absorbed and Occupancy in the CBD
Source: Colliers International Indonesia - Research
Occupancy Based on Building Grade in the CBD
Source: Colliers International Indonesia - Research
80%
82%
84%
86%
88%
90%
92%
94%
96%
98%
100%
2010 2011 2012 2013 2014
Premium Grade A Grade B Grade C
All building grades saw an increasing trend of occupancy in 2012 when annual demand reached almost 400,000 sq m. Grade B and C office buildings saw fluctuations in 2013 and 2014. On the contrary, Grade A and Premium office buildings experienced a continuous downward trend in 2013 - 2014. High asking base rent is also a reason for the large vacant spaces remaining at Premium and Grade A office buildings in 2014.
Commitment Demand for Future Office Buildings in the CBD
Source: Colliers International Indonesia - Research
With around 600,000 sq m of average annual supply per year during 2015 - 2018, absorption at future office buildings will be challenging. This is due to the existing annual demand in the CBD of 200,000 - 250,000 sq m since 2008. However, as of 2014, commitment to occupancy at future office buildings in 2015 has reached 47.2%. This committed demand optimistically will bolster confidence in maintaining occupancy at a healthy level at least in 2015, although it is likely to drop modestly compared to occupancy in 2014.
Outside CBDA similar trend was seen in the Outside CBD. Large additional supply has brought the occupancy down 2.1% YoY to 93.2% as of 2014. In 2014, occupancy was continuously down QoQ before rising again in 4Q 2014, although moderately.
YoY, some office buildings in the Outside CBD still had vacant space of around 1,000 - 2,300 sq m. Most of them are old office buildings. Newly operating office buildings have contributed to maintaining healthy occupancy together with some existing office buildings that have recorded new absorption of around 1,000 - 2,000 sq m during 2014.
0 150,000 300,000 450,000 600,000 750,000
2015F
2016F
2017F
2018F
sq mSpace Absorbed Vacant Space
11 Research & Forecast Report | 4Q 2014 | Office | Colliers International
0 50,000 100,000 150,000 200,000 250,000
2015F
2016F
2017F
2018F
sq mSpace Absorbed Vacant Space
0%
10%
20%
30%
40%
50%
60%
70%
80%
90%
100%
0
100,000
200,000
300,000
400,000
500,000
600,000
700,000
2010 2011 2012 2013 2014
sq m
Space Absorbed Vacant Space Occupancy
Occupancy Based on Area in the Outside CBD
Source: Colliers International Indonesia - Research
80%
82%
84%
86%
88%
90%
92%
94%
96%
98%
100%
2010 2011 2012 2013 2014
Central Jakarta South Jakarta North Jakarta
East Jakarta West Jakarta
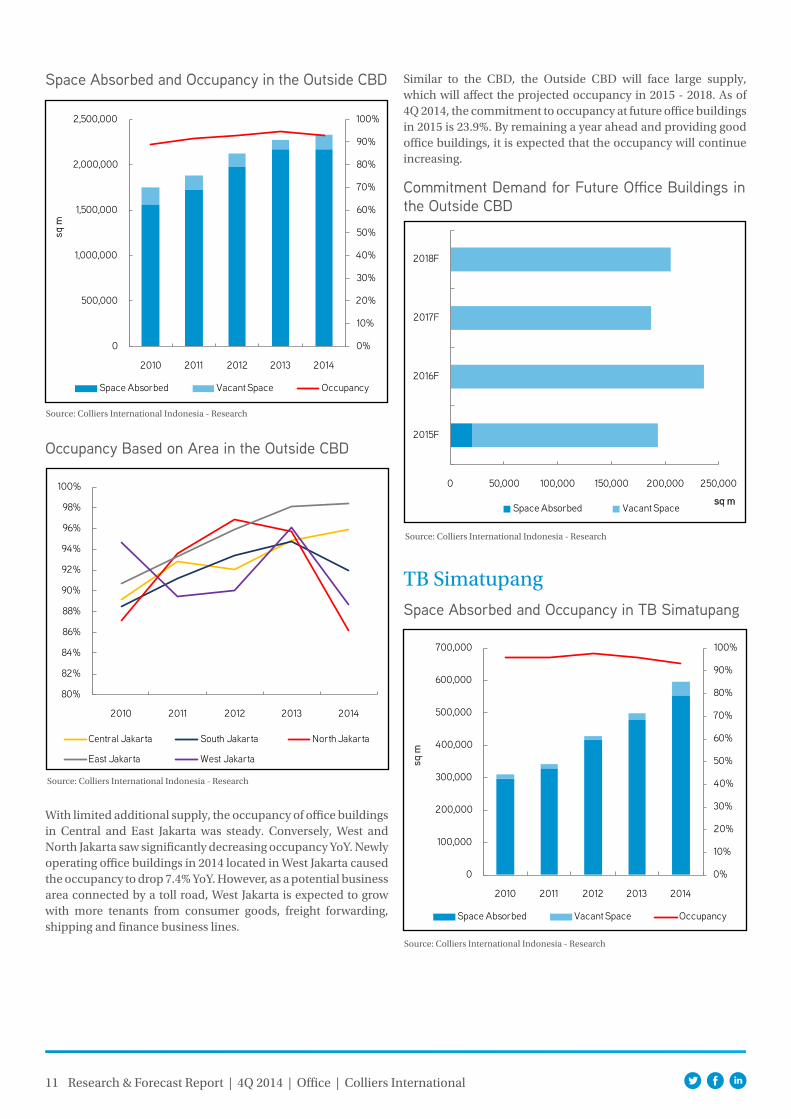
With limited additional supply, the occupancy of office buildings in Central and East Jakarta was steady. Conversely, West and North Jakarta saw significantly decreasing occupancy YoY. Newly operating office buildings in 2014 located in West Jakarta caused the occupancy to drop 7.4% YoY. However, as a potential business area connected by a toll road, West Jakarta is expected to grow with more tenants from consumer goods, freight forwarding, shipping and finance business lines.
Commitment Demand for Future Office Buildings in the Outside CBD
Source: Colliers International Indonesia - Research
TB SimatupangSpace Absorbed and Occupancy in TB Simatupang
Source: Colliers International Indonesia - Research
0%
10%
20%
30%
40%
50%
60%
70%
80%
90%
100%
0
500,000
1,000,000
1,500,000
2,000,000
2,500,000
2010 2011 2012 2013 2014
sq m
Space Absorbed Vacant Space Occupancy
Space Absorbed and Occupancy in the Outside CBD
Source: Colliers International Indonesia - Research
Similar to the CBD, the Outside CBD will face large supply, which will affect the projected occupancy in 2015 - 2018. As of 4Q 2014, the commitment to occupancy at future office buildings in 2015 is 23.9%. By remaining a year ahead and providing good office buildings, it is expected that the occupancy will continue increasing.
12 Research & Forecast Report | 4Q 2014 | Office | Colliers International
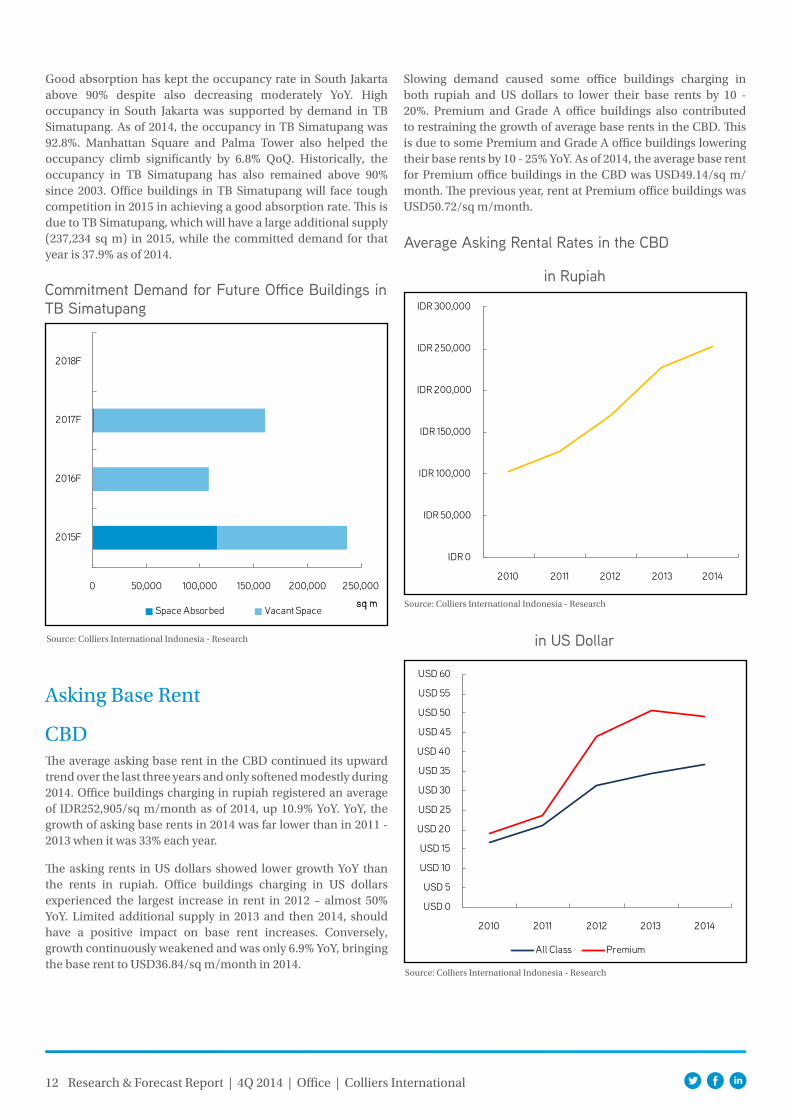
Good absorption has kept the occupancy rate in South Jakarta above 90% despite also decreasing moderately YoY. High occupancy in South Jakarta was supported by demand in TB Simatupang. As of 2014, the occupancy in TB Simatupang was 92.8%. Manhattan Square and Palma Tower also helped the occupancy climb significantly by 6.8% QoQ. Historically, the occupancy in TB Simatupang has also remained above 90% since 2003. Office buildings in TB Simatupang will face tough competition in 2015 in achieving a good absorption rate. This is due to TB Simatupang, which will have a large additional supply (237,234 sq m) in 2015, while the committed demand for that year is 37.9% as of 2014.
Commitment Demand for Future Office Buildings in TB Simatupang
Source: Colliers International Indonesia - Research
Asking Base Rent
CBDThe average asking base rent in the CBD continued its upward trend over the last three years and only softened modestly during 2014. Office buildings charging in rupiah registered an average of IDR252,905/sq m/month as of 2014, up 10.9% YoY. YoY, the growth of asking base rents in 2014 was far lower than in 2011 - 2013 when it was 33% each year.
The asking rents in US dollars showed lower growth YoY than the rents in rupiah. Office buildings charging in US dollars experienced the largest increase in rent in 2012 – almost 50% YoY. Limited additional supply in 2013 and then 2014, should have a positive impact on base rent increases. Conversely, growth continuously weakened and was only 6.9% YoY, bringing the base rent to USD36.84/sq m/month in 2014.
Slowing demand caused some office buildings charging in both rupiah and US dollars to lower their base rents by 10 - 20%. Premium and Grade A office buildings also contributed to restraining the growth of average base rents in the CBD. This is due to some Premium and Grade A office buildings lowering their base rents by 10 - 25% YoY. As of 2014, the average base rent for Premium office buildings in the CBD was USD49.14/sq m/month. The previous year, rent at Premium office buildings was USD50.72/sq m/month.
Average Asking Rental Rates in the CBD
in Rupiah
IDR 0
IDR 50,000
IDR 100,000
IDR 150,000
IDR 200,000
IDR 250,000
IDR 300,000
2010 2011 2012 2013 2014
in US Dollar
Source: Colliers International Indonesia - Research
USD 0
USD 5
USD 10
USD 15
USD 20
USD 25
USD 30
USD 35
USD 40
USD 45
USD 50
USD 55
USD 60
2010 2011 2012 2013 2014
All Class Premium
Source: Colliers International Indonesia - Research
0 50,000 100,000 150,000 200,000 250,000
2015F
2016F
2017F
2018F
sq mSpace Absorbed Vacant Space
13 Research & Forecast Report | 4Q 2014 | Office | Colliers International
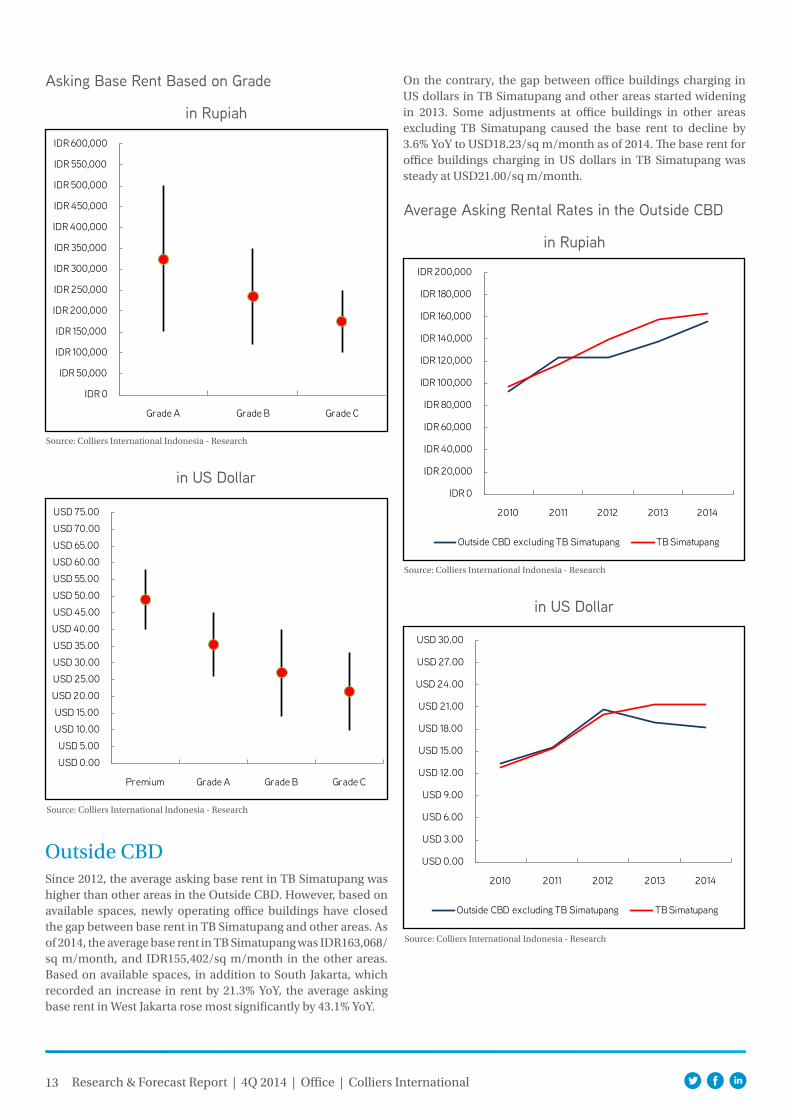
Asking Base Rent Based on Grade
in Rupiah
in US Dollar
Source: Colliers International Indonesia - Research
Source: Colliers International Indonesia - Research
IDR 0
IDR 50,000
IDR 100,000
IDR 150,000
IDR 200,000
IDR 250,000
IDR 300,000
IDR 350,000
IDR 400,000
IDR 450,000
IDR 500,000
IDR 550,000
IDR 600,000
Grade A Grade B Grade C
USD 0.00
USD 5.00
USD 10.00
USD 15.00
USD 20.00
USD 25.00
USD 30.00
USD 35.00
USD 40.00
USD 45.00
USD 50.00
USD 55.00
USD 60.00
USD 65.00
USD 70.00
USD 75.00
Premium Grade A Grade B Grade C
Outside CBDSince 2012, the average asking base rent in TB Simatupang was higher than other areas in the Outside CBD. However, based on available spaces, newly operating office buildings have closed the gap between base rent in TB Simatupang and other areas. As of 2014, the average base rent in TB Simatupang was IDR163,068/sq m/month, and IDR155,402/sq m/month in the other areas. Based on available spaces, in addition to South Jakarta, which recorded an increase in rent by 21.3% YoY, the average asking base rent in West Jakarta rose most significantly by 43.1% YoY.
On the contrary, the gap between office buildings charging in US dollars in TB Simatupang and other areas started widening in 2013. Some adjustments at office buildings in other areas excluding TB Simatupang caused the base rent to decline by 3.6% YoY to USD18.23/sq m/month as of 2014. The base rent for office buildings charging in US dollars in TB Simatupang was steady at USD21.00/sq m/month.
Average Asking Rental Rates in the Outside CBD
in Rupiah
in US Dollar
Source: Colliers International Indonesia - Research
Source: Colliers International Indonesia - Research
IDR 0
IDR 20,000
IDR 40,000
IDR 60,000
IDR 80,000
IDR 100,000
IDR 120,000
IDR 140,000
IDR 160,000
IDR 180,000
IDR 200,000
2010 2011 2012 2013 2014
Outside CBD excluding TB Simatupang TB Simatupang
USD 0.00
USD 3.00
USD 6.00
USD 9.00
USD 12.00
USD 15.00
USD 18.00
USD 21.00
USD 24.00
USD 27.00
USD 30.00
2010 2011 2012 2013 2014
Outside CBD excluding TB Simatupang TB Simatupang
14 Research & Forecast Report | 4Q 2014 | Office | Colliers International
0 100,000 200,000 300,000 400,000
2015F
2016F
2017F
sq m
Space Absorbed Vacant Space
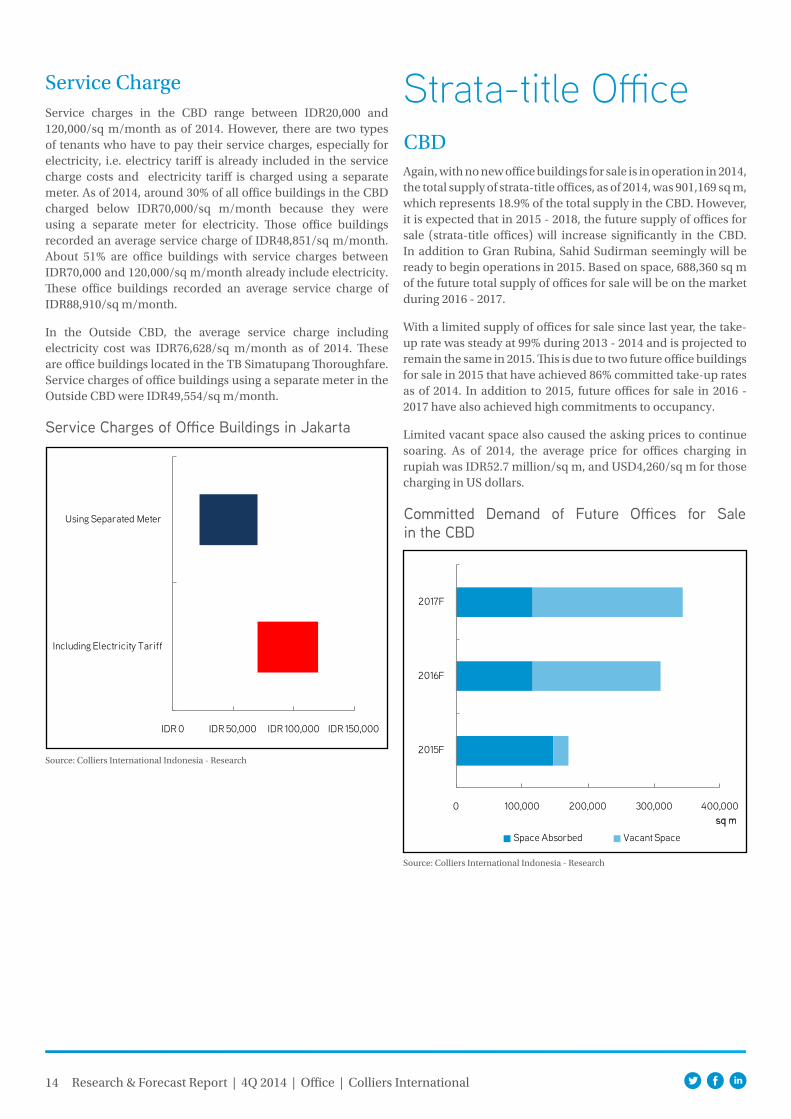
Service Charge
Service Charges of Office Buildings in Jakarta
Source: Colliers International Indonesia - Research
Service charges in the CBD range between IDR20,000 and 120,000/sq m/month as of 2014. However, there are two types of tenants who have to pay their service charges, especially for electricity, i.e. electricy tariff is already included in the service charge costs and electricity tariff is charged using a separate meter. As of 2014, around 30% of all office buildings in the CBD charged below IDR70,000/sq m/month because they were using a separate meter for electricity. Those office buildings recorded an average service charge of IDR48,851/sq m/month. About 51% are office buildings with service charges between IDR70,000 and 120,000/sq m/month already include electricity. These office buildings recorded an average service charge of IDR88,910/sq m/month.
In the Outside CBD, the average service charge including electricity cost was IDR76,628/sq m/month as of 2014. These are office buildings located in the TB Simatupang Thoroughfare. Service charges of office buildings using a separate meter in the Outside CBD were IDR49,554/sq m/month.
IDR 0 IDR 50,000 IDR 100,000 IDR 150,000
Including Electricity Tariff
Using Separated Meter
Strata-title Office
Committed Demand of Future Offices for Sale in the CBD
Source: Colliers International Indonesia - Research
Again, with no new office buildings for sale is in operation in 2014, the total supply of strata-title offices, as of 2014, was 901,169 sq m, which represents 18.9% of the total supply in the CBD. However, it is expected that in 2015 - 2018, the future supply of offices for sale (strata-title offices) will increase significantly in the CBD. In addition to Gran Rubina, Sahid Sudirman seemingly will be ready to begin operations in 2015. Based on space, 688,360 sq m of the future total supply of offices for sale will be on the market during 2016 - 2017.
With a limited supply of offices for sale since last year, the take-up rate was steady at 99% during 2013 - 2014 and is projected to remain the same in 2015. This is due to two future office buildings for sale in 2015 that have achieved 86% committed take-up rates as of 2014. In addition to 2015, future offices for sale in 2016 - 2017 have also achieved high commitments to occupancy.
Limited vacant space also caused the asking prices to continue soaring. As of 2014, the average price for offices charging in rupiah was IDR52.7 million/sq m, and USD4,260/sq m for those charging in US dollars.
CBD
15 Research & Forecast Report | 4Q 2014 | Office | Colliers International
0 50,000 100,000 150,000 200,000250,000300,000350,000
2015F
2016F
2017F
sq m
Space Absorbed Vacant Space
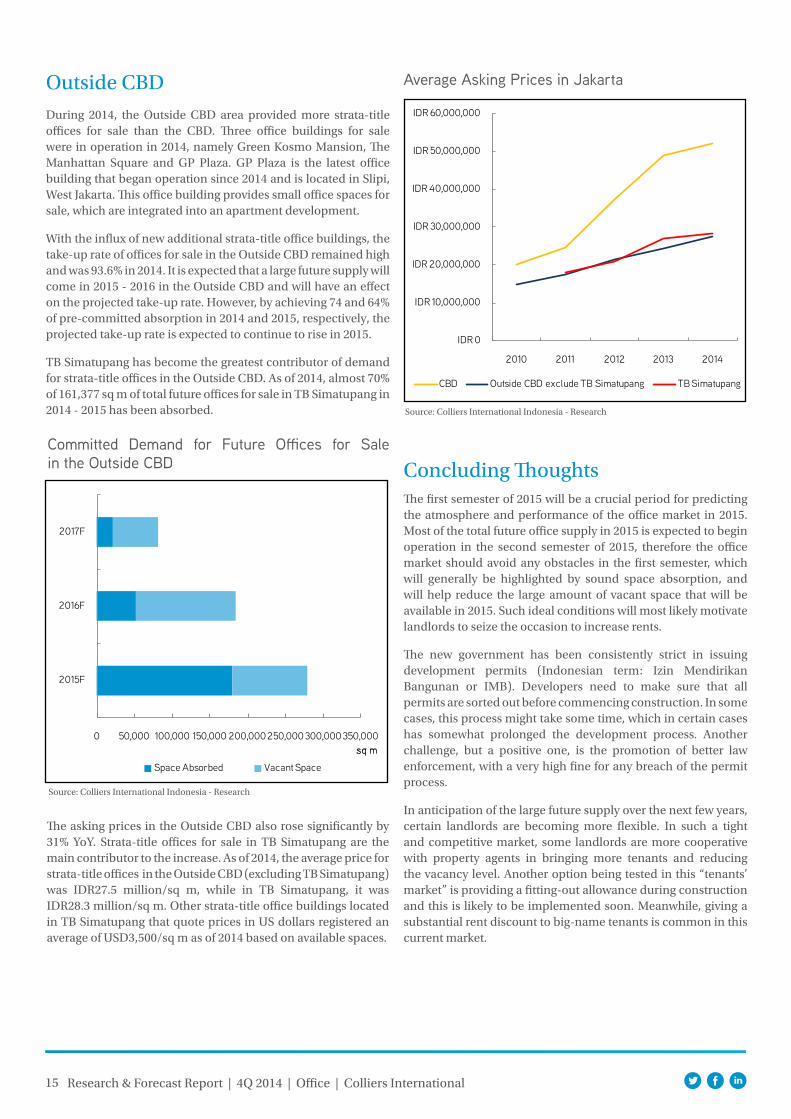
During 2014, the Outside CBD area provided more strata-title offices for sale than the CBD. Three office buildings for sale were in operation in 2014, namely Green Kosmo Mansion, The Manhattan Square and GP Plaza. GP Plaza is the latest office building that began operation since 2014 and is located in Slipi, West Jakarta. This office building provides small office spaces for sale, which are integrated into an apartment development.
With the influx of new additional strata-title office buildings, the take-up rate of offices for sale in the Outside CBD remained high and was 93.6% in 2014. It is expected that a large future supply will come in 2015 - 2016 in the Outside CBD and will have an effect on the projected take-up rate. However, by achieving 74 and 64% of pre-committed absorption in 2014 and 2015, respectively, the projected take-up rate is expected to continue to rise in 2015.
TB Simatupang has become the greatest contributor of demand for strata-title offices in the Outside CBD. As of 2014, almost 70% of 161,377 sq m of total future offices for sale in TB Simatupang in 2014 - 2015 has been absorbed.
Committed Demand for Future Offices for Sale in the Outside CBD
Source: Colliers International Indonesia - Research
Outside CBD
The asking prices in the Outside CBD also rose significantly by 31% YoY. Strata-title offices for sale in TB Simatupang are the main contributor to the increase. As of 2014, the average price for strata-title offices in the Outside CBD (excluding TB Simatupang) was IDR27.5 million/sq m, while in TB Simatupang, it was IDR28.3 million/sq m. Other strata-title office buildings located in TB Simatupang that quote prices in US dollars registered an average of USD3,500/sq m as of 2014 based on available spaces.
Average Asking Prices in Jakarta
Source: Colliers International Indonesia - Research
IDR 0
IDR 10,000,000
IDR 20,000,000
IDR 30,000,000
IDR 40,000,000
IDR 50,000,000
IDR 60,000,000
2010 2011 2012 2013 2014
CBD Outside CBD exclude TB Simatupang TB Simatupang
Concluding ThoughtsThe first semester of 2015 will be a crucial period for predicting the atmosphere and performance of the office market in 2015. Most of the total future office supply in 2015 is expected to begin operation in the second semester of 2015, therefore the office market should avoid any obstacles in the first semester, which will generally be highlighted by sound space absorption, and will help reduce the large amount of vacant space that will be available in 2015. Such ideal conditions will most likely motivate landlords to seize the occasion to increase rents.
The new government has been consistently strict in issuing development permits (Indonesian term: Izin Mendirikan Bangunan or IMB). Developers need to make sure that all permits are sorted out before commencing construction. In some cases, this process might take some time, which in certain cases has somewhat prolonged the development process. Another challenge, but a positive one, is the promotion of better law enforcement, with a very high fine for any breach of the permit process.
In anticipation of the large future supply over the next few years, certain landlords are becoming more flexible. In such a tight and competitive market, some landlords are more cooperative with property agents in bringing more tenants and reducing the vacancy level. Another option being tested in this “tenants’ market” is providing a fitting-out allowance during construction and this is likely to be implemented soon. Meanwhile, giving a substantial rent discount to big-name tenants is common in this current market.
16 Research & Forecast Report | 4Q 2014 | Apartment | Colliers International
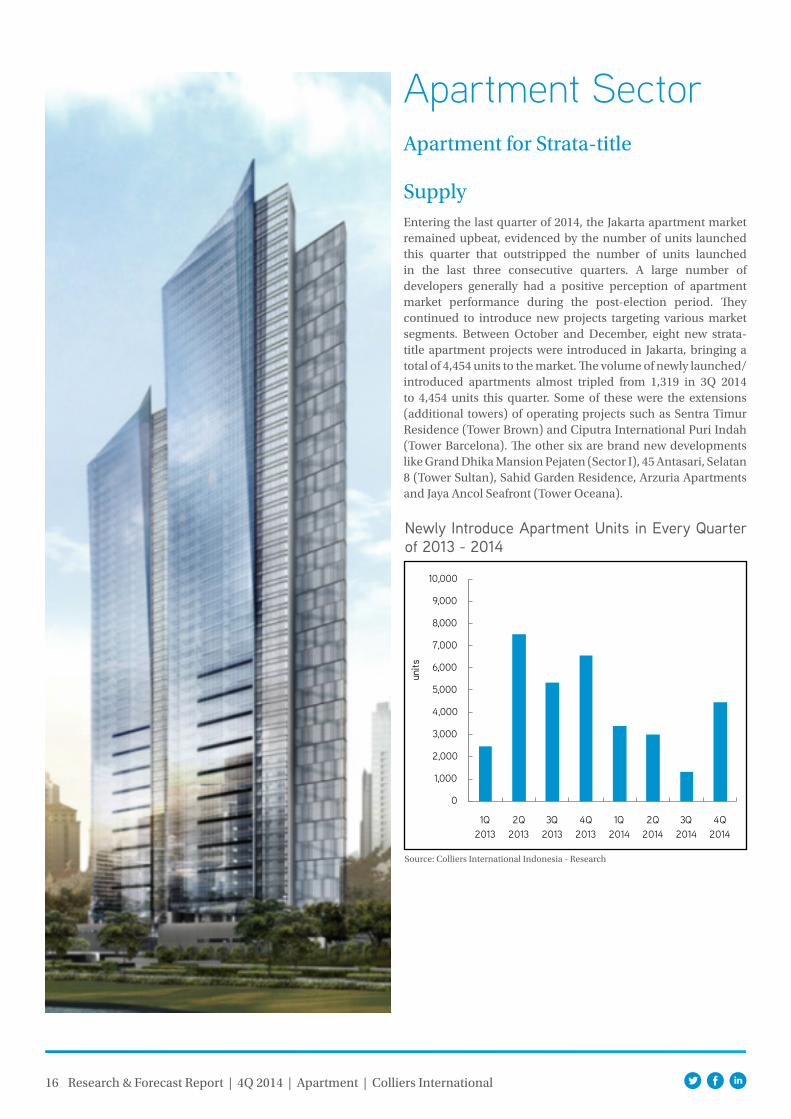
Apartment SectorApartment for Strata-title
SupplyEntering the last quarter of 2014, the Jakarta apartment market remained upbeat, evidenced by the number of units launched this quarter that outstripped the number of units launched in the last three consecutive quarters. A large number of developers generally had a positive perception of apartment market performance during the post-election period. They continued to introduce new projects targeting various market segments. Between October and December, eight new strata-title apartment projects were introduced in Jakarta, bringing a total of 4,454 units to the market. The volume of newly launched/introduced apartments almost tripled from 1,319 in 3Q 2014 to 4,454 units this quarter. Some of these were the extensions (additional towers) of operating projects such as Sentra Timur Residence (Tower Brown) and Ciputra International Puri Indah (Tower Barcelona). The other six are brand new developments like Grand Dhika Mansion Pejaten (Sector I), 45 Antasari, Selatan 8 (Tower Sultan), Sahid Garden Residence, Arzuria Apartments and Jaya Ancol Seafront (Tower Oceana).
0
1,000
2,000
3,000
4,000
5,000
6,000
7,000
8,000
9,000
10,000
1Q 2013
2Q 2013
3Q 2013
4Q 2013
1Q 2014
2Q 2014
3Q 2014
4Q 2014
units
Source: Colliers International Indonesia - Research
Newly Introduce Apartment Units in Every Quarter of 2013 - 2014
17 Research & Forecast Report | 4Q 2014 | Apartment | Colliers International
Source: Colliers International Indonesia - Research
Newly Introduces Projecs During 4Q 2014
development Yop location region aSking price (idr/SQ m) developer no. oF unitS
Grand Dhika Mansion Pejaten (Sector 1) 2015 Jl. Siaga Raya South Jakarta 27 million PT. Adhi Persada Property 44
Selatan 8 (Tower Sultan) 2017 Kebayoran Lama South Jakarta 17 million Karya Cipta Group 336
Sentra Timur Residence (Tower Brown) 2017 Pulo Gebang East Jakarta 11 million Bakrieland Development 605
45 Antasari (2 towers) 2018 Antasari South Jakarta 38 million Cowwel Development 1,924
Sahid Garden Residence 2018 Ciracas East Jakarta 15 million Sahid Group 476
Arzuria Apartments 2018 Jl. Tendean South Jakarta 27 million Tolaram Group 210
Jaya Ancol Seafront - Oceana Tower 2018 Ancol North Jakarta 17 million Jaya Ancol 524
Ciputra International Puri Indah (Tower Barcelona)
2018 Puri Indah West Jakarta 27 million Ciputra 335
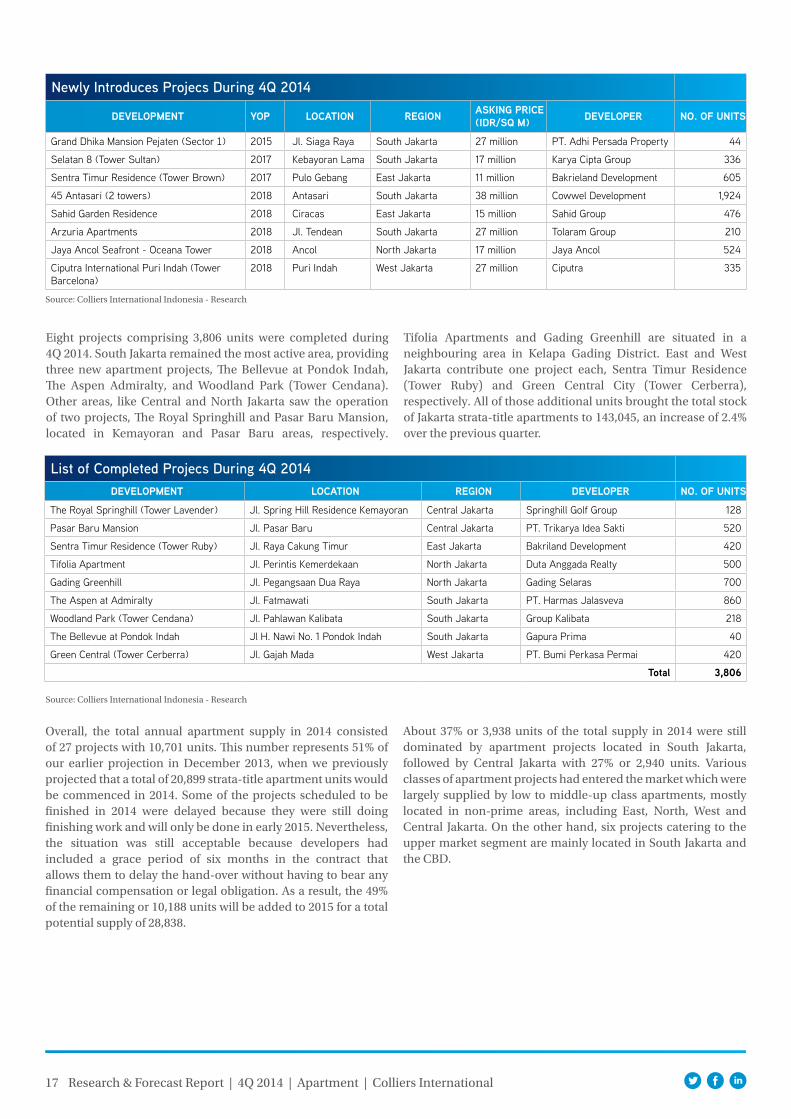
Eight projects comprising 3,806 units were completed during 4Q 2014. South Jakarta remained the most active area, providing three new apartment projects, The Bellevue at Pondok Indah, The Aspen Admiralty, and Woodland Park (Tower Cendana). Other areas, like Central and North Jakarta saw the operation of two projects, The Royal Springhill and Pasar Baru Mansion, located in Kemayoran and Pasar Baru areas, respectively.
Tifolia Apartments and Gading Greenhill are situated in a neighbouring area in Kelapa Gading District. East and West Jakarta contribute one project each, Sentra Timur Residence (Tower Ruby) and Green Central City (Tower Cerberra), respectively. All of those additional units brought the total stock of Jakarta strata-title apartments to 143,045, an increase of 2.4% over the previous quarter.
Overall, the total annual apartment supply in 2014 consisted of 27 projects with 10,701 units. This number represents 51% of our earlier projection in December 2013, when we previously projected that a total of 20,899 strata-title apartment units would be commenced in 2014. Some of the projects scheduled to be finished in 2014 were delayed because they were still doing finishing work and will only be done in early 2015. Nevertheless, the situation was still acceptable because developers had included a grace period of six months in the contract that allows them to delay the hand-over without having to bear any financial compensation or legal obligation. As a result, the 49% of the remaining or 10,188 units will be added to 2015 for a total potential supply of 28,838.
About 37% or 3,938 units of the total supply in 2014 were still dominated by apartment projects located in South Jakarta, followed by Central Jakarta with 27% or 2,940 units. Various classes of apartment projects had entered the market which were largely supplied by low to middle-up class apartments, mostly located in non-prime areas, including East, North, West and Central Jakarta. On the other hand, six projects catering to the upper market segment are mainly located in South Jakarta and the CBD.
Source: Colliers International Indonesia - Research
List of Completed Projecs During 4Q 2014development location region developer no. oF unitS
The Royal Springhill (Tower Lavender) Jl. Spring Hill Residence Kemayoran Central Jakarta Springhill Golf Group 128
Pasar Baru Mansion Jl. Pasar Baru Central Jakarta PT. Trikarya Idea Sakti 520
Sentra Timur Residence (Tower Ruby) Jl. Raya Cakung Timur East Jakarta Bakriland Development 420
Tifolia Apartment Jl. Perintis Kemerdekaan North Jakarta Duta Anggada Realty 500
Gading Greenhill Jl. Pegangsaan Dua Raya North Jakarta Gading Selaras 700
The Aspen at Admiralty Jl. Fatmawati South Jakarta PT. Harmas Jalasveva 860
Woodland Park (Tower Cendana) Jl. Pahlawan Kalibata South Jakarta Group Kalibata 218
The Bellevue at Pondok Indah Jl H. Nawi No. 1 Pondok Indah South Jakarta Gapura Prima 40
Green Central (Tower Cerberra) Jl. Gajah Mada West Jakarta PT. Bumi Perkasa Permai 420
total 3,806
18
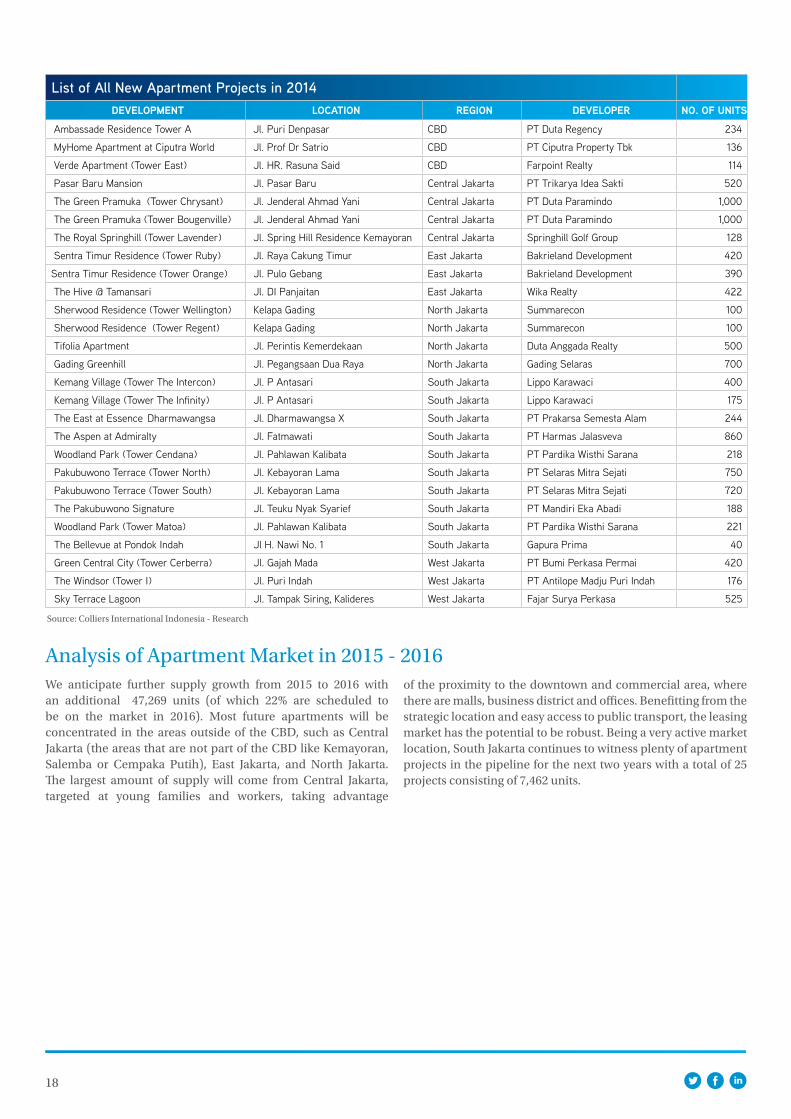
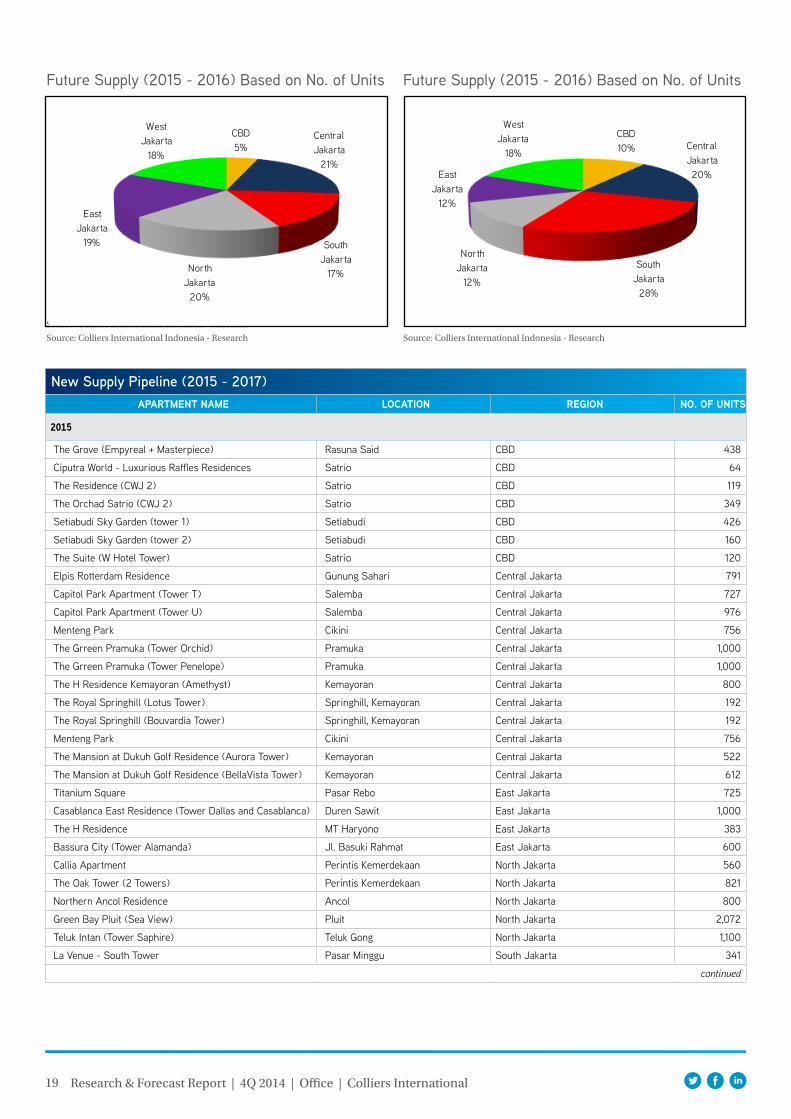
Analysis of Apartment Market in 2015 - 2016We anticipate further supply growth from 2015 to 2016 with an additional 47,269 units (of which 22% are scheduled to be on the market in 2016). Most future apartments will be concentrated in the areas outside of the CBD, such as Central Jakarta (the areas that are not part of the CBD like Kemayoran, Salemba or Cempaka Putih), East Jakarta, and North Jakarta. The largest amount of supply will come from Central Jakarta, targeted at young families and workers, taking advantage
of the proximity to the downtown and commercial area, where there are malls, business district and offices. Benefitting from the strategic location and easy access to public transport, the leasing market has the potential to be robust. Being a very active market location, South Jakarta continues to witness plenty of apartment projects in the pipeline for the next two years with a total of 25 projects consisting of 7,462 units.
Source: Colliers International Indonesia - Research
List of All New Apartment Projects in 2014development location region developer no. oF unitS
Ambassade Residence Tower A Jl. Puri Denpasar CBD PT Duta Regency 234
MyHome Apartment at Ciputra World Jl. Prof Dr Satrio CBD PT Ciputra Property Tbk 136
Verde Apartment (Tower East) Jl. HR. Rasuna Said CBD Farpoint Realty 114
Pasar Baru Mansion Jl. Pasar Baru Central Jakarta PT Trikarya Idea Sakti 520
The Green Pramuka (Tower Chrysant) Jl. Jenderal Ahmad Yani Central Jakarta PT Duta Paramindo 1,000
The Green Pramuka (Tower Bougenville) Jl. Jenderal Ahmad Yani Central Jakarta PT Duta Paramindo 1,000
The Royal Springhill (Tower Lavender) Jl. Spring Hill Residence Kemayoran Central Jakarta Springhill Golf Group 128
Sentra Timur Residence (Tower Ruby) Jl. Raya Cakung Timur East Jakarta Bakrieland Development 420
Sentra Timur Residence (Tower Orange) Jl. Pulo Gebang East Jakarta Bakrieland Development 390
The Hive @ Tamansari Jl. DI Panjaitan East Jakarta Wika Realty 422
Sherwood Residence (Tower Wellington) Kelapa Gading North Jakarta Summarecon 100
Sherwood Residence (Tower Regent) Kelapa Gading North Jakarta Summarecon 100
Tifolia Apartment Jl. Perintis Kemerdekaan North Jakarta Duta Anggada Realty 500
Gading Greenhill Jl. Pegangsaan Dua Raya North Jakarta Gading Selaras 700
Kemang Village (Tower The Intercon) Jl. P Antasari South Jakarta Lippo Karawaci 400
Kemang Village (Tower The Infinity) Jl. P Antasari South Jakarta Lippo Karawaci 175
The East at Essence Dharmawangsa Jl. Dharmawangsa X South Jakarta PT Prakarsa Semesta Alam 244
The Aspen at Admiralty Jl. Fatmawati South Jakarta PT Harmas Jalasveva 860
Woodland Park (Tower Cendana) Jl. Pahlawan Kalibata South Jakarta PT Pardika Wisthi Sarana 218
Pakubuwono Terrace (Tower North) Jl. Kebayoran Lama South Jakarta PT Selaras Mitra Sejati 750
Pakubuwono Terrace (Tower South) Jl. Kebayoran Lama South Jakarta PT Selaras Mitra Sejati 720
The Pakubuwono Signature Jl. Teuku Nyak Syarief South Jakarta PT Mandiri Eka Abadi 188
Woodland Park (Tower Matoa) Jl. Pahlawan Kalibata South Jakarta PT Pardika Wisthi Sarana 221
The Bellevue at Pondok Indah Jl H. Nawi No. 1 South Jakarta Gapura Prima 40
Green Central City (Tower Cerberra) Jl. Gajah Mada West Jakarta PT Bumi Perkasa Permai 420
The Windsor (Tower I) Jl. Puri Indah West Jakarta PT Antilope Madju Puri Indah 176
Sky Terrace Lagoon Jl. Tampak Siring, Kalideres West Jakarta Fajar Surya Perkasa 525
19
New Supply Pipeline (2015 - 2017)apartment name location region no. oF unitS
2015
The Grove (Empyreal + Masterpiece) Rasuna Said CBD 438
Ciputra World - Luxurious Raffles Residences Satrio CBD 64
The Residence (CWJ 2) Satrio CBD 119
The Orchad Satrio (CWJ 2) Satrio CBD 349
Setiabudi Sky Garden (tower 1) Setiabudi CBD 426
Setiabudi Sky Garden (tower 2) Setiabudi CBD 160
The Suite (W Hotel Tower) Satrio CBD 120
Elpis Rotterdam Residence Gunung Sahari Central Jakarta 791
Capitol Park Apartment (Tower T) Salemba Central Jakarta 727
Capitol Park Apartment (Tower U) Salemba Central Jakarta 976
Menteng Park Cikini Central Jakarta 756
The Grreen Pramuka (Tower Orchid) Pramuka Central Jakarta 1,000
The Grreen Pramuka (Tower Penelope) Pramuka Central Jakarta 1,000
The H Residence Kemayoran (Amethyst) Kemayoran Central Jakarta 800
The Royal Springhill (Lotus Tower) Springhill, Kemayoran Central Jakarta 192
The Royal Springhill (Bouvardia Tower) Springhill, Kemayoran Central Jakarta 192
Menteng Park Cikini Central Jakarta 756
The Mansion at Dukuh Golf Residence (Aurora Tower) Kemayoran Central Jakarta 522
The Mansion at Dukuh Golf Residence (BellaVista Tower) Kemayoran Central Jakarta 612
Titanium Square Pasar Rebo East Jakarta 725
Casablanca East Residence (Tower Dallas and Casablanca) Duren Sawit East Jakarta 1,000
The H Residence MT Haryono East Jakarta 383
Bassura City (Tower Alamanda) Jl. Basuki Rahmat East Jakarta 600
Callia Apartment Perintis Kemerdekaan North Jakarta 560
The Oak Tower (2 Towers) Perintis Kemerdekaan North Jakarta 821
Northern Ancol Residence Ancol North Jakarta 800
Green Bay Pluit (Sea View) Pluit North Jakarta 2,072
Teluk Intan (Tower Saphire) Teluk Gong North Jakarta 1,100
La Venue - South Tower Pasar Minggu South Jakarta 341
continued
Research & Forecast Report | 4Q 2014 | Office | Colliers International
Source: Colliers International Indonesia - Research
Future Supply (2015 - 2016) Based on No. of Units
CBD5%
Central Jakarta
21%
South Jakarta
17%North Jakarta
20%
East Jakarta
19%
West Jakarta
18%
Future Supply (2015 - 2016) Based on No. of Units
CBD10% Central
Jakarta20%
South Jakarta
28%
North Jakarta
12%
East Jakarta
12%
West Jakarta
18%
Source: Colliers International Indonesia - Research Source: Colliers International Indonesia - Research
20 Research & Forecast Report | 4Q 2014 | Apartment | Colliers International
apartment name location region no. oF unitS
continuation
Kemang Village (The Bloomington) Kemang South Jakarta 150
The Royal Olive Residence {Tower I) Buncit Raya South Jakarta 225
Senopati Suites 2 Senopati South Jakarta 81
LA City Apartment (Tower A) Lenteng Agung South Jakarta 980
La Maison Barito (Tower 1) Barito South Jakarta 80
Botanica Apartment (3 Towers) Simprug, Kebayoran Baru South Jakarta 626
Woodland Park (Trambesi tower) Kalibata South Jakarta 221
1 Park Avenue (3 Towers) Kebayoran Baru South Jakarta 279
Nine Residence Warung Buncit South Jakarta 246
Providence Park Permata Hijau South Jakarta 114
Kencana Residence Pondok Indah South Jakarta 173
Izzara Apartment (South and North Tower) TB. Simatupang South Jakarta 542
Niffaro Apartment (Ebony Tower) Pasar Minggu South Jakarta 288
Lexington Rersidence (Tower 1) Pondok Pinang South Jakarta 270
Lexington Rersidence (Tower 2) Pondok Pinang South Jakarta 270
The Aspen Peak at Admiralty Fatmawati South Jakarta 644
Grand Dhika Mansion Pejaten (Sector 1) Pejaten South Jakarta 44
19 Avenue Apartment Daan Mogot West Jakarta 338
Green Palm Residence @ Puri Kosambi West Jakarta 1,000
The Windsor (Tower II) Puri Indah West Jakarta 164
Metro Park Residence Kebon Jeruk West Jakarta 1,451
St. Moritz (New Presidential Tower) Puri Indah West Jakarta 150
Satu8 Residence Kedoya West Jakarta 174
The Nest Apartment Meruya Utara West Jakarta 1,100
Point 8 (Air Crew Tower) Daan Mogot West Jakarta 546
Gallery West Kebon Jeruk West Jakarta 280
2016
Sudirman Suites Sudirman CBD 380
Gayanti City (2 Towers) Jl. Gatot Subroto CBD 318
T - Plaza Residence (Tower A) Jl. Penjernihan I Kav.1 Pejompongan Central Jakarta 307
Sentosa Residence Cempaka Putih Central Jakarta 687
Sudirman Hill Residence Jl. Karet Pasar Baru Central Jakarta 255
Capitol Suites Jl. Prapatan Raya Central Jakarta 327
The Royal Springhill (Bulgari Tower) Jl. Spring Hill Residence Kemayoran Central Jakarta 192
The Green Pramuka (Tower Scarlet) Pramuka Central Jakarta 1,000
Holland Village (Phase II) Cempaka Putih Central Jakarta 230
Signature Park Grande Jl. MT. Haryono East Jakarta 1,100
East Park Apartment (Tower C) Jl. KRT Radjiman East Jakarta 550
Green Signature Apartment MT. Haryono East Jakarta 800
Bassura City (Tower Flamboyan) Jl. Basuki Rahmat East Jakarta 1,000
Bassura City (Tower Edelweiss) Jl. Basuki Rahmat East Jakarta 1,000
Bassura City (Tower Dahlia) Jl. Basuki Rahmat East Jakarta 1,000
Bassura City (Tower Cattleya) Jl. Basuki Rahmat East Jakarta 600
Marina The Coastal Ancol North Jakarta 1,500
Gold Coast Apartment (Atlantic Tower) Pantai Indah Kapuk North Jakarta 568
continued
21 Research & Forecast Report | 4Q 2014 | Apartment | Colliers International
apartment name location region no. oF unitS
continuation
Pluit Seaview (Tower Maldives) Pluit North Jakarta 940
Pluit Seaview (Tower Belize) Pluit North Jakarta 300
La Venue - North Tower Jl. Pasar Minggu South Jakarta 253
Senopati Suites 3 Jl. Senopati South Jakarta 54
Pakubuwono Terrace Grand Tower Kebayoran Lama South Jakarta 435
Apartment Pejaten Park Residence Jl. Warung Buncit Raya No.21 South Jakarta 560
Four Winds Jl. Permata Hijau Raya No.1 South Jakarta 122
Bellevue Place MT Haryono, Tebet South Jakarta 208
Kebayoran Icon Jl. Ciledug Raya South Jakarta 256
Belmont Residence (TowerAthena) Jl. Meruya Ilir West Jakarta 165
Puri Mansion Apartment (Tower A) Puri Mansion West Jakarta 900
Madison Park Tanjung Duren West Jakarta 1,200
Veranda Jl. Pesanggrahan Raya, Kembangan West Jakarta 174
St Moritz (The New Ambassador Suite Tower) Jl. Puri Indah Kembangan West Jakarta 200
Belmont Residence (Tower Montblanc) Meruya Ilir West Jakarta 350
Gianetti Apartment Kemanggisan West Jakarta 500
Source: Colliers International Indonesia - Research
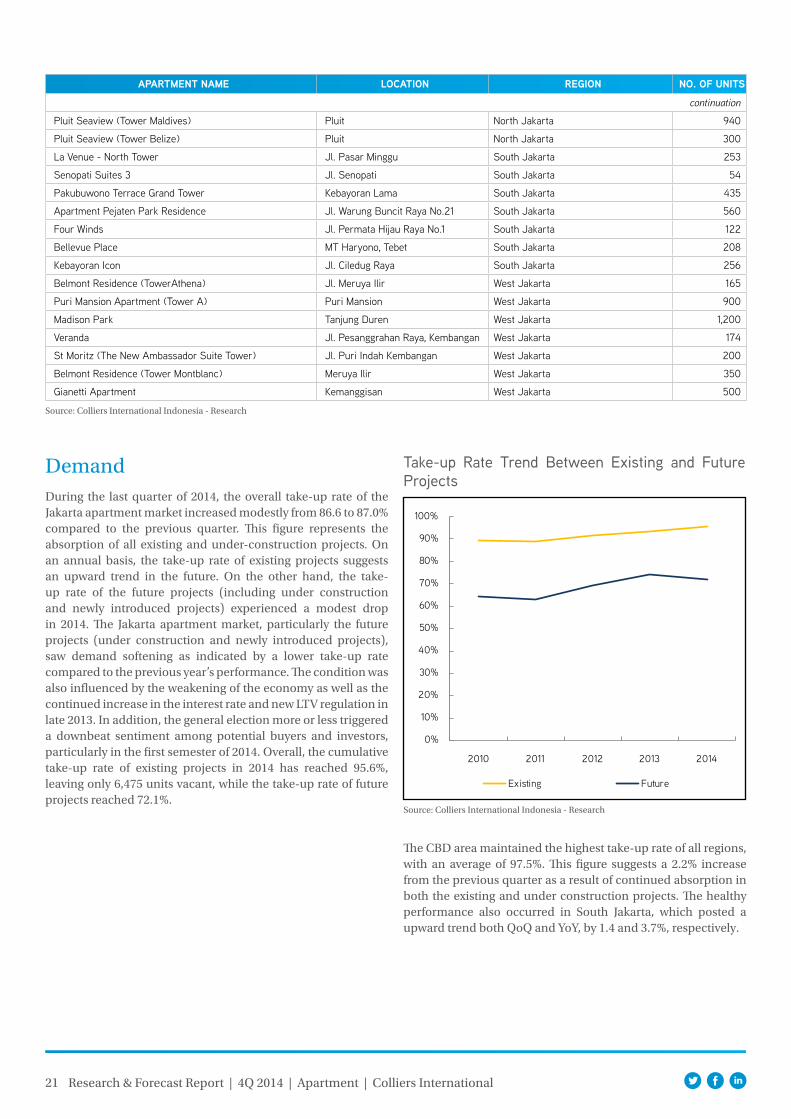
DemandDuring the last quarter of 2014, the overall take-up rate of the Jakarta apartment market increased modestly from 86.6 to 87.0% compared to the previous quarter. This figure represents the absorption of all existing and under-construction projects. On an annual basis, the take-up rate of existing projects suggests an upward trend in the future. On the other hand, the take-up rate of the future projects (including under construction and newly introduced projects) experienced a modest drop in 2014. The Jakarta apartment market, particularly the future projects (under construction and newly introduced projects), saw demand softening as indicated by a lower take-up rate compared to the previous year’s performance. The condition was also influenced by the weakening of the economy as well as the continued increase in the interest rate and new LTV regulation in late 2013. In addition, the general election more or less triggered a downbeat sentiment among potential buyers and investors, particularly in the first semester of 2014. Overall, the cumulative take-up rate of existing projects in 2014 has reached 95.6%, leaving only 6,475 units vacant, while the take-up rate of future projects reached 72.1%.
Take-up Rate Trend Between Existing and Future Projects
Source: Colliers International Indonesia - Research
0%
10%
20%
30%
40%
50%
60%
70%
80%
90%
100%
2010 2011 2012 2013 2014
Existing Future
The CBD area maintained the highest take-up rate of all regions, with an average of 97.5%. This figure suggests a 2.2% increase from the previous quarter as a result of continued absorption in both the existing and under construction projects. The healthy performance also occurred in South Jakarta, which posted a upward trend both QoQ and YoY, by 1.4 and 3.7%, respectively.
22
High demand for apartments in the CBD and South Jakarta area was driven mostly by investors who are quite optimistic about business prospects in the coming years. This, in turn, will potentially lead to the creation of more leasing demand, especially from the expatriate market. Moreover, the growth of the TB Simatupang area in South Jakarta, as a prominent business location for many multinational companies, has become a pull factor attracting investors to buy apartment units, which contributed to the sound performance of apartment projects located in the surrounding area.
In contrast to the CBD and South Jakarta area, the non-prime areas, including Central, West, East and North Jakarta, experienced sluggish performance due to the abundance of newly introduced apartment projects that exceeded the consistent absorption. This became the main factor affecting the downswing of the take-up rate to 83.4% over the reviewed quarter. The massive number of units from mid-low to lower apartment projects created a more competitive market and curbed potential growth of the take-up rate in the non-prime areas. On another front, apartment projects that provide a better concept, good building quality and design, and which are adjacent to public facilities and developed by reputable developers, are expected to generate sales in the upcoming quarters.
Research & Forecast Report | 4Q 2014 | Apartment | Colliers International
Source: Colliers International Indonesia - Research
Average Take-up Rate Performance in Different Locations
area 4Q 2013 3Q 2014 4Q 2014change
QoQ YoY
CBD 97.10% 95.30% 97.50% 2.20% 0.40%
South Jakarta 88.90% 91.20% 92.60% 1.40% 3.70%
Non-prime area 83.10% 83.60% 83.40% -0.20% 0.30%
Together with 26.2% of the population aged below 15, Indonesia has a huge pool of productive workers to draw upon over the long term.
Some attractive payment methods are still being used in order to attract more buyers during this challenging period, especially after the implementation of the new LTV regulation last year. Some of those methods are nil down payment without interest rate, balloon payment or longer period of instalments that have been acknowledged as attractive options for buyers to whom access to a bank mortgage is limited. Moreover, several promotional programmes offering various incentives, including direct electronic prizes, air conditioners or kitchen sets, which will be installed in the apartment, and city car.
Bank Indonesia, the Central Bank, decided to increase the benchmark interest rate by 25 bps to 7.75% in November 2014, in response to the new government’s fuel subsidy reform policy. For the short term, it is expected that the slowing down of demand is likely to continue, particularly in the primary market. However, assuming that economic conditions improve and the political situation is stable in the upcoming years, apartment sales are envisaged to gradually improve in the long term. Hence, the overall take-up rate is anticipated to stabilise within a short period before gradually increasing. Overall, strong interest from both end-users and investors has driven demand for new and off-plan apartments over the past few years. Apartments in the inner city close to train stations, shopping centres, universities and business hubs are the property of choice for these buyers. The Indonesian property market is primarily a domestic play driven by the strength of the local economy, particularly because foreigners are not allowed to buy apartments in this country. Based on the latest data from the office of Statistics Bureau (BPS), almost 70% of Indonesia’s population is in the working age group of 15 to 64 years. Among the working population, the majority (42.3%) are between the ages of 25 and 54. People in this group are vital to the economy due to their strong earning and purchasing power.
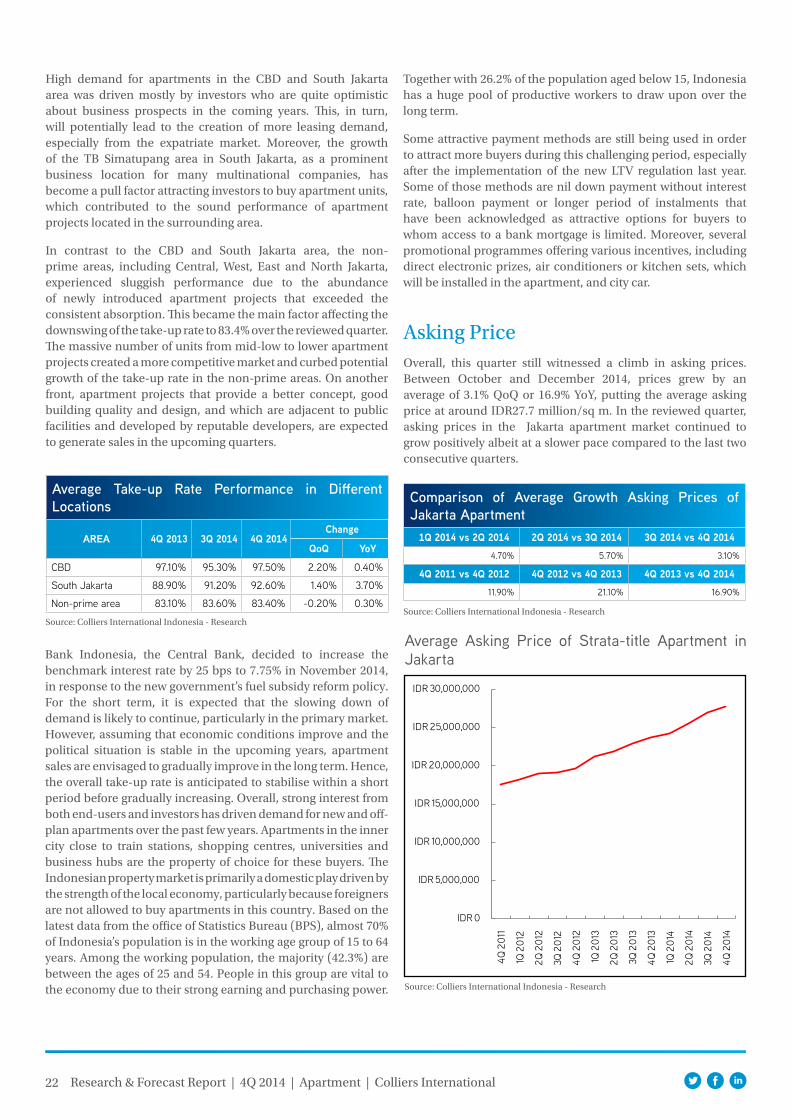
Asking PriceOverall, this quarter still witnessed a climb in asking prices. Between October and December 2014, prices grew by an average of 3.1% QoQ or 16.9% YoY, putting the average asking price at around IDR27.7 million/sq m. In the reviewed quarter, asking prices in the Jakarta apartment market continued to grow positively albeit at a slower pace compared to the last two consecutive quarters.
Source: Colliers International Indonesia - Research
Comparison of Average Growth Asking Prices of Jakarta Apartment
1Q 2014 vs 2Q 2014 2Q 2014 vs 3Q 2014 3Q 2014 vs 4Q 20144.70% 5.70% 3.10%
4Q 2011 vs 4Q 2012 4Q 2012 vs 4Q 2013 4Q 2013 vs 4Q 201411.90% 21.10% 16.90%
Average Asking Price of Strata-title Apartment in Jakarta
Source: Colliers International Indonesia - Research
IDR 0
IDR 5,000,000
IDR 10,000,000
IDR 15,000,000
IDR 20,000,000
IDR 25,000,000
IDR 30,000,000
4Q 2
011
1Q 2
012
2Q 2
012
3Q 2
012
4Q 2
012
1Q 2
013
2Q 2
013
3Q 2
013
4Q 2
013
1Q 2
014
2Q 2
014
3Q 2
014
4Q 2
014
23 Research & Forecast Report | 4Q 2014 | Apartment | Colliers International
In line with the demand, the growth of apartment prices in Jakarta experienced sluggish performance over the reviewed quarter. The slowdown in the economy, which is accompanied by the rise in interest rates has led to lower sales performance, thus putting a drag on the price increases, which in many cases are driven by a developer’s decision. In addition, a bountiful new development in the strata-title market has triggered more market competition, which could lead to downward pressure on price. However, the continued progress of construction activity and strong absorption in particular projects located in premium as well as strategic areas, became the determining factors of the price to increase.
Overall, in terms of price growth, South Jakarta still has the highest growth (YoY) among all areas. The accelerating price that occurred in South Jakarta was largely driven by robust demand, particularly at those on-going projects located in prime locations and surrounding the TB Simatupang area. For instance, one middle-class project that has not been launched yet, achieved exceptionally high demand, with 50 - 60% absorption within four months. Further, one upper-class project in a premium area, Pondok Indah, achieved an 85% take-up rate within six to seven months. On the other hand, price adjustments at apartment projects in the CBD were driven by the continued progress of construction and sales performance during this reviewed quarter. Several middle- to upper-class apartment projects located in good areas, like Ciputra International and The Windsor in Puri Indah area, as well as Kensington Residence in the Kelapa Gading area, introduced higher prices compared to other projects while the massive development projects maintained their current asking prices in order to attract buyers amid the strong competition, especially in the middle- to low-class apartment segment.
Source: Colliers International Indonesia - Research
Average Asking Price in Different Locations (in IDR)
area 4Q 2013 3Q 2014 4Q 2014change
QoQ YoYCBD 36,174,524 41,759,611 43,472,842 4% 20%
South Jakarta 25,854,554 31,241,685 32,033,471 3% 24%
Non-Prime Area 18,298,766 20,320,645 20,764,022 2% 13%
Apartment For Lease
SupplyThis quarter saw additional supply from the serviced apartments, Ascott Kuningan, which comprises 185 fully furnished 1- to 3-bedroom units. The Ascott Kuningan is strategically located in Mega Kuningan and is part of the mixed-use development, Ciputra World Jakarta I. This development will benefit from its prime location in the business area and embassy district where there is a sizeable expatriate community. With the completion of this development, the cumulative supply of serviced apartments at the end of 2014 rose gently by 3.9% QoQ to 4,954 units. The non-serviced apartments (apartments purely for lease) remained steady, with a total of 3,565 units.
Overall, as of 4Q 2014, the cumulative supply of apartments for lease in Jakarta was recorded at 8,519, with 44.2% of the total stock in the CBD. We expect to see an additional 640 serviced apartment units enter the market during 2015 - 2016. However, this number can change, particularly because serviced apartments called Pejaten Park has not released the official information regarding the operator and number of units. Based on information in the marketing, there will be serviced apartments in the second tower of Pejaten Park Residence (Tower Catalonia), on Levels 2 to 6.
Source: Colliers International Indonesia - Research
Future Serviced Apartment Pipeline in 2015 - 2016
name oF development Year oF operation location region developer no. oF
unitS
TBS Linera Apartment Service 2015 Cilandak Barat South Jakarta Constructa Builder 110
Fraser Place Setiabudi Sky Garden (Tower III) 2015 Karbela Selatan CBD Jakarta Setiabudi International 150
Oakwood at District 8 Senopati 2016 Senopati South Jakarta Oakwood 180
Serviced Apartment at Pejaten Park Residence 2016 Warung Buncit South Jakarta Bahama Group N/A
Fraser Suites at Ciputra World Jakarta II 2016 Satrio CBD Frasers Hospitality 200
24 Research & Forecast Report | 4Q 2014 | Apartment | Colliers International
Average Rental RatesThe rental rates for serviced apartments in Jakarta experienced a slight increase over the reviewed quarter. The trigger for this quarter increase is due to the commencement of Ascott Kuningan Serviced Apartment located at Jalan Dr. Satrio, which quotes a rental tariff way above the average market rate and thus impacted to the overall rental rates. On the other hand, the average rental rate of non-serviced apartment remained stable. However, since the majority of non-serviced apartment are offered in US dollars while the remainder are offered in local currency, the overall rental rates in US dollars (after converting from IDR to USD with the current exchange rate) somewhat dropped due to the strengthening US dollar against the rupiah during this quarter.
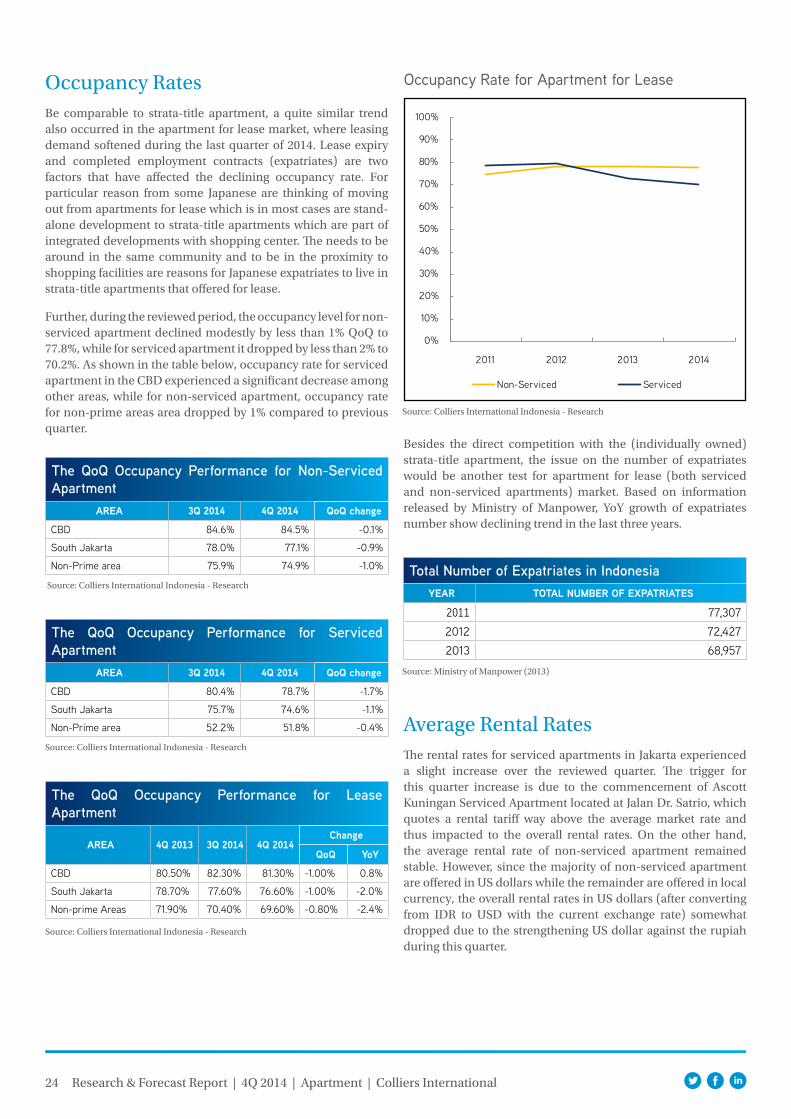
Occupancy RatesBe comparable to strata-title apartment, a quite similar trend also occurred in the apartment for lease market, where leasing demand softened during the last quarter of 2014. Lease expiry and completed employment contracts (expatriates) are two factors that have affected the declining occupancy rate. For particular reason from some Japanese are thinking of moving out from apartments for lease which is in most cases are stand-alone development to strata-title apartments which are part of integrated developments with shopping center. The needs to be around in the same community and to be in the proximity to shopping facilities are reasons for Japanese expatriates to live in strata-title apartments that offered for lease.
Further, during the reviewed period, the occupancy level for non-serviced apartment declined modestly by less than 1% QoQ to 77.8%, while for serviced apartment it dropped by less than 2% to 70.2%. As shown in the table below, occupancy rate for serviced apartment in the CBD experienced a significant decrease among other areas, while for non-serviced apartment, occupancy rate for non-prime areas area dropped by 1% compared to previous quarter.
Source: Colliers International Indonesia - Research
The QoQ Occupancy Performance for Non-Serviced Apartment
area 3Q 2014 4Q 2014 QoQ change
CBD 84.6% 84.5% -0.1%
South Jakarta 78.0% 77.1% -0.9%
Non-Prime area 75.9% 74.9% -1.0%
Occupancy Rate for Apartment for Lease
Source: Colliers International Indonesia - Research
The QoQ Occupancy Performance for Serviced Apartment
area 3Q 2014 4Q 2014 QoQ change
CBD 80.4% 78.7% -1.7%
South Jakarta 75.7% 74.6% -1.1%
Non-Prime area 52.2% 51.8% -0.4%
Source: Colliers International Indonesia - Research
Source: Colliers International Indonesia - Research
0%
10%
20%
30%
40%
50%
60%
70%
80%
90%
100%
2011 2012 2013 2014
Non-Serviced Serviced
Besides the direct competition with the (individually owned) strata-title apartment, the issue on the number of expatriates would be another test for apartment for lease (both serviced and non-serviced apartments) market. Based on information released by Ministry of Manpower, YoY growth of expatriates number show declining trend in the last three years.
Total Number of Expatriates in IndonesiaYear total numBer oF eXpatriateS
2011 77,307 2012 72,427 2013 68,957
Source: Ministry of Manpower (2013)
The QoQ Occupancy Performance for Lease Apartment
area 4Q 2013 3Q 2014 4Q 2014change
QoQ YoY
CBD 80.50% 82.30% 81.30% -1.00% 0.8%
South Jakarta 78.70% 77.60% 76.60% -1.00% -2.0%
Non-prime Areas 71.90% 70.40% 69.60% -0.80% -2.4%
25 Research & Forecast Report | 4Q 2014 | Apartment | Colliers International
OutlookOverall, the 2014 performance was under the level of accomplishment in 2013. In term of total units of newly introduced projects, the total apartment supply in 2014 was only 12,164 units, dropped by 45% compared to 2013’s figure of 21,935 units. Moreover, the overall lackluster absorption was mainly due to the tight competition among under-construction projects.
The competition among the under-construction apartment and the limitation in financing due to LTV regulation has pushed developers to become more creative like providing flexible financing terms and marketing gimmick which alleviate the burden of consumers.
In the rental apartment market, tight competition and slow rental movement is seen to characterize the market in 2015. The relatively stagnant occupancy rate is seen to continue due to some additional new stock of leased apartment project and competition from strata-title apartments offered for lease. On this basis, we expect no significant increase in the rental rate in 2015, as we only anticipate 5-6% increase compared to the 2014.
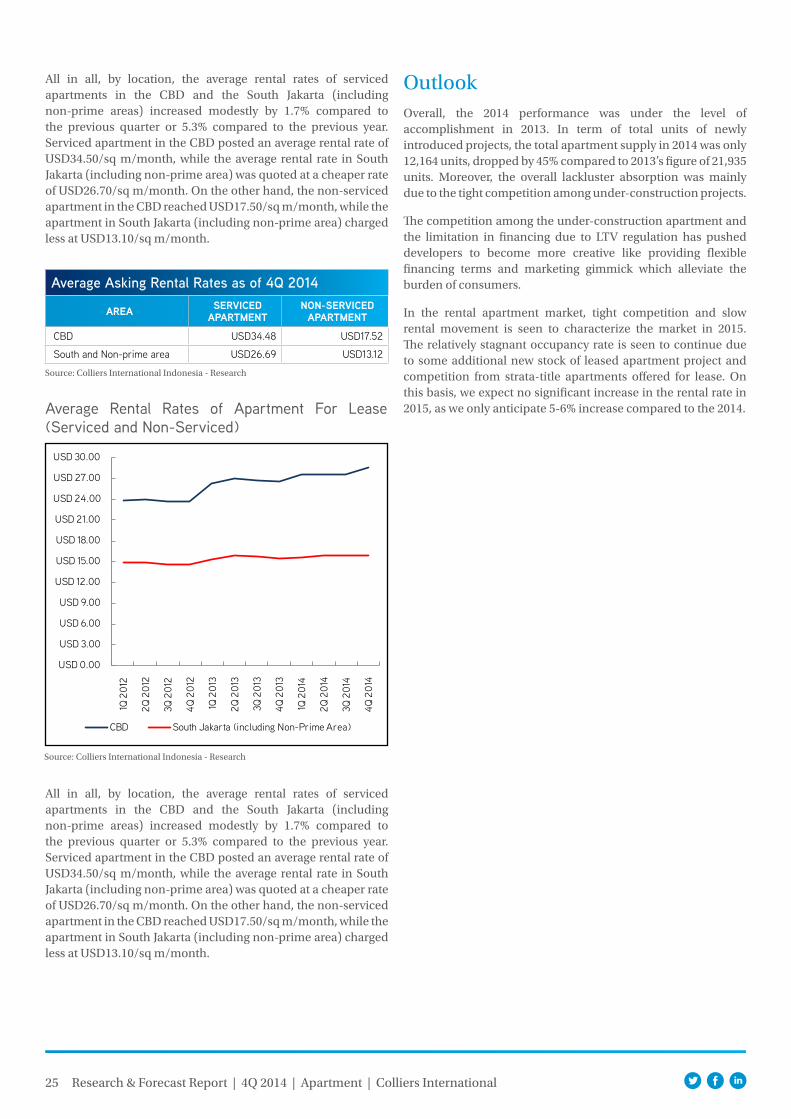
All in all, by location, the average rental rates of serviced apartments in the CBD and the South Jakarta (including non-prime areas) increased modestly by 1.7% compared to the previous quarter or 5.3% compared to the previous year. Serviced apartment in the CBD posted an average rental rate of USD34.50/sq m/month, while the average rental rate in South Jakarta (including non-prime area) was quoted at a cheaper rate of USD26.70/sq m/month. On the other hand, the non-serviced apartment in the CBD reached USD17.50/sq m/month, while the apartment in South Jakarta (including non-prime area) charged less at USD13.10/sq m/month.
Average Rental Rates of Apartment For Lease (Serviced and Non-Serviced)
Source: Colliers International Indonesia - Research
Average Asking Rental Rates as of 4Q 2014
area Serviced apartment
non-Serviced apartment
CBD USD34.48 USD17.52
South and Non-prime area USD26.69 USD13.12
Source: Colliers International Indonesia - Research
USD 0.00
USD 3.00
USD 6.00
USD 9.00
USD 12.00
USD 15.00
USD 18.00
USD 21.00
USD 24.00
USD 27.00
USD 30.00
1Q 2
012
2Q 2
012
3Q 2
012
4Q 2
012
1Q 2
013
2Q 2
013
3Q 2
013
4Q 2
013
1Q 2
014
2Q 2
014
3Q 2
014
4Q 2
014
CBD South Jakarta (including Non-Prime Area)
All in all, by location, the average rental rates of serviced apartments in the CBD and the South Jakarta (including non-prime areas) increased modestly by 1.7% compared to the previous quarter or 5.3% compared to the previous year. Serviced apartment in the CBD posted an average rental rate of USD34.50/sq m/month, while the average rental rate in South Jakarta (including non-prime area) was quoted at a cheaper rate of USD26.70/sq m/month. On the other hand, the non-serviced apartment in the CBD reached USD17.50/sq m/month, while the apartment in South Jakarta (including non-prime area) charged less at USD13.10/sq m/month.
26
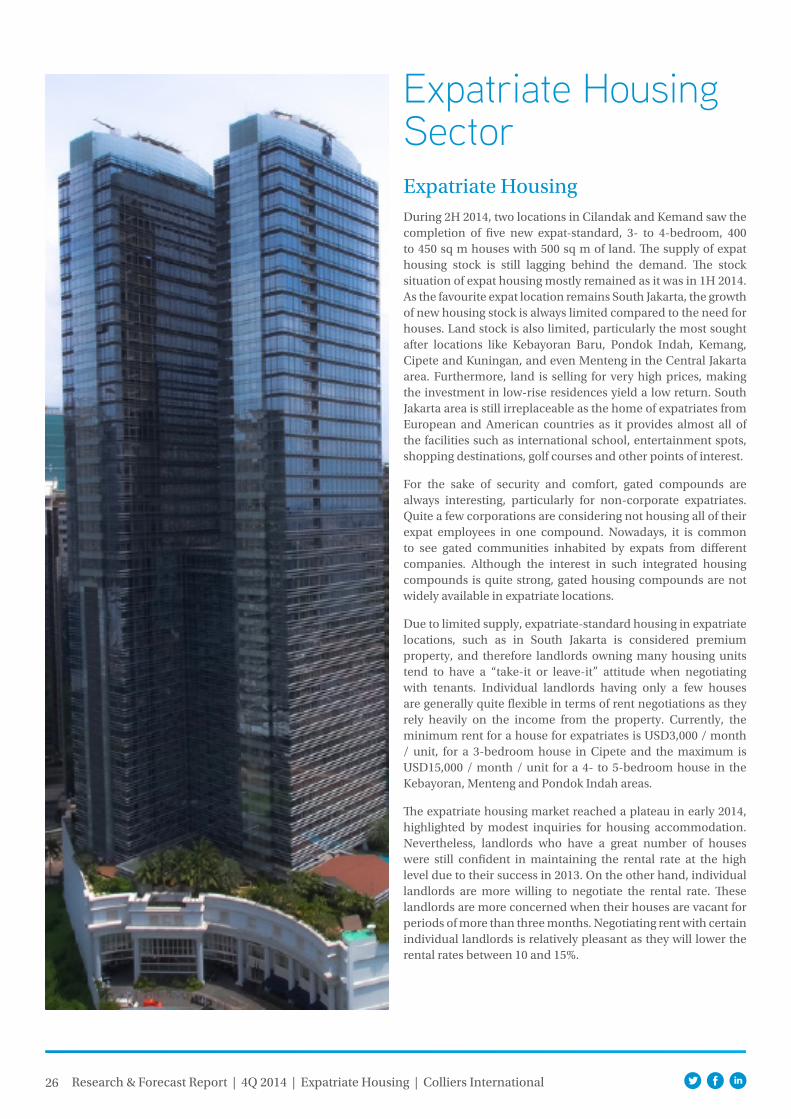
Expatriate Housing SectorExpatriate HousingDuring 2H 2014, two locations in Cilandak and Kemand saw the completion of five new expat-standard, 3- to 4-bedroom, 400 to 450 sq m houses with 500 sq m of land. The supply of expat housing stock is still lagging behind the demand. The stock situation of expat housing mostly remained as it was in 1H 2014. As the favourite expat location remains South Jakarta, the growth of new housing stock is always limited compared to the need for houses. Land stock is also limited, particularly the most sought after locations like Kebayoran Baru, Pondok Indah, Kemang, Cipete and Kuningan, and even Menteng in the Central Jakarta area. Furthermore, land is selling for very high prices, making the investment in low-rise residences yield a low return. South Jakarta area is still irreplaceable as the home of expatriates from European and American countries as it provides almost all of the facilities such as international school, entertainment spots, shopping destinations, golf courses and other points of interest.
For the sake of security and comfort, gated compounds are always interesting, particularly for non-corporate expatriates. Quite a few corporations are considering not housing all of their expat employees in one compound. Nowadays, it is common to see gated communities inhabited by expats from different companies. Although the interest in such integrated housing compounds is quite strong, gated housing compounds are not widely available in expatriate locations.
Due to limited supply, expatriate-standard housing in expatriate locations, such as in South Jakarta is considered premium property, and therefore landlords owning many housing units tend to have a “take-it or leave-it” attitude when negotiating with tenants. Individual landlords having only a few houses are generally quite flexible in terms of rent negotiations as they rely heavily on the income from the property. Currently, the minimum rent for a house for expatriates is USD3,000 / month / unit, for a 3-bedroom house in Cipete and the maximum is USD15,000 / month / unit for a 4- to 5-bedroom house in the Kebayoran, Menteng and Pondok Indah areas.
The expatriate housing market reached a plateau in early 2014, highlighted by modest inquiries for housing accommodation. Nevertheless, landlords who have a great number of houses were still confident in maintaining the rental rate at the high level due to their success in 2013. On the other hand, individual landlords are more willing to negotiate the rental rate. These landlords are more concerned when their houses are vacant for periods of more than three months. Negotiating rent with certain individual landlords is relatively pleasant as they will lower the rental rates between 10 and 15%.
Research & Forecast Report | 4Q 2014 | Expatriate Housing | Colliers International
27
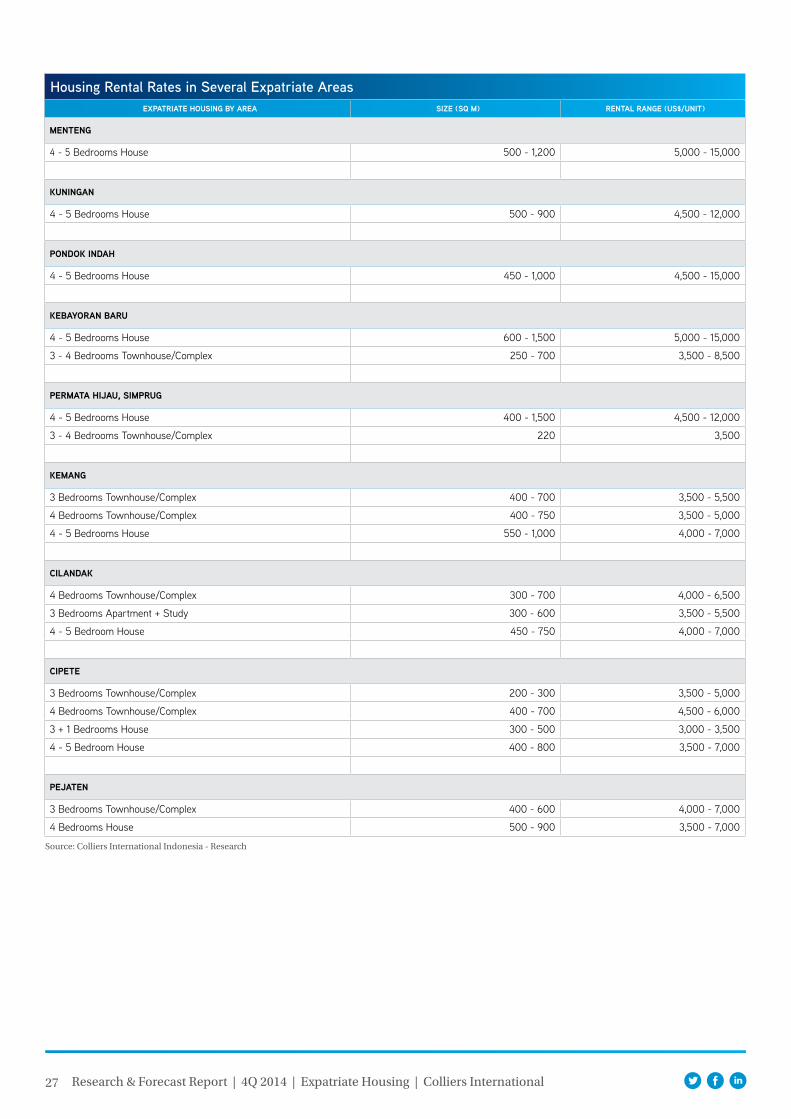
Housing Rental Rates in Several Expatriate AreaseXpatriate houSing BY area Size (SQ m) rental range (uS$/unit)
menteng
4 - 5 Bedrooms House 500 - 1,200 5,000 - 15,000
kuningan
4 - 5 Bedrooms House 500 - 900 4,500 - 12,000
pondok indah
4 - 5 Bedrooms House 450 - 1,000 4,500 - 15,000
keBaYoran Baru
4 - 5 Bedrooms House 600 - 1,500 5,000 - 15,000
3 - 4 Bedrooms Townhouse/Complex 250 - 700 3,500 - 8,500
permata hijau, Simprug
4 - 5 Bedrooms House 400 - 1,500 4,500 - 12,000
3 - 4 Bedrooms Townhouse/Complex 220 3,500
kemang
3 Bedrooms Townhouse/Complex 400 - 700 3,500 - 5,500
4 Bedrooms Townhouse/Complex 400 - 750 3,500 - 5,000
4 - 5 Bedrooms House 550 - 1,000 4,000 - 7,000
cilandak
4 Bedrooms Townhouse/Complex 300 - 700 4,000 - 6,500
3 Bedrooms Apartment + Study 300 - 600 3,500 - 5,500
4 - 5 Bedroom House 450 - 750 4,000 - 7,000
cipete
3 Bedrooms Townhouse/Complex 200 - 300 3,500 - 5,000
4 Bedrooms Townhouse/Complex 400 - 700 4,500 - 6,000
3 + 1 Bedrooms House 300 - 500 3,000 - 3,500
4 - 5 Bedroom House 400 - 800 3,500 - 7,000
pejaten
3 Bedrooms Townhouse/Complex 400 - 600 4,000 - 7,000
4 Bedrooms House 500 - 900 3,500 - 7,000
Source: Colliers International Indonesia - Research
Research & Forecast Report | 4Q 2014 | Expatriate Housing | Colliers International
28
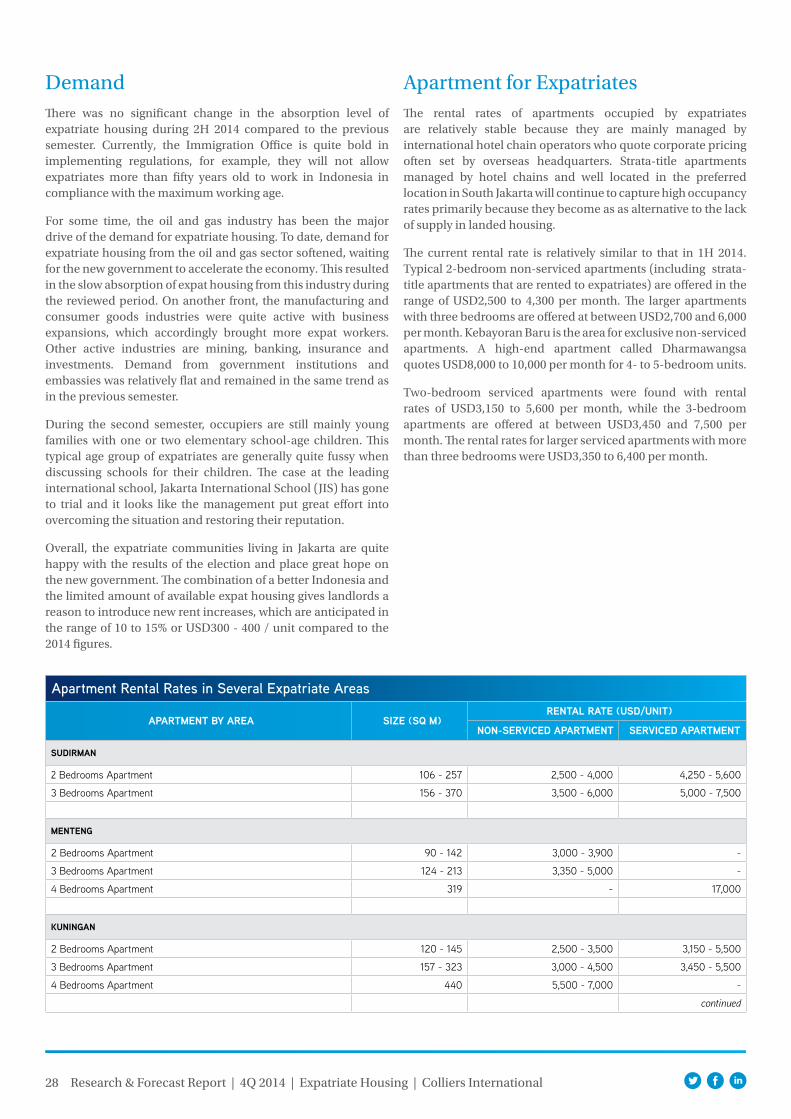
DemandThere was no significant change in the absorption level of expatriate housing during 2H 2014 compared to the previous semester. Currently, the Immigration Office is quite bold in implementing regulations, for example, they will not allow expatriates more than fifty years old to work in Indonesia in compliance with the maximum working age.
For some time, the oil and gas industry has been the major drive of the demand for expatriate housing. To date, demand for expatriate housing from the oil and gas sector softened, waiting for the new government to accelerate the economy. This resulted in the slow absorption of expat housing from this industry during the reviewed period. On another front, the manufacturing and consumer goods industries were quite active with business expansions, which accordingly brought more expat workers. Other active industries are mining, banking, insurance and investments. Demand from government institutions and embassies was relatively flat and remained in the same trend as in the previous semester.
During the second semester, occupiers are still mainly young families with one or two elementary school-age children. This typical age group of expatriates are generally quite fussy when discussing schools for their children. The case at the leading international school, Jakarta International School (JIS) has gone to trial and it looks like the management put great effort into overcoming the situation and restoring their reputation.
Overall, the expatriate communities living in Jakarta are quite happy with the results of the election and place great hope on the new government. The combination of a better Indonesia and the limited amount of available expat housing gives landlords a reason to introduce new rent increases, which are anticipated in the range of 10 to 15% or USD300 - 400 / unit compared to the 2014 figures.
Apartment for ExpatriatesThe rental rates of apartments occupied by expatriates are relatively stable because they are mainly managed by international hotel chain operators who quote corporate pricing often set by overseas headquarters. Strata-title apartments managed by hotel chains and well located in the preferred location in South Jakarta will continue to capture high occupancy rates primarily because they become as as alternative to the lack of supply in landed housing.
The current rental rate is relatively similar to that in 1H 2014. Typical 2-bedroom non-serviced apartments (including strata-title apartments that are rented to expatriates) are offered in the range of USD2,500 to 4,300 per month. The larger apartments with three bedrooms are offered at between USD2,700 and 6,000 per month. Kebayoran Baru is the area for exclusive non-serviced apartments. A high-end apartment called Dharmawangsa quotes USD8,000 to 10,000 per month for 4- to 5-bedroom units.
Two-bedroom serviced apartments were found with rental rates of USD3,150 to 5,600 per month, while the 3-bedroom apartments are offered at between USD3,450 and 7,500 per month. The rental rates for larger serviced apartments with more than three bedrooms were USD3,350 to 6,400 per month.
Apartment Rental Rates in Several Expatriate Areas
apartment BY area Size (SQ m)rental rate (uSd/unit)
non-Serviced apartment Serviced apartment
Sudirman
2 Bedrooms Apartment 106 - 257 2,500 - 4,000 4,250 - 5,600
3 Bedrooms Apartment 156 - 370 3,500 - 6,000 5,000 - 7,500
menteng
2 Bedrooms Apartment 90 - 142 3,000 - 3,900 -
3 Bedrooms Apartment 124 - 213 3,350 - 5,000 -
4 Bedrooms Apartment 319 - 17,000
kuningan
2 Bedrooms Apartment 120 - 145 2,500 - 3,500 3,150 - 5,500
3 Bedrooms Apartment 157 - 323 3,000 - 4,500 3,450 - 5,500
4 Bedrooms Apartment 440 5,500 - 7,000 -
continued
Research & Forecast Report | 4Q 2014 | Expatriate Housing | Colliers International
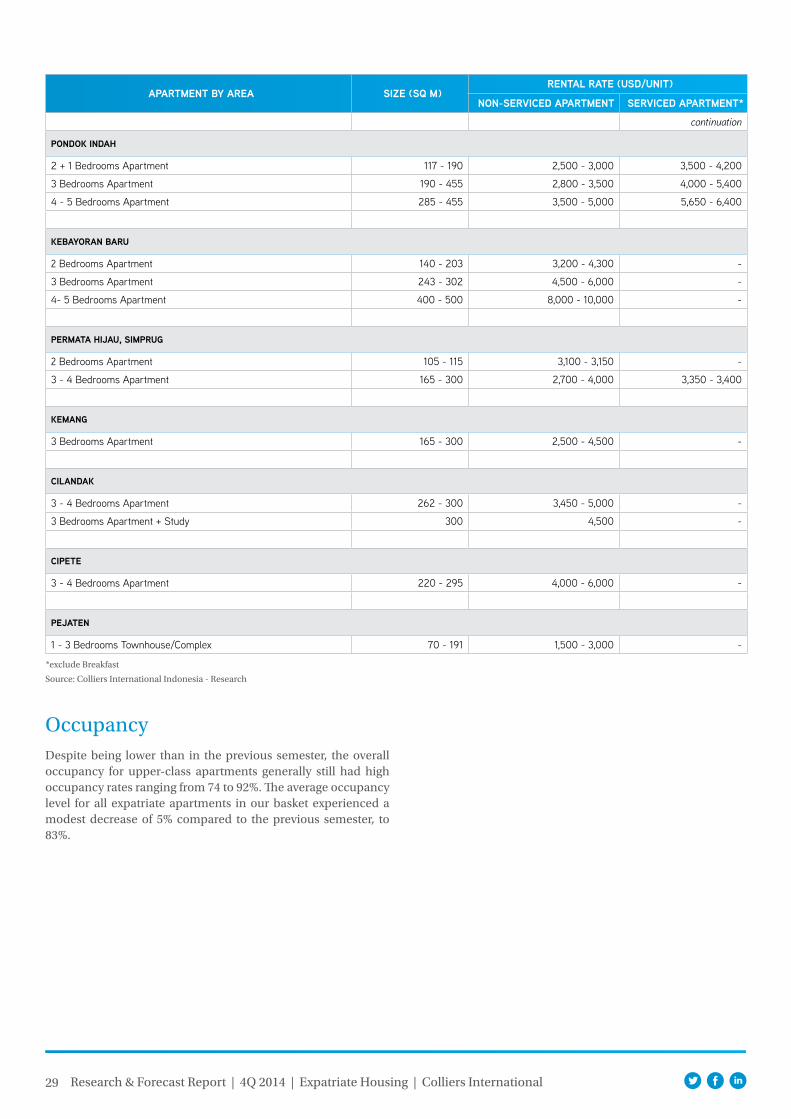
29
apartment BY area Size (SQ m)rental rate (uSd/unit)
non-Serviced apartment Serviced apartment*
continuation
pondok indah
2 + 1 Bedrooms Apartment 117 - 190 2,500 - 3,000 3,500 - 4,200
3 Bedrooms Apartment 190 - 455 2,800 - 3,500 4,000 - 5,400
4 - 5 Bedrooms Apartment 285 - 455 3,500 - 5,000 5,650 - 6,400
keBaYoran Baru
2 Bedrooms Apartment 140 - 203 3,200 - 4,300 -
3 Bedrooms Apartment 243 - 302 4,500 - 6,000 -
4- 5 Bedrooms Apartment 400 - 500 8,000 - 10,000 -
permata hijau, Simprug
2 Bedrooms Apartment 105 - 115 3,100 - 3,150 -
3 - 4 Bedrooms Apartment 165 - 300 2,700 - 4,000 3,350 - 3,400
kemang
3 Bedrooms Apartment 165 - 300 2,500 - 4,500 -
cilandak
3 - 4 Bedrooms Apartment 262 - 300 3,450 - 5,000 -
3 Bedrooms Apartment + Study 300 4,500 -
cipete
3 - 4 Bedrooms Apartment 220 - 295 4,000 - 6,000 -
pejaten
1 - 3 Bedrooms Townhouse/Complex 70 - 191 1,500 - 3,000 -
Source: Colliers International Indonesia - Research
*exclude Breakfast
OccupancyDespite being lower than in the previous semester, the overall occupancy for upper-class apartments generally still had high occupancy rates ranging from 74 to 92%. The average occupancy level for all expatriate apartments in our basket experienced a modest decrease of 5% compared to the previous semester, to 83%.
Research & Forecast Report | 4Q 2014 | Expatriate Housing | Colliers International
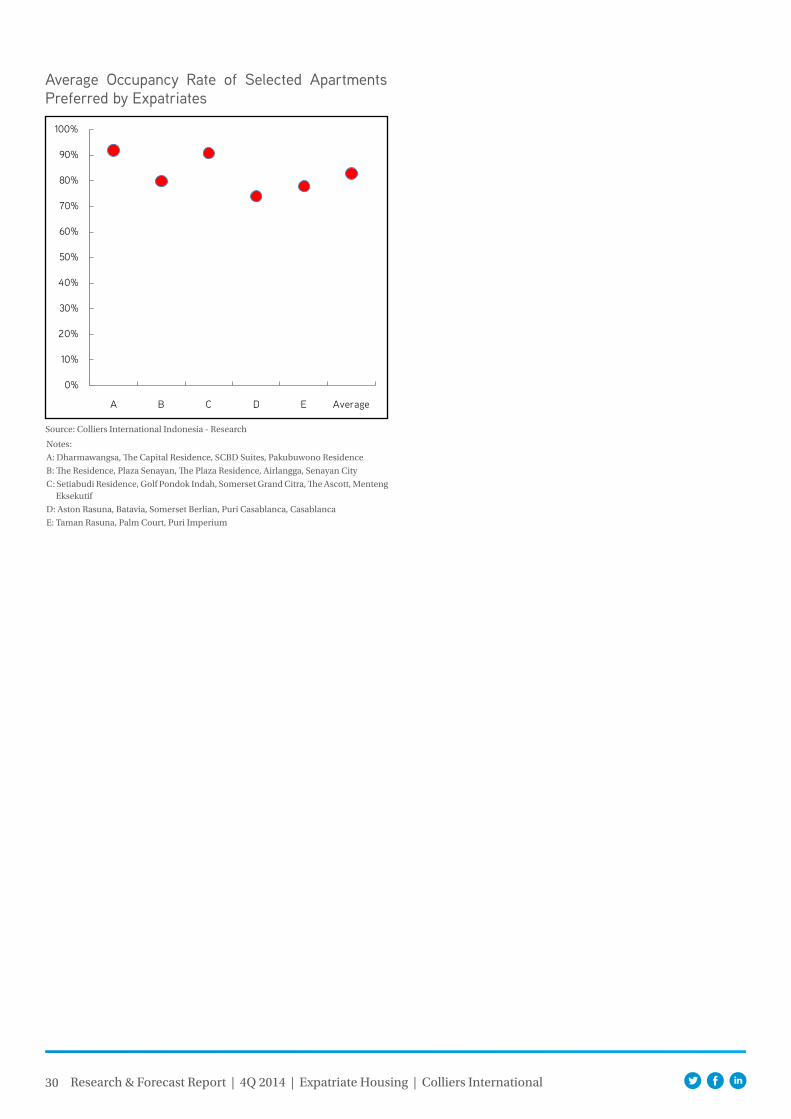
30
Average Occupancy Rate of Selected Apartments Preferred by Expatriates
Source: Colliers International Indonesia - Research
Notes:
A: Dharmawangsa, The Capital Residence, SCBD Suites, Pakubuwono Residence
B: The Residence, Plaza Senayan, The Plaza Residence, Airlangga, Senayan City
C: Setiabudi Residence, Golf Pondok Indah, Somerset Grand Citra, The Ascott, Menteng Eksekutif
D: Aston Rasuna, Batavia, Somerset Berlian, Puri Casablanca, Casablanca
E: Taman Rasuna, Palm Court, Puri Imperium
0%
10%
20%
30%
40%
50%
60%
70%
80%
90%
100%
A B C D E Average
Research & Forecast Report | 4Q 2014 | Expatriate Housing | Colliers International
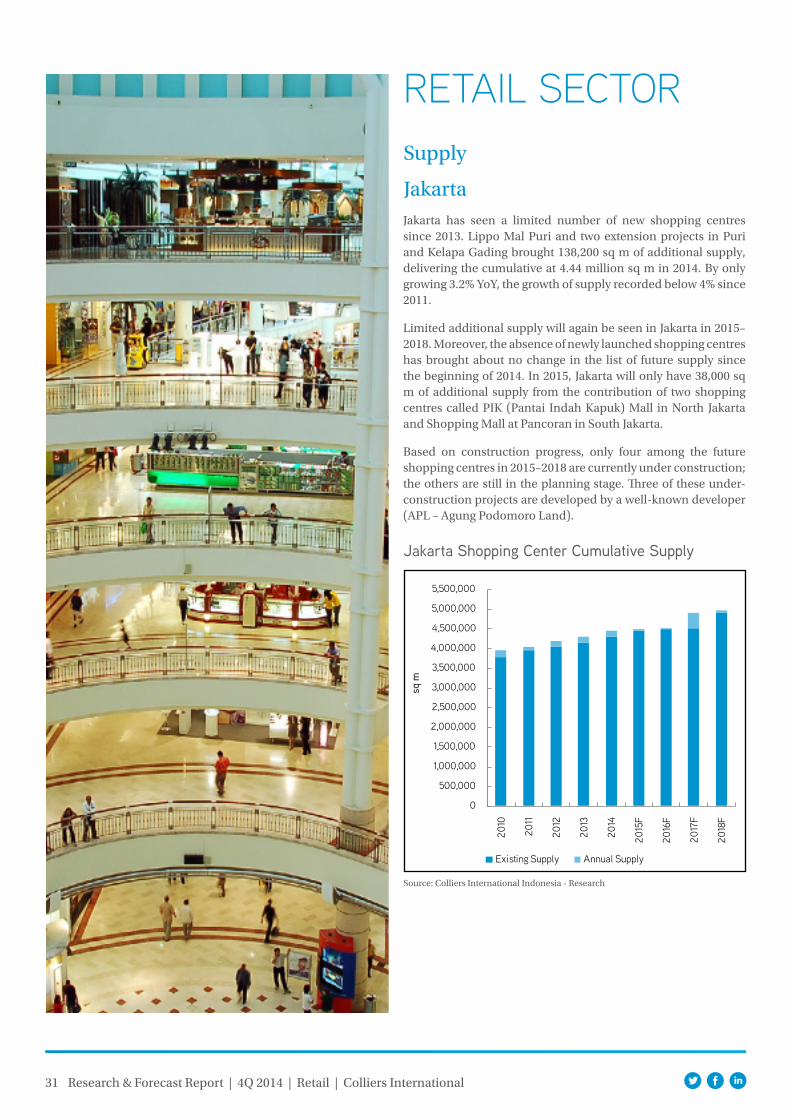
31
Supply
Jakarta
Jakarta Shopping Center Cumulative Supply
Source: Colliers International Indonesia - Research
Research & Forecast Report | 4Q 2014 | Retail | Colliers International
Jakarta has seen a limited number of new shopping centres since 2013. Lippo Mal Puri and two extension projects in Puri and Kelapa Gading brought 138,200 sq m of additional supply, delivering the cumulative at 4.44 million sq m in 2014. By only growing 3.2% YoY, the growth of supply recorded below 4% since 2011.
Limited additional supply will again be seen in Jakarta in 2015–2018. Moreover, the absence of newly launched shopping centres has brought about no change in the list of future supply since the beginning of 2014. In 2015, Jakarta will only have 38,000 sq m of additional supply from the contribution of two shopping centres called PIK (Pantai Indah Kapuk) Mall in North Jakarta and Shopping Mall at Pancoran in South Jakarta.
Based on construction progress, only four among the future shopping centres in 2015–2018 are currently under construction; the others are still in the planning stage. Three of these under-construction projects are developed by a well-known developer (APL – Agung Podomoro Land).
0
500,000
1,000,000
1,500,000
2,000,000
2,500,000
3,000,000
3,500,000
4,000,000
4,500,000
5,000,000
5,500,000
2010
2011
2012
2013
2014
2015
F
2016
F
2017
F
2018
F
sq m
Existing Supply Annual Supply
RETAIL SECTOR
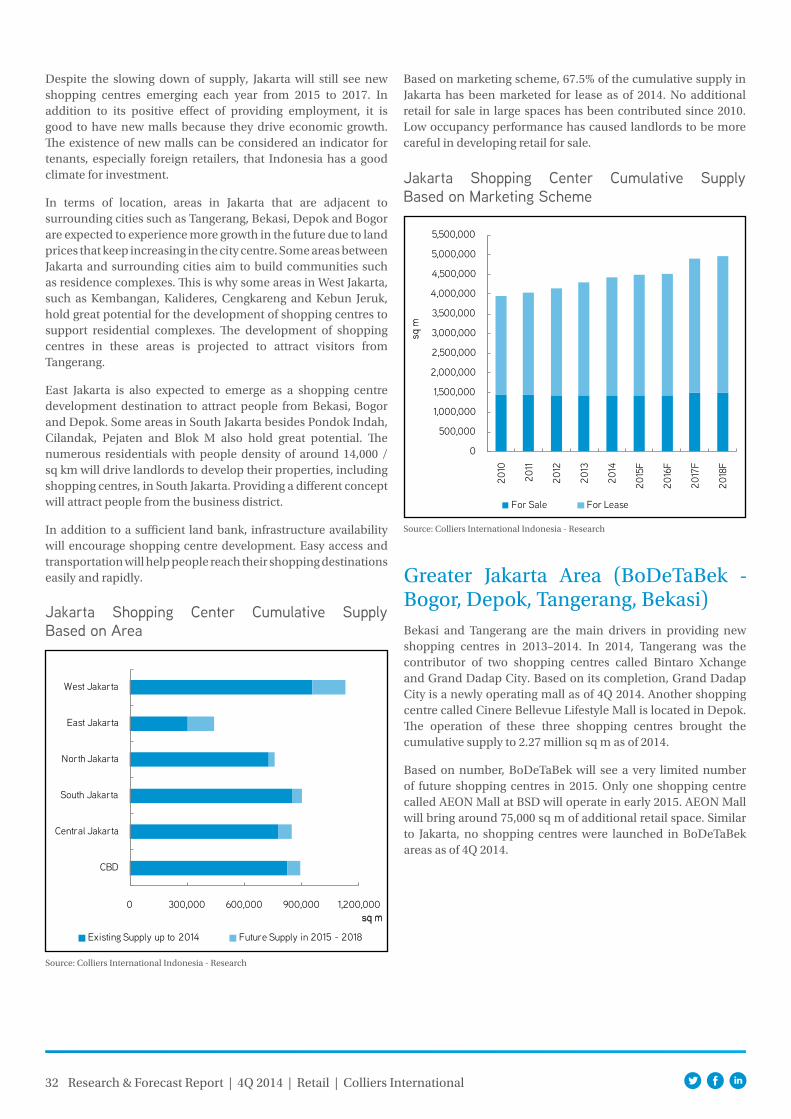
32 Research & Forecast Report | 4Q 2014 | Retail | Colliers International
Based on marketing scheme, 67.5% of the cumulative supply in Jakarta has been marketed for lease as of 2014. No additional retail for sale in large spaces has been contributed since 2010. Low occupancy performance has caused landlords to be more careful in developing retail for sale.
Despite the slowing down of supply, Jakarta will still see new shopping centres emerging each year from 2015 to 2017. In addition to its positive effect of providing employment, it is good to have new malls because they drive economic growth. The existence of new malls can be considered an indicator for tenants, especially foreign retailers, that Indonesia has a good climate for investment.
In terms of location, areas in Jakarta that are adjacent to surrounding cities such as Tangerang, Bekasi, Depok and Bogor are expected to experience more growth in the future due to land prices that keep increasing in the city centre. Some areas between Jakarta and surrounding cities aim to build communities such as residence complexes. This is why some areas in West Jakarta, such as Kembangan, Kalideres, Cengkareng and Kebun Jeruk, hold great potential for the development of shopping centres to support residential complexes. The development of shopping centres in these areas is projected to attract visitors from Tangerang.
East Jakarta is also expected to emerge as a shopping centre development destination to attract people from Bekasi, Bogor and Depok. Some areas in South Jakarta besides Pondok Indah, Cilandak, Pejaten and Blok M also hold great potential. The numerous residentials with people density of around 14,000 / sq km will drive landlords to develop their properties, including shopping centres, in South Jakarta. Providing a different concept will attract people from the business district.
In addition to a sufficient land bank, infrastructure availability will encourage shopping centre development. Easy access and transportation will help people reach their shopping destinations easily and rapidly.
Jakarta Shopping Center Cumulative Supply Based on Area
Source: Colliers International Indonesia - Research
0 300,000 600,000 900,000 1,200,000
CBD
Central Jakarta
South Jakarta
North Jakarta
East Jakarta
West Jakarta
sq m
Existing Supply up to 2014 Future Supply in 2015 - 2018
Jakarta Shopping Center Cumulative Supply Based on Marketing Scheme
Source: Colliers International Indonesia - Research
0
500,000
1,000,000
1,500,000
2,000,000
2,500,000
3,000,000
3,500,000
4,000,000
4,500,000
5,000,000
5,500,000
2010
2011
2012
2013
2014
2015
F
2016
F
2017
F
2018
F
sq m
For Sale For Lease
Bekasi and Tangerang are the main drivers in providing new shopping centres in 2013–2014. In 2014, Tangerang was the contributor of two shopping centres called Bintaro Xchange and Grand Dadap City. Based on its completion, Grand Dadap City is a newly operating mall as of 4Q 2014. Another shopping centre called Cinere Bellevue Lifestyle Mall is located in Depok. The operation of these three shopping centres brought the cumulative supply to 2.27 million sq m as of 2014.
Based on number, BoDeTaBek will see a very limited number of future shopping centres in 2015. Only one shopping centre called AEON Mall at BSD will operate in early 2015. AEON Mall will bring around 75,000 sq m of additional retail space. Similar to Jakarta, no shopping centres were launched in BoDeTaBek areas as of 4Q 2014.
Greater Jakarta Area (BoDeTaBek - Bogor, Depok, Tangerang, Bekasi)
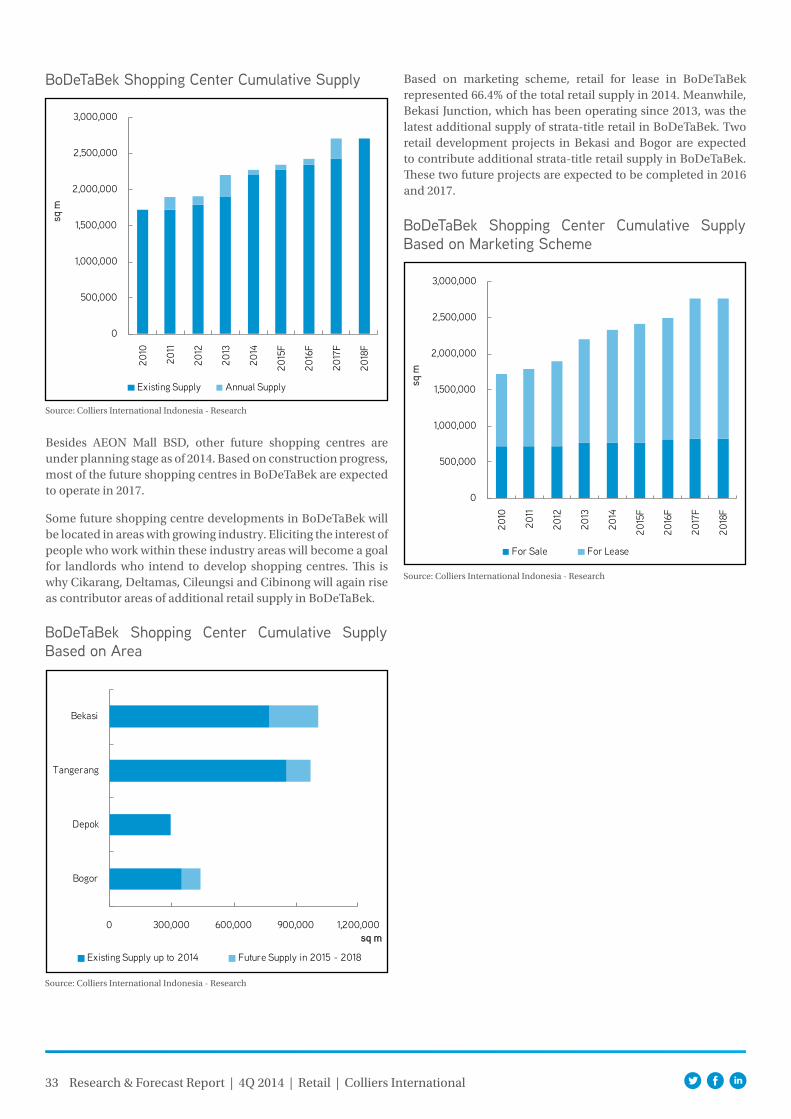
33 Research & Forecast Report | 4Q 2014 | Retail | Colliers International
Based on marketing scheme, retail for lease in BoDeTaBek represented 66.4% of the total retail supply in 2014. Meanwhile, Bekasi Junction, which has been operating since 2013, was the latest additional supply of strata-title retail in BoDeTaBek. Two retail development projects in Bekasi and Bogor are expected to contribute additional strata-title retail supply in BoDeTaBek. These two future projects are expected to be completed in 2016 and 2017.
BoDeTaBek Shopping Center Cumulative Supply
Source: Colliers International Indonesia - Research
0
500,000
1,000,000
1,500,000
2,000,000
2,500,000
3,000,000
2010
2011
2012
2013
2014
2015
F
2016
F
2017
F
2018
F
sq m
Existing Supply Annual Supply
Besides AEON Mall BSD, other future shopping centres are under planning stage as of 2014. Based on construction progress, most of the future shopping centres in BoDeTaBek are expected to operate in 2017.
Some future shopping centre developments in BoDeTaBek will be located in areas with growing industry. Eliciting the interest of people who work within these industry areas will become a goal for landlords who intend to develop shopping centres. This is why Cikarang, Deltamas, Cileungsi and Cibinong will again rise as contributor areas of additional retail supply in BoDeTaBek.
BoDeTaBek Shopping Center Cumulative Supply Based on Area
Source: Colliers International Indonesia - Research
0 300,000 600,000 900,000 1,200,000
Bogor
Depok
Tangerang
Bekasi
sq m
Existing Supply up to 2014 Future Supply in 2015 - 2018
BoDeTaBek Shopping Center Cumulative Supply Based on Marketing Scheme
Source: Colliers International Indonesia - Research
0
500,000
1,000,000
1,500,000
2,000,000
2,500,000
3,000,000
2010
2011
2012
2013
2014
2015
F
2016
F
2017
F
2018
F
sq m
For Sale For Lease
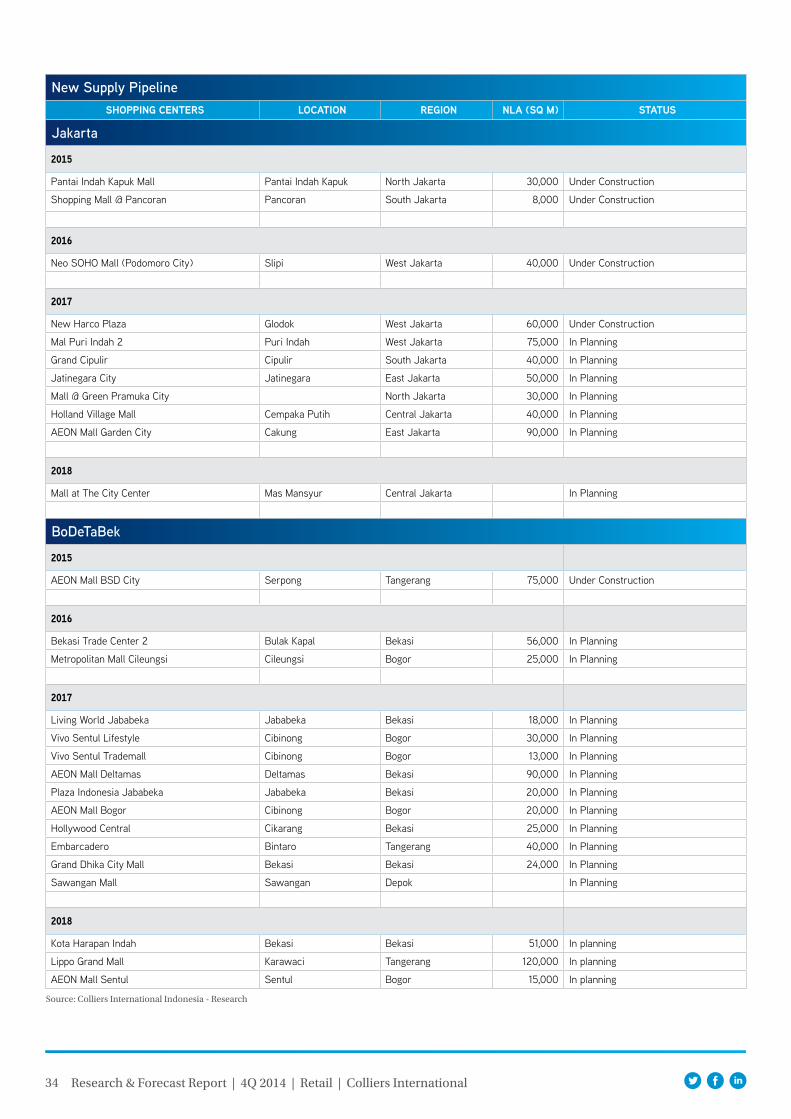
34 Research & Forecast Report | 4Q 2014 | Retail | Colliers International
New Supply PipelineShopping centerS location region nla (SQ m) StatuS
Jakarta
2015
Pantai Indah Kapuk Mall Pantai Indah Kapuk North Jakarta 30,000 Under Construction
Shopping Mall @ Pancoran Pancoran South Jakarta 8,000 Under Construction
2016
Neo SOHO Mall (Podomoro City) Slipi West Jakarta 40,000 Under Construction
2017
New Harco Plaza Glodok West Jakarta 60,000 Under Construction
Mal Puri Indah 2 Puri Indah West Jakarta 75,000 In Planning
Grand Cipulir Cipulir South Jakarta 40,000 In Planning
Jatinegara City Jatinegara East Jakarta 50,000 In Planning
Mall @ Green Pramuka City North Jakarta 30,000 In Planning
Holland Village Mall Cempaka Putih Central Jakarta 40,000 In Planning
AEON Mall Garden City Cakung East Jakarta 90,000 In Planning
2018
Mall at The City Center Mas Mansyur Central Jakarta In Planning
BoDeTaBek
2015
AEON Mall BSD City Serpong Tangerang 75,000 Under Construction
2016
Bekasi Trade Center 2 Bulak Kapal Bekasi 56,000 In Planning
Metropolitan Mall Cileungsi Cileungsi Bogor 25,000 In Planning
2017
Living World Jababeka Jababeka Bekasi 18,000 In Planning
Vivo Sentul Lifestyle Cibinong Bogor 30,000 In Planning
Vivo Sentul Trademall Cibinong Bogor 13,000 In Planning
AEON Mall Deltamas Deltamas Bekasi 90,000 In Planning
Plaza Indonesia Jababeka Jababeka Bekasi 20,000 In Planning
AEON Mall Bogor Cibinong Bogor 20,000 In Planning
Hollywood Central Cikarang Bekasi 25,000 In Planning
Embarcadero Bintaro Tangerang 40,000 In Planning
Grand Dhika City Mall Bekasi Bekasi 24,000 In Planning
Sawangan Mall Sawangan Depok In Planning
2018
Kota Harapan Indah Bekasi Bekasi 51,000 In planning
Lippo Grand Mall Karawaci Tangerang 120,000 In planning
AEON Mall Sentul Sentul Bogor 15,000 In planning
Source: Colliers International Indonesia - Research
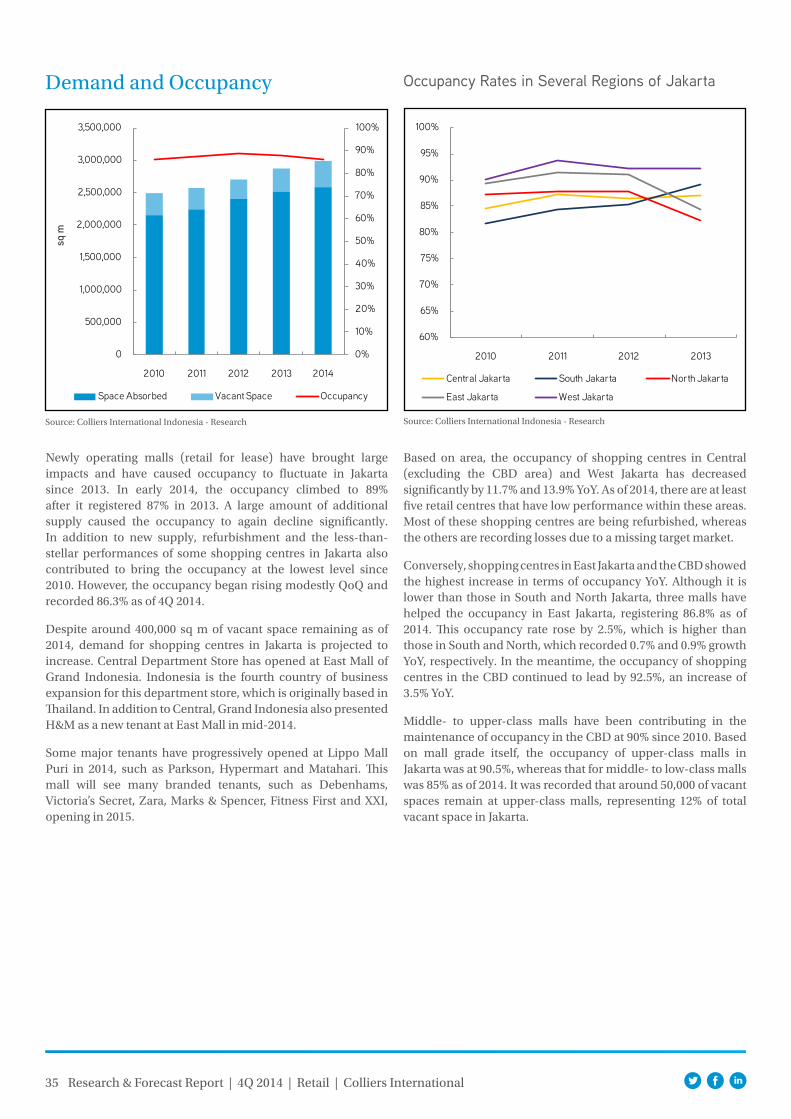
35 Research & Forecast Report | 4Q 2014 | Retail | Colliers International
Demand and Occupancy
Source: Colliers International Indonesia - Research
Newly operating malls (retail for lease) have brought large impacts and have caused occupancy to fluctuate in Jakarta since 2013. In early 2014, the occupancy climbed to 89% after it registered 87% in 2013. A large amount of additional supply caused the occupancy to again decline significantly. In addition to new supply, refurbishment and the less-than-stellar performances of some shopping centres in Jakarta also contributed to bring the occupancy at the lowest level since 2010. However, the occupancy began rising modestly QoQ and recorded 86.3% as of 4Q 2014.
Despite around 400,000 sq m of vacant space remaining as of 2014, demand for shopping centres in Jakarta is projected to increase. Central Department Store has opened at East Mall of Grand Indonesia. Indonesia is the fourth country of business expansion for this department store, which is originally based in Thailand. In addition to Central, Grand Indonesia also presented H&M as a new tenant at East Mall in mid-2014.
Some major tenants have progressively opened at Lippo Mall Puri in 2014, such as Parkson, Hypermart and Matahari. This mall will see many branded tenants, such as Debenhams, Victoria’s Secret, Zara, Marks & Spencer, Fitness First and XXI, opening in 2015.
Occupancy Rates in Several Regions of Jakarta
Source: Colliers International Indonesia - Research
Based on area, the occupancy of shopping centres in Central (excluding the CBD area) and West Jakarta has decreased significantly by 11.7% and 13.9% YoY. As of 2014, there are at least five retail centres that have low performance within these areas. Most of these shopping centres are being refurbished, whereas the others are recording losses due to a missing target market.
Conversely, shopping centres in East Jakarta and the CBD showed the highest increase in terms of occupancy YoY. Although it is lower than those in South and North Jakarta, three malls have helped the occupancy in East Jakarta, registering 86.8% as of 2014. This occupancy rate rose by 2.5%, which is higher than those in South and North, which recorded 0.7% and 0.9% growth YoY, respectively. In the meantime, the occupancy of shopping centres in the CBD continued to lead by 92.5%, an increase of 3.5% YoY.
Middle- to upper-class malls have been contributing in the maintenance of occupancy in the CBD at 90% since 2010. Based on mall grade itself, the occupancy of upper-class malls in Jakarta was at 90.5%, whereas that for middle- to low-class malls was 85% as of 2014. It was recorded that around 50,000 of vacant spaces remain at upper-class malls, representing 12% of total vacant space in Jakarta.
0%
10%
20%
30%
40%
50%
60%
70%
80%
90%
100%
0
500,000
1,000,000
1,500,000
2,000,000
2,500,000
3,000,000
3,500,000
2010 2011 2012 2013 2014
sq m
Space Absorbed Vacant Space Occupancy
60%
65%
70%
75%
80%
85%
90%
95%
100%
2010 2011 2012 2013
Central Jakarta South Jakarta North Jakarta
East Jakarta West Jakarta
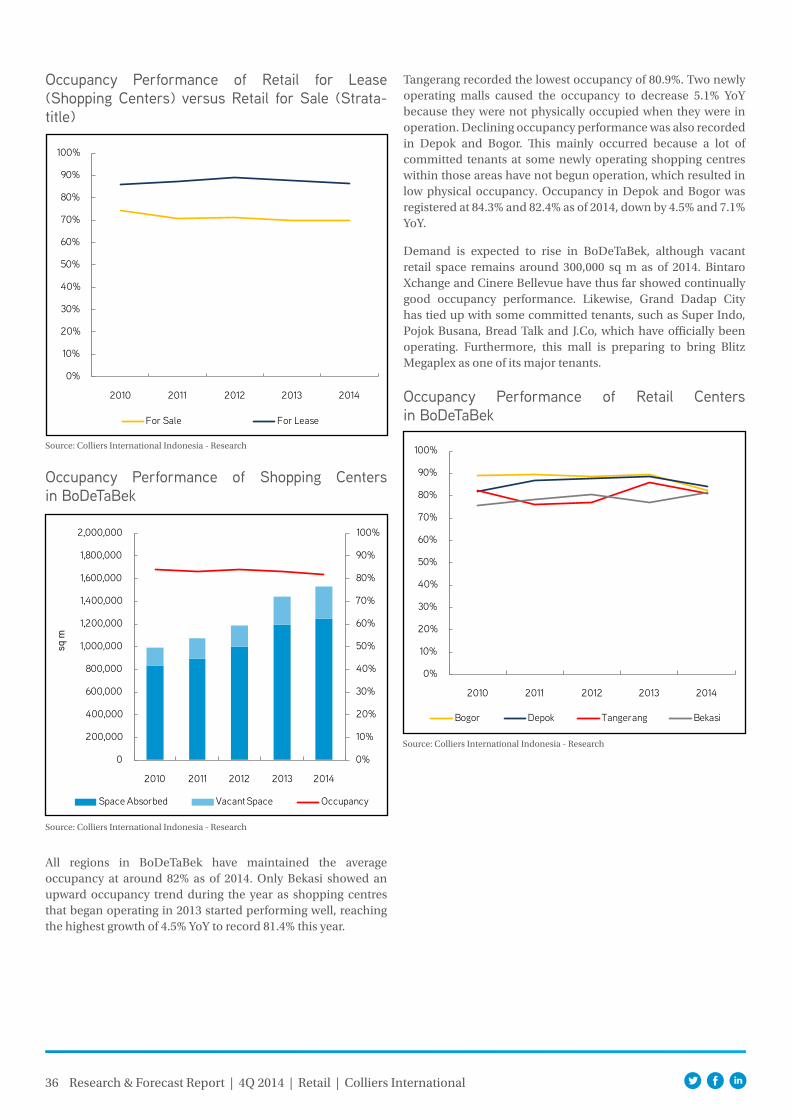
36 Research & Forecast Report | 4Q 2014 | Retail | Colliers International
Occupancy Performance of Retail for Lease (Shopping Centers) versus Retail for Sale (Strata-title)
Source: Colliers International Indonesia - Research
Tangerang recorded the lowest occupancy of 80.9%. Two newly operating malls caused the occupancy to decrease 5.1% YoY because they were not physically occupied when they were in operation. Declining occupancy performance was also recorded in Depok and Bogor. This mainly occurred because a lot of committed tenants at some newly operating shopping centres within those areas have not begun operation, which resulted in low physical occupancy. Occupancy in Depok and Bogor was registered at 84.3% and 82.4% as of 2014, down by 4.5% and 7.1% YoY.
Demand is expected to rise in BoDeTaBek, although vacant retail space remains around 300,000 sq m as of 2014. Bintaro Xchange and Cinere Bellevue have thus far showed continually good occupancy performance. Likewise, Grand Dadap City has tied up with some committed tenants, such as Super Indo, Pojok Busana, Bread Talk and J.Co, which have officially been operating. Furthermore, this mall is preparing to bring Blitz Megaplex as one of its major tenants.
0%
10%
20%
30%
40%
50%
60%
70%
80%
90%
100%
2010 2011 2012 2013 2014
For Sale For Lease
Occupancy Performance of Shopping Centers in BoDeTaBek
Source: Colliers International Indonesia - Research
0%
10%
20%
30%
40%
50%
60%
70%
80%
90%
100%
0
200,000
400,000
600,000
800,000
1,000,000
1,200,000
1,400,000
1,600,000
1,800,000
2,000,000
2010 2011 2012 2013 2014
sq m
Space Absorbed Vacant Space Occupancy
All regions in BoDeTaBek have maintained the average occupancy at around 82% as of 2014. Only Bekasi showed an upward occupancy trend during the year as shopping centres that began operating in 2013 started performing well, reaching the highest growth of 4.5% YoY to record 81.4% this year.
0%
10%
20%
30%
40%
50%
60%
70%
80%
90%
100%
2010 2011 2012 2013 2014
Bogor Depok Tangerang Bekasi
Source: Colliers International Indonesia - Research
Occupancy Performance of Retail Centers in BoDeTaBek
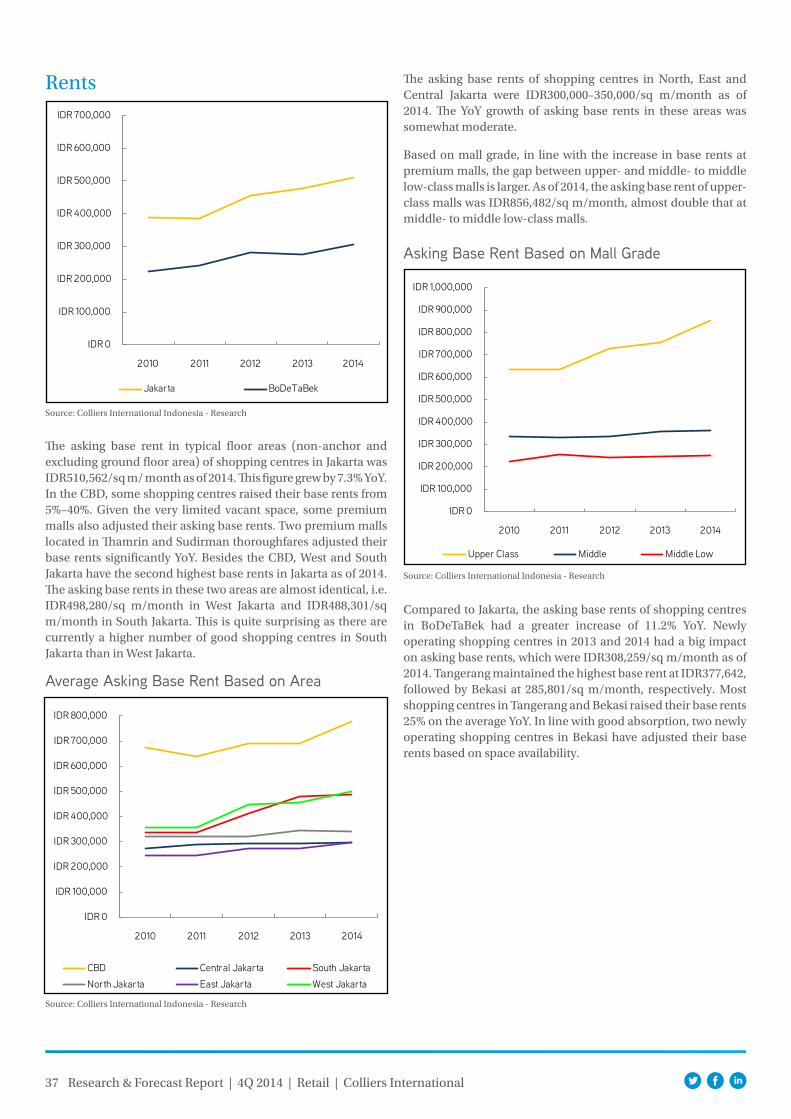
37 Research & Forecast Report | 4Q 2014 | Retail | Colliers International
Rents The asking base rents of shopping centres in North, East and Central Jakarta were IDR300,000–350,000/sq m/month as of 2014. The YoY growth of asking base rents in these areas was somewhat moderate.
Based on mall grade, in line with the increase in base rents at premium malls, the gap between upper- and middle- to middle low-class malls is larger. As of 2014, the asking base rent of upper-class malls was IDR856,482/sq m/month, almost double that at middle- to middle low-class malls.
The asking base rent in typical floor areas (non-anchor and excluding ground floor area) of shopping centres in Jakarta was IDR510,562/sq m/ month as of 2014. This figure grew by 7.3% YoY. In the CBD, some shopping centres raised their base rents from 5%–40%. Given the very limited vacant space, some premium malls also adjusted their asking base rents. Two premium malls located in Thamrin and Sudirman thoroughfares adjusted their base rents significantly YoY. Besides the CBD, West and South Jakarta have the second highest base rents in Jakarta as of 2014. The asking base rents in these two areas are almost identical, i.e. IDR498,280/sq m/month in West Jakarta and IDR488,301/sq m/month in South Jakarta. This is quite surprising as there are currently a higher number of good shopping centres in South Jakarta than in West Jakarta.
Asking Base Rent Based on Mall Grade
Source: Colliers International Indonesia - Research
Compared to Jakarta, the asking base rents of shopping centres in BoDeTaBek had a greater increase of 11.2% YoY. Newly operating shopping centres in 2013 and 2014 had a big impact on asking base rents, which were IDR308,259/sq m/month as of 2014. Tangerang maintained the highest base rent at IDR377,642, followed by Bekasi at 285,801/sq m/month, respectively. Most shopping centres in Tangerang and Bekasi raised their base rents 25% on the average YoY. In line with good absorption, two newly operating shopping centres in Bekasi have adjusted their base rents based on space availability.
IDR 0
IDR 100,000
IDR 200,000
IDR 300,000
IDR 400,000
IDR 500,000
IDR 600,000
IDR 700,000
2010 2011 2012 2013 2014
Jakarta BoDeTaBek
Source: Colliers International Indonesia - Research
Average Asking Base Rent Based on Area
Source: Colliers International Indonesia - Research
IDR 0
IDR 100,000
IDR 200,000
IDR 300,000
IDR 400,000
IDR 500,000
IDR 600,000
IDR 700,000
IDR 800,000
IDR 900,000
IDR 1,000,000
2010 2011 2012 2013 2014
Upper Class Middle Middle Low
IDR 0
IDR 100,000
IDR 200,000
IDR 300,000
IDR 400,000
IDR 500,000
IDR 600,000
IDR 700,000
IDR 800,000
2010 2011 2012 2013 2014
CBD Central Jakarta South Jakarta
North Jakarta East Jakarta West Jakarta
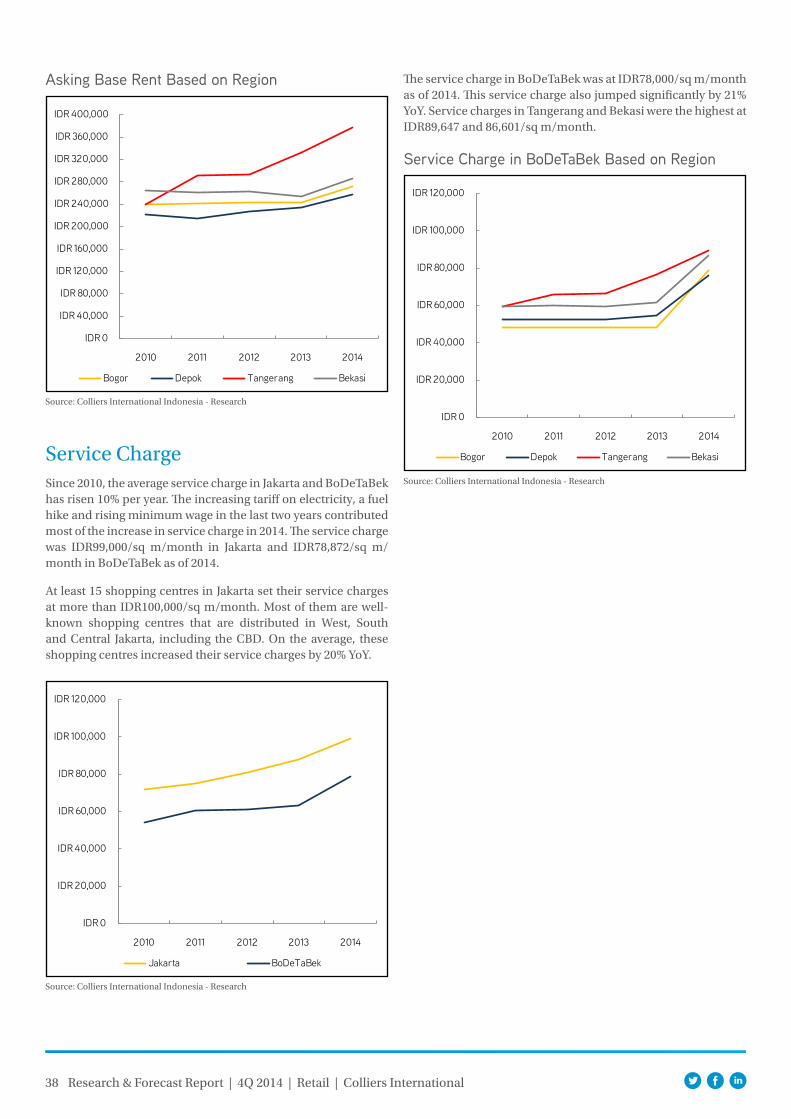
38 Research & Forecast Report | 4Q 2014 | Retail | Colliers International
Service Charge
The service charge in BoDeTaBek was at IDR78,000/sq m/month as of 2014. This service charge also jumped significantly by 21% YoY. Service charges in Tangerang and Bekasi were the highest at IDR89,647 and 86,601/sq m/month.
Asking Base Rent Based on Region
IDR 0
IDR 40,000
IDR 80,000
IDR 120,000
IDR 160,000
IDR 200,000
IDR 240,000
IDR 280,000
IDR 320,000
IDR 360,000
IDR 400,000
2010 2011 2012 2013 2014
Bogor Depok Tangerang Bekasi
Source: Colliers International Indonesia - Research
Since 2010, the average service charge in Jakarta and BoDeTaBek has risen 10% per year. The increasing tariff on electricity, a fuel hike and rising minimum wage in the last two years contributed most of the increase in service charge in 2014. The service charge was IDR99,000/sq m/month in Jakarta and IDR78,872/sq m/month in BoDeTaBek as of 2014.
At least 15 shopping centres in Jakarta set their service charges at more than IDR100,000/sq m/month. Most of them are well-known shopping centres that are distributed in West, South and Central Jakarta, including the CBD. On the average, these shopping centres increased their service charges by 20% YoY.
IDR 0
IDR 20,000
IDR 40,000
IDR 60,000
IDR 80,000
IDR 100,000
IDR 120,000
2010 2011 2012 2013 2014
Jakarta BoDeTaBek
Source: Colliers International Indonesia - Research
Service Charge in BoDeTaBek Based on Region
Source: Colliers International Indonesia - Research
IDR 0
IDR 20,000
IDR 40,000
IDR 60,000
IDR 80,000
IDR 100,000
IDR 120,000
2010 2011 2012 2013 2014
Bogor Depok Tangerang Bekasi
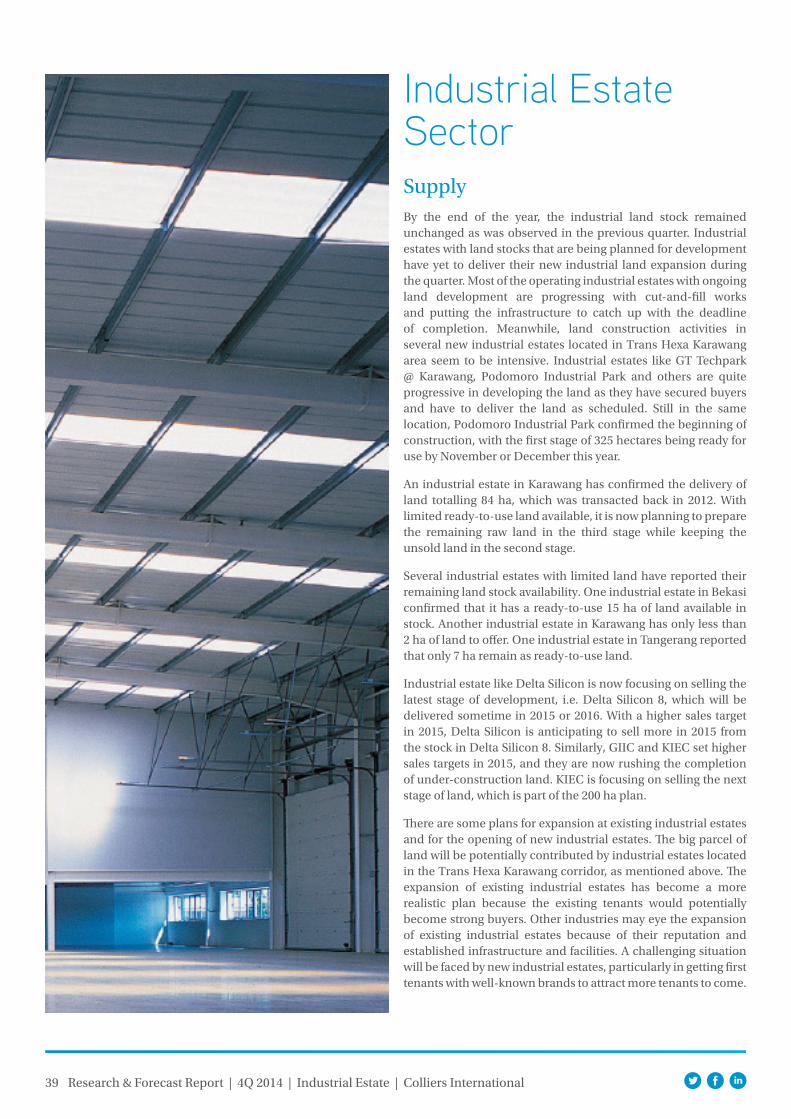
39
Industrial Estate SectorSupplyBy the end of the year, the industrial land stock remained unchanged as was observed in the previous quarter. Industrial estates with land stocks that are being planned for development have yet to deliver their new industrial land expansion during the quarter. Most of the operating industrial estates with ongoing land development are progressing with cut-and-fill works and putting the infrastructure to catch up with the deadline of completion. Meanwhile, land construction activities in several new industrial estates located in Trans Hexa Karawang area seem to be intensive. Industrial estates like GT Techpark @ Karawang, Podomoro Industrial Park and others are quite progressive in developing the land as they have secured buyers and have to deliver the land as scheduled. Still in the same location, Podomoro Industrial Park confirmed the beginning of construction, with the first stage of 325 hectares being ready for use by November or December this year.
An industrial estate in Karawang has confirmed the delivery of land totalling 84 ha, which was transacted back in 2012. With limited ready-to-use land available, it is now planning to prepare the remaining raw land in the third stage while keeping the unsold land in the second stage.
Several industrial estates with limited land have reported their remaining land stock availability. One industrial estate in Bekasi confirmed that it has a ready-to-use 15 ha of land available in stock. Another industrial estate in Karawang has only less than 2 ha of land to offer. One industrial estate in Tangerang reported that only 7 ha remain as ready-to-use land.
Industrial estate like Delta Silicon is now focusing on selling the latest stage of development, i.e. Delta Silicon 8, which will be delivered sometime in 2015 or 2016. With a higher sales target in 2015, Delta Silicon is anticipating to sell more in 2015 from the stock in Delta Silicon 8. Similarly, GIIC and KIEC set higher sales targets in 2015, and they are now rushing the completion of under-construction land. KIEC is focusing on selling the next stage of land, which is part of the 200 ha plan.
There are some plans for expansion at existing industrial estates and for the opening of new industrial estates. The big parcel of land will be potentially contributed by industrial estates located in the Trans Hexa Karawang corridor, as mentioned above. The expansion of existing industrial estates has become a more realistic plan because the existing tenants would potentially become strong buyers. Other industries may eye the expansion of existing industrial estates because of their reputation and established infrastructure and facilities. A challenging situation will be faced by new industrial estates, particularly in getting first tenants with well-known brands to attract more tenants to come.
Research & Forecast Report | 4Q 2014 | Industrial Estate | Colliers International
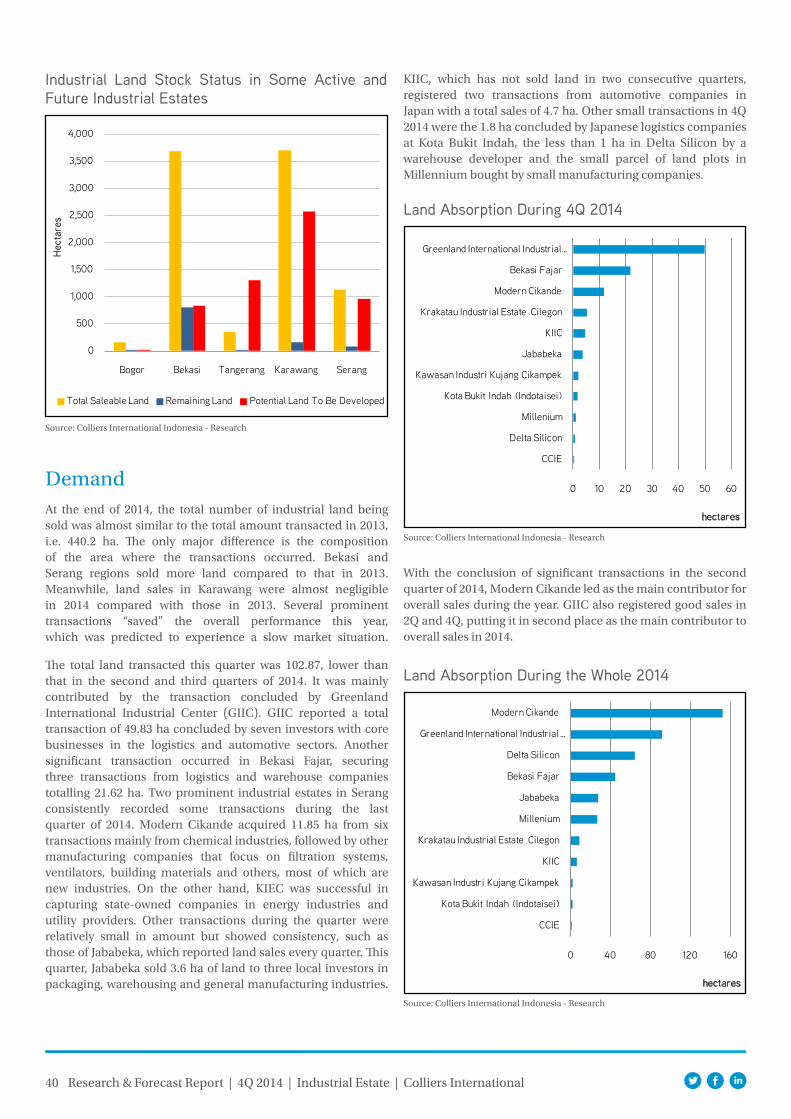
40 Research & Forecast Report | 4Q 2014 | Industrial Estate | Colliers International
DemandAt the end of 2014, the total number of industrial land being sold was almost similar to the total amount transacted in 2013, i.e. 440.2 ha. The only major difference is the composition of the area where the transactions occurred. Bekasi and Serang regions sold more land compared to that in 2013. Meanwhile, land sales in Karawang were almost negligible in 2014 compared with those in 2013. Several prominent transactions “saved” the overall performance this year, which was predicted to experience a slow market situation.
The total land transacted this quarter was 102.87, lower than that in the second and third quarters of 2014. It was mainly contributed by the transaction concluded by Greenland International Industrial Center (GIIC). GIIC reported a total transaction of 49.83 ha concluded by seven investors with core businesses in the logistics and automotive sectors. Another significant transaction occurred in Bekasi Fajar, securing three transactions from logistics and warehouse companies totalling 21.62 ha. Two prominent industrial estates in Serang consistently recorded some transactions during the last quarter of 2014. Modern Cikande acquired 11.85 ha from six transactions mainly from chemical industries, followed by other manufacturing companies that focus on filtration systems, ventilators, building materials and others, most of which are new industries. On the other hand, KIEC was successful in capturing state-owned companies in energy industries and utility providers. Other transactions during the quarter were relatively small in amount but showed consistency, such as those of Jababeka, which reported land sales every quarter. This quarter, Jababeka sold 3.6 ha of land to three local investors in packaging, warehousing and general manufacturing industries.
Industrial Land Stock Status in Some Active and Future Industrial Estates
Source: Colliers International Indonesia - Research
Land Absorption During 4Q 2014
Source: Colliers International Indonesia - Research
0
500
1,000
1,500
2,000
2,500
3,000
3,500
4,000
Bogor Bekasi Tangerang Karawang Serang
Hec
tare
s
Total Saleable Land Remaining Land Potential Land To Be Developed
KIIC, which has not sold land in two consecutive quarters, registered two transactions from automotive companies in Japan with a total sales of 4.7 ha. Other small transactions in 4Q 2014 were the 1.8 ha concluded by Japanese logistics companies at Kota Bukit Indah, the less than 1 ha in Delta Silicon by a warehouse developer and the small parcel of land plots in Millennium bought by small manufacturing companies.
0 10 20 30 40 50 60
CCIE
Delta Silicon
Millenium
Kota Bukit Indah (Indotaisei)
Kawasan Industri Kujang Cikampek
Jababeka
KIIC
Krakatau Industrial Estate Cilegon
Modern Cikande
Bekasi Fajar
Greenland International Industrial …
hectares
With the conclusion of significant transactions in the second quarter of 2014, Modern Cikande led as the main contributor for overall sales during the year. GIIC also registered good sales in 2Q and 4Q, putting it in second place as the main contributor to overall sales in 2014.
Land Absorption During the Whole 2014
Source: Colliers International Indonesia - Research
0 40 80 120 160
CCIE
Kota Bukit Indah (Indotaisei)
Kawasan Industri Kujang Cikampek
KIIC
Krakatau Industrial Estate Cilegon
Millenium
Jababeka
Bekasi Fajar
Delta Silicon
Greenland International Industrial …
Modern Cikande
hectares
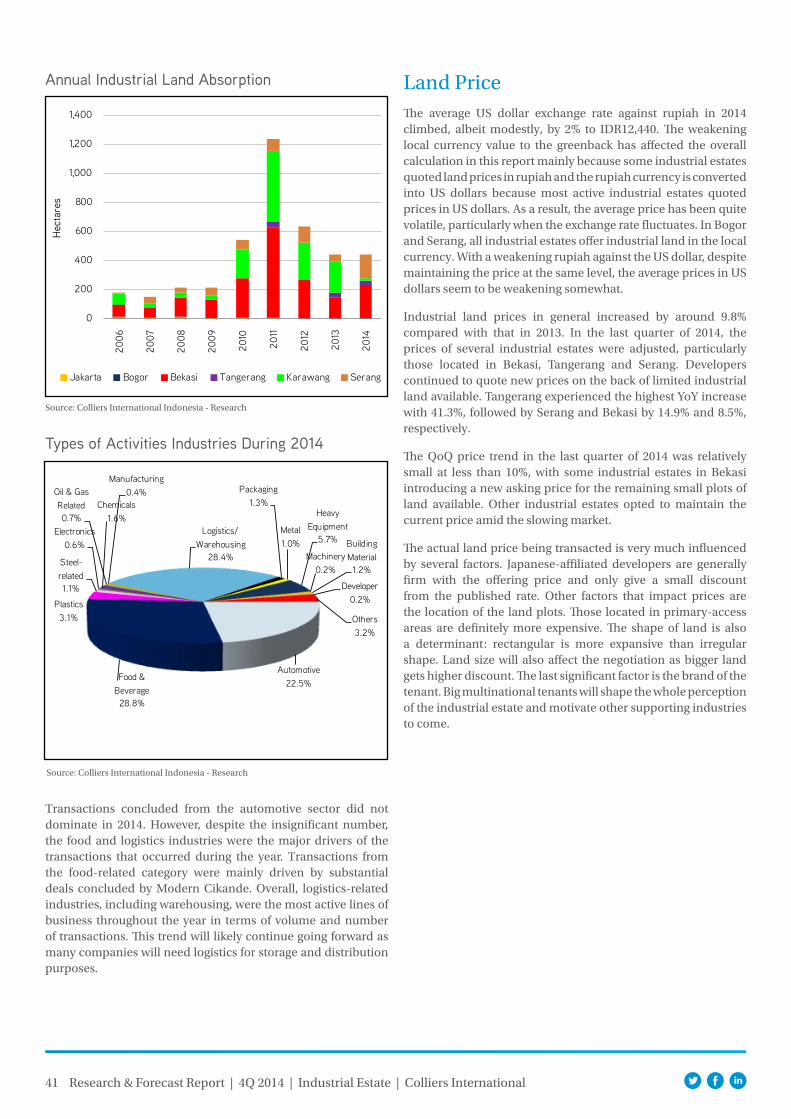
41 Research & Forecast Report | 4Q 2014 | Industrial Estate | Colliers International
Land Price The average US dollar exchange rate against rupiah in 2014 climbed, albeit modestly, by 2% to IDR12,440. The weakening local currency value to the greenback has affected the overall calculation in this report mainly because some industrial estates quoted land prices in rupiah and the rupiah currency is converted into US dollars because most active industrial estates quoted prices in US dollars. As a result, the average price has been quite volatile, particularly when the exchange rate fluctuates. In Bogor and Serang, all industrial estates offer industrial land in the local currency. With a weakening rupiah against the US dollar, despite maintaining the price at the same level, the average prices in US dollars seem to be weakening somewhat.
Industrial land prices in general increased by around 9.8% compared with that in 2013. In the last quarter of 2014, the prices of several industrial estates were adjusted, particularly those located in Bekasi, Tangerang and Serang. Developers continued to quote new prices on the back of limited industrial land available. Tangerang experienced the highest YoY increase with 41.3%, followed by Serang and Bekasi by 14.9% and 8.5%, respectively.
The QoQ price trend in the last quarter of 2014 was relatively small at less than 10%, with some industrial estates in Bekasi introducing a new asking price for the remaining small plots of land available. Other industrial estates opted to maintain the current price amid the slowing market.
The actual land price being transacted is very much influenced by several factors. Japanese-affiliated developers are generally firm with the offering price and only give a small discount from the published rate. Other factors that impact prices are the location of the land plots. Those located in primary-access areas are definitely more expensive. The shape of land is also a determinant: rectangular is more expansive than irregular shape. Land size will also affect the negotiation as bigger land gets higher discount. The last significant factor is the brand of the tenant. Big multinational tenants will shape the whole perception of the industrial estate and motivate other supporting industries to come.
Annual Industrial Land Absorption
Source: Colliers International Indonesia - Research
0
200
400
600
800
1,000
1,200
1,40020
06
2007
2008
2009
2010
2011
2012
2013
2014
Hec
tare
s
Jakarta Bogor Bekasi Tangerang Karawang Serang
Types of Activities Industries During 2014
Source: Colliers International Indonesia - Research
Automotive22.5%
Food & Beverage28.8%
Plastics3.1%
Steel-related1.1%
Electronics0.6%
Chemicals1.6%
Oil & Gas Related0.7%
Manufacturing0.4%
Logistics/Warehousing
28.4%
Packaging1.3%
Metal1.0%
Heavy Equipment
5.7%
Machinery0.2%
Building Material1.2%
Developer0.2%
Others3.2%
Transactions concluded from the automotive sector did not dominate in 2014. However, despite the insignificant number, the food and logistics industries were the major drivers of the transactions that occurred during the year. Transactions from the food-related category were mainly driven by substantial deals concluded by Modern Cikande. Overall, logistics-related industries, including warehousing, were the most active lines of business throughout the year in terms of volume and number of transactions. This trend will likely continue going forward as many companies will need logistics for storage and distribution purposes.
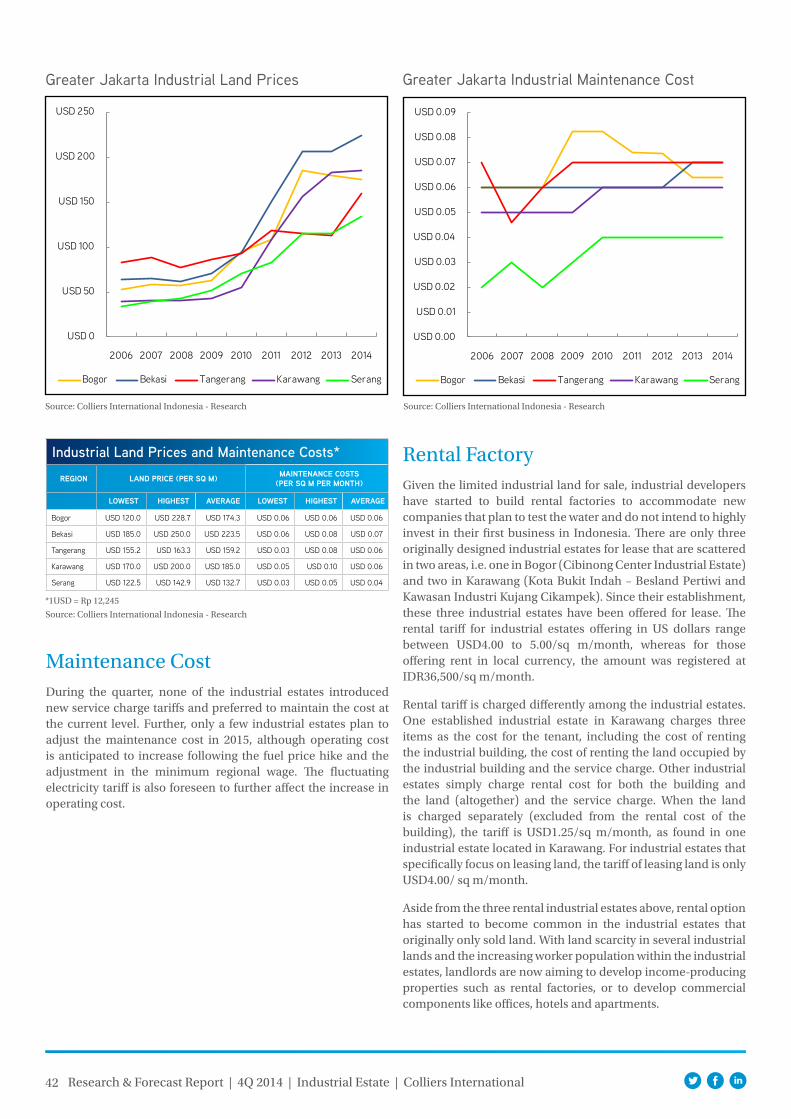
42 Research & Forecast Report | 4Q 2014 | Industrial Estate | Colliers International
Maintenance CostDuring the quarter, none of the industrial estates introduced new service charge tariffs and preferred to maintain the cost at the current level. Further, only a few industrial estates plan to adjust the maintenance cost in 2015, although operating cost is anticipated to increase following the fuel price hike and the adjustment in the minimum regional wage. The fluctuating electricity tariff is also foreseen to further affect the increase in operating cost.
Greater Jakarta Industrial Land Prices
Source: Colliers International Indonesia - Research
USD 0
USD 50
USD 100
USD 150
USD 200
USD 250
2006 2007 2008 2009 2010 2011 2012 2013 2014
Bogor Bekasi Tangerang Karawang Serang
Source: Colliers International Indonesia - Research
Industrial Land Prices and Maintenance Costs*region land price (per SQ m) maintenance coStS
(per SQ m per month)
loweSt higheSt average loweSt higheSt average
Bogor USD 120.0 USD 228.7 USD 174.3 USD 0.06 USD 0.06 USD 0.06
Bekasi USD 185.0 USD 250.0 USD 223.5 USD 0.06 USD 0.08 USD 0.07
Tangerang USD 155.2 USD 163.3 USD 159.2 USD 0.03 USD 0.08 USD 0.06
Karawang USD 170.0 USD 200.0 USD 185.0 USD 0.05 USD 0.10 USD 0.06
Serang USD 122.5 USD 142.9 USD 132.7 USD 0.03 USD 0.05 USD 0.04
*1USD = Rp 12,245
USD 0.00
USD 0.01
USD 0.02
USD 0.03
USD 0.04
USD 0.05
USD 0.06
USD 0.07
USD 0.08
USD 0.09
2006 2007 2008 2009 2010 2011 2012 2013 2014
Bogor Bekasi Tangerang Karawang Serang
Greater Jakarta Industrial Maintenance Cost
Rental FactoryGiven the limited industrial land for sale, industrial developers have started to build rental factories to accommodate new companies that plan to test the water and do not intend to highly invest in their first business in Indonesia. There are only three originally designed industrial estates for lease that are scattered in two areas, i.e. one in Bogor (Cibinong Center Industrial Estate) and two in Karawang (Kota Bukit Indah – Besland Pertiwi and Kawasan Industri Kujang Cikampek). Since their establishment, these three industrial estates have been offered for lease. The rental tariff for industrial estates offering in US dollars range between USD4.00 to 5.00/sq m/month, whereas for those offering rent in local currency, the amount was registered at IDR36,500/sq m/month.
Rental tariff is charged differently among the industrial estates. One established industrial estate in Karawang charges three items as the cost for the tenant, including the cost of renting the industrial building, the cost of renting the land occupied by the industrial building and the service charge. Other industrial estates simply charge rental cost for both the building and the land (altogether) and the service charge. When the land is charged separately (excluded from the rental cost of the building), the tariff is USD1.25/sq m/month, as found in one industrial estate located in Karawang. For industrial estates that specifically focus on leasing land, the tariff of leasing land is only USD4.00/ sq m/month.
Aside from the three rental industrial estates above, rental option has started to become common in the industrial estates that originally only sold land. With land scarcity in several industrial lands and the increasing worker population within the industrial estates, landlords are now aiming to develop income-producing properties such as rental factories, or to develop commercial components like offices, hotels and apartments.
Source: Colliers International Indonesia - Research
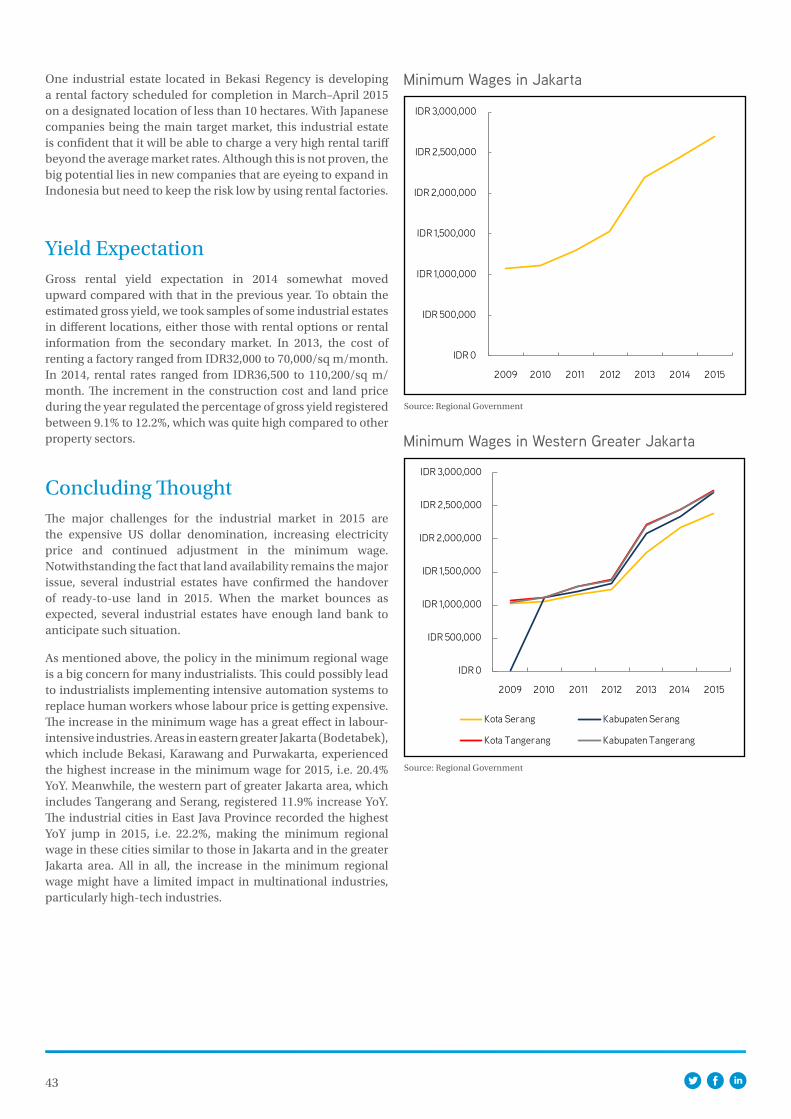
43
One industrial estate located in Bekasi Regency is developing a rental factory scheduled for completion in March–April 2015 on a designated location of less than 10 hectares. With Japanese companies being the main target market, this industrial estate is confident that it will be able to charge a very high rental tariff beyond the average market rates. Although this is not proven, the big potential lies in new companies that are eyeing to expand in Indonesia but need to keep the risk low by using rental factories.
Yield ExpectationGross rental yield expectation in 2014 somewhat moved upward compared with that in the previous year. To obtain the estimated gross yield, we took samples of some industrial estates in different locations, either those with rental options or rental information from the secondary market. In 2013, the cost of renting a factory ranged from IDR32,000 to 70,000/sq m/month. In 2014, rental rates ranged from IDR36,500 to 110,200/sq m/month. The increment in the construction cost and land price during the year regulated the percentage of gross yield registered between 9.1% to 12.2%, which was quite high compared to other property sectors.
Concluding ThoughtThe major challenges for the industrial market in 2015 are the expensive US dollar denomination, increasing electricity price and continued adjustment in the minimum wage. Notwithstanding the fact that land availability remains the major issue, several industrial estates have confirmed the handover of ready-to-use land in 2015. When the market bounces as expected, several industrial estates have enough land bank to anticipate such situation.
As mentioned above, the policy in the minimum regional wage is a big concern for many industrialists. This could possibly lead to industrialists implementing intensive automation systems to replace human workers whose labour price is getting expensive. The increase in the minimum wage has a great effect in labour-intensive industries. Areas in eastern greater Jakarta (Bodetabek), which include Bekasi, Karawang and Purwakarta, experienced the highest increase in the minimum wage for 2015, i.e. 20.4% YoY. Meanwhile, the western part of greater Jakarta area, which includes Tangerang and Serang, registered 11.9% increase YoY. The industrial cities in East Java Province recorded the highest YoY jump in 2015, i.e. 22.2%, making the minimum regional wage in these cities similar to those in Jakarta and in the greater Jakarta area. All in all, the increase in the minimum regional wage might have a limited impact in multinational industries, particularly high-tech industries.
Minimum Wages in Jakarta
IDR 0
IDR 500,000
IDR 1,000,000
IDR 1,500,000
IDR 2,000,000
IDR 2,500,000
IDR 3,000,000
2009 2010 2011 2012 2013 2014 2015
Source: Regional Government
Minimum Wages in Western Greater Jakarta
Source: Regional Government
IDR 0
IDR 500,000
IDR 1,000,000
IDR 1,500,000
IDR 2,000,000
IDR 2,500,000
IDR 3,000,000
2009 2010 2011 2012 2013 2014 2015
Kota Serang Kabupaten Serang
Kota Tangerang Kabupaten Tangerang
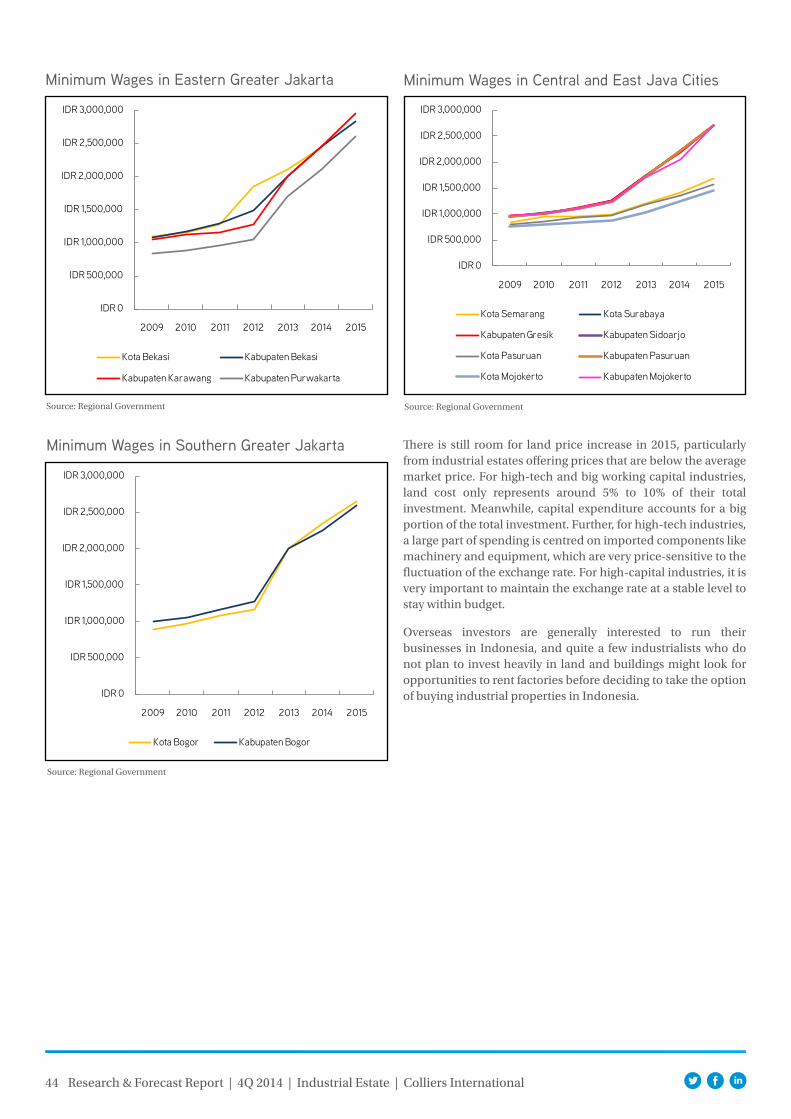
44 Research & Forecast Report | 4Q 2014 | Industrial Estate | Colliers International
Minimum Wages in Eastern Greater Jakarta
Source: Regional Government
IDR 0
IDR 500,000
IDR 1,000,000
IDR 1,500,000
IDR 2,000,000
IDR 2,500,000
IDR 3,000,000
2009 2010 2011 2012 2013 2014 2015
Kota Bekasi Kabupaten Bekasi
Kabupaten Karawang Kabupaten Purwakarta
Minimum Wages in Southern Greater Jakarta
Source: Regional Government
IDR 0
IDR 500,000
IDR 1,000,000
IDR 1,500,000
IDR 2,000,000
IDR 2,500,000
IDR 3,000,000
2009 2010 2011 2012 2013 2014 2015
Kota Bogor Kabupaten Bogor
Minimum Wages in Central and East Java Cities
Source: Regional Government
IDR 0
IDR 500,000
IDR 1,000,000
IDR 1,500,000
IDR 2,000,000
IDR 2,500,000
IDR 3,000,000
2009 2010 2011 2012 2013 2014 2015
Kota Semarang Kota Surabaya
Kabupaten Gresik Kabupaten Sidoarjo
Kota Pasuruan Kabupaten Pasuruan
Kota Mojokerto Kabupaten Mojokerto
There is still room for land price increase in 2015, particularly from industrial estates offering prices that are below the average market price. For high-tech and big working capital industries, land cost only represents around 5% to 10% of their total investment. Meanwhile, capital expenditure accounts for a big portion of the total investment. Further, for high-tech industries, a large part of spending is centred on imported components like machinery and equipment, which are very price-sensitive to the fluctuation of the exchange rate. For high-capital industries, it is very important to maintain the exchange rate at a stable level to stay within budget.
Overseas investors are generally interested to run their businesses in Indonesia, and quite a few industrialists who do not plan to invest heavily in land and buildings might look for opportunities to rent factories before deciding to take the option of buying industrial properties in Indonesia.
45 Research & Forecast Report | 4Q 2014 | Colliers International
Copyright © 2013 Colliers International.
The information contained herein has been obtained from sources deemed reliable. While every reasonable effort has been made to ensure its accuracy, we cannot guarantee it. No responsibility is assumed for any inaccuracies. Readers are encouraged to consult their professional advisors prior to acting on any of the material contained in this report.
About Colliers International
Colliers International is a global leader in commercial real estate services, with over 15,800 professionals operating out of more than 485 offices in 63 countries. A subsidiary of FirstService Corporation, Colliers International delivers a full range of services to real estate users, owners and investors worldwide, including global corporate solutions, brokerage, property and asset management, hotel investment sales and consulting, valuation, consulting and appraisal services, mortgage banking and insightful research. The latest annual survey by the Lipsey Company ranked Colliers International as the second-most recognized commercial real estate firm in the world.
colliers.com
Primary Authors:Ferry SalantoAssociate Director | Jakarta62 21 521 1400 ext [email protected]
Colliers International IndonesiaWorld Trade Centre 10th & 14th floorJalan Jenderal Sudirman Kav. 29 - 31Jakarta 12920Indonesia
TEL 62 21 521 1400
Accelerating success.
485 offices in 63 countries on 6 continentsUnited States: 146 Canada: 44 Latin America: 25 Asia: 38 ANZ: 148 EMEA: 84
$2.1billion in annual revenue
1.46billion square feet under management
15,800professionals and staff