Embed Size (px)
Citation preview
Biochem. J. (1994) 303, 907-914 (Printed in Great Britain)907
Vesicle-micelle structural transition of phosphatidylcholine bilayers andTriton X-100Alfonso DE LA MAZA* and Jose Luis PARRADepartamento de Tensioactivos, Centro de Investigacion y Desarrollo (C.I.D.), Consejo Superior de Investigacions Cientfficas (C.S.I.C.), C/. Jorge Girona, 18-26,08034 Barcelona, Spain
The structural transition stages induced by the interaction of thenon-ionic surfactant Triton X-100 on phosphatidylcholine uni-lamellar vesicles were studied by means of static and dynamiclight-scattering, transmission-electron-microscopy (t.e.m.) andpermeability changes. A linear correlation was observed betweenthe effective surfactant/lipid molar ratios (Re) ('three-stage'model proposed for the vesicle solubilization) and the surfactantconcentration throughout the process. However, this correlationwas not noted for the partition coefficients of the surfactantbetween the bilayer and the aqueous medium (K). Thus a sharpinitial K increase was observed until a maximum value was
achieved for permeability alterations of 500% (initial step ofbilayer saturation). Further surfactant additions resulted in a fallin the K values until 100% of bilayer permeability. Additionalamounts of surfactant led to an increase in K until bilayersolubilization. Hence, a preferential incorporation of surfactantmolecules into liposomes governs the initial interaction steps,leading to the initial stage of bilayer saturation with a freesurfactant concentration that was lower than its critical micelleconcentration (c.m.c.). Additional amounts of surfactant in-creased the free surfactant until the c.m.c. was reached, afterwhich solubilization started to occur. Thus the initial step of
bilayer saturation was achieved for a smaller surfactant concen-
tration than that for the Resat' although this concentration was
the minimum needed for solubilization to start. Large unilamellarvesicles began to form as the surfactant exceeded 15 mol%(50% bilayer permeability), the maximum vesicle growth beingattained for 22 mol% (400 nm). Thereafter, static light-scatteringstarted to decrease gradually, this fall being more pronouncedafter 40 mol %. The t.e.m. picture for 40 mol% (Resat.) showedunilamellar vesicles, although with traces of smaller structures.From 50 mol% the size distribution curves began to show a
bimodal distribution. The t.e.m. pictures for 50-64 mol% re-
vealed tubular structures, together with open bilayer fragments.Thereafter, increasing amounts of surfactant (65-69 mol %) ledto planar multilayered structures which gradually tended to formconcentric and helicoidal conformations. The scattered intensitydecreased to a low constant value at more than 71-72 mol%.However, the surfactant concentration for the Resol (72.6 mol %)still presented traces of aggregated structures, albeit with mono-modal size-distribution curves (particle size of 50 nm). Thisvesicle size corresponded to the liposome solubilization viamixed-micelle formation.
INTRODUCTION
Many studies have been devoted to the understanding of theprinciples governing the interaction of surfactants withphospholipid bilayers which leads to the breakdown of lamellarstructures and the formation of lipid-surfactant mixed micelles[1-7]. A significant contribution has been made by Lichtenberg[8], who postulated that the critical effective surfactant/lipidratio (Re) producing saturation and solubilization depends on
the surfactant critical micellar concentration (c.m.c.) and on thebilayer/aqueous medium distribution coefficients (K) rather thanon the nature of the surfactants. Moreover, Lichtenberg [8]expressed the need for experimental data on the distributioncoefficients at sub-solubilizing surfactant concentrations to ob-tain complementary information on this complex phenomenon.The solubilization and reconstitution of lipid bilayers by
surfactants have been the subject of a number of mechanisticspeculations where open bilayer fragments appear as crucialintermediates both in the closure [9-11] and solubilizationprocesses [6,12]. The mechanisms on this transition are far fromunderstood, since a detailed description of the process has yet tobe given. The non-ionic surfactant Triton X-100 has, because ofits properties as a good solubilization agent for membraneproteins, been the subject of a number of studies [13-16]. In
earlier papers we studied some parameters implicated in theinteraction of surfactants with liposomes at subsolubilizing andsolubilizing concentrations [17-19]. In the present work we seekto extend our investigations by characterizing in detail theoverall process involved in the interaction of a Triton X-100 withphosphatidylcholine (PC) neutral liposomes, at both sub-solubilizing and solubilizing levels. To this end, we present t.e.m.pictures and vesicle-distribution curves of Triton X-100/phosphatidylcholine systems for different stages of this inter-action. This information, together with the comparative studyof the Re and Kparameters throughout the process, may enhanceour understanding of the complex phenomenon involved in thelamellar-to-micelle transition process of liposome solubilizationand reconstitution by surfactants.
EXPERIMENTALMaterialsPC was purified from egg lecithin (Merck, Darmstadt, Germany)by the method of Singleton [20] and was shown to be pure byt.l.c. The non-ionic surfactant Triton X-100 (TX-100) octylphenolpolyethoxylated with 10 units of ethylene oxide and active matterof 100 %, was purchased from Rohm and Haas (Lyon, France).Pipes buffer obtained from Merck was prepared as 10 mM Pipes
Abbreviations used: t.e.m., transmission electron microscopy; c.m.c.,critical micelle concantration; PC, phosphatidylcholine; Tx-loo, Triton X-100; CF,5(6)-carboxyfluorescein; f.i.d., flame-ionization detection; P.l., polydispersity index.
* To whom correspondence should be sent.
907Biochem. J. (1994) 303, 907-914 (Printed in Great Britain)
908 A. de la Maza and J. L. Parra
adjusted to pH 7.20 with NaOH, containing 100 mM Na2SO4*Polycarbonate membranes and membrane holders were pur-chased from Nucleopore (Pleasanton, CA, U.S.A.). The startingmaterial 5(6)-carboxyfluorescein (CF) was obtained fromEastman Kodak (Rochester, NY, U.S.A.) and further purifiedby a column chromatographic method [21].
Methods
Liposome preparationUnilamellar liposomes of a defined size (about 200 nm) wereprepared by extrusion of large unilamellar vesicles previouslyobtained by reverse-phase evaporation [22,23]. A lipidic film wasformed by removing the organic solvent by rotatory evaporationfrom a solution of PC in chloroform. The lipid was thenredissolved in diethyl ether, and Pipes buffer was added to thesolution of phospholipid (supplemented with 10 mM CF dyewhen studying bilayer permeability). Gentle sonication led to theformation of a W/O-type emulsion. After evaporation of thediethyl ether under reduced pressure a viscous gel was formed.Elimination of the final traces of the organic solvent at highvacuum transformed the gel into a liposome suspension in whichno traces of ether were detectable by n.m.r. [24]. Unilamellarvesicles were obtained by extrusion ofvesicle suspensions through800-200 nm polycarbonate membranes to achieve a uniform sizedistribution [25]. To study the bilayer permeability changes,vesicles containing CF were freed of unencapsulated fluorescentdye by passage through Sephadex G-50 medium resin(Pharmacia, Uppsala, Sweden) by column chromatography.The range of phospholipid concentration in liposomes was0.5-5.0 mM.
Determination of lipid bilayer concentration and particle size distributionThe phospholipid concentration (PL) of liposomes was de-termined using t.l.c. coupled to an automated flame-ionization-detection (f.i.d.) system (latroscan MK-5; latron Lab., Tokyo,Japan) [26].The vesicle size distribution and the polydispersity index (P.I.)
of liposomes after preparation and during the interaction withTX-100 was determined with a Photon correlator spectrometer(Malvern Autosizer 4700c PS/MV). The studies were made byparticle-number measurement at 25 °C and with a lecture angleof 900. After preparation, vesicle-size distribution varied verylittle (PC concentration from 0.5-5.0 mM), showing in all casesa similar value of about 200 nm (P.I.) lower than 0.1, therebyindicating that the size distribution was very homogeneous.
Solubilizing parametersWhen defining the parameters related to the solubilization ofliposomes it is essential to consider that the mixing of lipids andsurfactants is not ideal due to the specific interactions betweenboth components, which has been demonstrated for a variety ofamphiphiles [27,28]. In order to evaluate the alterations causedby the TX-100 on lipid bilayers, the effective surfactant/PL molarratio Re in an aggregate (liposome or micelle) is defined asfollows [8]:
R [total surfactant]-[surfactant monomer] (1)[total PL] - [PL monomer]
The second term of the denominator is negligible due to the lowsolubility of PL in water. Likewise, it is generally admitted thatan equilibrium partition of surfactants between bilayer and the
aqueous medium governs the incorporation of surfactants intoliposomes, thereby producing saturation and solubilization ofthese structures.
In the analysis of the equilibrium-partition model proposed bySchurtenberger [29] for bile salt/lecithin systems, Lichtenberg [8]and Almog et al. [5] have shown that, for a mixing of lipids [ata PL concentration PL (mM)] and surfactant [at a concentrationST (mM)], in dilute aqueous media, the distribution of surfactantbetween lipid bilayers and aqueous media obeys a partitioncoefficient K, given (in mM-1) by:
K= SB(PL+ SB) * SW
(2)
where SB is the concentration of surfactant in the bilayers (mM)and S, is the surfactant concentration in the aqueous medium(mM). For PL > SB the definition of K, as given by Schurten-berger [29], applies:
K= SB Re(PL Sw) Sw
(3)
where Re is the above-mentioned ratio of surfactant tophospholipid in the vesicle bilayer: Re = SB/PL. Under anyother conditions, eqn. (2) has to be employed to define K; thisyields:
K= RE
S, (I + Re)(4)
This approach is consistent with the experimental data offered byLichtenberg [8] and Almog [5] for different surfactant phospho-lipid mixtures over wide ranges of Re values. Given that therange of phospholipid concentrations used in our investigation issimilar to that used by Almog [5] to test his equilibrium partitionmodel, the Kparameter has been determined using this equation.The determination of the S, and Re parameters can be carried
out on the basis of the linear dependence existing between thesurfactant concentrations required to achieve these parametersand the phospholipid concentration in liposomes which can bedescribed by the equation:
ST= SW+RevPL (5)where the Re and the aqueous concentration of surfactant (Sw)are in each curve respectively the slope and the ordinate at theorigin (zero phospholipid concentration).
The surface tensions of buffered solutions containing in-creasing concentrations of TX-100 were measured by the ringmethod [30] using a Kruss tensiometer. The c.m.c. was determinedfrom the abrupt change in the slope of the surface tension valuesversus surfactant concentration.
Permeability alterations and solubilization of liposomesThe permeability alterations caused by TX-100 were determined bymonitoring the increase in the fluorescence intensity of theliposome suspension due to the CF released from the interior ofvesicles to the bulk aqueous phase [21]. Fluorescence measure-ments were made with a Shimadzu RF-540 spectrofluorophoto-meter. On excitation at 495 nm, a fluorescence maximumemission of CF was obtained at 515.4nm. The fluorescenceintensity measurements were taken at 25 'C. The percentage ofCF released was calculated by means of the equation:
%CF release = 't'1 100 (6)io IO
Solubilization of phosphatidylcholine vesicles by Triton X-100
where I, is the initial fluorescence intensity ofCF-loaded liposomesuspension in the absence of surfactant, and I, is the fluorescenceintensity measured 30 min after adding the surfactant solution toa liposome suspension. This interval was chosen as the minimumperiod of time needed to achieve a constant rate ofCF release forthe lipid concentration range used (0.5-5.0 mM). The exper-imental determination of this interval of time is indicated in theResults and discussion section. I. corresponds to the fluorescenceintensity remaining after the destruction of liposomes.With regard to liposome solubilization, it has been previously
demonstrated [31] that static light-scattering constituted a veryconvenient technique for the quantitative study of the bilayersolubilization by surfactants. Accordingly, the solubilizing per-turbation produced by TX-100 in PC liposomes was monitoredusing this technique. The overall solubilization can be mainlycharacterized by three parameters termed Re,.t, Re50% and Re801,according to the nomenclature adopted by Lichtenberg [32]corresponding to the Re ratios at which light-scattering starts todecrease, reaches 50% of the original value and shows no furtherdecrease. These parameters corresponded to the Tx-loo/lipidmolar ratios at which the surfactant: (a) saturated liposomes, (b)resulted in a 50% solubilization of bilayers and (c) led to acomplete solubilization of these structures.
Liposomes were adjusted to the adequate lipid concentration(from 1.0 to 10.0 mM). Equal volumes of the adequate surfactantsolutions were added to these liposomes and the resultingmixtures were left to equilibrate for 24 h. This time was chosenas the optimum period needed to achieve a complete equilibriumsurfactant/liposome for the lipid concentration range used [31].
Light-scattering measurements were made using the spectro-fluorophotometer at 25 °C with both monochromators adjustedto 500 nm. The assays were carried out in triplicate and theresults given are the average of those obtained.
Electron microscopyA Hitachi H-600AB transmission electron microscope operatingat 75 kV was used. Carbon-coated copper/palladium grids G-400 mesh, 0.5 Taab with 0.5% E 950 collodium films in n-pentylacetate were employed. A drop of the vesicular solution wassucked off the grid and, after 1 min, removed with filter paperdown to a thin film. Negative staining with a drop of a 1%solution of uranyl acetate was performed. After 1 min this dropwas again removed with filter paper and the resulting stained filmwas dried in a dust-free place.
RESULTS AND DISCUSSIONParameters Involved In the Tx.1,-4iposomes InteracftonIt is known that, in surfactant/lipid systems, complete equi-librium may take several hours [8,31]. However, in subsolubilizinginteractions a substantial part of the surfactant effect takes placewithin approx. 30 min after its addition to the liposomes [14].
In order to determine the time needed to obtain a constant rateof CF release of liposomes in the range of the phospholipidconcentration investigated (0.5-5.0 mM), a kinetic study of theinteraction of liposomes with Triton X-100 was carried out.Liposome suspensions were treated with different concentrationsofTriton X-100 at subsolubilizing concentrations and subsequentchanges in permeability were studied as a function of time. Thepermeability kinetics were similar for each system tested: about30 min was needed to achieve a constant rate of CF release.Hence, changes in permeability were studied 30 min after addition
of surfactant to the liposomes at 25 'C. The CF release ofliposome suspensions in the absence of surfactant 30 min afterpreparation was negligible.
In order to determine the partition coefficients of surfactantbetween aqueous media and the lipid bilayers, a systematicinvestigation of liposome permeability changes caused by theaddition of surfactant was carried out. To this end, changes inthe CF released from liposomes versus surfactant concentrationwere determined 30 min after surfactant addition at 25 'C. Theresults obtained are plotted in Figure 1. The surfactant con-centrations resulting in different percentages of CF release wereobtained graphically and plotted versus the phospholipid con-centration. An acceptable linear relationship was established ineach case. The straight lines obtained correspond to the afore-mentioned eqn. (5) from which the Re and K parameters weredetermined. These results including the free surfactant con-centration Sw and the regression coefficients of the straight linesare given in Table 1. An increasing tendency of Re was observedas the percentage ofCF release increased. However, K reached amaximum value for the CF release of about 50 %. Furthermore,the Sv values increased as the percentage of CF released rose.Bearing in mind that the TX-100 c.m.c. experimentally obtainedwas 0.15 mM, the S, values were in all cases lower than its c.m.c.,thereby confirming that permeability alterations were determinedby the action of surfactant monomer.
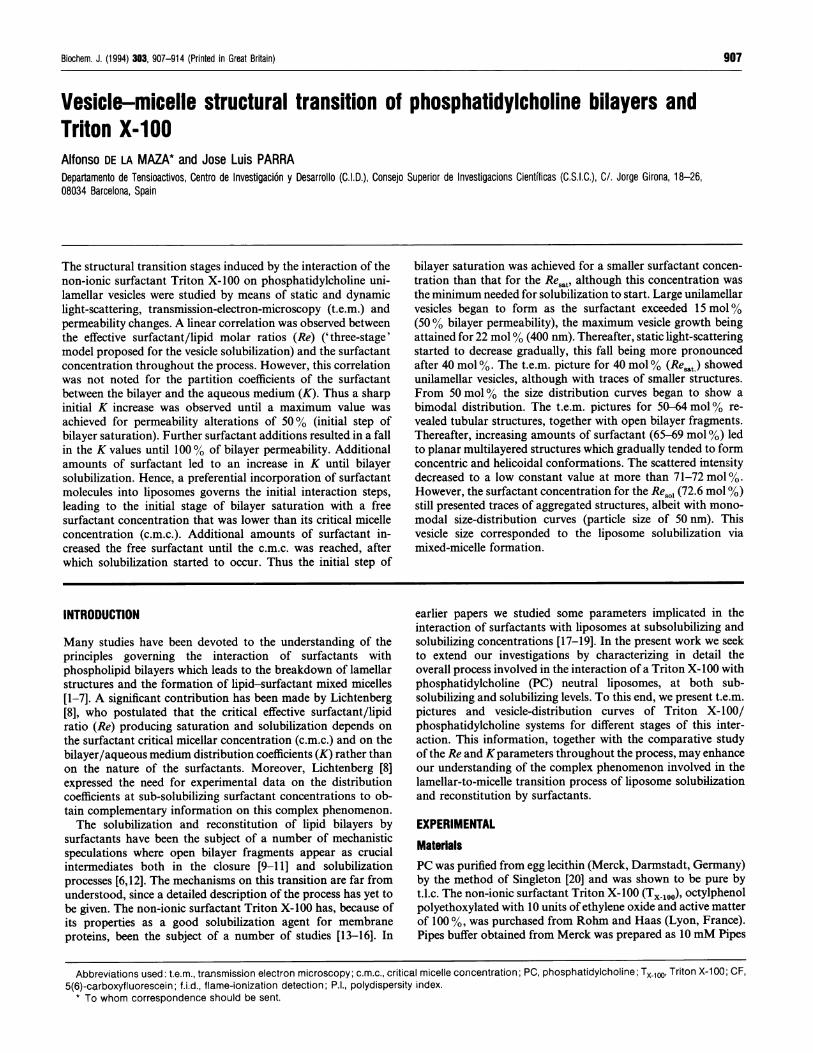
In accordance with the procedure described by Urbaneja [31],the TX 0oo-liposomes solubilizing interaction was studied throughthe changes in the static light scattered by these systems 24 hoursafter the addition of surfactant. Figure 2 shows the solubilizationcurves of liposome suspensions (lipid concentration 0.5-5.0 mM)arising from the addition of increasing amounts of TX-100- At lowsurfactant concentration an initial increase in the static light-scattering was observed, in all cases due to the incorporation ofsurfactant molecules into bilayers, the maximum values beingreached for bilayer saturation. Increasing amounts of surfactantled to a fall in the scattered intensity until a low constant valuefor bilayer solubilization was attained. The surfactant con-centrations producing different light-scattering percentages wereobtained by graphical methods. Plotting the surfactant con-centration versus the lipid concentration, curves were obtained inwhich an acceptable linear relationship was also established ineach case. The corresponding Re and K parameters were de-termined from these straight lines (eqn. 5) and are also given in
70-E600): 50
u- 4003020
0.1[Surfactant] (mM)
Fgure 1 Percentage change In CF release Induced by TX.1@ on unflamellarPC liposomes, the bilayer lIpId concentration ranging from 0.5 to 5.0 mM
909
910 A. de la Maza and J. L. Parra
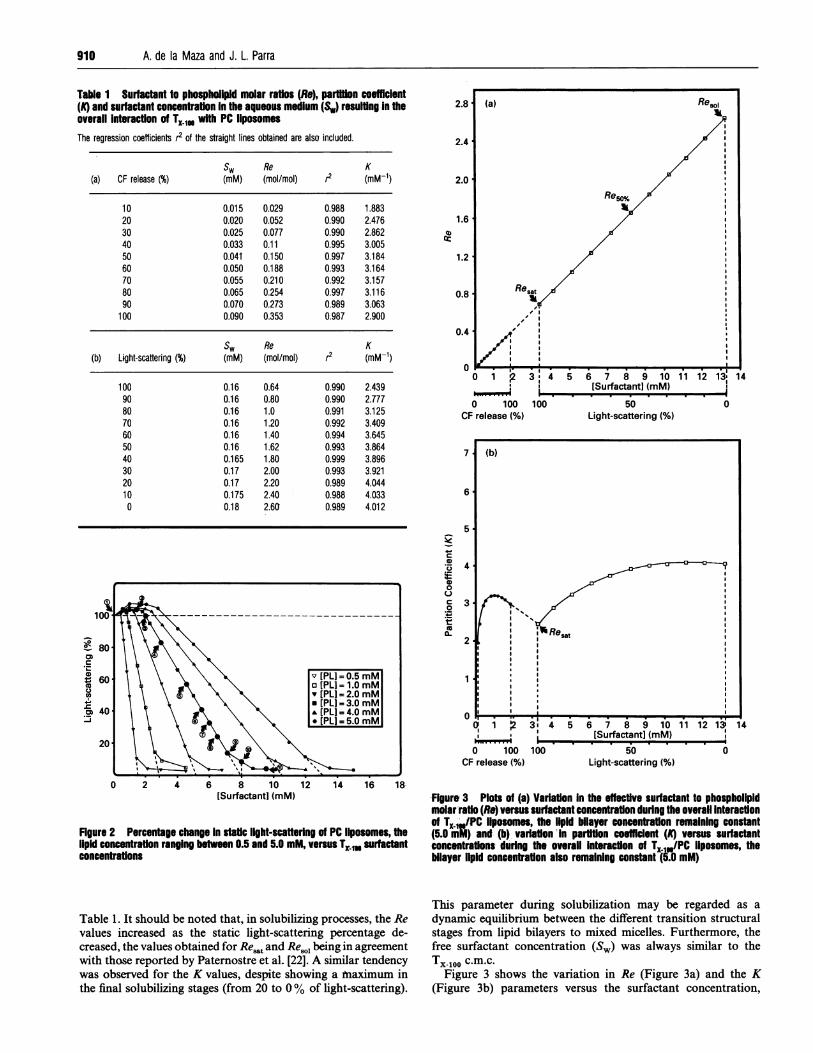
Table 1 Surtactant to phospholpid molar ratlos (Re), partition coffIcient(K) and surfactant concentration In the aqueous medium (Sw) resulting In theoverall Interaction of TX.18 with PC llposomesThe regression coefficients r2 of the straight lines obtained are also included.
Sw Re K(a) CF release (%) (mM) (mol/mol) r2 (mM-1)
10 0.015 0.029 0.988 1.88320 0.020 0.052 0.990 2.47630 0.025 0.077 0.990 2.86240 0.033 0.11 0.995 3.00550 0.041 0.150 0.997 3.18460 0.050 0.188 0.993 3.16470 0.055 0.210 0.992 3.15780 0.065 0.254 0.997 3.11690 0.070 0.273 0.989 3.063
100 0.090 0.353 0.987 2.900
Sw Re K(b) Light-scattering (%) (mM) (mol/mol) r2 (mM-1)
0.160.160.160.160.160.160.1650.170.170.1750.18
0.640.801.01.201.401.621.802.002.202.402.60
0.9900.9900.9910.9920.9940.9930.9990.9930.9890.9880.989
2.4392.7773.1253.4093.6453.8643.8963.9214.0444.0334.012
CF release (%) Light-scattering (%)
_ I ..74
6
5
a)
0).E 4
00t 30~
2
1
0
0CF r
1 '2 3 4i,,,.1 i_
100 100release (%)
5 6 7 8 9 10 11 12 13'[Surfactantl (mM)
50Light-scattering (%)
0
[Surfactantl (mM)
Rgure 2 Percentage change In static light-scattering of PC liposomes, theliphi concentration ranging between 0.5 and 5.0 mM, versus T,1 surlactantconcentrations
Table 1. It should be noted that, in solubilizing processes, the Revalues increased as the static light-scattering percentage de-creased, the values obtained for Resatand Resol being in agreementwith those reported by Paternostre et al. [22]. A similar tendencywas observed for the K values, despite showing a Maximum inthe final solubilizing stages (from 20 to 0% of light-scattering).
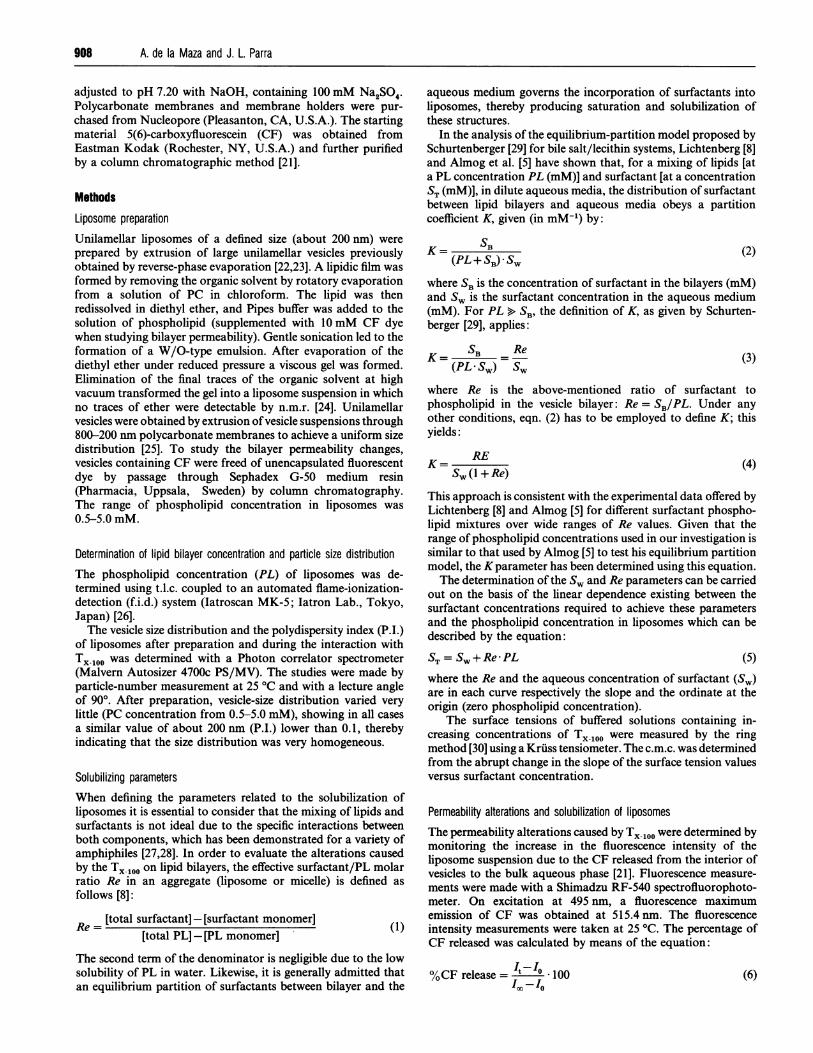
Figure 3 Plots of (a) Variation In the effective surfactant to phospholipidmolar ratio (Re) versus surfactant concentration during the overall Interactionof TX IPC llposomes, the lipid bilayer concentrafton remaining constant(5.0 m;) and (b) variafton -In partition coefficient (A) versus surfactantconcentrations during the overall interaction of TXIU/PC llposomes, thebilayer lipid concentration also remaining constant (5.0 mM)
This parameter during solubilization may be regarded as a
dynamic equilibrium between the different transition structuralstages from lipid bilayers to mixed micelles. Furthermore, thefree surfactant concentration (Sw) was always similar to theTX-100 c.m.c.
Figure 3 shows the variation in Re (Figure 3a) and the K(Figure 3b) parameters versus the surfactant concentration,
1009080706050403020100
0)
r-
co
4._
(b)
RentII
II
I
IssIa
14
~~. - .
Solubilization of phosphatidylcholine vesicles by Triton X-1 00
Table 2 Vesicle size distributions (nm) and polydispersity indexes ofTX 100/PC systems when increasing the surfactant concentration, the lipidconcentration remaining constant (3.0 mM)The ten samples are numbered in accordance with the TX 10O/PC systems (numbered samples)indicated in Figure 2.
Curve distribution(vesicle number)
First peak Second peak AverageMean
Sample Type (nm) (%) (nm) (%) (nm) P.l.
50505050505050
3.85.27.09.09.3
19.123.6
200400355345328258190119105
23.223.123.319.818.316.814.814.64.4
200400355298266197137926050
0.25
0.20
> 0.15E
V?0.1120.1800.2100.2500.2490.2310.2150.2050.1800.170
0.10
0.05
u * I ,. * . . .0 1 12
0 100CF release (%)
,I
5 6 7 8 9 10 11 12 13: 14[Surfactantl (mM) E
50Light-scattering (%)
throughout the TX 100-liposomes interaction, the lipid concen-
tration remaining constant (5.0 mM). The surfactant con-
centrations producing subsolubilizing and solubilizing alterationsare also indicated. It is noteworthy that a linear correlation wasobtained between the Re values and the surfactant concentrationthroughout the interaction, i.e., the higher the surfactant con-
centration in the system, the greater the concentration- in thebilayers. As for the K parameter (Figure 3b) a marked initialincrease was observed as the TX 100 concentration rose, reachinga maximum for CF release value of about 500%. Increasingsurfactant concentrations resulted in a progressive fall in the Kvalues until 100% of CF release. The extrapolation of the curve
(discontinuous line) led approx. to the initial K value forsolubilization (100% light-scattering). Successive additions ofsurfactant resulted again in a rise in K, despite showing almost a
constant value in the vicinity of the total solubilization ofliposomes.From the results of Figure 3a, it may be assumed that the ratio
of TX-100 to phospholipid in the vesicle bilayers or in the mixedmicelles appears to be independent of any possible structuralorganization of both components throughout the process. Com-parison of Figures 3a and 3b shows that a significant variation inthe free surfactant concentration SW took place during thedifferent stages of the interaction with respect to the amount ofsurfactant molecules incorporated in bilayers. Thus the markedinitial increase in Kmay be correlated with the larger tendency ofsurfactant molecules to be incorporated into bilayers with respectto the aqueous phase, this tendency reaching the highest pointfor approx. 50% ofCF release (maximum Kvalue). The evolutionof these two parameters in the subsequent interaction steps (from50 to 100% of CF release) reveals that a significant variation inthe free surfactant concentration (Sw) took place with respect tothe amount of surfactant molecules incorporated in the bilayers.Thus a gradual increase in Sw occurs, due to the establishment ofa new equilibrium in the surfactant partition between bilayersand the aqueous medium. Th-e surfactant/lipid ratio corre-
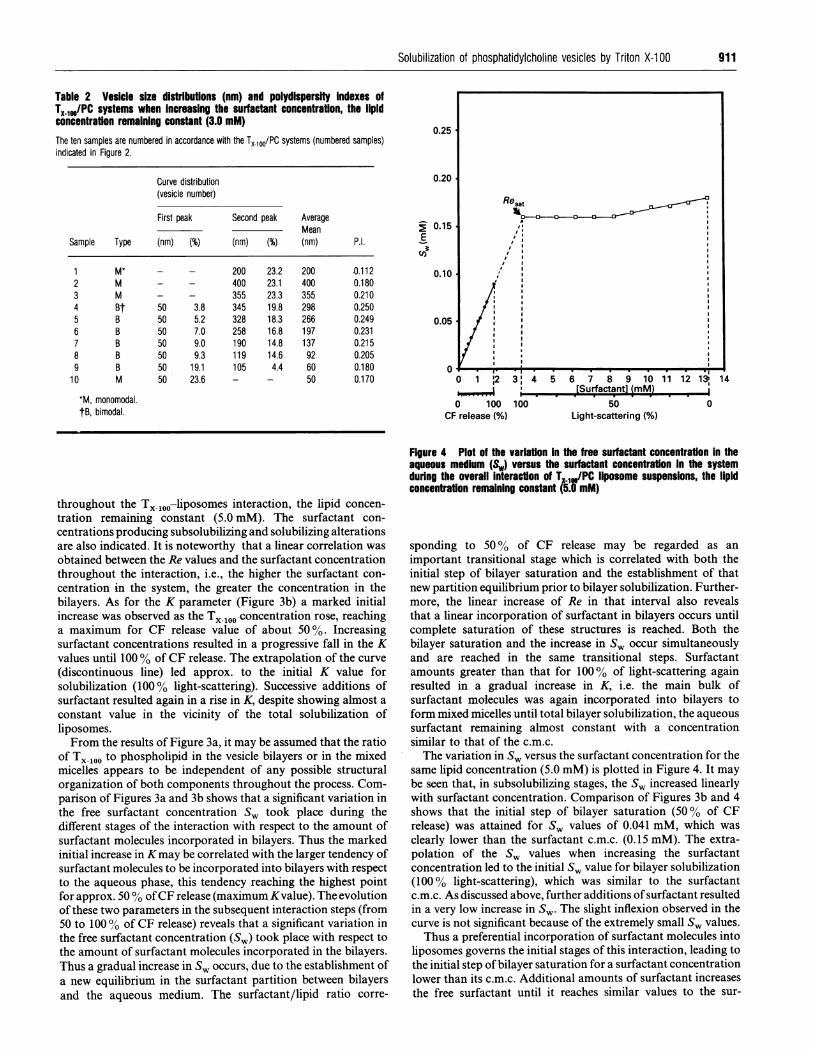
Figure 4 Plot of the variation in the free surfactant concentration in theaqueous medium (8wj versus the surfactant concentration in the systemduring the overall interaction of TX1.,/PC liposome suspensions, the lipidconcentration remaining constant (5.0 mM)
sponding to 50% of CF release may be regarded as an
important transitional stage which is correlated with both theinitial step of bilayer saturation and the establishment of thatnew partition equilibrium prior to bilayer solubilization. Further-more, the linear increase of Re in that interval also revealsthat a linear incorporation of surfactant in bilayers occurs untilcomplete saturation of these structures is reached. Both thebilayer saturation and the increase in Sw occur simultaneouslyand are reached in the same transitional steps. Surfactantamounts greater than that for 100-% of light-scattering againresulted in a gradual increase in K, i.e. the main bulk ofsurfactant molecules was again incorporated into bilayers toform mixed micelles until total bilayer solubilization, the aqueoussurfactant remaining almost constant with a concentrationsimilar to that of the c.m.c.
The variation in Sw versus the surfactant concentration for thesame lipid concentration (5.0 mM) is plotted in Figure 4. It maybe seen that, in subsolubilizing stages, the Sw increased linearlywith surfactant concentration. Comparison of Figures 3b and 4shows that the initial step of bilayer saturation (500% of CFrelease) was attained for Sw values of 0.041 mM, which was
clearly lower than the surfactant c.m.c. (0.15 mM). The extra-polation of the Sw values when increasing the surfactantconcentration led to the initial SW value for bilayer solubilization(1000% light-scattering), which was similar to the surfactantc.m.c. As discussed above, further additions ofsurfactant resultedin a very low increase in Sw. The slight inflexion observed in thecurve is not significant because of the extremely small Sw values.Thus a preferential incorporation of surfactant molecules into
liposomes governs the initial stages of this interaction, leading tothe initial step of bilayer saturation for a surfactant concentrationlower than its c.m.c. Additional amounts of surfactant increasesthe free surfactant until it reaches similar values to the sur-
911
23456789
10
ResatI,
,1
I
M*M
BtBBBBBM
*M, monomodal.tB, bimodal.
3: 4
100 0i I0
912 A. de la Maza and J. L. Parra
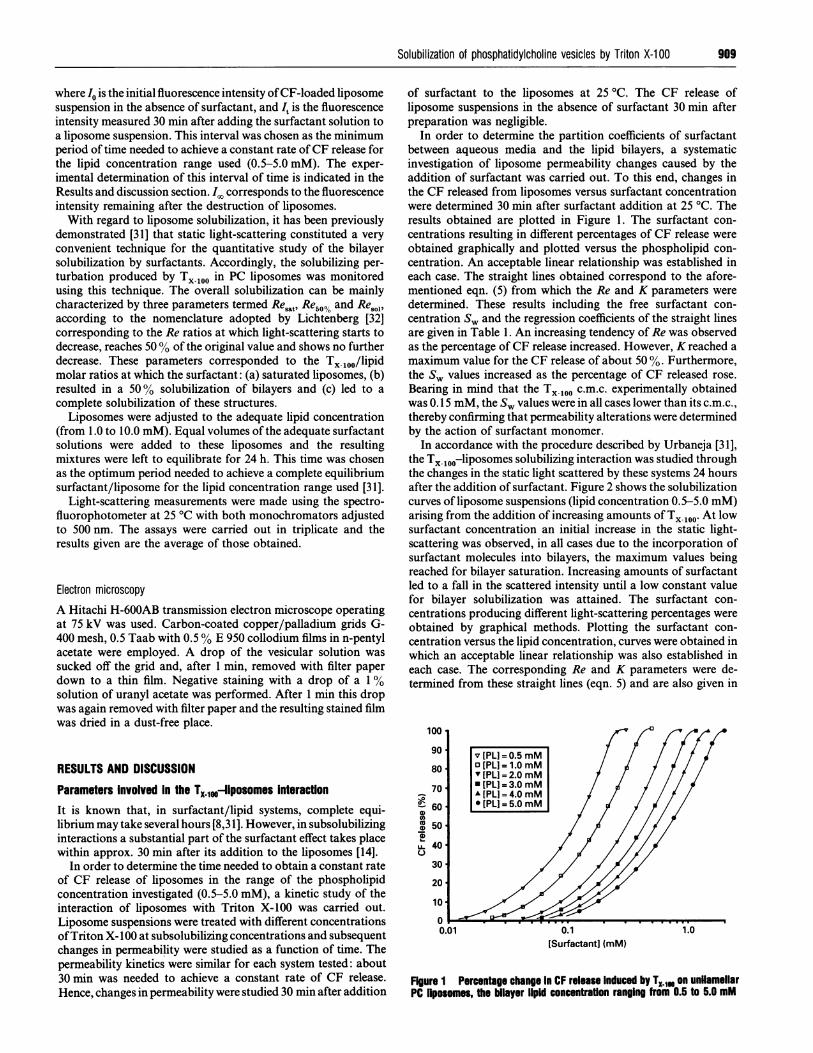
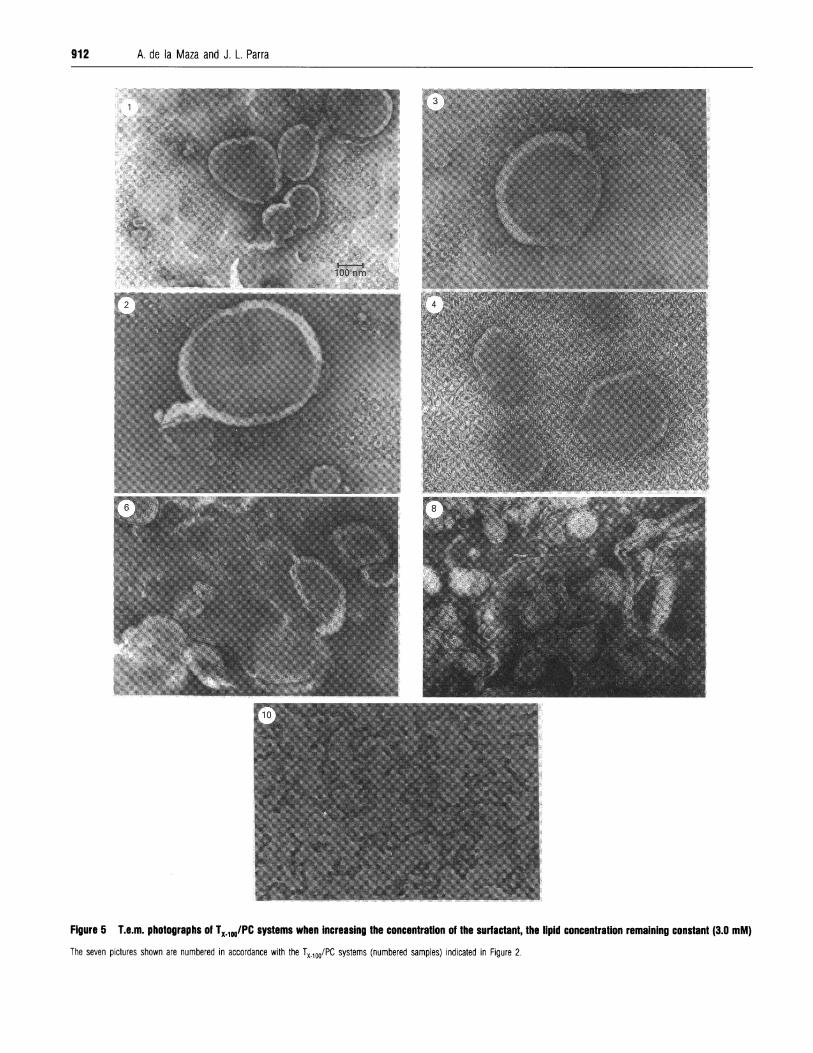
Figure 5 T.e.m. photographs of TX.1JPC systems when Increasing the concentraton of the surfactant, the lipid concentration remaining constant (3.0 mM)The seven pictures shown are numbered in accordance with the TX_100/PC systems (numbered samples) indicated in Figure 2.
Solubilization of phosphatidylcholine vesicles by Triton X-1 00 913
factant c.m.c. Solubilization starts to occur at this moment. Thusthe Resat parameter given in Figures 3 and 4 corresponds to theexact surfactant/phospholipid molar ratio needed for the in-itiation of the bilayer solubilization via mixed-micelle formation.The surfactant concentration corresponding to this Re,,t for eachlipid bilayer concentration may be considered the c.m.c. of thenew surfactant/phospholipid mixed system formed.
In our opinion, the tendency observed in the extrapolatedcurves of Figures 3 and 4 could shed some light on the linearityexisting in both the achievement of the complete bilayer satu-ration and the rise in the S, values until the surfactant c.m.c.Probably a certain compromise between the bilayer saturationand the formation of pure surfactant mixed micelles could beenvisaged.
Dynamic light-scattering determinations and t.e.m. picturesA systematic investigation based on dynamic light-scatteringmeasurements and t.e.m. observations was carried out in orderto elucidate the structural transition stages involved in theTx 100-liposomes interaction. Eleven representative surfactant/liposome systems were studied. The corresponding experimentalpoints are indicated in the curve of the static light scattered by3.0 mM PC liposomes in Figure 2. The vesicle size distribution(nm) and the P.I. of each system is given in Table 2. Figure 5shows some representative t.e.m. microphotographs of thesesystems.For pure vesicle preparations (point 1) the t.e.m. picture
showed unilamellar bilayers, the vesicle size-distribution curvesgiving a monomodal distribution (200 nm). Large unilamellarvesicles began to form as the surfactant concentration exceeded15 mol %, which corresponds to the 50-60% of CF release. (TheTX-100 mol% used to indicate concentration was based on thetotal amount of PC and Triton in the sample). The maximumgrowth of vesicles (correlated with maximum static light-scattering intensity of Figure 2) was observed for 22 mol % (point2), which roughly corresponds to the 90% of CF release(unilamellar vesicle size of about 400 nm; P.I. 0.180), the curveshowing a monomodal distribution.
It is interesting to note that large unilamellar vesicles began toform when the subsolubilizing partition coefficient, K, attainedapprox. the maximum value (K = 3.184; 500% CF release). Asdiscussed above, this surfactant/lipid system corresponds to theinitial step of bilayer saturation. These observations also confirmthe maximum increase in vesicle size for a surfactant con-centration that was lower than that for Re,,t and for smaller S,than the surfactant c.m.c. Increasing surfactant concentrationsshowed the presence of vesicles of similar size, despite a slight fallin the size took place for 40 mol % (point 3 corresponding to theResat parameter). Thus the vesicle size reached values of about350-360 nm (P.I. of about 0.210) and the t.e.m. picture revealedslightly smaller unilamellar vesicles albeit with initial traces ofsmaller structures.When the surfactant concentration reached 50 mol % (point 4)
a progressive decrease in static light-scattering occurred, the sizedistribution curves starting to show a bimodal distribution. Thusa sharp distribution curve appeared at approx. 50 nm, whichcorresponded to a new particle size distribution (P.I. of about0.250). At this point, the t.e.m. pictures showed tubularstructures together with bilayer fragments. These structures wereobserved until the surfactant reached approx. 60 mol % (point 5).Thereafter the open structures were gradually affected by thesurfactant and progressively worn away. However, for 64 mol%(point 6), the t.e.m. picture revealed the presence of a new type
curves with an increase in the small particle size (7.0% of 50 nmparticles). The Re50O parameter appears to be approximately theminimum surfactant concentration needed to obtain this newtype of aggregate.
Surfactant concentrations from 65 to 69 mol% (points 7 and8) led to the formation of multilayered structures which pro-gressively tended to form concentric and helicoidal con-formations. The t.e.m. picture for sample 8 showed the maximumlevel of complexity where no closed structures were formed,despite the formation of discs and helicoidal aggregates. The sizedistribution curves still indicated an increase in the small particlesize (9.0-9.30% in 50 nm vesicle size; mean 137-92 nm; P.I.0.215-0.205). When surfactant exceeded 71 mol% [points 9,(71.4 mol %) and 10 (72.6 mol% which corresponds to Re801)],the scattered intensity gradually decreased to a constant lowvalue for bilayer solubilization. The size-distribution curves ofpoint 9 still showed bimodal distribution (mean particle size ofabout 60 nm and P.I. 0.180), whereas point 10 again showed asingle distribution (particle size of about 50 nm and P.I. 0.170).The t.e.m. picture of point 10 still showed some aggregatedstructures with respect to the mixed micelles obtained at highersurfactant concentrations. It is interesting to note that the Re.01parameter did not correspond exactly with the total solubilizationof bilayers.
CONCLUSIONSFrom our results we conclude that in the overall interaction ofTX 100/PC liposomes the Re parameter appears to be directlycorrelated with the surfactant concentration present in thesystem, regardless of any possible structural organization in-volved in this interaction (lipid bilayer structures or mixedmicelles). This finding emphasizes the importance of the mol-ecular interaction of both components in this process. However,given the non-linear variation in the K parameter versus thesurfactant concentration, we may assume that a significantvariation in the free surfactant concentration takes place through-out the process. Thus the initial increase in K may be correlatedwith the initial tendency of the surfactant molecules to beincorporated into bilayers with respect to the surroundingaqueous phase until bilayer saturation. The initial step of bilayersaturation was attained when the system achieved 50% of CFrelease and also for free surfactant concentrations smaller thanthe c.m.c. This transition stage may be correlated with theestablishment of a new surfactant partition equilibrium, whichleads to complete bilayer saturation and to S, values similarto the surfactant c.m.c. Solubilization starts to occur at thismoment (Resat).The t.e.m. observations and the vesicle-size-distribution curves
show that large unilamellar vesicles began to form when thesubsolubilizing partition coefficient, K, attained the maximumsubsolubilizing value (K = 3.184; 500% CF release). The maxi-mum growth of vesicles was achieved for the transitional step of90% CF release (22 mol% surfactant concentration) and, conse-quently, for a lower surfactant concentration than that for theResat parameter. However, a slight fall in the vesicle size occurredwhen the surfactant concentration reached the Resat, the t.e.m.pictures still showing unilamellar vesicles, albeit with traces ofsmaller structures. The Re,at parameter corresponds to the exactsurfactant/phospholipid molar ratio needed for the initiation ofthe bilayer solubilization via mixed-micelle formation. Thesurfactant concentration corresponding to this Res,t for eachlipid bilayer concentration may be considered the c.m.c. of thenew surfactant/phospholipid mixed system formed. Increasingsurfactant concentration led to a gradual formation of tubularof lamellar aggregate, the size distribution also showing bimodal
914 A. de la Maza and J. L. Parra
structures together with bilayer fragments, followed by theformation of open multilamellar structures, until the formationof mixed micelles began. The surfactant concentration for theRe50, seems to be correlated with the formation of these complexstructures. The t.e.m. pictures for the Re.01 parameter still showsome aggregated structures. This observation confirms thatthis parameter does not correspond exactly with total bilayersolubilization.
The t.e.m. analysis was performed at Barcelona University, and we thank Dr. JordiBlavia for his skilful work at the microscope. We are also grateful to Mr. G. vonKnorring for expert technical assistance. This work was supported by funds fromDGICYT (Direccion General de lnvestigaci6n Cientifica y T6cnica) (Prog. no PB91 -
0065), Spain.
REFERENCES1 Ollivon, M. Eidelman, O., Blumenthal, R. and Walter, A. (1988) Biochemistry 27,
1695-17032 Keren-Zur, M., Beigel, M. and Loyter, A. (1989) Biochim. Biophys. Acta 983,
253-2583 Miguel, M. G., Eidelman, O., Ollivon, M. and Walter, A. (1989) Biochemistry 28,
8921-89284 Levy, D., Gulik, A., Seigneuret, M. and Rigaud, J. L. (1990) Biochemistry 29,
9480-94885 Almog, S., Litman, B. J., Wimley, W., Cohen, J., Wachtel, E. J., Barenholz, Y., Ben-
Shaul, A. and Lichtenberg, D. (1990) Biochemistry 29, 4582-45926 Edwards, K. and Almgren, M. (1991) J. Colloid Interface Sci. 147,1-217 Inoue, T., Yamahata, T. and Shimozawa, R. (1992) J. Colloid Interface Sci. 149,
345-3588 Lichtenberg, D. (1985) Biochim. Biophys. Acta 821, 470-4789 Fromherz, P., Rocker, C. and Ruppel (1986) Faraday Discuss. Chem. Soc. 81,
39-46
10 Lasig, D. D. (1987) J. Theor. Biol. 124, 35-4111 Lasi~, D. D. (1988) Biochem. J 256, 1-1112 Vinson, P. K., Talmon, Y. and Walter, A. (1989) Biophys. J. 56, 669-67613 Sappey, D., Letoublon, R. and Delmau, J. (1988) J. Lipid Res. 29,1237-124314 Ruiz, J., Gony, F. M. and Alonso, A. (1988) Biochim. Biophys. Acta 937, 127-13415 Edwards, K., Almgren, M, Bellare, J. and Brown, W. (1989) Langmuir 5, 473-47816 Kamenka, N., El-Amrani, M., Appell, J. and Lindheimer, M. (1991) J. Colloid Interface
Sci. 143, 463-47117 de la Maza, A., Parra, J. L., Garcia, M. T., Ribosa, I. and Sanchez Leal, J. (1992)
J. Colloid Interface Sci. 148, 310-31618 de la Maza, A. and Parra, J. L. (1992) Langmuir 8, 2422-242619 de la Maza, A. and Parra, J. L. (1993) Langmuir 9, 870-87320 Singleton, W. S., Gray, M. S., Brown, M. L and White, J. L. (1965) J. Am. Oil Chem.
Soc. 42, 53-5721 Weinstein, J. N., Ralston, E., Leserman, L. D., Klausner, R. D., Dragsten, P., Henkart,
P. and Blumenthal, R. (1986) in Liposome Technology (Gregoriadis, G., ed.), vol. 3,pp. 183-204, CRC Press, Boca Raton, FL
22 Paternostre, M. T., Roux, M. and Rigaud, J. L. (1988) Biochemistry 27, 2668-267723 Rigaud, J. L., Paternostre, M. T. and Bluzat, A. (1988) Biochemistry 27, 2677-268824 Allen, T. M. (1986) in Liposome Technology (Gregoriadis, G., ed.), vol. 1,
pp. 109-122, CRC Press, Boca Raton, FL25 Mayer, L. D., Hope, M. J. and Cullis, P. R. (1986) Biochim. Biophys. Acta 858,
161-16826 Ackman, R. G., McLeod, C. A. and Banerjee, A. K. (1990) J. Planar Chrom. 3,
450-49027 Tanford, C. (1980) in The Hydrophobic Effect: Formation of Micelles and Biological
Membranes (Tanford, C., ed.), pp. 14-20, Wiley and Sons, New York28 Hall, D. G. (1987) in Nonionic Surfactants, Physical Chemistry (Schick, M. J., ed.)
(Surfactant Science Series), vol. 23, pp. 233-296, Marcel Dekker, New York29 Schurtenberger, P., Mazer, N. and Kanzig, W. (1985) J. Phys. Chem. 89, 1042-104930 Lunkenheimer, K. and Wantke, D. (1981) Colloid Polymer Sci. 259, 354-36631 Urbaneja, M. A., Alonso, A., Gonzalez-Manas, J. M., Goni, F. M., Partearroyo, M. A.,
Tribout, M. and Paredes, S. (1990) Biochem. J. 270, 305-30832 Lichtenberg, D., Robson, R. J. and Dennis, E. A. (1983) Biochim. Biophys. Acta 737,
285-304
Received 25 November 1993/29 April 1994; accepted 26 May 1994


![914 mavroidis[2]](https://img.pdfslide.us/doc/110x75/55a125b71a28ab49388b45db/914-mavroidis2.jpg)