Embed Size (px)
Citation preview
St. Francis Drive Corridor Study Initial Evaluation of Alternatives Physical Condition of the Existing Facility
P:\070131\Trans\Study\Report\St. Francis Dr Phase A rev 1c.doc 36
IV. Physical Condition of the Existing Facility The information presented in this section of the report is a compilation of right-of-way maps, an identified
centerline, and a physical inspection of the St. Francis Drive corridor. A. Typical Section
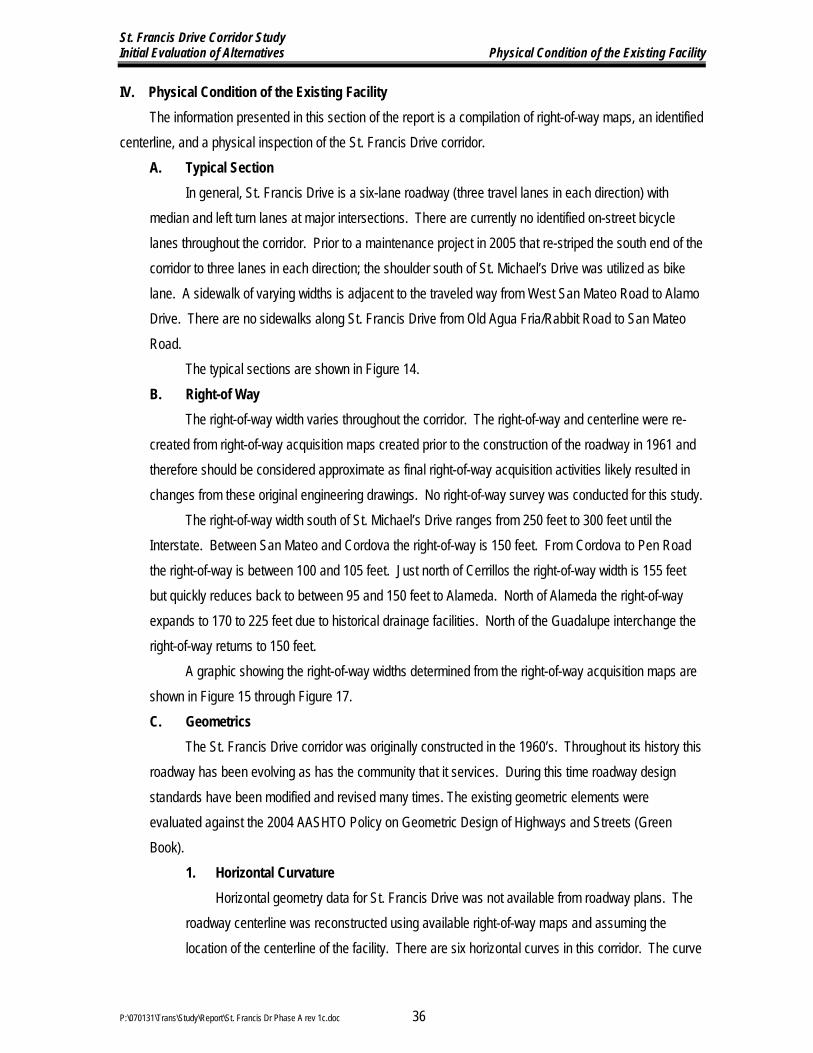
In general, St. Francis Drive is a six-lane roadway (three travel lanes in each direction) with median and left turn lanes at major intersections. There are currently no identified on-street bicycle lanes throughout the corridor. Prior to a maintenance project in 2005 that re-striped the south end of the corridor to three lanes in each direction; the shoulder south of St. Michael’s Drive was utilized as bike lane. A sidewalk of varying widths is adjacent to the traveled way from West San Mateo Road to Alamo Drive. There are no sidewalks along St. Francis Drive from Old Agua Fria/Rabbit Road to San Mateo Road.
The typical sections are shown in Figure 14. B. Right-of Way
The right-of-way width varies throughout the corridor. The right-of-way and centerline were re-created from right-of-way acquisition maps created prior to the construction of the roadway in 1961 and therefore should be considered approximate as final right-of-way acquisition activities likely resulted in changes from these original engineering drawings. No right-of-way survey was conducted for this study.
The right-of-way width south of St. Michael’s Drive ranges from 250 feet to 300 feet until the Interstate. Between San Mateo and Cordova the right-of-way is 150 feet. From Cordova to Pen Road the right-of-way is between 100 and 105 feet. Just north of Cerrillos the right-of-way width is 155 feet but quickly reduces back to between 95 and 150 feet to Alameda. North of Alameda the right-of-way expands to 170 to 225 feet due to historical drainage facilities. North of the Guadalupe interchange the right-of-way returns to 150 feet.
A graphic showing the right-of-way widths determined from the right-of-way acquisition maps are shown in Figure 15 through Figure 17. C. Geometrics
The St. Francis Drive corridor was originally constructed in the 1960’s. Throughout its history this roadway has been evolving as has the community that it services. During this time roadway design standards have been modified and revised many times. The existing geometric elements were evaluated against the 2004 AASHTO Policy on Geometric Design of Highways and Streets (Green Book).
1. Horizontal Curvature Horizontal geometry data for St. Francis Drive was not available from roadway plans. The
roadway centerline was reconstructed using available right-of-way maps and assuming the location of the centerline of the facility. There are six horizontal curves in this corridor. The curve

St. Francis Drive Corridor Study Initial Evaluation of Alternatives Physical Condition of the Existing Facility
P:\070131\Trans\Study\Report\St. Francis Dr Phase A rev 1c.doc 37
data is presented in Table 10. AASHTO provides superelevation tables for both high speed facilities and low speed urbanized facilities. For the analysis of this corridor, that is highly urbanized, with relatively low & variable speeds, the existing curves were evaluated against the Low-Speed Urban Streets superelevation tables.5 All curve superelevation within the corridor is acceptable based on the low speed urban design criteria. Curve 6 has a posted speed that is at the upper limit of the low speed urban criteria. As a point of reference, this curve was evaluated against the standard AASHTO superelevation tables6. It was assumed that the value of the maximum superelevation is 6% as is the state of the practice for facilities located to the north of Interstate 40. The existing superelevation was estimated using cross sections developed from the existing ground digital terrain model. Based on the determined superelevation rate of curve 6, 4.0%, the design speed of this curve is in excess of 55 miles per hour.
5 A Policy on Geometric Design of Highways and Streets, 2004 edition, Exhibit 3-16, pg 151. 6 A Policy on Geometric Design of Highways and Streets, 2004 edition, Exhibit 3-26, pg 168.

FIG
UR
E 1
4
EX
IS
TIN
G T
YP
IC
AL
SE
CT
IO
NS
38
P:\0
70
13
1\
13:54
01-SEP
ST
. FR
AN
CIS
DR
IV
E C
OR
RID
OR
ST
UD
Y
INIT
IAL
EV
AL
UA
TIO
N O
F A
LT
ER
NA
TIV
ES
ME
DIA
ND
RIV
ING
LA
NE
SHOULDER
DR
IVIN
G
LA
NE
SHOULDER
DR
IVIN
G
LA
NE
SHOULDER
DR
IVIN
G
LA
NE
SHOULDER
C BASELINEL
RA
BB
IT R
OA
D T
O
NO
RT
H O
F M
ER
GE
6’
12’
12’
8’
~50’
8’
12’
12’
8’
50
0’ -
50
0’+
R/W
VA
RIE
SV
AR
IES
TY
PIC
AL
SE
CT
IO
N 1
SHOULDER
DR
IVIN
G
LA
NE
VA
RIE
S
NO
RT
H O
F M
ER
GE
TO
SO
UT
H O
F S
AW
MIL
L R
OA
D
C BASELINEL
8’
~40’
VA
RIE
S
VA
RIE
S 2
50’ - 3
00’ R
/W
11’
11’
11’
8’SHOULDER
DR
IVIN
G
LA
NE
DR
IVIN
G
LA
NE
ME
DIA
ND
RIV
ING
LA
NE
8’
11’
11’
12’
8’
SHOULDER
SHOULDER
DR
IVIN
G
LA
NE
DR
IVIN
G
LA
NE
TY
PIC
AL
SE
CT
IO
N 2
SHOULDER
DR
IVIN
G
LA
NE
VA
RIE
S
C BASELINEL
8’
~40’
VA
RIE
S
VA
RIE
S 2
50’ - 3
00’ R
/W
11’
11’
11’
6’SHOULDER
DR
IVIN
G
LA
NE
DR
IVIN
G
LA
NE
ME
DIA
ND
RIV
ING
LA
NE
6’
11’
11’
11’
8’
SHOULDER
SHOULDER
DR
IVIN
G
LA
NE
DR
IVIN
G
LA
NE
TY
PIC
AL
SE
CT
IO
N 3
SO
UT
H O
F S
AW
MIL
L R
OA
D T
O
ST
. MIC
HA
EL
S D
RIV
E R
AM
PS
DR
IVIN
G
LA
NE
VA
RIE
S
C BASELINEL
16’
VA
RIE
S11’
10.5
’11’
DR
IVIN
G
LA
NE
DR
IVIN
G
LA
NE
ME
DIA
ND
RIV
ING
LA
NE
11’
10.5
’12’
6’SIDEWALK
DR
IVIN
G
LA
NE
DR
IVIN
G
LA
NE
TY
PIC
AL
SE
CT
IO
N 4
6’
VA
RIE
S
MEANDERING
SIDEWALK
WE
ST
SA
N M
AT
EO
RO
AD
TO
WE
ST
CO
RD
OV
A R
OA
D
150’ R
/W
DR
IVIN
G
LA
NE
VA
RIE
S
C BASELINEL
16’
VA
RIE
S12’
11’
12’
ME
DIA
N
11’
12’
11’
8’SIDEWALK
8’MEANDERING
SIDEWALK
12’
DR
IVIN
G
LA
NE
DR
IVIN
G
LA
NE
TU
RN
LA
NE
DR
IVIN
G
LA
NE
DR
IVIN
G
LA
NE
DR
IVIN
G
LA
NE
TY
PIC
AL
SE
CT
IO
N 5
WE
ST
CO
RD
OV
A R
OA
D
TO
CE
RR
ILL
OS
RO
AD
10
0’ -
10
5’ R
/W
VA
RIE
S
C BASELINEL
16’
VA
RIE
S15’
12’
11’
ME
DIA
N
11’
10’
11’
8’SIDEWALK
TY
PIC
AL
SE
CT
IO
N 6
8’MEANDERING
SIDEWALK
12’
DR
IVIN
G
LA
NE
DR
IVIN
G
LA
NE
DR
IVIN
G
LA
NE
DR
IVIN
G
LA
NE
DR
IVIN
G
LA
NE
155’ R
/W
TU
RN
LA
NE
TU
RN
LA
NE
SO
UT
H O
F C
ER
RIL
LO
S R
OA
D
TO
ME
RC
ER
ST
.
VA
RIE
S
C BASELINEL
18’
VA
RIE
S11’
11’
ME
DIA
N
12’
12’
11’
6’SIDEWALK
6’
MEANDERING
SIDEWALK
12’
DR
IVIN
G
LA
NE
DR
IVIN
G
LA
NE
DR
IVIN
G
LA
NE
DR
IVIN
G
LA
NE
DR
IVIN
G
LA
NE
DR
IVIN
G
LA
NE
95
’-15
0’ R
/W
TY
PIC
AL
SE
CT
IO
N 7
NO
RT
H O
F M
ER
CE
R S
T. T
O
SO
UT
H O
F C
AM
INO
DE
LA
S C
RU
CIT
AS
C BASELINEL
18’
VA
RIE
S11’
11’
ME
DIA
N
11’
12’
10’
6’SIDEWALK
4’
11’
DR
IVIN
G
LA
NE
DR
IVIN
G
LA
NE
DR
IVIN
G
LA
NE
DR
IVIN
G
LA
NE
DR
IVIN
G
LA
NE
DR
IVIN
G
LA
NE
SIDEWALK
VA
RIE
S
17
7’ -
22
5’ R
/W
SO
UT
H O
F C
AM
INO
DE
LA
S C
RU
CIT
AS
TO
NO
RT
H O
F A
LA
MO
DR
.
TY
PIC
AL
SE
CT
IO
N 8
C BASELINEL 6’
VA
RIE
S11’
13’
ME
DIA
N
13’
13’
12’
8’SHOULDER
8’
DR
IVIN
G
LA
NE
DR
IVIN
G
LA
NE
DR
IVIN
G
LA
NE
DR
IVIN
G
LA
NE
DR
IVIN
G
LA
NE
VA
RIE
S
SHOULDER
150’ R
/W
TY
PIC
AL
SE
CT
IO
N 9
NO
RT
H O
F A
LA
MO
DR
.
TO
NO
RT
H G
UA
DA
LU
PE
ST
.


St. Francis Drive Corridor Study Initial Evaluation of Alternatives Physical Condition of the Existing Facility
P:\070131\Trans\Study\Report\St. Francis Dr Phase A rev 1c.doc 42
Table 10 – Horizontal Curvature Curve
Number PC
Station PT
Station Radius
(ft) Curve
Length (ft) Estimated
Superelevation (%) Posted
Speed (mph) 1 156+47 167+25 2,965 1,077 4.4 35 2 175+20 187+93 2,187 1,273 1.4 35 3 209+27 220+28 3,274 1,101 2.0 35 4 229+09 237+86 3,274 876 Varies 35 5 224+50 249+92 3,240 542 3.0 35 6 256+06 277+92 3,000 2,186 4.0 45
Another horizontal design element that is generally evaluated is the length of horizontal
curves within a roadway facility. As discussed in the 2004 edition of the AASHTO Green Book, pages 229-230, this control does not lend itself to theoretical derivation; rather, it is based on design experience. As stated in the Green Book, inefficient curve design and poor combinations of curvature can limit capacity, increase travel time and operating costs. AASHTO recommends that for main highways the minimum length of curve, Lc min is equal to 15 times the design speed of the facility. For curves 1 thru 5, Lc min is 525 feet. The value for curve 6 is 675. All of the existing curves have adequate length of curvature. 2. Vertical Curvature
Vertical geometry data for St. Francis Drive was not available from roadway plans. The roadway centerline was reconstructed using available right-of-way maps and assuming the location of the centerline of the facility. A roadway profile was created based on the existing digital terrain model (DTM). A vertical profile was created that was a best fit of the existing ground profile. There are 30 vertical points of intersection with in the corridor. The vertical curve data is presented in Table 11. It was assumed that the design speed for the vertical curves was 5 mph greater than the currently posted speed limits of 45mph and 35mph within this corridor. The Green Book makes recommendations based on design speeds for the ratio of the vertical curve length to the algebraic difference in grade across vertical curves7. This “k”-value was computed for each vertical curve in the corridor and compared to the recommended value. Additionally, based on the existing k-value the effective design speed of each vertical curve was computed. All of the vertical curves, except one, are adequate for the design speed. The vertical curve located 199+02 varies from the recommended k-value. The design speed at this location is 40 mph and the vertical curve has a k-value that corresponds to a 37-mph design speed. There were two locations where vertical points of intersection were constructed without a vertical curve. Stopping sight distance was also calculated throughout this corridor. Figure 18 shows a plot of the required stopping sight distance, increasing and decreasing stations, and a plot of the available stopping sight distance. The stopping sight distance throughout the corridor appears to exceed the minimum recommended stopping sight distance.
7 A Policy on Geometric Design of Highways and Streets, 2004 edition, Exhibits 3-72, pg 272 & 3-75, pg 277.

St. Francis Drive Corridor Study Initial Evaluation of Alternatives Physical Condition of the Existing Facility
P:\070131\Trans\Study\Report\St. Francis Dr Phase A rev 1c.doc 43
Table 11 – Vertical Curvature
Stations K Value Effective Design Speed (mph)
Comment Attributes
Start End Road (ft/%)
Policy (ft/%)
10+00.000 23+92.798 Road value varies from controlling criteria, grade break without a curve
10+00.000 to 10+05.044, grade=0.00(%); 10+05.044 to 23+92.798, grade=-2.90 (%)
23+92.798 28+92.798 208.33 96 76 Road value is within controlling criteria Design speed=50 (mph); type of curve=sag; 36+95.980 41+95.980 357.14 96 80 Road value is within controlling criteria Design speed=50 (mph); type of curve=sag; 42+09.050 44+09.050 142.86 84 59 Road value is within controlling criteria Design speed=50 (mph); type of curve=crest; 44+69.795 49+69.795 416.67 96 80 Road value is within controlling criteria Design speed=50 (mph); type of curve=sag; 53+15.345 58+15.345 217.39 84 67 Road value is within controlling criteria Design speed=50 (mph); type of curve=crest; 64+50.497 69+50.497 200.00 96 74 Road value is within controlling criteria Design speed=50 (mph); type of curve=sag; 75+55.572 80+55.572 227.27 84 68 Road value is within controlling criteria Design speed=50 (mph); type of curve=crest; 84+97.886 94+97.886 204.08 96 75 Road value is within controlling criteria Design speed=50 (mph); type of curve=sag; 105+38.625 113+38.625 275.86 84 72 Road value is within controlling criteria Design speed=50 (mph); type of curve=crest; 121+98.832 126+98.832 227.27 84 68 Road value is within controlling criteria Design speed=50 (mph); type of curve=crest; 129+20.023 134+20.023 200.00 96 74 Road value is within controlling criteria Design speed=50 (mph); type of curve=sag; 134+75.570 139+75.570 200.00 84 66 Road value is within controlling criteria Design speed=50 (mph); type of curve=crest; 141+26.141 146+26.141 125.00 96 57 Road value is within controlling criteria Design speed=50 (mph); type of curve=sag; 148+13.953 153+13.953 294.12 84 74 Road value is within controlling criteria Design speed=50 (mph); type of curve=crest; 157+27.070 162+27.070 625.00 84 80 Road value is within controlling criteria Design speed=50 (mph); type of curve=crest;
162+27.070 175+06.791 Road value varies from controlling criteria, grade break without a curve
162+27.070 to 168+66.931, grade=0.00 (%); 168+66.931to 175+06.791, grade=0.20(%)
175+06.791 180+06.791 384.62 84 80 Road value is within controlling criteria Design speed=50 (mph); type of curve=crest; 188+56.046 193+56.046 454.55 96 80 Road value is within controlling criteria Design speed=50 (mph); type of curve=sag; 194+50.000 197+30.000 88.05 84 51 Road value is within controlling criteria Design speed=50 (mph); type of curve=crest;
199+02.000 202+02.000 54.15 64 37 Road value varies from controlling criteria Design speed=40 (mph); type of curve=sag;
203+05.000 205+45.000 88.24 44 51 Road value is within controlling criteria Design speed=40 (mph); type of curve=crest; 216+21.480 221+21.480 324.68 44 76 Road value is within controlling criteria Design speed=40 (mph); type of curve=crest; 221+22.777 223+72.777 227.27 64 80 Road value is within controlling criteria Design speed=40 (mph); type of curve=sag; 228+46.017 230+46.017 65.57 44 46 Road value is within controlling criteria Design speed=40 (mph); type of curve=crest; 230+90.000 234+50.000 70.18 64 42 Road value is within controlling criteria Design speed=40 (mph); type of curve=sag;
234+50.000 259+13.078 Road value varies from controlling criteria, grade break without a curve
234+50.000 to 248+48.931, grade=1.28 (%); 248+48.931to 259+13.078, grade=1.70(%)
259+13.078 264+13.078 166.67 96 67 Road value is within controlling criteria Design speed=50 (mph); type of curve=sag; 271+67.723 276+67.723 111.11 84 55 Road value is within controlling criteria Design speed=50 (mph); type of curve=crest; 277+96.634 282+96.634 125.00 96 57 Road value is within controlling criteria Design speed=50 (mph); type of curve=sag; 285+48.736 290+48.736 333.33 96 80 Road value is within controlling criteria Design speed=50 (mph); type of curve=sag;

St. Francis Drive Corridor Study Initial Evaluation of Alternatives Physical Condition of the Existing Facility
P:\070131\Trans\Study\Report\St. Francis Dr Phase A rev 1c.doc 44
Figure 18 – Stopping Sight Distance
The tangent grades along this corridor were also evaluated. There are a few locations where the longitudinal slope of the roadway appears to be very flat. However, because the profile was developed by best fitting a profile to the existing terrain model instead of recreating it from As-Built plans the slopes may not reflect the actual slopes. Unless drainage issues are occurring at these locations, the longitudinal slope appears to be adequate. The following table lists that longitudinal slope along this corridor.

St. Francis Drive Corridor Study Initial Evaluation of Alternatives Physical Condition of the Existing Facility
P:\070131\Trans\Study\Report\St. Francis Dr Phase A rev 1c.doc 45
Table 12 – Longitudinal Slopes Stations Tangent Grade Comment Attributes
Start End Road (%)
Policy (%)
10+00.000 10+05.044 0.00 0.30 to 6.00
Road value may vary from recommended values, check drainage
Class=arterial; design speed=50 (mph); length=5.04 (ft); Additional policy allowance=1.00 (%)
10+05.044 23+92.798 2.90 0.30 to 5.00 Road value is within controlling criteria Class=arterial; design speed=50(mph);
length=1,387.75 (ft)
28+92.798 36+95.980 0.50 0.30 to 5.00 Road value is within controlling criteria Class=arterial; design speed=50(mph);
length=803.18 (ft)
41+95.980 42+09.050 0.90 0.30 to 6.00 Road value is within controlling criteria
Class=arterial; design speed=50(mph); length=13.07 (ft); Additional policy allowance=1.00 (%)
44+09.050 44+69.795 0.50 0.30 to 6.00 Road value is within controlling criteria
Class=arterial; design speed=50(mph); length=60.74 (ft); Additional policy allowance=1.00 (%)
49+69.795 53+15.345 0.70 0.30 to 6.00 Road value is within controlling criteria
Class=arterial; design speed=50(mph); length=345.55 (ft); Additional policy allowance=1.00 (%)
58+15.345 64+50.497 1.60 0.30 to 5.00 Road value is within controlling criteria Class=arterial; design speed=50(mph);
length=635.15 (ft)
69+50.497 75+55.572 0.90 0.30 to 5.00 Road value is within controlling criteria Class=arterial; design speed=50(mph);
length=605.08 (ft)
80+55.572 84+97.886 1.30 0.30 to 6.00 Road value is within controlling criteria
Class=arterial; design speed=50(mph); length=442.31 (ft); Additional policy allowance=1.00 (%)
94+97.886 105+38.625 3.60 0.30 to 5.00 Road value is within controlling criteria Class=arterial; design speed=50(mph);
length=1,040.74 (ft)
113+38.625 121+98.832 0.70 0.30 to 5.00 Road value is within controlling criteria Class=arterial; design speed=50(mph);
length=860.21 (ft)
126+98.832 129+20.023 1.50 0.30 to 6.00 Road value is within controlling criteria
Class=arterial; design speed=50(mph); length=221.19 (ft); Additional policy allowance=1.00 (%)
134+20.023 134+75.570 1.00 0.30 to 6.00 Road value is within controlling criteria
Class=arterial; design speed=50(mph); length=55.55 (ft); Additional policy allowance=1.00 (%)
139+75.570 141+26.141 1.50 0.30 to 6.00 Road value is within controlling criteria
Class=arterial; design speed=50(mph); length=150.57 (ft); Additional policy allowance=1.00 (%)
146+26.141 148+13.953 2.50 0.30 to 6.00 Road value is within controlling criteria
Class=arterial; design speed=50(mph); length=187.81 (ft); Additional policy allowance=1.00 (%)
153+13.953 157+27.070 0.80 0.30 to 6.00 Road value is within controlling criteria
Class=arterial; design speed=50(mph); length=413.12 (ft); Additional policy allowance=1.00 (%)
162+27.070 168+66.931 0.00 0.30 to 5.00
Road value may vary from recommended values, check drainage
Class=arterial; design speed=50(mph); length=639.86 (ft)
168+66.931 175+06.791 0.20 0.30 to 5.00
Road value may vary from recommended values, check drainage
Class=arterial; design speed=50(mph); length=639.86 (ft)
180+06.791 188+56.046 1.10 0.30 to 5.00 Road value is within controlling criteria Class=arterial; design speed=50(mph);
length=849.26 (ft)

St. Francis Drive Corridor Study Initial Evaluation of Alternatives Physical Condition of the Existing Facility
P:\070131\Trans\Study\Report\St. Francis Dr Phase A rev 1c.doc 46
Stations Tangent Grade Comment Attributes
Start End Road (%)
Policy (%)
193+56.046 194+50.000 0.00 0.30 to 6.00
Road value may vary from recommended values, check drainage
Class=arterial; design speed=50(mph); length=93.95 (ft); Additional Policy allowance=1.00 (%)
197+30.000 199+02.000 3.18 0.30 to 6.00 Road value is within controlling criteria
Class=arterial; design speed=50(mph); length=172.00 (ft); Additional policy allowance=1.00 (%)
202+02.000 203+05.000 2.36 0.30 to 7.00 Road value is within controlling criteria
Class=arterial; design speed=40(mph); length=103.00 (ft); Additional policy allowance=1.00 (%)
205+45.000 216+21.480 0.36 0.30 to 6.00 Road value is within controlling criteria Class=arterial; design speed=40(mph);
length=1,076.48 (ft)
221+21.480 221+22.777 1.90 0.30 to 7.00 Road value is within controlling criteria
Class=arterial; design speed=40(mph); length=1.30 (ft); Additional policy allowance=1.00 (%)
223+72.777 228+46.017 0.80 0.30 to 7.00 Road value is within controlling criteria
Class=arterial; design speed=40(mph); length=473.24 (ft); Additional policy allowance=1.00 (%)
230+46.017 230+90.000 3.85 0.30 to 7.00 Road value is within controlling criteria
Class=arterial; design speed=40(mph); length=43.98 (ft); Additional policy allowance=1.00 (%)
234+50.000 245+00.000 1.28 0.30 to 6.00 Road value is within controlling criteria Class=arterial; design speed=40(mph);
length=1,398.93 (ft)
245+00.000 248+48.931 1.28 0.30 to 5.00 Road value is within controlling criteria Class=arterial; design speed=50(mph);
length=1,398.93 (ft)
248+48.931 259+13.078 1.70 0.30 to 5.00 Road value is within controlling criteria Class=arterial; design speed=50(mph);
length=1,064.15 (ft)
264+13.078 271+67.723 4.70 0.30 to 5.00 Road value is within controlling criteria Class=arterial; design speed=50(mph);
length=754.64 (ft)
276+67.723 277+96.634 0.20 0.30 to 6.00
Road value may vary from recommended values, check drainage
Class=arterial; design speed=50(mph); length=128.91 (ft); Additional policy allowance=1.00 (%)
282+96.634 285+48.736 4.20 0.30 to 6.00 Road value is within controlling criteria
Class=arterial; design speed=50(mph); length=252.10 (ft); Additional policy allowance=1.00 (%)
290+48.736 296+75.679 5.70 0.30 to 5.00
Road value varies from controlling criteria
Class=arterial; design speed=50(mph); length=626.94 (ft)
D. Access
Intersection spacing, median breaks, and driveway frequency can have a deleterious effect on traffic flow if the number and spacing of the access points becomes excessive for a given roadway functional classification. In general, as a roadway increases in traffic flow and functional priority, such as a principal arterial like St. Francis Drive, more efficient traffic operations result from fewer median breaks and driveways. As St. Francis Drive has evolved as a major travel corridor as well as a significant employment and commercial corridor, the number and spacing of the access points are greater than would be desired to serve the anticipated future travel demand.
St. Francis Drive Corridor Study Initial Evaluation of Alternatives Physical Condition of the Existing Facility
P:\070131\Trans\Study\Report\St. Francis Dr Phase A rev 1c.doc 47
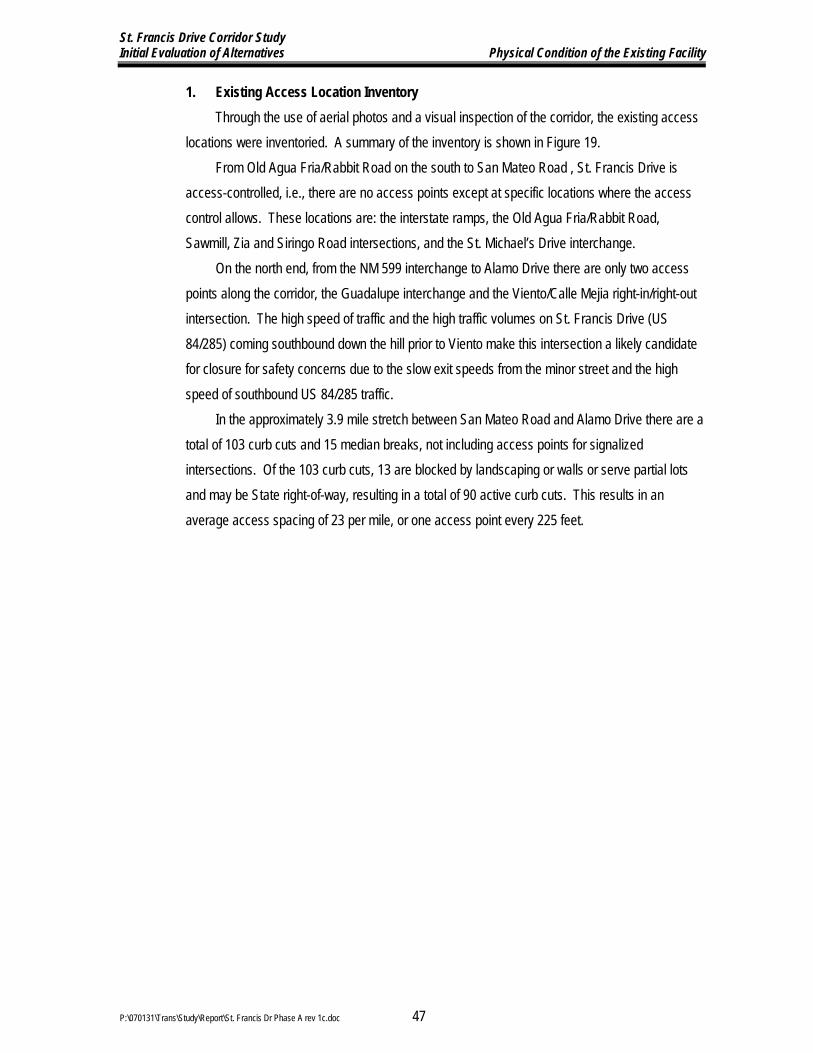
1. Existing Access Location Inventory Through the use of aerial photos and a visual inspection of the corridor, the existing access
locations were inventoried. A summary of the inventory is shown in Figure 19. From Old Agua Fria/Rabbit Road on the south to San Mateo Road , St. Francis Drive is
access-controlled, i.e., there are no access points except at specific locations where the access control allows. These locations are: the interstate ramps, the Old Agua Fria/Rabbit Road, Sawmill, Zia and Siringo Road intersections, and the St. Michael’s Drive interchange.
On the north end, from the NM 599 interchange to Alamo Drive there are only two access points along the corridor, the Guadalupe interchange and the Viento/Calle Mejia right-in/right-out intersection. The high speed of traffic and the high traffic volumes on St. Francis Drive (US 84/285) coming southbound down the hill prior to Viento make this intersection a likely candidate for closure for safety concerns due to the slow exit speeds from the minor street and the high speed of southbound US 84/285 traffic.
In the approximately 3.9 mile stretch between San Mateo Road and Alamo Drive there are a total of 103 curb cuts and 15 median breaks, not including access points for signalized intersections. Of the 103 curb cuts, 13 are blocked by landscaping or walls or serve partial lots and may be State right-of-way, resulting in a total of 90 active curb cuts. This results in an average access spacing of 23 per mile, or one access point every 225 feet.

N
12345678910
11
12
13
14
15
16
17
18
19
20
21
22
23
24
25
26
27
ST
AT
ION
13
7+
25
.78
14
3+
22
.81
14
7+
22
.27
14
7+
76
.62
14
8+
35
.00
14
8+
93
.37
15
0+
00
.86
15
0+
71
.22
15
1+
20
.56
15
2+
68
.93
15
3+
25
.60
15
3+
79
.84
15
4+
24
.20
15
4+
66
.43
15
5+
04
.63
15
5+
48
.61
15
5+
76
.53
15
6+
06
.00
15
6+
76
.73
15
8+
60
.33
15
9+
61
.20
16
0+
24
.72
16
1+
25
.25
17
3+
61
.64
17
5+
29
.21
17
6+
99
.65
18
0+
69
.68
DE
SC
RIP
TIO
N
BHHBBBHVVBHBBBBVVBBBVB-B
lock
ed
w/la
nd
scap
ing
HBBBB
OF
FS
ET
RT
RT
RT
RT
RT
RT
RT
RT
RT
RT
RT
RT
RT
RT
RT
RT
RT
RT
RT
RT
RT
RT
RT
RT
RT
RT
RT
US
ED
YYYYYYYYYYYYYYYYYYYYYNYYYYY
DR
IVE
WA
Y T
AB
LE
ST
AT
ION
DE
SC
RIP
TIO
NO
FF
SE
TU
SE
D
DR
IVE
WA
Y T
AB
LE
28
29
30
31
32
33
34
35
18
1+
18
.21
18
2+
02
.25
18
2+
39
.59
18
2+
80
.81
18
3+
57
.22
18
4+
35
.41
18
5+
17
.26
18
6+
04
.70
BBBBBBBB
RT
RT
RT
RT
RT
RT
RT
RT
YYYYYYYY
36
37
38
39
40
41
42
43
44
45
46
47
48
49
50
51
52
53
54
18
7+
12
.60
18
7+
93
.62
18
9+
49
.24
190+
11.2
2
19
6+
56
.80
19
7+
60
.34
19
9+
60
.71
20
1+
65
.79
20
1+
97
.06
20
2+
89
.39
20
4+
65
.41
21
0+
69
.88
211+
07.9
7
211+
44.3
2
21
2+
35
.30
21
2+
90
.89
21
5+
00
.72
21
5+
61
.52
22
0+
93
.30
BB-R
t in/o
ut
B-R
t in/o
ut
BBBVBHHH-B
locked w
/landscapin
g
B-G
ate
d
PPPPB-B
lock
ed
w/la
nd
scap
ing
Alle
y
V-F
ence/b
uild
ing
RT
RT
RT
RT
RT
RT
RT
RT
RT
RT
RT
RT
RT
RT
RT
RT
RT
RT
RT
YYYYYYYYYYNYNNYYYYN
ST
AT
ION
DE
SC
RIP
TIO
NO
FF
SE
TU
SE
D
DR
IVE
WA
Y T
AB
LE
ST
AT
ION
DE
SC
RIP
TIO
NO
FF
SE
TU
SE
D
DR
IVE
WA
Y T
AB
LE
55
56
57
58
59
60
61
62
63
64
65
66
67
68
69
70
221+
88.6
8
22
4+
61
.72
22
5+
90
.24
22
9+
34
.17
22
9+
89
.08
23
4+
32
.07
23
4+
87
.27
23
5+
49
.55
23
1+
59
.99
23
0+
94
.09
23
0+
12
.45
22
9+
15
.15
22
5+
03
.58
22
2+
27
.88
22
0+
49
.81
B-B
locked w
/wall
B-C
ircle
in
B-C
ircle
out
BBBHBBBBHHHH
RT
RT
RT
RT
RT
RT
RT
LT
LT
LT
LT
LT
LT
LT
LT
NYYYYYYYYYYYYYY
28
1+
68
.56
LT
Y
21
9+
15
.98
BL
TY
71
72
73
74
75
76
77
78
79
80
81
21
8+
60
.83
21
5+
02
.99
21
4+
51
.70
214+
00.4
0
21
3+
46
.89
21
2+
92
.98
21
2+
51
.17
21
2+
06
.93
211+
53.8
1
211+
08.9
6
BHHHHHHH-B
H-B
H
LT
LT
LT
LT
LT
LT
LT
LT
LT
LT
YYYYYYYYYY
82
83
84
85
86
87
88
89
90
91
92
93
94
95
96
97
98
99
10
0
10
1
10
2
20
9+
99
.93
20
9+
56
.19
20
8+
66
.84
20
8+
10
.51
20
3+
48
.09
20
2+
21
.29
20
1+
75
.49
19
9+
76
.74
18
9+
77
.79
18
8+
70
.64
18
6+
47
.66
18
5+
69
.23
18
4+
05
.59
16
3+
98
.06
16
1+
85
.14
15
9+
12
.16
15
6+
72
.62
15
5+
87
.40
14
5+
37
.20
14
3+
37
.72
13
9+
53
.18
13
8+
42
.84
HBBB-B
lock
ed
w/p
ark
ing
bu
mp
ers
P-B
lock
ed
w/f
en
ce
BBAlle
y
BBBBB-R
t in/o
ut
BBBHHHHH-B
locked w
/wall
H-R
t in/o
ut-T
em
p b
lock
ed
LT
LT
LT
LT
LT
LT
LT
LT
LT
LT
LT
LT
LT
LT
LT
LT
LT
LT
LT
LT
LT
LT
YYYNNYYYYYYYYYYYNYYYNN1
03
PO
TE
NT
IAL
FO
R C
LO
SU
RE
SAN MATEO RD
ALTA VISTA ST
CORDOVA RD
CERRILLOS RD
AGUA FRIA ST
ALAMEDA ST
HICKOX ST
CALLE ANAYA
CALLE SARAGOSA
CAMINO SIERRA VISTA
DUNLAP ST
ROYBAL ST
MANHATTAN
PASEO DE
PERALTA
CAMINO DEL
MONTE REY
SC
AL
E: 1
"=
750’
FIG
UR
E 1
9
EX
IST
ING
AC
CE
SS
LO
CA
TIO
NS
COLUMBIA ST
MERCER ST
PASEO DE PERALTA
ST
. FR
AN
CIS
DR
CA
MIN
O D
E
LA
S C
RU
CIT
AS
H (V
iento
del N
orte
- Not S
how
n)
48
P:\0
70
13
1\
13:56
01-SEP
ST
. FR
AN
CIS
DR
IV
E C
OR
RID
OR
ST
UD
Y
INIT
IAL
EV
AL
UA
TIO
N O
F A
LT
ER
NA
TIV
ES
1
2
34
56
78
9
10
11
12
13
14
15
16
17
18
19
20
21
23
24
25
26
27
28
29
30
31
32
33
34
35
36
39
40
41
42
43
44
45
47
48
49
50
51
53
56
57
58
59
60
61
63
64
65
66
67
68
69
70
71
72
73
74
75
76
77
78
79
80
81
82
83
84
87
88
89
90
91
92
93
38
95
96
98
46
52
54
55
85
86
10
2
99
10
1
97
94
37
103
22
100

St. Francis Drive Corridor Study Initial Evaluation of Alternatives Physical Condition of the Existing Facility
P:\070131\Trans\Study\Report\St. Francis Dr Phase A rev 1c.doc 49
2. Access Management Criteria and Goals St. Francis Drive was constructed in the early 1960’s and was, in some locations, located
on an alignment that bisected an established neighborhood street network. This resulted in a significant number of individual residences and parcels having their only property access directly onto St. Francis Drive.
In addition, as the large governmental employment centers developed along the corridor, support businesses, as well as neighborhood and larger commercial centers, developed to take advantage of the large number of employees in the area, as well as the high traffic volumes that the U.S. Highway brought to the area. This commercial development contributed to the large number of access points along the corridor.
As the right-of-way through the corridor, particularly in the areas with high driveway density, is extremely limited, there are no opportunities for frontage roads to be constructed to eliminate driveway interaction with through traffic flows while providing sufficient turning radii for entering and exiting vehicles that would utilize the frontage road.
In the evaluation of access management, access must be maintained to all properties whose only access is directly onto St. Francis Drive; however the access may be restricted to right-in/right-out only, as is the case for most of the driveways on the corridor.
If a parcel serving a business, or a City street intersection, has direct access to another driveway or City street with access to St. Francis Drive, and a change in access would result in limited out-of-direction travel, then the access point to that commercial parcel or City Street will be considered for modification.
Correspondingly, if a business has multiple access points onto St. Francis Drive, and/or can be conveniently and adequately serviced through other access points on St. Francis Drive or other City streets with access to St. Francis Drive, those driveways will be considered for modification.
Removal or change in access to driveways or City streets will be considered only if there are direct alternate routes for traffic to use to their destination with no substantial change in traffic patterns or performance anticipated. 3. NMDOT State Access Management Manual
Access to New Mexico State highways is governed by the NMDOT’s State Access
Management Manual (SAMM). The SAMM, adopted in 2001, decades after the majority of access points were allowed onto St. Francis Drive, establishes the preferred policy for intersection and driveway spacing.
For an urban principal arterial, such as St. Francis Drive, with a posted speed of 35 MPH, the SAMM permits full access at one-quarter mile spacing, or every 1,320 feet. Partial access is

St. Francis Drive Corridor Study Initial Evaluation of Alternatives Physical Condition of the Existing Facility
P:\070131\Trans\Study\Report\St. Francis Dr Phase A rev 1c.doc 50
permitted every 325 feet, or approximately 16 per mile. For the portion of the corridor posted at 45 MPH, full access is permitted at the same spacing of four per mile (1,320 feet) and partial access is allowed every 450 feet, or approximately 12 per mile.
It can be seen comparing the existing average access spacing on St. Francis Drive of 23 per mile and the SAMM criteria just listed of 12 or 16 per mile, that access spacing on St. Francis Drive does not satisfy the SAMM criteria. Indeed, given the parcel configuration of the corridor, SAMM criteria cannot be met, without substantial investments in right-of-way and public and business owner hostility.
The access management criteria discussed above in Section IV.D.2 will be applied to determine the number of access points that can be eliminated, modified, or combined in order to promote more efficient traffic flow with the least disruption to the existing property owners and traffic patterns. An initial application of the access management criteria in Section IV.D.2 above results in the closure or modification of 15 driveways; reducing the total number of driveways to 75, or 19 per mile, or 1 driveway every 275 feet.
In addition, six median breaks (out of a total of 15 on the corridor) have been identified as potential closures.
E. Pavement Visual inspection of the corridor indicates much of the pavement is in good condition with isolated
areas of longitudinal cracking and pavement repair. The pavement will require maintenance based on its age but it is in good condition. F. Drainage
1. Existing Conditions Drainage in the project area generally flows east to west with a large amount of runoff
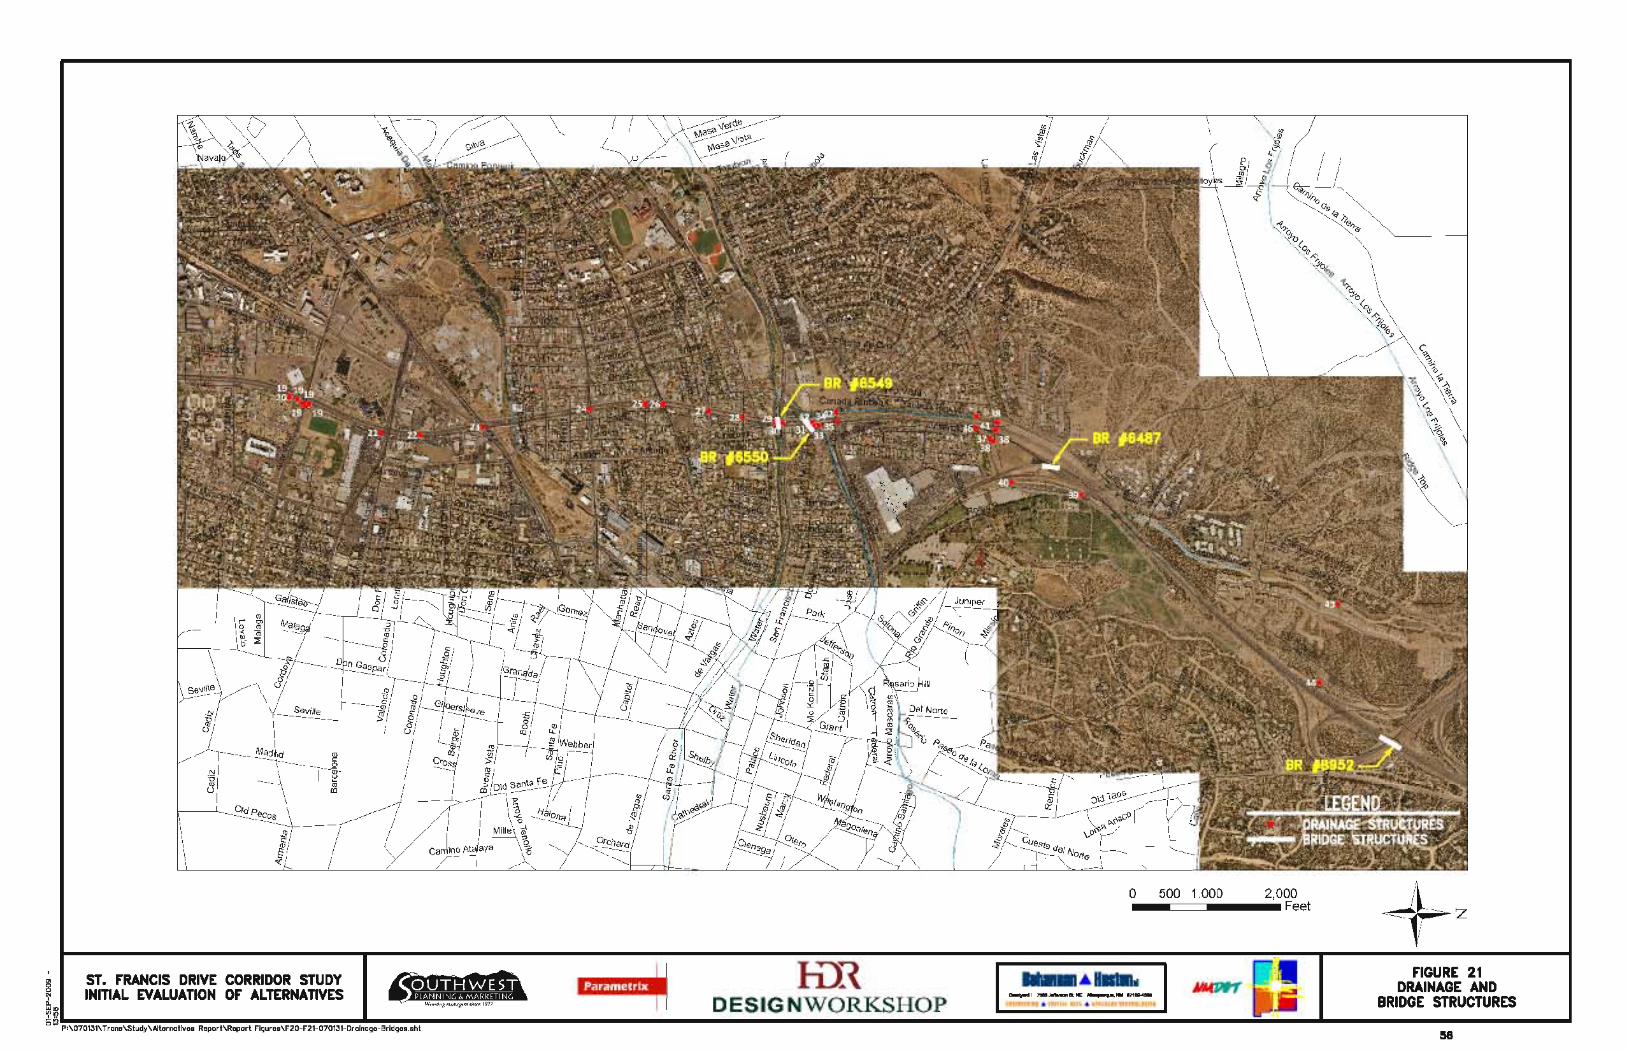
originating from the Sangre de Cristo Mountains. There are approximately 20 drainage structures that cross under St. Francis Drive between Rabbit Road and Highway 599. Table 13 provides a list of existing crossing structures in the area as well as other drainage infrastructure noted during site visits. The structures are generally identified by arroyo or street intersections with St. Francis Drive, starting with the south end of the project. The locations of these structures are shown in Figure 20 and Figure 21.
The existing structures range in size and are constructed of various materials including corrugated metal pipe (CMP), high density polyethylene (HDPE), reinforced concrete pipe (RCP), concrete box culverts (CBC), and concrete pipe (CP). Table 13 also lists notable curb drop inlets (CDI) and median drop inlets (MDI) in the area. The largest existing structure along the St. Francis Drive Corridor is a bridge located at the Arroyo de los Chamisos crossing and the smallest structure is an 18” CMP located north of West Alameda St. The crossing structures

St. Francis Drive Corridor Study Initial Evaluation of Alternatives Physical Condition of the Existing Facility
P:\070131\Trans\Study\Report\St. Francis Dr Phase A rev 1c.doc 51
along St. Francis Drive consist of both smaller structures conveying local flow from one side of an intersection to the other and larger arroyo crossings such as bridges and CBCs. This summary does not include potential storm drain systems which were undetected from the field visit.
The information provided in Table 13 was obtained from the site visits and supplemented with previous published data. The main source of previous data used was two drainage management plans completed by Bohannan Huston, Inc. (BHI) in the late 1990s. The first Drainage Management Plan is the Santa Fe River Watershed Drainage Management Plan completed by BHI in March 1997. This study mainly focuses on basins and watersheds north of the intersection of Cerrillos and St. Francis Drive. The second Drainage Management Plan was completed for the Arroyo de los Chamisos Watershed. This report was completed by BHI, June 1998 and focused on basins and watersheds south of the Cerrillos and St. Francis Drive intersection.
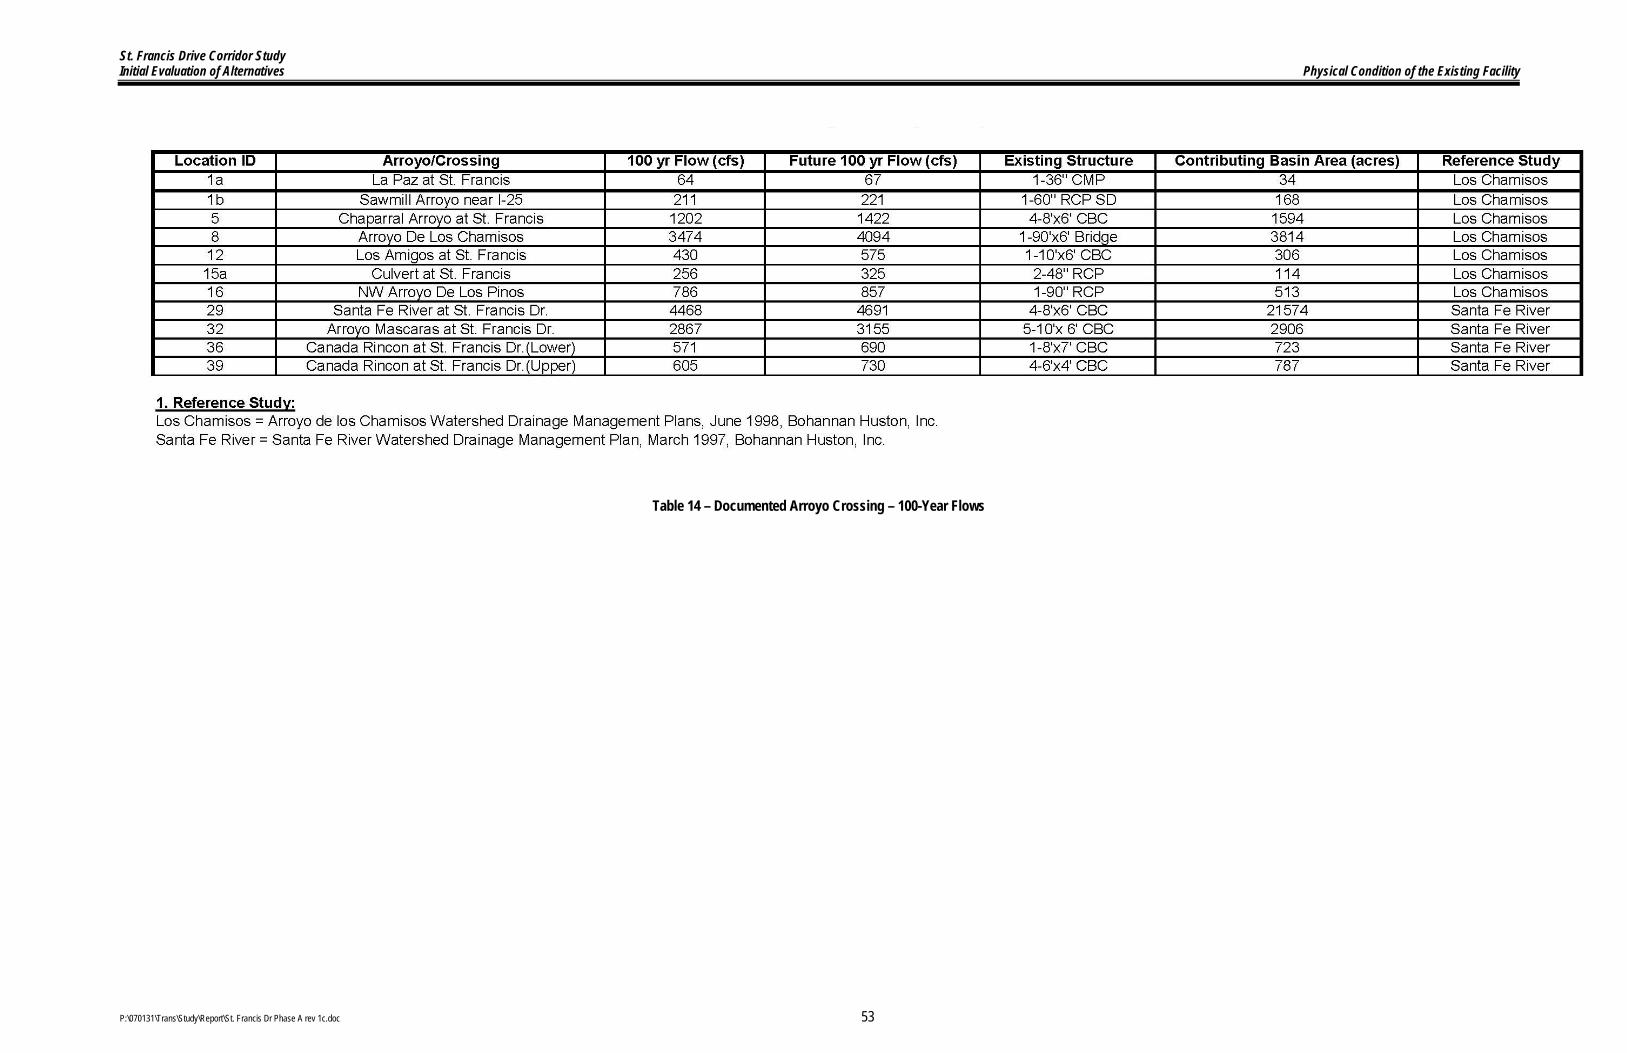
Data from these 2 reports is summarized on Table 14 which shows the location, contributing area and additional information of various arroyo crossings of St. Francis Drive. Table 14 also includes the reported values for the 100-yr storm event as well as future conditions 100-yr flows.
In addition to the existing structures noted on Table 13, an existing drainage situation has been identified by the public on St. Francis Drive at Camino Sierra Vista. During storm events runoff reaching this location can cover the intersection. These flows originate northeast of the St. Francis Drive/Camino Sierra Vista intersection near the Railyard Development. The runoff is from the outfall of a subsurface detention pond under a portion of the Railyard site and overland flow from an adjacent basin. The flow discharges into Alarid St. and flows south to the intersection of Alarid St. and Camino Sierra Vista. Here the flow turns west and flows along the north side of Camino Sierra Vista. At the intersection of Camino Sierra Vista and St. Francis Drive the runoff spreads throughout the intersection. The issue has been identified by local citizens as a concern and should be further investigated as part of any potential alternatives for the St. Francis Drive Corridor Study. It should be noted that the post-development flow rate leaving the Railyard site and reaching the St. Francis Drive/Camino Sierra Vista intersection is actually lower than the pre-Railyard developed conditions flow (due to the underground detention pond). 2. Recommendations
The majority of existing storm drain inlets are in good condition with no major structural or clogging issues noted during field investigation. However, a number of existing culverts or crossing structures have experienced considerable sediment buildup, as noted in Table 13. Table 15 presents recommendations for these structures. In addition, the previously published Drainage Management Plans provided recommendations for upsizing or other improvements to many of the existing structures under St. Francis Drive. These are also summarized in Table 15.

St. Francis Drive Corridor Study Initial Evaluation of Alternatives Physical Condition of the Existing Facility
P:\070131\Trans\Study\Report\St. Francis Dr Phase A rev 1c.doc 52
Table 13 – Existing Drainage Structures – Field Inventory
St. Francis Drive Corridor Study Initial Evaluation of Alternatives Physical Condition of the Existing Facility
P:\070131\Trans\Study\Report\St. Francis Dr Phase A rev 1c.doc 53
Table 14 – Documented Arroyo Crossing – 100-Year Flows

St. Francis Drive Corridor Study Initial Evaluation of Alternatives Physical Condition of the Existing Facility
P:\070131\Trans\Study\Report\St. Francis Dr Phase A rev 1c.doc 54
Table 15 – Recommended Drainage Improvements

FIG
UR
E 2
0
DR
AIN
AG
E A
ND
BR
IDG
E S
TR
UC
TU
RE
S
BR
#7505
BR
#7
50
3
BR
#7
50
4
BR
#7
50
6
BR
#7507
BR
#7508
BR
#7
42
5
BR
#7335
BR
#7
33
4
BR
#7336
LE
GE
ND
DR
AIN
AG
E S
TR
UC
TU
RE
S
BR
IDG
E S
TR
UC
TU
RE
S
55
P:\0
70
13
1\
13:57
01-SEP
ST
. FR
AN
CIS
DR
IV
E C
OR
RID
OR
ST
UD
Y
INIT
IAL
EV
AL
UA
TIO
N O
F A
LT
ER
NA
TIV
ES
FIG
UR
E 2
1
DR
AIN
AG
E A
ND
BR
IDG
E S
TR
UC
TU
RE
S
BR
#6
54
9
BR
#6550
BR
#6
48
7
BR
#8
95
2
LE
GE
ND
DR
AIN
AG
E S
TR
UC
TU
RE
S
BR
IDG
E S
TR
UC
TU
RE
S
56
P:\0
70
13
1\
13:58
01-SEP
ST
. FR
AN
CIS
DR
IV
E C
OR
RID
OR
ST
UD
Y
INIT
IAL
EV
AL
UA
TIO
N O
F A
LT
ER
NA
TIV
ES

St. Francis Drive Corridor Study Initial Evaluation of Alternatives Physical Condition of the Existing Facility
P:\070131\Trans\Study\Report\St. Francis Dr Phase A rev 1c.doc 57
G. Structures 1. Existing Bridges
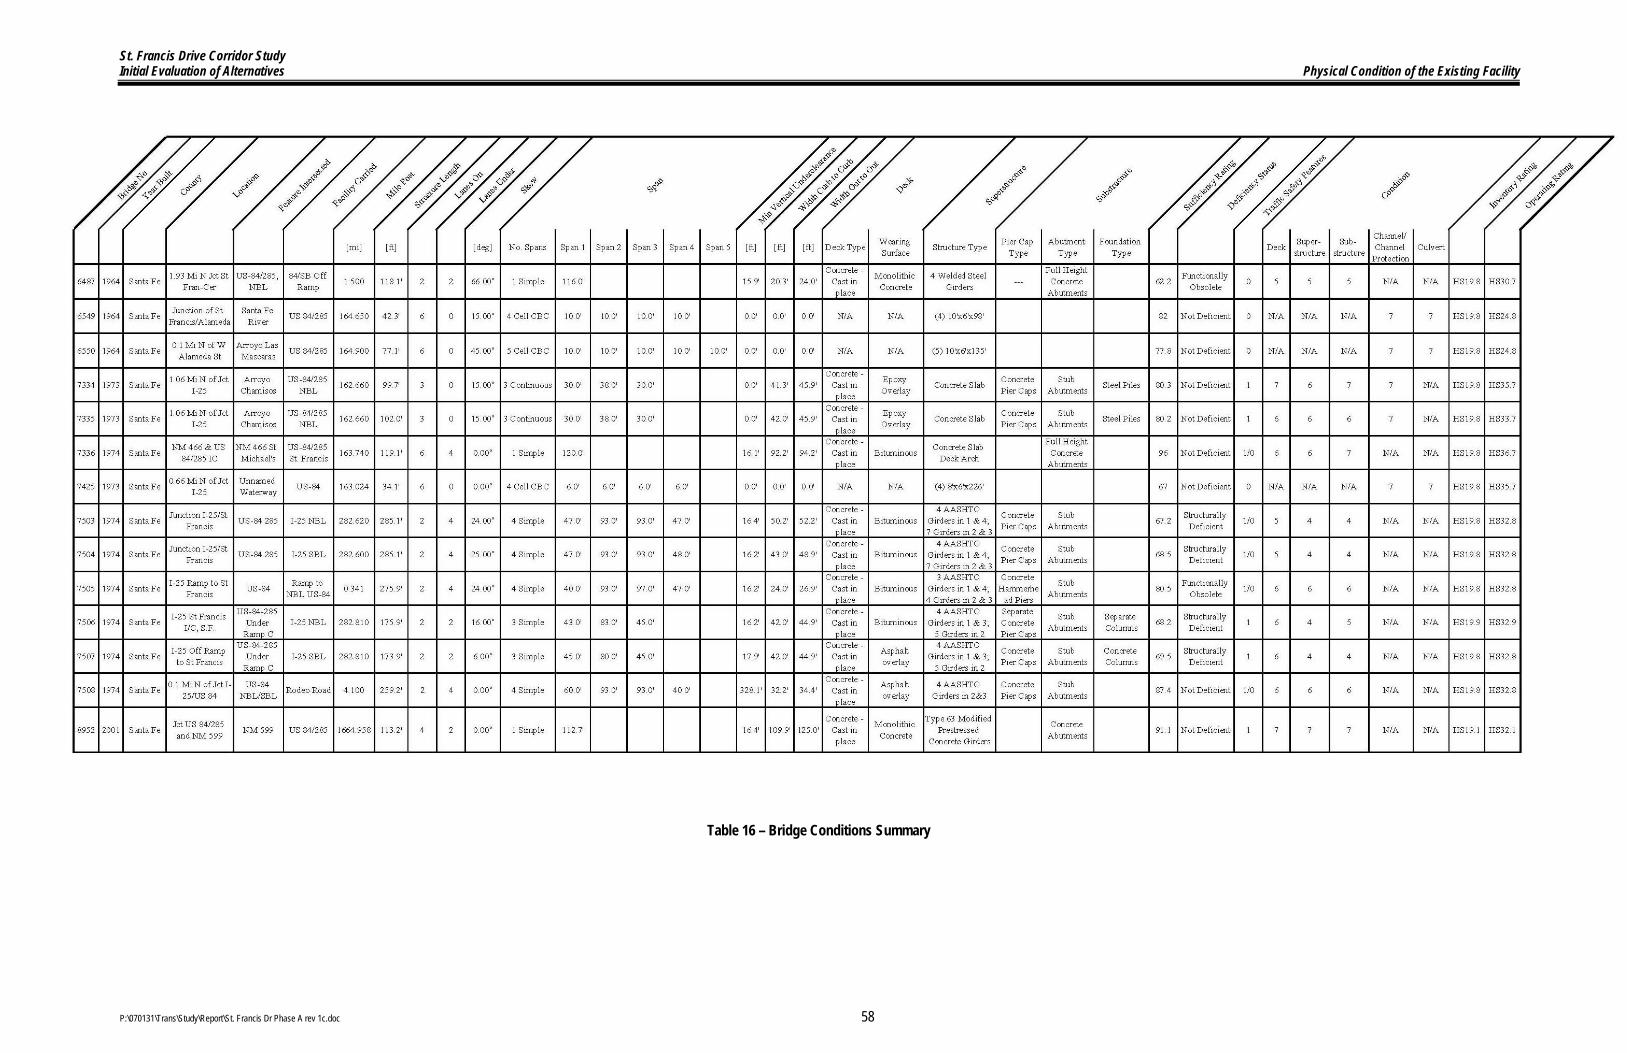
Information regarding the existing structures located within the safety corridor, including location, year built, geometry, structure, sufficiency and deficiency, may be found in Table 16. Complete DOT bridge inspection reports for all bridges are available in Appendix B. Vehicular bridges are rated and a Sufficiency Rating is assigned to each. The Sufficiency Rating is indicative of a bridge’s sufficiency to remain in service. The Sufficiency Rating is also used to define the level of federal funds available for a bridge. Federal funds are available for the rehabilitation of bridges with a Sufficiency Rating of 80 or less. Bridges with a Sufficiency Rating of 50 or less may qualify for replacement funds. The bridge structures are shown in Figure 20 and Figure 21.
St. Francis Drive Corridor Study Initial Evaluation of Alternatives Physical Condition of the Existing Facility
P:\070131\Trans\Study\Report\St. Francis Dr Phase A rev 1c.doc 58
Table 16 – Bridge Conditions Summary
St. Francis Drive Corridor Study Initial Evaluation of Alternatives Physical Condition of the Existing Facility
P:\070131\Trans\Study\Report\St. Francis Dr Phase A rev 1c.doc 59
Sufficiency Ratings are determined using the sufficiency rating formula. This formula is defined in the U.S. Department of Transportation’s report titled “Recording and Coding Guide for the Structure Inventory and Appraisal of the Nation’s Bridges”. The numeric value is a percentage in which 100 percent represents an entirely sufficient bridge and zero percent represents a totally insufficient bridge. The sufficiency rating formula utilizes the following four components to calculate the overall Sufficiency Rating for a bridge. The four components of the sufficiency rating listed in descending order of importance are:
• Structural Adequacy and Safety • Serviceability and Functional Obsolescence • Essentiality for Public Use • Special Reductions.
These four components are composed of multiple items that are used to calculate the overall Sufficiency Rating. Three items that characterize the overall existing physical condition of the bridge are the Condition Ratings of the superstructure, substructure and the deck. The Condition Rating is a numerical value ranging from zero to nine with a zero representing a failed condition and a nine representing an excellent condition. The Condition Ratings of the superstructure and substructure have a much greater influence on the overall Sufficiency Rating than the Condition Rating of the deck.
In addition to the Sufficiency Rating, the Federal Highway Administration (FHWA) classifies bridges as deficient or not deficient using a formula that considers both structural capacity and geometric configuration. Bridges classified as deficient may be structurally deficient or functionally obsolete. A bridge that is in poor condition due to deterioration or damage to the substructure, superstructure or deck is considered structurally deficient. The classification of functionally obsolete refers to a bridge with a configuration that is not adequate for the traffic it serves or a bridge with geometric characteristics such as clearances, widths and roadway alignment that no longer meet current geometric design standards. Thus a bridge that is classified as deficient may be in good condition and have adequate structural capacity if it is classified as functionally obsolete rather than structurally deficient.
The inventory rating of a bridge reflects the safe load carrying capacity of the bridge for normal service conditions. The operating rating of a bridge is a measurement of the maximum permissible load of a bridge for occasional use. All of the structures within this corridor satisfy the load-carrying requirements and do not require load restriction posting. All of the structures have an HS19.8 load rating or higher with the exception of 8952, which has an Inventory Rating of HS19.1.
Several of the structures within the corridor do not have required safety features. Structures lacking required safety features include 6487 near the Junction of St. Francis Drive and

St. Francis Drive Corridor Study Initial Evaluation of Alternatives Physical Condition of the Existing Facility
P:\070131\Trans\Study\Report\St. Francis Dr Phase A rev 1c.doc 60
Guadalupe Road, 7336 at the Junction of NM 466 and US 84, 7503 and 7504 at the Junction of I-25 and St. Francis Drive, and 7505 at the I-25 ramp to St. Francis Drive. Structures 6487, 6549, 6550 and 7425 need all the safety features brought up to standard, including bridge rail, transition, approach rail, and approach rail ends. For structures 7336 and 7508, the transition, approach rail, and approach rail ends all need to be brought up to standard. Structure 7503 has substandard transitions and approach rail ends. Structure 7504 needs an updated transition. Structure 7505 has substandard approach rail ends.
Within this corridor, eight structures are not deficient, two are functionally obsolete, and four are structurally deficient. Bridges 6487 and 7505 are functionally obsolete due to inadequate deck geometry. Bridges 7503, 7504, 7506 and 7507 are structurally deficient. Bridge 7503 is structurally deficient due to deteriorated girder ends and pier caps which needs repair as soon as possible and which contribute to low condition ratings for these elements. Bridge 7504 has low condition ratings for superstructure and substructure due to deterioration of girder ends and pier caps. Bridge 7506 has a low superstructure condition rating due to spalling and deterioration of the girder ends. Bridge 7507 has low superstructure and substructure ratings. The girder ends are deteriorated with spalls up to 2’ x 6” and exposed rebar up to 1’. Pier caps have cracks, spalls up to 1’ x 4” with 14” of exposed rebar, and delamination up to 53’ x 3’.
Bridges 6487, 7506, and 7507 have dirt and cinder build up at the joints, but the joints are in good shape and are not leaking. Bridges 7503 and 8952 have dirt and cinder build up at the joints with locations of isolated joint failure. Bridges 7336 and 7504 have dirt and cinder build up at the joints. Bridge 7336 has large areas of loss of adhesion and deformed seals. Bridge 7504 needs the joint at the center of the bridge replaced.
Several of the structures have erosion issues which need to be addressed. Erosion repair is recommended at the following bridges and locations: Bridge 7503 at the NW abutment, Bridge 7334 at the abutments, Bridge 7335 at the abutment corners, Bridge 8952 at the slope paving at the Southwest corner.
Bridge 8952 requires MSE retaining wall repair at the south abutment. Isolated MSE panels are misaligned with a separation of panels and should be repaired.
One of the bridge structures has issues with the bearings that need to be addressed. The moveable bearings at structure 7504 have heavy rust with minor section loss. Some of these bearings are slightly tilted and could be frozen. Painting and resetting the bearings is recommended by the inspection team.
Bridge 7507 needs repairs at the girder ends, pier caps, and abutments. Bridge 7508 has a girder that needs repair. Structures 6549 and 6550 requires repair work on the top slab and parapet at the inlet.