Embed Size (px)
Citation preview
Committed to Connecting the World
Monitoring broadband deployment, competition, access and adoption !
ITU/BDT Regional Economic and Financial Forum of Telecommunications/ICTs for Asia and Pacific!Yangon, The Republic of the Union of Myanmar, 1-2 September 2014!
Colin Oliver
The views expressed in this presentation are those of the author and do not necessarily reflect the opinions of the ITU or its Membership.
Committed to Connecting the World
Monitoring the state of broadband …!§ Session three introduced the issue of good practice in
monitoring broadband. !q Good practice examples continue to emerge!
§ Technological trends clearly need to be monitored!q On the user side, the main focus is on devices and services –
these can change rapidly. !q On the supply side, the main focus is on delivery
technologies – these tend to change more slowly. !§ In this session we look a little further at monitoring competition
and broadband adoption!
2
Committed to Connecting the World
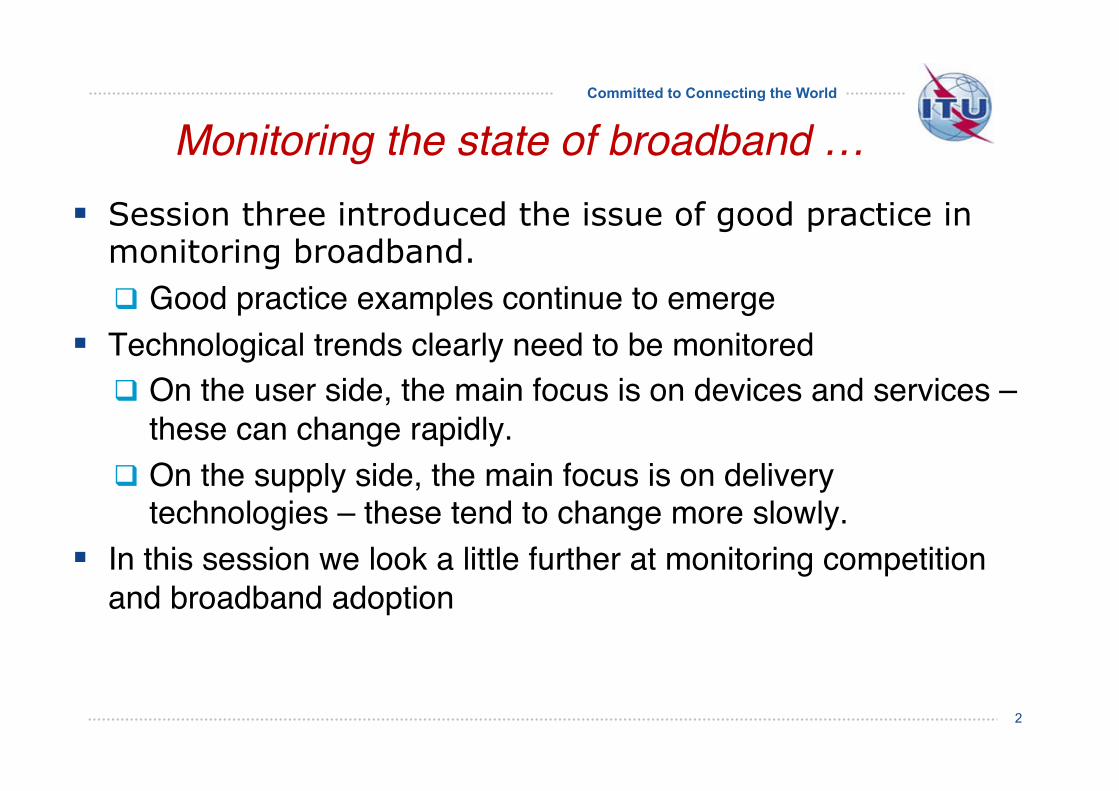
Our Target Basic broadband for all by 2013: 100% in 2013 Fast broadband (>30Mbps) for all by 2020: 62% in 2013
Basic broadband is available to all in the EU, when considering all major technologies (xDSL, Cable, Fibre to the Premises, WiMax, HSPA, LTE and Satellite). Taking only fixed, fixed wireless (WiMAX) and mobile wireless (HSPA and LTE) into account, the coverage goes down to 99.4%. Fixed and fixed-wireless technologies cover 97.2% of EU homes. Next Generation Access technologies (VDSL, Cable Docsis 3.0 and FTTP) capable of delivering at least 30Mbps download are available to 62%. Coverage in rural areas is substantially lower for fixed technologies (89.8%), and especially for NGA (18.1%)
Broadband coverage: Basic broadband is available to everyone in the EU, while fixed technologies cover 97% leaving 6 million homes unconnected. Next Generation Access (NGA) covers 62%, up from 54% a year ago. Deployment of 4G mobile increased sharply. Rural coverage remains significantly lower, especially in NGA.
Digital Agenda Scoreboard 2014 – Broadband markets Source: http://ec.europa.eu/digital-agenda/en/news/scoreboard-2014-trends-european-broadband-markets-2014
3
0%
20%
40%
60%
80%
100%
Fixed &
mobile
Fixed
NGA
DSL
VDSL
FTTP
WiM
AX
Standard cable
Docsis 3.0 cable
HSPA
LTE
Satellite
End of 2012 End of 2013
Total coverage by technology at EU level, 2012 - 2013
Source: IHS, VVA and Point Topic
0%
20%
40%
60%
80%
100% Fixed &
mobile
Fixed
NGA
DSL
VDSL
FTTP
WiM
AX
Standard cable
Docsis 3.0 cable
HSPA
LTE
Satellite
End of 2012 End of 2013
Rural coverage by technology at EU level, 2012 - 2013
Source: IHS , VVA and Point Topic
Committed to Connecting the World
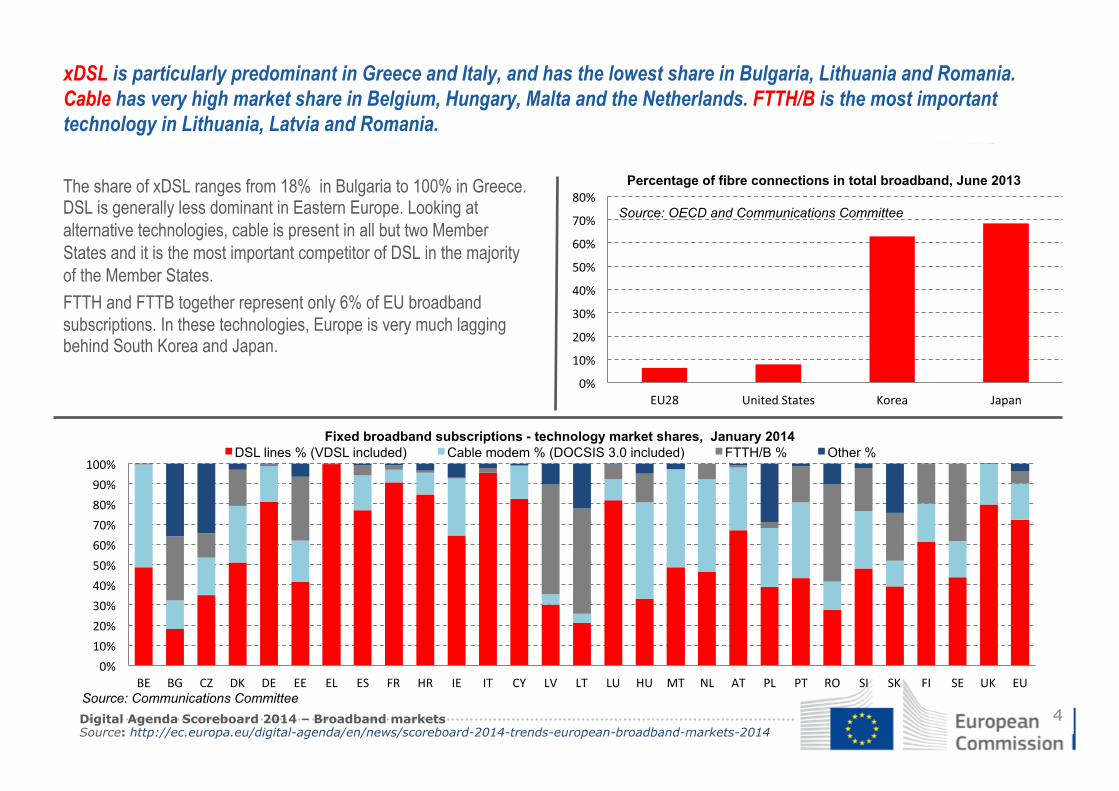
The share of xDSL ranges from 18% in Bulgaria to 100% in Greece. DSL is generally less dominant in Eastern Europe. Looking at alternative technologies, cable is present in all but two Member States and it is the most important competitor of DSL in the majority of the Member States. FTTH and FTTB together represent only 6% of EU broadband subscriptions. In these technologies, Europe is very much lagging behind South Korea and Japan.
xDSL is particularly predominant in Greece and Italy, and has the lowest share in Bulgaria, Lithuania and Romania. Cable has very high market share in Belgium, Hungary, Malta and the Netherlands. FTTH/B is the most important technology in Lithuania, Latvia and Romania.
Digital Agenda Scoreboard 2014 – Broadband markets Source: http://ec.europa.eu/digital-agenda/en/news/scoreboard-2014-trends-european-broadband-markets-2014
4
0%
10%
20%
30%
40%
50%
60%
70%
80%
EU28 United States Korea Japan
Percentage of fibre connections in total broadband, June 2013
Source: OECD and Communications Committee
0% 10% 20% 30% 40% 50% 60% 70% 80% 90% 100%
BE BG CZ DK DE EE EL ES FR HR IE IT CY LV LT LU HU MT NL AT PL PT RO SI SK FI SE UK EU
DSL lines % (VDSL included) Cable modem % (DOCSIS 3.0 included) FTTH/B % Other % Fixed broadband subscriptions - technology market shares, January 2014
Source: Communications Committee
Committed to Connecting the World
Cycle of consumer adoption/product life cycle observed in Canada
5
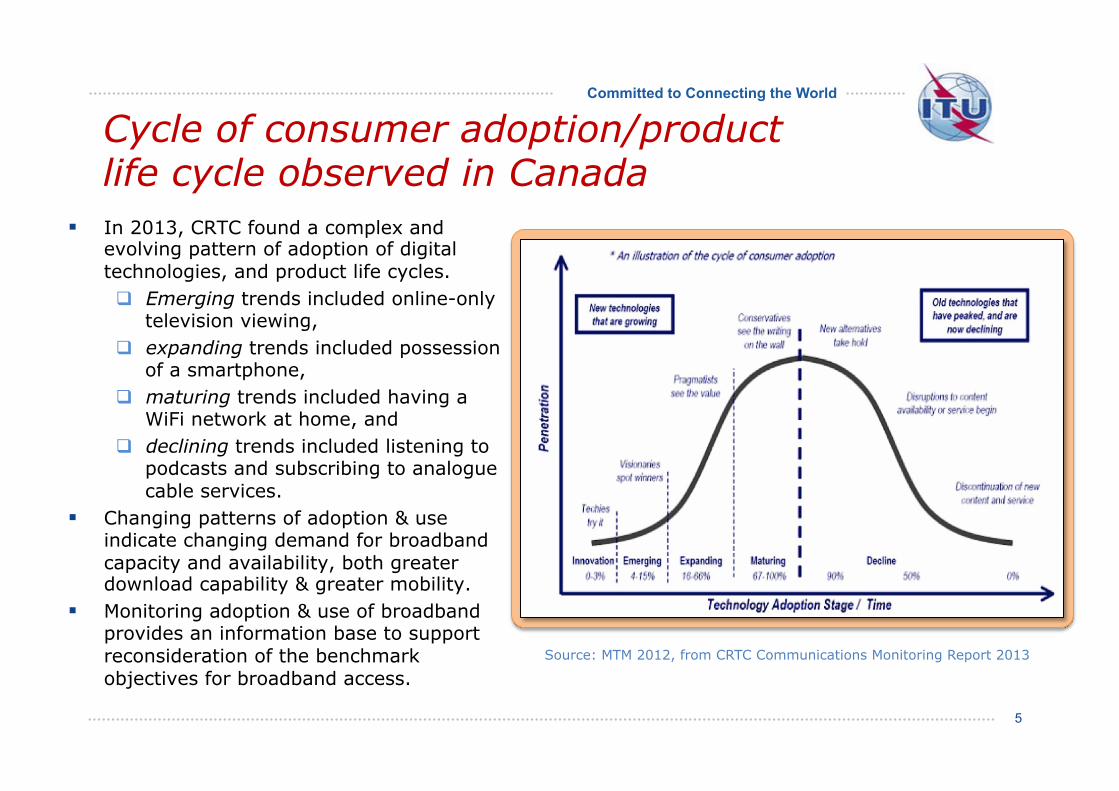
§ In 2013, CRTC found a complex and evolving pattern of adoption of digital technologies, and product life cycles. q Emerging trends included online-only
television viewing, q expanding trends included possession
of a smartphone, q maturing trends included having a
WiFi network at home, and q declining trends included listening to
podcasts and subscribing to analogue cable services.
§ Changing patterns of adoption & use indicate changing demand for broadband capacity and availability, both greater download capability & greater mobility.
§ Monitoring adoption & use of broadband provides an information base to support reconsideration of the benchmark objectives for broadband access.
Source: MTM 2012, from CRTC Communications Monitoring Report 2013
Committed to Connecting the World
Monitoring competition
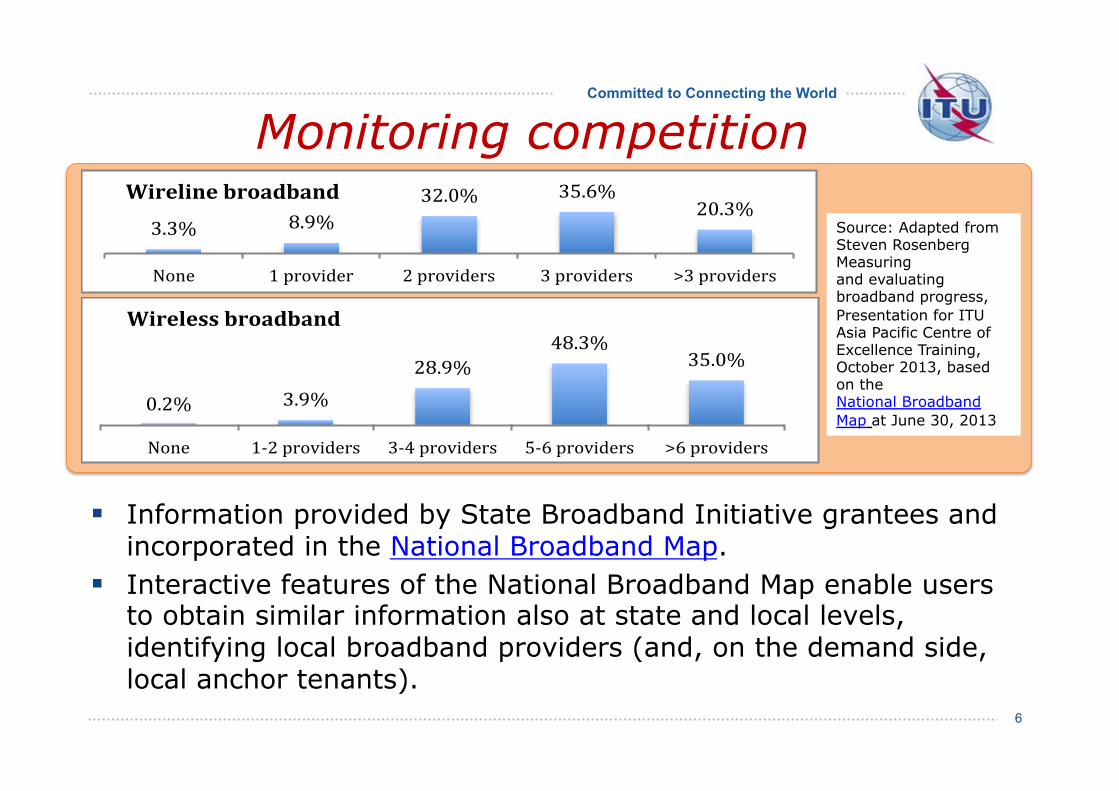
§ Information provided by State Broadband Initiative grantees and incorporated in the National Broadband Map.
§ Interactive features of the National Broadband Map enable users to obtain similar information also at state and local levels, identifying local broadband providers (and, on the demand side, local anchor tenants).
6
!
!
3.3%$ 8.9%$32.0%$ 35.6%$
20.3%$
None$ 1$provider$ 2$providers$ 3$providers$ >3$providers$
Wireline'broadband'
0.2%$ 3.9%$28.9%$
48.3%$35.0%$
None$ 182$providers$ 384$providers$ 586$providers$ >6$providers$
Wireless'broadband'
Source: Adapted from Steven Rosenberg Measuring and evaluating broadband progress, Presentation for ITU Asia Pacific Centre of Excellence Training, October 2013, based on the National Broadband Map at June 30, 2013
Committed to Connecting the World
Different forms of competition
7
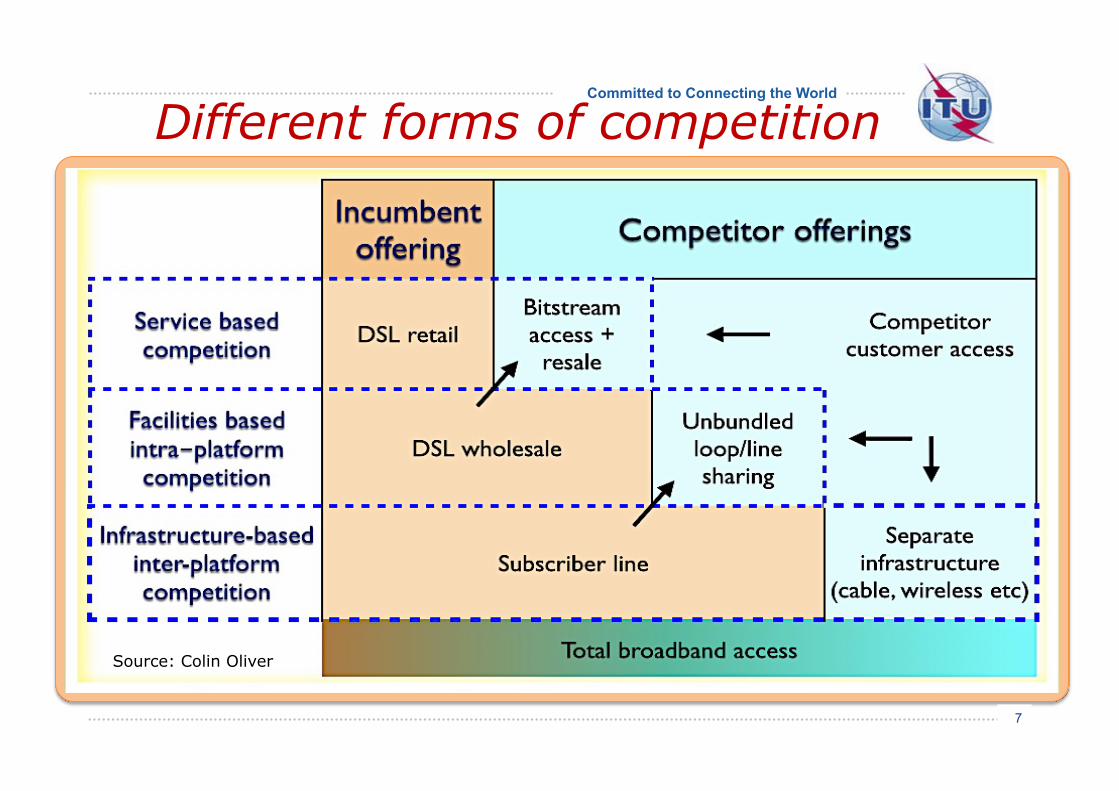
Source: Colin Oliver
Committed to Connecting the World
Monitoring wholesale access & competition in Europe
§ In Europe, there is reporting on service as well as infrastructure-based competition, and action lines in the Digital Agenda support streamlined regulatory measures for wholesale access pricing.
§ The Commission monitors the extent of wholesale access from incumbents in terms of activated main lines, whether shared or fully unbundled lines, bitstream access or simple resale. This information is obtained from national regulators and is published online.
§ The Commission also monitors changes in the competitive landscape over time … Source: Digital Agenda for Europe Pillar IV: Fast and ultra-fast Internet access, actions 112-114 and European Commission Report: Fixed broadband wholesale lines & agreements, January 2014 8
Committed to Connecting the World
9 Source: https://ec.europa.eu/digital-agenda/en/pillar-4-fast-and-ultra-fast-internet-access
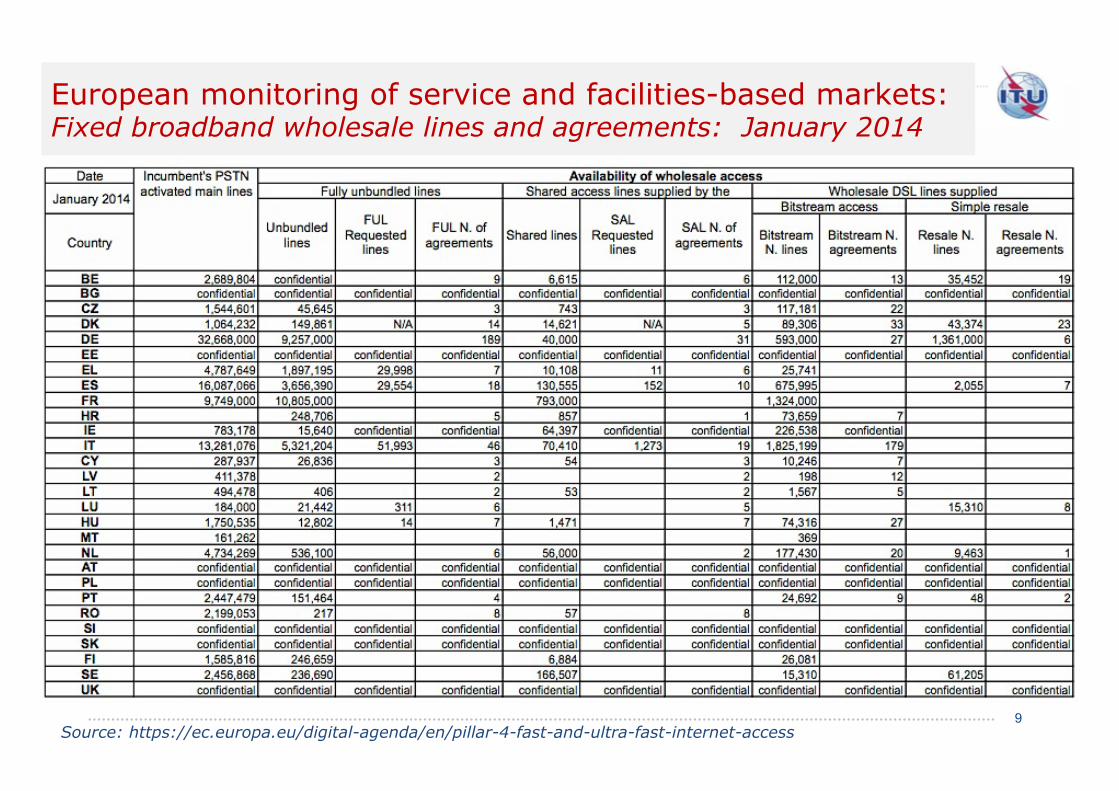
European monitoring of service and facilities-based markets: Fixed broadband wholesale lines and agreements: January 2014
Committed to Connecting the World
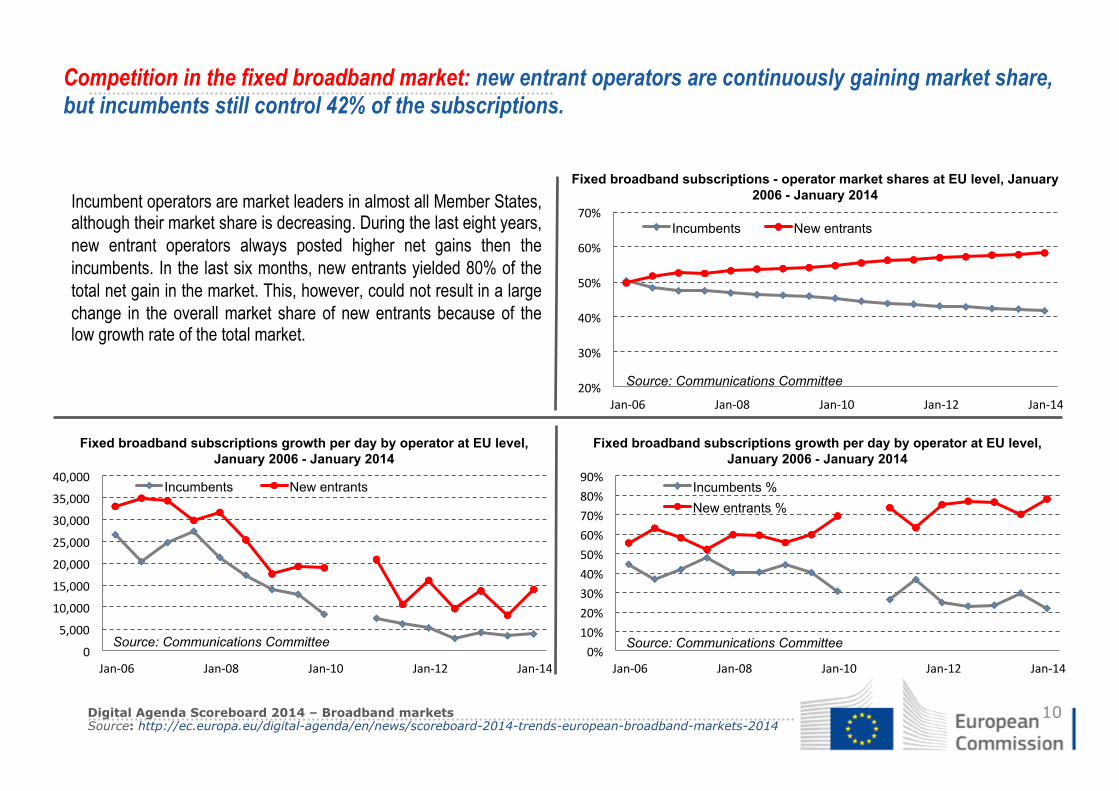
Incumbent operators are market leaders in almost all Member States, although their market share is decreasing. During the last eight years, new entrant operators always posted higher net gains then the incumbents. In the last six months, new entrants yielded 80% of the total net gain in the market. This, however, could not result in a large change in the overall market share of new entrants because of the low growth rate of the total market.
Competition in the fixed broadband market: new entrant operators are continuously gaining market share, but incumbents still control 42% of the subscriptions.
Digital Agenda Scoreboard 2014 – Broadband markets Source: http://ec.europa.eu/digital-agenda/en/news/scoreboard-2014-trends-european-broadband-markets-2014
10
20%
30%
40%
50%
60%
70%
Jan-‐06 Jan-‐08 Jan-‐10 Jan-‐12 Jan-‐14
Incumbents New entrants
Fixed broadband subscriptions - operator market shares at EU level, January 2006 - January 2014
Source: Communications Committee
0
5,000
10,000
15,000
20,000
25,000
30,000
35,000
40,000
Jan-‐06 Jan-‐08 Jan-‐10 Jan-‐12 Jan-‐14
Incumbents New entrants
Fixed broadband subscriptions growth per day by operator at EU level, January 2006 - January 2014
Source: Communications Committee 0%
10% 20% 30% 40% 50% 60% 70% 80% 90%
Jan-‐06 Jan-‐08 Jan-‐10 Jan-‐12 Jan-‐14
Incumbents % New entrants %
Fixed broadband subscriptions growth per day by operator at EU level, January 2006 - January 2014
Source: Communications Committee
Committed to Connecting the World Monitoring vertically separated wholesale service provision
§ Downstream providers rely on the wholesale network to deliver services to consumers and businesses.
§ Two broad approaches to vertical separation : q separation of an incumbent (e.g., UK & NZ), or q creation of a new entity (e.g., Australia, Singapore).
§ UK and Singapore monitor the wholesaler similarly: q Openreach in UK committed to service targets, with
payments to client telcos where targets are missed. q In Singapore OpenNet's USO requires it to provide optical
fibre services to any location in Singapore on request. IDA imposed a penalty of SNG $750,000 on OpenNet for failing to meet its USO from Jan to June 2013 & failing QoS standards.
Sources: Ofcom New rules for faster telecoms repairs and installation December 19, 2013, Openreach: Where and when, OpenNet, homepage and IDA, OpenNet Failed to Meet Universal Service Obligation and Quality of Service Standards 20 November 2013 11
Committed to Connecting the World
http://connectaschool.org
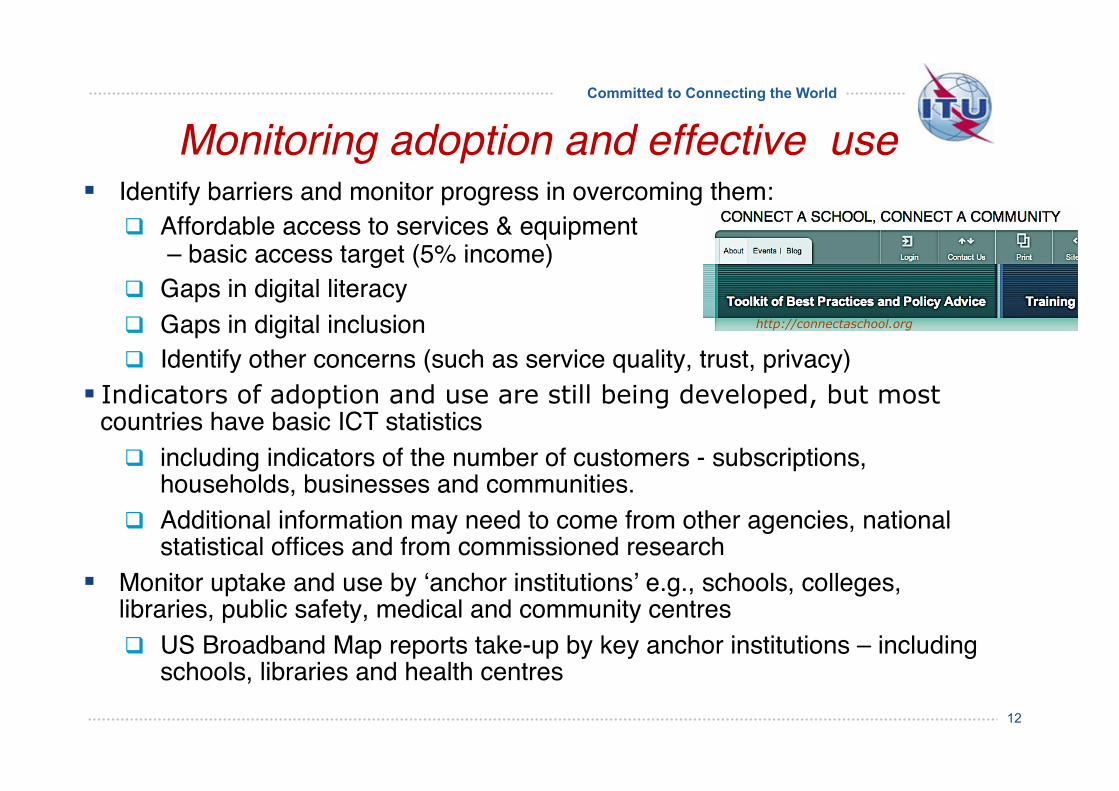
Monitoring adoption and effective use!§ Identify barriers and monitor progress in overcoming them: !
q Affordable access to services & equipment – basic access target (5% income)!
q Gaps in digital literacy !q Gaps in digital inclusion!q Identify other concerns (such as service quality, trust, privacy)!
§ Indicators of adoption and use are still being developed, but most countries have basic ICT statistics !
q including indicators of the number of customers - subscriptions, households, businesses and communities. !
q Additional information may need to come from other agencies, national statistical offices and from commissioned research!
§ Monitor uptake and use by ‘anchor institutions’ e.g., schools, colleges, libraries, public safety, medical and community centres!q US Broadband Map reports take-up by key anchor institutions – including
schools, libraries and health centres!12
Committed to Connecting the World
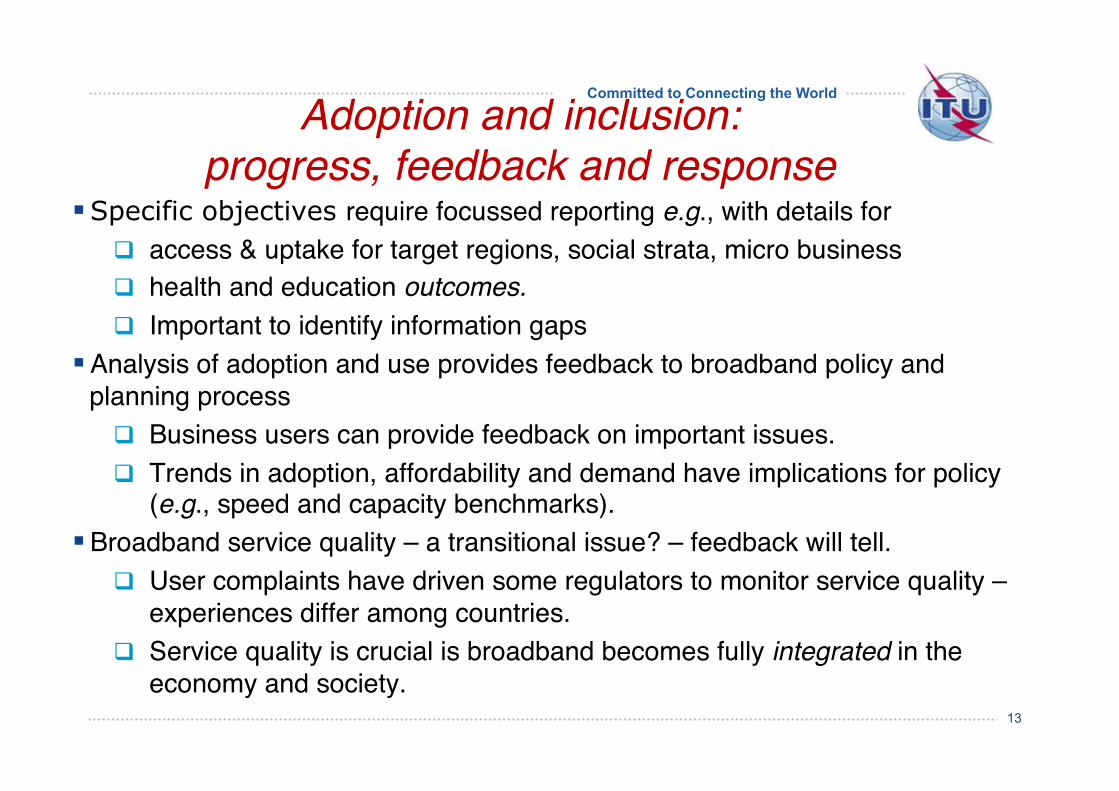
Adoption and inclusion: progress, feedback and response!
§ Specific objectives require focussed reporting e.g., with details for !q access & uptake for target regions, social strata, micro business !q health and education outcomes. !q Important to identify information gaps!
§ Analysis of adoption and use provides feedback to broadband policy and planning process!q Business users can provide feedback on important issues.!q Trends in adoption, affordability and demand have implications for policy
(e.g., speed and capacity benchmarks). !§ Broadband service quality – a transitional issue? – feedback will tell. !
q User complaints have driven some regulators to monitor service quality – experiences differ among countries.!
q Service quality is crucial is broadband becomes fully integrated in the economy and society.!
13
Committed to Connecting the World
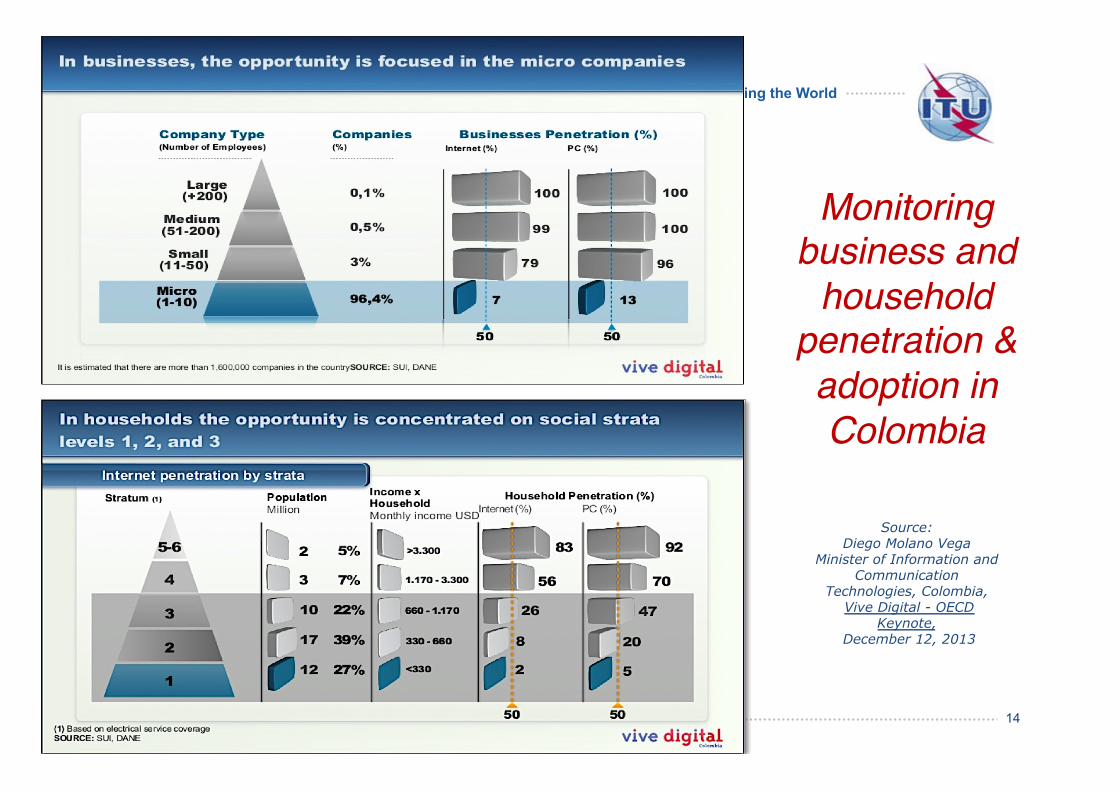
Monitoring business and
household penetration & adoption in Colombia !
Source: Diego Molano Vega
Minister of Information and Communication
Technologies, Colombia, Vive Digital - OECD
Keynote, December 12, 2013
14
Committed to Connecting the World
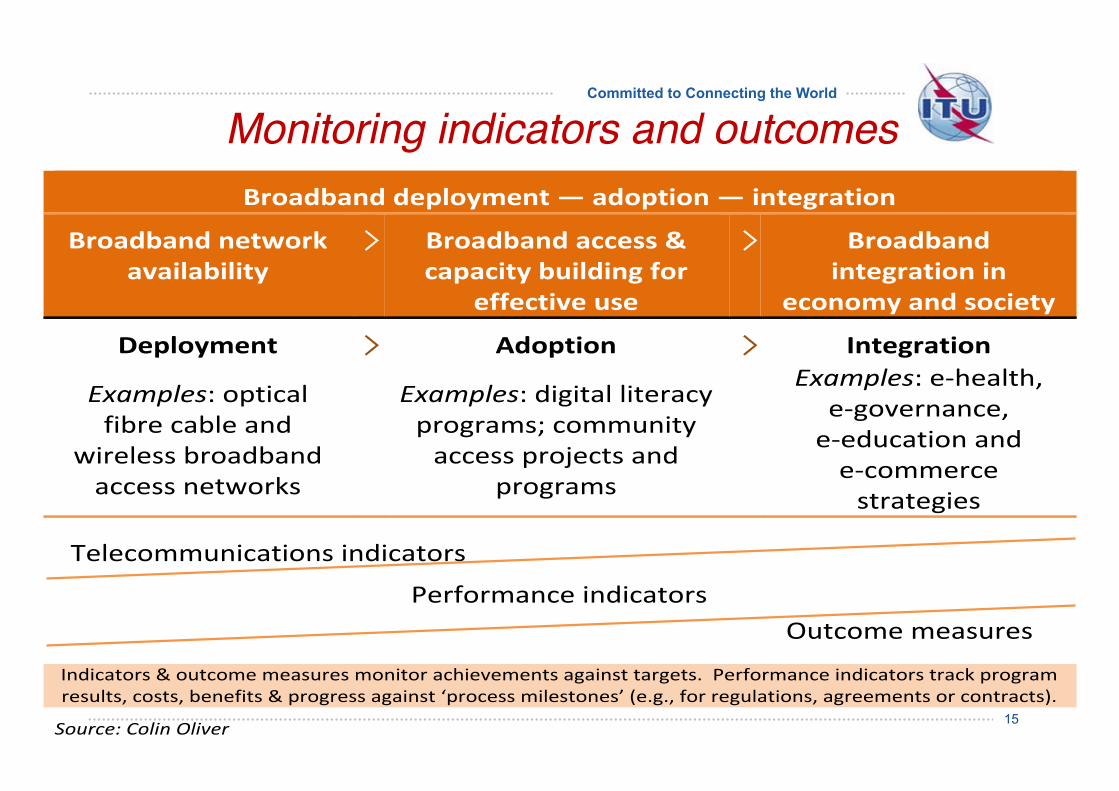
Monitoring indicators and outcomes!
15
! Broadband!deployment!—!adoption!—!integration!!
Broadband!network!!availability!
� ! Broadband!access!&!capacity!building!for!
effective!use!
� ! Broadband!integration!in!
economy!and!society!
Deployment! � ! Adoption! � ! Integration!
Examples:!optical!fibre!cable!and!
wireless!broadband!access!networks!
!
Examples:!digital!literacy!programs;!community!access!projects!and!
programs!
)
Examples:!e9health,!e9governance,!e9education!and!e9commerce!strategies)
!! Telecommunications!indicators!
Performance!indicators!! Outcome!measures!
!Indicators!&!outcome!measures!monitor!achievements!against!targets.!!Performance!indicators!track!program!results,!costs,!benefits!&!progress!against!‘process!milestones’!(e.g.,!for!regulations,!agreements!or!contracts).!!
Source:)Colin)Oliver!
!
Committed to Connecting the World
Looking around and ahead …!§ Large business and government should not be the only focus.
q Small businesses (SMEs) have a larger work force in most countries, and have an essential role in driving the uptake and use of broadband.
§ The Australian Communications and Media Authority (ACMA) has expanded its reporting: for example: q Australian SMEs in the digital economy examined the intensity of online
activity by SMEs, and new ways of doing business with online technology. q ACMA found Australian businesses use mobile broadband to drive
productivity, make faster decisions, improve product and service quality — increasing economic activity by about AUD$33.8 billion in 2006-2013.
§ As dependence on broadband connectivity grows, regulators will continue to monitor the availability, speed, affordability and reliability of broadband services and overcome remaining barriers to the adoption and use of high speed broadband connectivity.
References: ACMA Communications report 2012–13 and Report 1 – Australian SMEs in the digital economy. Brief ‘snapshot’ reports cover topics such as Australians cut the cord, The mobile business, The connected business, Home is where the work is, Regional Australia in the digital economy and Aussie teens online. Subscribe at http://www.acma.gov.au/theACMA/engage-blogs/engage-blogs/All-blogs/Subscribe-to-engage
16
Committed to Connecting the World
Conclusions – issues to consider!§ Monitoring broadband markets is becoming increasingly
complex – with wholesale access a key concern. § Indicators of availability, adoption and use of broadband
can facilitate useful international comparisons. § Adoption indicators may usefully target under-served
socio-economic groups and regions with special needs. § As small business and private users become more
sophisticated, and online services become more pervasive, new issues may arise that call for monitoring.
§ Support national and international work on impacts on social and economic life, reviewing benchmarks if necessary.
17