Embed Size (px)
Citation preview

Item 8.1: CEO Update
Bill Magness
President & CEO
ERCOT
Board of Directors Meeting
ERCOT Public
February 14, 2017

Item 8.1
ERCOT Public
State of the Grid
2
The 2016 State of the Grid
Report, released today,
focuses on continuing
initiatives and successes
from 2016.
Additional copies are
available if needed.

Item 8.1
ERCOT Public
CEO Update: Variance to Budget ($ in Millions)
Net Revenues After Department Expenditures
3
Major Revenue Variances
$2.0 M over budget: system administration fees favorable due to stronger economy
Major Expenditure Variances
$3.7 M under budget: resource management ($3.5 M staffing management; $1.0 M project work; $-0.8 M staff backfill)
$2.5 M under budget: computer hardware and other equipment purchases
$1.8 M under budget: employee health, relocation and immigration costs
$1.4 M under budget: interest expense due to project funding and no revolver usage; interest income due to higher rates
$1.2 M under budget: external studies/consulting services
Preliminary 2016 Net Revenues at Year End: $13.4 M Favorable
2017 Revenues (as of February 5, 2017)
Major Revenue Variances
$1.4 M under budget: system administration fees unfavorable due to mild weather

Item 8.1
ERCOT Public
Q4 2016 Key Performance Indicator (KPI) Summary
4
Stretch Target Below
Reliable Grid
Grid Security Management/ Real-Time System
Control/ Scheduling and Dispatch 100%
Outage Coordination/Planning 100%
Forecasting 50% 50%
Compliance Monitoring and Reporting 67% 33%
IT Application Services 66% 17% 17%
Efficient Electricity Markets
Bidding, Scheduling and Pricing 100%
Settlement and Billing 50% 50%
Market Credit 100%
Market Information 100%
IT Application Services 100%
Open Access and Retail Choice
Customer Switching/Registry 100%
Market Information 100%
IT Application Services 100%
Other Support and Management Functions
Finance 100%
Security 100%
Total number of KPIs tracked:
Percent meeting stretch:
Percent meeting target:
Percent below target:
YTD - 2016
30
67%
23%
10%

Item 8.1
ERCOT Public
• Benefits: The project offers several benefits.
‒ Improve support (new version).
‒ Upgrade technology (Operating System, DB, etc.).
‒ Enable Resource Entities to make model changes.
‒ Improve internal supportability for weekly model loads.
‒ Improve cyber security protection.
• Status: The project is near go-live.
‒ Testing has validated functionality with low defect levels.
‒ Market Participant training is completed.
• Concern: The project is not tracking to expectations due to concerns.
‒ System stability (intermittent system restarts).
‒ Performance (for high-volume use).
‒ Operational readiness (requires end-to-end testing of model load process).
• Recommendation: Steering Committee recommends additional hardening.
‒ Ensure stability, performance and readiness prior to go-live.
‒ Update plan to determine revised date.
Major Project Not Tracking: NMMS
5

Item 8.1
ERCOT Public
Looking Ahead: What key developments are we
preparing for on the ERCOT System?
Since the Board’s last meeting of 2016,
ERCOT stakeholders and staff
completed several reports:
– Long-Term System Assessment
(LTSA)
– Existing and Potential
Constraints & Needs (C&N)
– December 2016 Report on
Capacity, Demand & Reserves
(CDR)
– Demand & Energy (D&E) for 2016
Although forecasts are not predictions,
here are some highlights on what the
2016 reports indicate about ERCOT’s
future.
6

Item 8.1
ERCOT Public
ERCOT-wide developments
• Increased load forecast appeared in
December CDR.
• In LTSA scenarios, load growth continued
in all but one scenario.
• The one scenario that did not indicate
load growth was based on high
penetration of distributed energy
resources and increased energy
efficiency.
• D&E shows continued wind growth
in 2016, both in megawatts and
penetration percentages. Numerous
future wind projects qualified for CDR.
7
Item 8.1
ERCOT Public
0
5000
10000
15000
20000
25000
30000
MW
Natural Gas
Coal
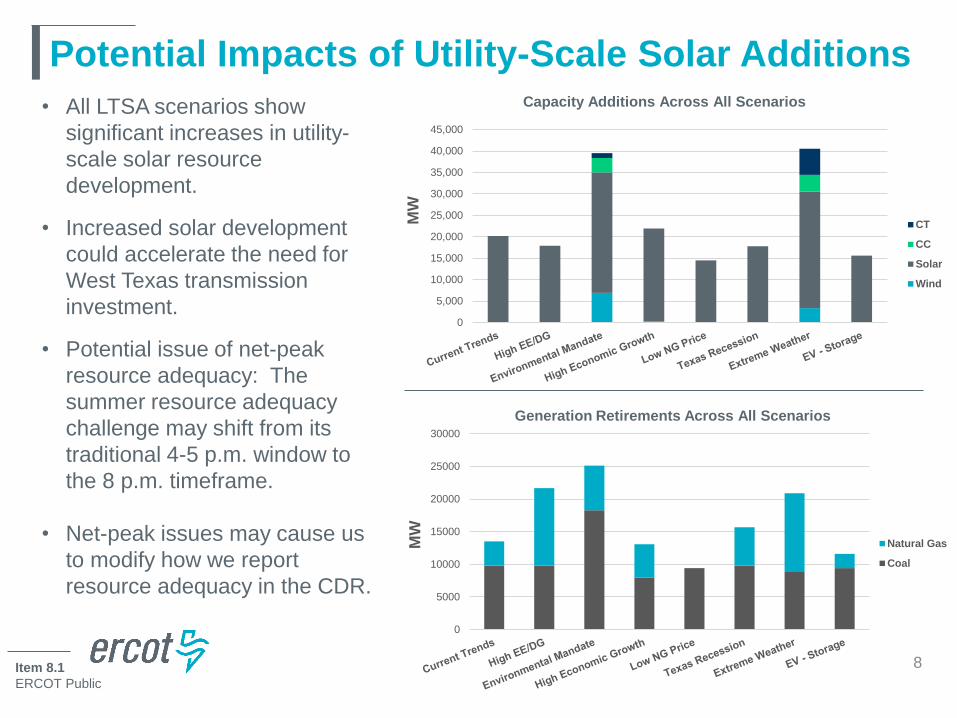
Potential Impacts of Utility-Scale Solar Additions
8
• All LTSA scenarios show
significant increases in utility-
scale solar resource
development.
• Increased solar development
could accelerate the need for
West Texas transmission
investment.
• Potential issue of net-peak
resource adequacy: The
summer resource adequacy
challenge may shift from its
traditional 4-5 p.m. window to
the 8 p.m. timeframe.
• Net-peak issues may cause us
to modify how we report
resource adequacy in the CDR.
0
5,000
10,000
15,000
20,000
25,000
30,000
35,000
40,000
45,000
MW
CT
CC
Solar
Wind
Capacity Additions Across All Scenarios
Generation Retirements Across All Scenarios

Item 8.1
ERCOT Public
Texas Panhandle
9
• According to the LTSA, expected generation additions in
the Panhandle are likely to necessitate additional
transmission improvements.
• ERCOT will need to continue its focus on stability
constraints and other issues associated with exporting
large amounts of wind out of the region.
• Similar stability constraints are being seen in other parts
of ERCOT.
3,804
4,6284,997
5,277
0
1,000
2,000
3,000
4,000
5,000
6,000
2016 2017 2018 2019
Year
Existing and Planned Panhandle Generation as of October 2016
Cum
ula
tive C
apacity (
MW
)

Item 8.1
ERCOT Public
West Texas
10
• ERCOT and the Regional Planning Group endorsed six
major transmission projects in 2016, with others under review.
• Numerous system improvements are completed and
underway. C&N reported: “For the first time in many years
none of the top 15 constraints on the ERCOT system
were related to oil and gas demand growth … in West Texas.”
• However … Energy Ventures Analysis (EVA) analysis found that,
“Permian Basin drilling activity remains the strongest of all the United
States oil plays and that the Permian Basin, being a world class oil field,
would quickly see a significant rebound in activity once oil prices recover.”
1797 18612071
2172 2256
26692872 2933
1000
1500
2000
2500
3000
3500
2009 2010 2011 2012 2013 2014 2015 2016
Dem
and (
MW
)
Far West Weather Zone Peak Demand

Item 8.1
ERCOT Public
South Texas & the Lower Rio Grande Valley
11
• 2016: Energized 345-kV Valley Import and Cross Valley projects, and ERCOT Board
endorsed Hidalgo-Star (345-kV) and LRGV (two 300-MVAR SVC) projects.
• ERCOT Operations’ efforts to improve Valley import limits: Depending on conditions,
actions could increase load-serving capability for the Valley by up to 400-500 MW.
• Development of proposed Liquefied Natural Gas (LNG) facilities at the Port of
Brownsville would likely require additional LRGV generation and/or additional
transmission import lines.

Item 8.1
ERCOT Public
Houston and ERCOT’s Eastern Edge
12
• C&N reports that in 2016, power flow from north to
Houston was the most significant constraint on the
ERCOT system for the second consecutive year. An
ongoing 345-kV project, expected to be in service by
summer 2018, should help relieve congestion.
• Regional Haze impacts, now uncertain, would have
required 3,000 MW of coal capacity to have new
scrubbers, and another 5,500 MW to upgrade
existing scrubbers.
• LTSA scenarios show that a combination of high
amounts of solar generation additions in the west and
generation retirements in the east could result in a
significant increase in west-to-east power flows. New
transmission investments might be needed to
accommodate the revised system power flows.
• Timing of unit retirements remains a key variable in
2017 and beyond.

Item 8.1
ERCOT Public 1
3
Special Recognition – API Guide Team
• Quick-start guide for machine-to-
machine programmatic interfaces
• Makes programmatic access to data
extracts and reports easier
• An alternative to current 500-page
complex guide
• Collaborative effort between ERCOT
and Market Participants (MDWG)
Team Members:
From left, Brian Brandaw,
Lloyd Pritchard, Susan
Jinright, Nick Barbas and
Ted Hailu.
Special thanks to the Market
Data Working Group
(MDWG) – Chair:
Julie Thomas, Vistra
Collaborated with stakeholders on an Application Program Interface (API)
quick-start guide for market participants