Embed Size (px)
Citation preview
IT Operations Benchmark Survey 2015
Research Reveals Strategies for IT to Drive Business Results and End-user Satisfaction
2
Kaseya® | IT Operations Benchmark Survey 2015
Introduction
Welcome to the first annual Kaseya IT Operations Benchmark Survey. Kaseya surveyed approximately 500 mid-sized companies globally to find out how IT groups at these companies are faring as IT management demands grow in number and complexity every day – and to learn from the most mature and successful ones.
IT, as a whole, is expected to: maintain existing infrastructure; perform upgrades and expansion when necessary; sustain high levels of service availability and aid current users;provide technology advice and support for new business requirements; configure and manage new applications; train new users; manage cloud applications; liaise with technology partners and suppliers; maintain high levels of security; and much more.
And the challenge isn’t standing still. In addition to the complex set of existing technologies and infrastructure under management, new requirements escalate with the growth of cloud-based infrastructure and applications, as well as mobile devices (both company- and employee-owned) and more. These growing challenges are pushing already-taxed IT department resources to the limit. Resources aren’t growing at the same pace, so the only answer is to do more with the resources you have. To say this is challenging is clearly an understatement.
We developed this survey to find out what (if anything) separates the more mature, successful IT groups from their counterparts. Why are some IT departments recognized as strategic partners by executives, while others are still perceived as a utility required to keep the business running?
More importantly, what does it take to make sure your IT department is one of the successful ones?
And, of course, we wanted to focus only on mid-sized companies (which we define as organizations with between 100-3,000 employees) since these IT groups face resource andplanning challenges that are much different than IT groups at Global 2000 enterprises.
Over 70 percent of our respondents fell within this size parameter. For comparison purposes, we included respondents from companies with less than 50 to those with up to 5,000 employees, which allowed us to dig deeper into the relationship between company size and IT management practices.
3
Kaseya® | IT Operations Benchmark Survey 2015
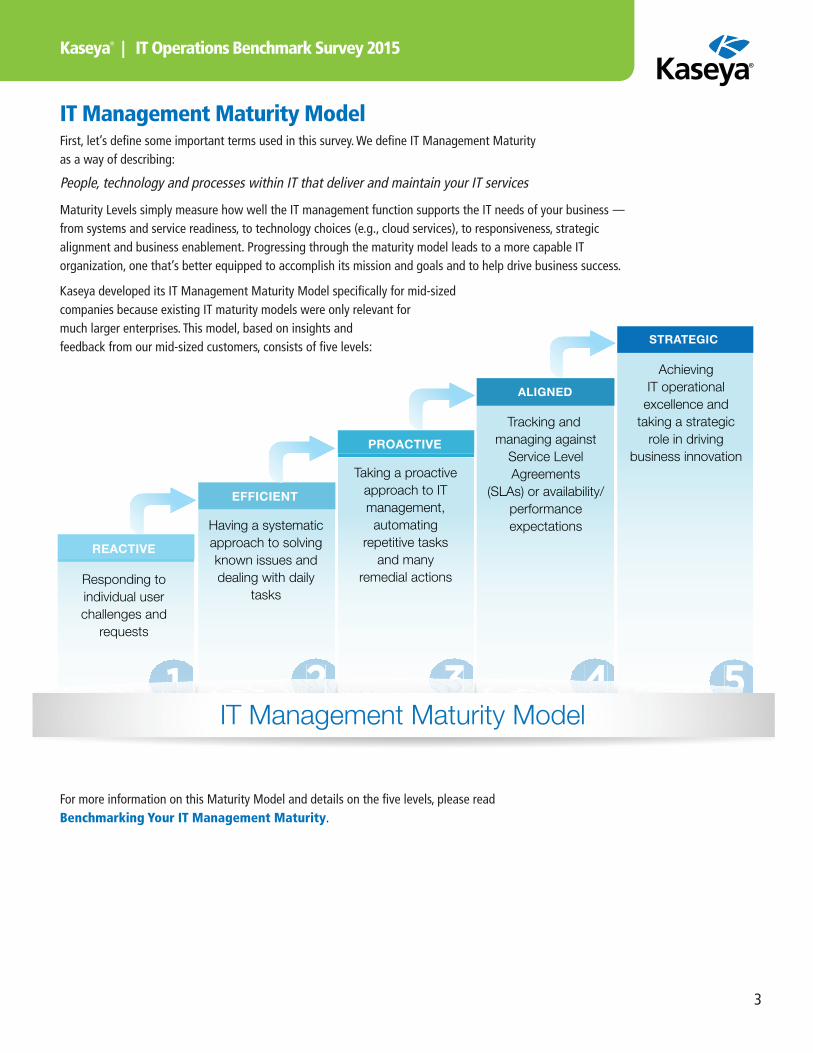
IT Management Maturity ModelFirst, let’s define some important terms used in this survey. We define IT Management Maturity as a way of describing:
People, technology and processes within IT that deliver and maintain your IT services
Maturity Levels simply measure how well the IT management function supports the IT needs of your business ―from systems and service readiness, to technology choices (e.g., cloud services), to responsiveness, strategic alignment and business enablement. Progressing through the maturity model leads to a more capable IT organization, one that’s better equipped to accomplish its mission and goals and to help drive business success.
Kaseya developed its IT Management Maturity Model specifically for mid-sized companies because existing IT maturity models were only relevant for much larger enterprises. This model, based on insights and feedback from our mid-sized customers, consists of five levels:
For more information on this Maturity Model and details on the five levels, please read Benchmarking Your IT Management Maturity.
REACTIVE
EFFICIENT
PROACTIVE
ALIGNED
STRATEGIC
Responding toindividual userchallenges and
requests
Having a systematicapproach to solvingknown issues anddealing with daily
tasks
Taking a proactiveapproach to ITmanagement,automating
repetitive tasksand many
remedial actions
Tracking and managing against
Service LevelAgreements
(SLAs) or availability/performanceexpectations
AchievingIT operational
excellence andtaking a strategic
role in drivingbusiness innovation
54321IT Management Maturity Model
4
Kaseya® | IT Operations Benchmark Survey 2015
Top Eight Actionable Insights So what did we learn from our survey respondents? Here are the top eight actionable insights.
� IT groups at mid-sized companies are in early stages of maturity. Based on the survey responses, 89 percent of IT organizations at mid-size companies classify themselves as being at one of the first three levels on the IT Management Maturity Model, namely REACTIVE, EFFICIENT or PROACTIVE. They primarily focus on internal IT challenges versus challenges faced by the business or the business’customers, and spend a good deal of time on day-to-day tasks that have more manual labor involved than is ideal.Only 11 percent of respondents consider their IT organizations to have reached either the ALIGNED or STRATEGIC levels.* Consequently, IT is perceived as a utility for most mid-size businesses, where the primary concern is to minimize costs while maintaining a functional IT infrastructure to support employees.
� Bigger doesn’t mean better. It would be easy to assume that as a business grows, its level of IT management maturity increases ― but this is not necessarily the case. We found no correlation between company size and IT maturity levels. Of course, larger organizations tend to have more IT resources. However, their IT needs are also more complex, keeping them in a lower-level of IT maturity.
� Chief challenge? Completing projects on time. The biggest challenge reported by IT organizations across the first three levels of the IT Management Maturity Model was “Completing projects on time.” In contrast, the number one challenge for ALIGNED or STRATEGIC groups was “Improving your company’s customer experience,” followed immediately by “Improving employee productivity.” So, while the vast majority of respondents are just trying to find ways to free up time to get more done, the ALIGNED and STRATEGIC groups are able to look at ways to leverage IT to improve user and customer experience.
� Underutilizing automation = lost productivity. At first glance, it would seem that automation is strongly leveraged. 59 percent of all survey respondents use automation for management activities, including deployment or remediation. Yet, there is great disparity among respondents in terms of the number of devices managed per technician. IT organizations with extensive automation are able to manage thousands of devices per technician, whereas over 90 percent of respondents report managing less than five hundred. This suggests many of those using automation are only using it in selected tasks as opposed to automating more comprehensively within their organization. More comprehensive automation, including policy-based management for problem avoidance, would allow IT groups to spend less time on disruptive, unplanned troubleshooting, giving them back precious time.
� Measurement matters. Undoubtedly it’s challenging to measure IT performance, especially when IT is responsible for maintaining a complex IT infrastructure and a host of differing applications and devices. However, it also seems clear that thosewho do leverage metrics for benchmarking and service optimization operate at higher maturity levels. Fully two thirds of companies at the ALIGNED or STRATEGIC maturity levels have formal SLAs. For more than half of these companies, meeting their SLAs is a mandatory requirement. For companies at EFFICIENT or PROACTIVE levels of IT maturity, 40 percent monitor service levels but their SLAs are primarily guidelines only. Only 22 percent of REACTIVE level companies have formal SLAs but, again, primarily as a guidelines.
� Strategy drives cloud adoption (not costs). Companies at the ALIGNED or STRATEGIC levels of maturity are, on average, approximately 60 percent more likely to use cloud-based applications and infrastructure than companies at the lower levels. They are about 90 percentmore likely to use them than companies at the REACTIVE level. Indeed, over 40 percent of companies at all threelower levels have a “no public cloud use” policy. More mature IT organizations use cloud management services
* Results for respondents who selected either ALIGNED or STRATEGIC were combined for a more succinct comparison of results by maturity level.
5
Kaseya® | IT Operations Benchmark Survey 2015
(to manage private, public or hybrid cloud) primarily to increase IT staff productivity (by offloading repetitive andmundane tasks) and enable their IT staff to focus on IT projects that drive business strategy.
� IT maturity correlates with revenue growth. There is strong correlation between the level of IT management maturity and companies experiencing higher revenue growth. For companies who grew their revenue at greater than 10 percent between 2013 and 2014, 36 percent of the IT organizations were at the ALIGNED or STRATEGIC maturity levels versus just 16 percent who were at the REACTIVE level.
� More mature IT organizations have greater control. IT organizations at ALIGNED or STRATEGIC levels of maturity are 75% more likely to report that they are the primary decision maker for all IT decisions. In fact, this percentage grows steadily at each stage of the maturitymodel (rising from REACTIVE to EFFICIENT, from EFFICIENT to PROACTIVE, etc.). Conversely, 70 percent of companies at the REACTIVE level report they don’t think anything will change next year, almost double the rate of their peers at the ALIGNED and STRATEGIC levels. IT groups at companies with higher levels of maturity seethemselves as more in control of their work environment – and expect next year to be even better.
Recommendations and Next Steps Most IT organizations at mid-sized companies struggle to meet their goals and objectives, due in large part to strong resource constraints. They can never find enough free time and/or limit unplanned interruptions to get their IT projects done on time.
In contrast, those few organizations who have reached the higher levels of IT management maturity ─ by automating mundane activities, standardizing and streamlining processes, and leveraging cloud services ─ have the time to focus on IT projects that drive business results and end-user satisfaction.
No matter where you fall on the IT Management Maturity Model, here are the top five steps that will have thebiggest impact on improving your IT operations performance and maturity:
� Automate everything.
Make sure to leverage as much automation as possible. Policy-based automation improves staff efficiency. Discovery, audit, software deployments (including third-party software), patches, antivirus updates, backup, and more, can all be automated based on defined policies.
In addition, event-based remediation saves time by, for example, automatically initiating disk clean-up on a high CPU usage alert, isolating a client on virus detection, or rerunning backup on failed backup alert. Automation helps ensure that you identify and resolve IT problems before they cascade into crises.
� Consolidate IT management tools.
How many disparate IT management tools does your IT staff use today? Count up the minutes lost daily when anIT staff member transitions from one tool to the next (and sometimes to the next) to troubleshoot and resolve aproblem. Then multiply THAT number by how many IT staff you have; then by week; then by month. Pretty soon,as they say, this adds up to real money.
More importantly, consider the costs beyond just productivity loss. Consolidated tracking and measuring, a key ingredient to achieve higher levels of IT maturity, becomes cumbersome and time-consuming. Furthermore, without a complete and consistent picture of your entire IT infrastructure, you can’t make the connections and insights to drive meaningful process improvements, or ensure compliance and security requirements are routinely met.
6
Kaseya® | IT Operations Benchmark Survey 2015
� Start today.
It’s never too late – and no IT group is ever too small – to starting taking control of IT processes. Developing ahighly mature, highly respected IT group is not a function of company size, IT group size, or industry. IT infrastruc-ture complexity is not going to go away. Demands on your IT group are, in fact, only going to increase. So, youhave to take control, manage the complexity, and minimize its impact on IT and company productivity. Look for IT management and security tools that allow you to view, monitor and manage your entire IT environment holistically.
� Measure and track. Track and measure.
Do high-maturity IT organizations become that way because they track and measure their performance? Or does tracking and measuring performance help IT organizations evolve their IT maturity level? We can’t definitively answer that question. But as with automation, tracking and measuring is no longer a luxury for ‘someday.’ Consolidating your IT management tools (see Step 2) should naturally bring the benefit of simpler,more complete performance tracking and reporting. As Yogi Berra sagely said, “If you don't know where you are going, you might not get there.”
� Make friends with the cloud.
Cloud, and cloud-enabled services, certainly can help reduce infrastructure investments and other expenses.However, that’s not where the real action is. Mature IT groups consider the cloud as a strategic enabler, allowingthem to offload routine, repetitive tasks, scale at will, and focus their efforts on innovative IT projects to improvecustomer and end-user experience.
Conclusion According to this survey’s findings, 89% of IT groups in mid-sized companies are still in the early stages of ITmanagement maturity and focus on day-to-day IT management tasks that are often time-consuming and manual.The remaining 11% have achieved higher levels of maturity and are reaping benefits in important ways for thebusiness.
We hope that this whitepaper ― including not only the eight key insights and five recommendations, but also the detailed survey results provided in the following section ― offers useful insight on how you can drive the effectiveness of both IT and the business using your current IT resources.
For more information on the IT Maturity Model referenced in this paper, please read Benchmarking Your ITManagement Maturity.
Kaseya is empowering IT groups worldwide to command all of IT centrally, manage remote and distributed environments with ease, and automate across IT management functions. Visit www.kaseya.com today to find out how we can help you simplify IT management, free up time, and get more done in IT.
7
Kaseya® | IT Operations Benchmark Survey 2015
B. Respondent and Company DemographicsThis section contains respondent and company profile information. The percentages quoted represent the proportion of responses in each category.
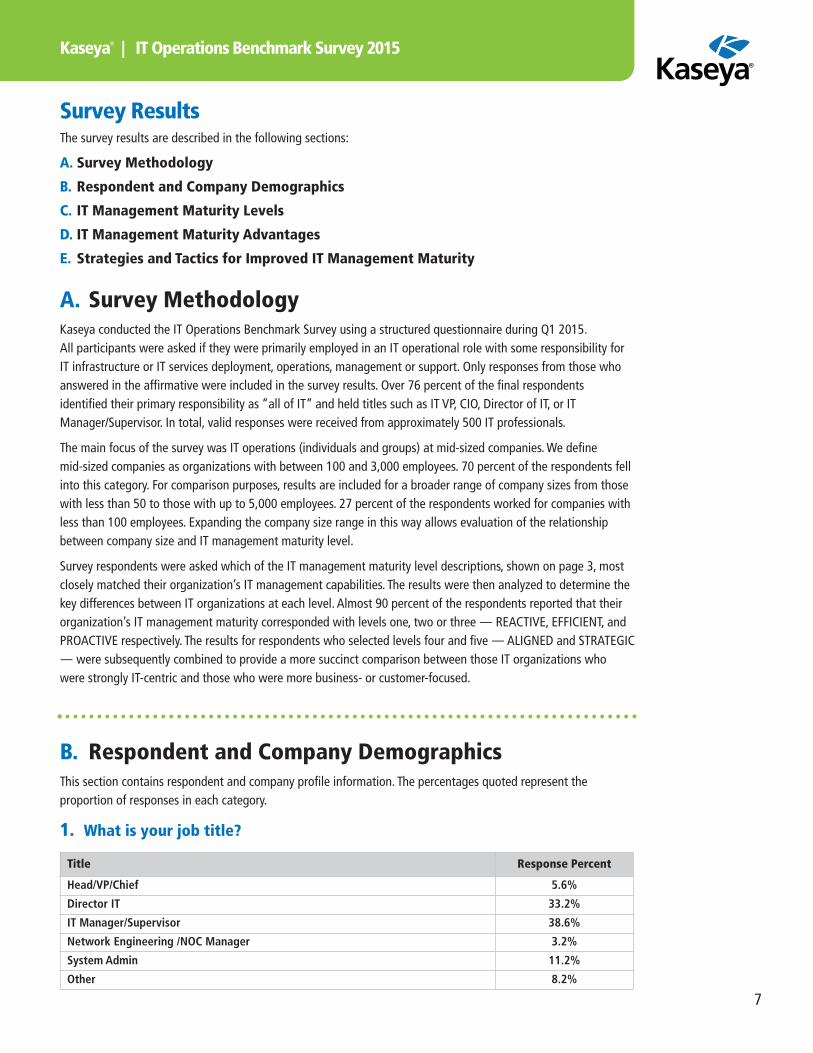
1. What is your job title?
Title Response Percent
Head/VP/Chief 5.6%
Director IT 33.2%
IT Manager/Supervisor 38.6%
Network Engineering /NOC Manager 3.2%
System Admin 11.2%
Other 8.2%
Survey ResultsThe survey results are described in the following sections:
A. Survey Methodology
B. Respondent and Company Demographics
C. IT Management Maturity Levels
D. IT Management Maturity Advantages
E. Strategies and Tactics for Improved IT Management Maturity
A. Survey MethodologyKaseya conducted the IT Operations Benchmark Survey using a structured questionnaire during Q1 2015. All participants were asked if they were primarily employed in an IT operational role with some responsibility for IT infrastructure or IT services deployment, operations, management or support. Only responses from those who answered in the affirmative were included in the survey results. Over 76 percent of the final respondents identified their primary responsibility as “all of IT” and held titles such as IT VP, CIO, Director of IT, or ITManager/Supervisor. In total, valid responses were received from approximately 500 IT professionals.
The main focus of the survey was IT operations (individuals and groups) at mid-sized companies. We define mid-sized companies as organizations with between 100 and 3,000 employees. 70 percent of the respondents fellinto this category. For comparison purposes, results are included for a broader range of company sizes from thosewith less than 50 to those with up to 5,000 employees. 27 percent of the respondents worked for companies withless than 100 employees. Expanding the company size range in this way allows evaluation of the relationship between company size and IT management maturity level.
Survey respondents were asked which of the IT management maturity level descriptions, shown on page 3, most closely matched their organization’s IT management capabilities. The results were then analyzed to determine thekey differences between IT organizations at each level. Almost 90 percent of the respondents reported that their organization’s IT management maturity corresponded with levels one, two or three ― REACTIVE, EFFICIENT, andPROACTIVE respectively. The results for respondents who selected levels four and five ― ALIGNED and STRATEGIC― were subsequently combined to provide a more succinct comparison between those IT organizations who were strongly IT-centric and those who were more business- or customer-focused.
8
Kaseya® | IT Operations Benchmark Survey 2015
4. To which industry does your company belong?
Industry Response Percent
Education 19%
Manufacturing 14%
Healthcare 11%
Professional Services 10%
Finance 9%
Public Sector 7%
Non-Profit 4%
Technology 4%
Wholesale 4%
Other 18%
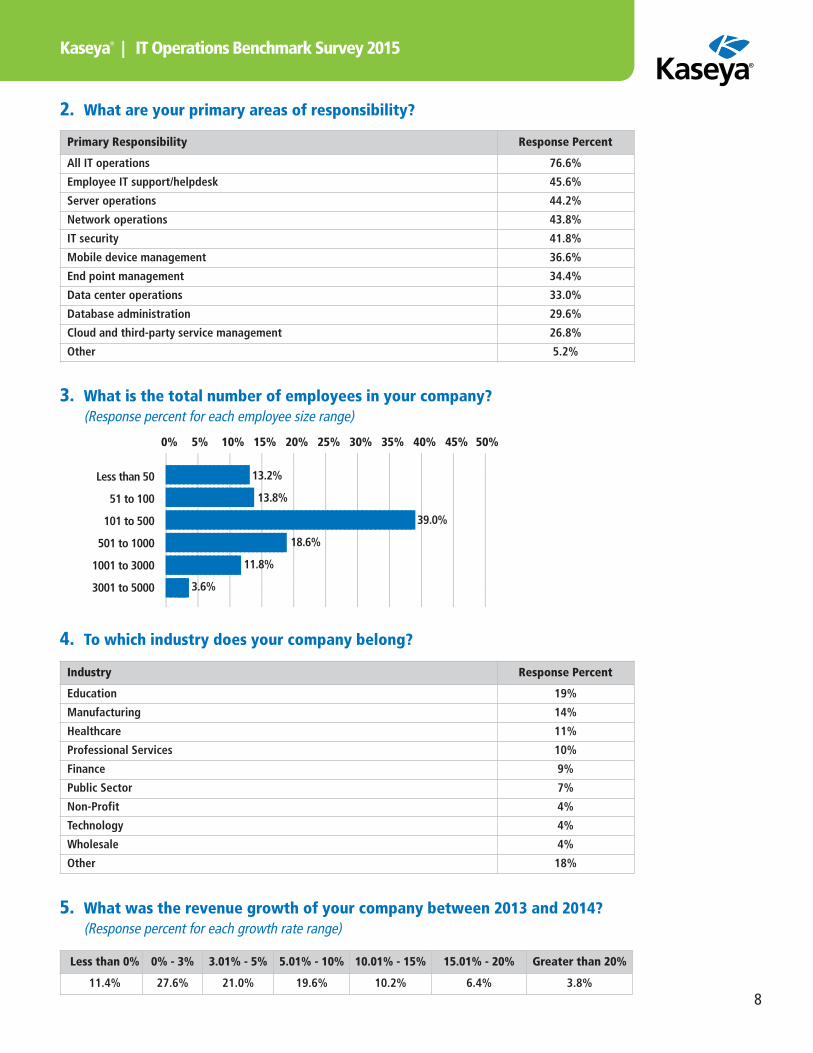
3. What is the total number of employees in your company? (Response percent for each employee size range)
0% 5% 10% 15% 20% 25% 30% 35% 40% 45% 50%
Less than 50
51 to 100
101 to 500
501 to 1000
1001 to 3000
3001 to 5000
__________________
__________________
__________________
__________________
__________________
__________________
__________________
__________________
__________________
__________________
__________________
���������������������������������������������������������������������������������������������������������������������������������������������������
13.2%
13.8%
39.0%
18.6%
11.8%
3.6%
2. What are your primary areas of responsibility?
Primary Responsibility Response Percent
All IT operations 76.6%
Employee IT support/helpdesk 45.6%
Server operations 44.2%
Network operations 43.8%
IT security 41.8%
Mobile device management 36.6%
End point management 34.4%
Data center operations 33.0%
Database administration 29.6%
Cloud and third-party service management 26.8%
Other 5.2%
5. What was the revenue growth of your company between 2013 and 2014? (Response percent for each growth rate range)
Less than 0% 0% - 3% 3.01% - 5% 5.01% - 10% 10.01% - 15% 15.01% - 20% Greater than 20%
11.4% 27.6% 21.0% 19.6% 10.2% 6.4% 3.8%
9
Kaseya® | IT Operations Benchmark Survey 2015
C. IT Management Maturity LevelsThis section shows the percentage distribution of respondent companies across four IT management maturity levels ― REACTIVE, EFFICIENT, PROACTIVE and ALIGNED/STRATEGIC. As noted above, the ALIGNED and STRATEGIC level results were combined to better highlight the contrast between the majority of companies’ IT functions, who are focused primarily on IT operational issues, versus the remainder, who are focused more on customer satisfaction and other business issues.
7. Which of the following descriptions most closely matches your organization’s IT management capabilities?
a. Percentage of IT organizations by IT management maturity level.
DescriptionIT Management Maturity Level
Response Percent
Achieving IT operational excellence and taking a strategic role in driving business innovation 5 STRATEGIC
10.6%Tracking and managing against Service Level Agreements (SLAs) or availability/performance expectations 4 ALIGNED
Proactive in our approach to IT management, automating repetitive tasks and many remedial actions 3 PROACTIVE 23.6%
Systematic in our approach to solving known issuesand dealing with daily tasks 2 EFFICIENT 22.0%
Responsive to individual challenges and requests 1 REACTIVE 43.8%
Key Finding: 89.4% of respondents selected IT management maturity levels 1, 2 or 3.
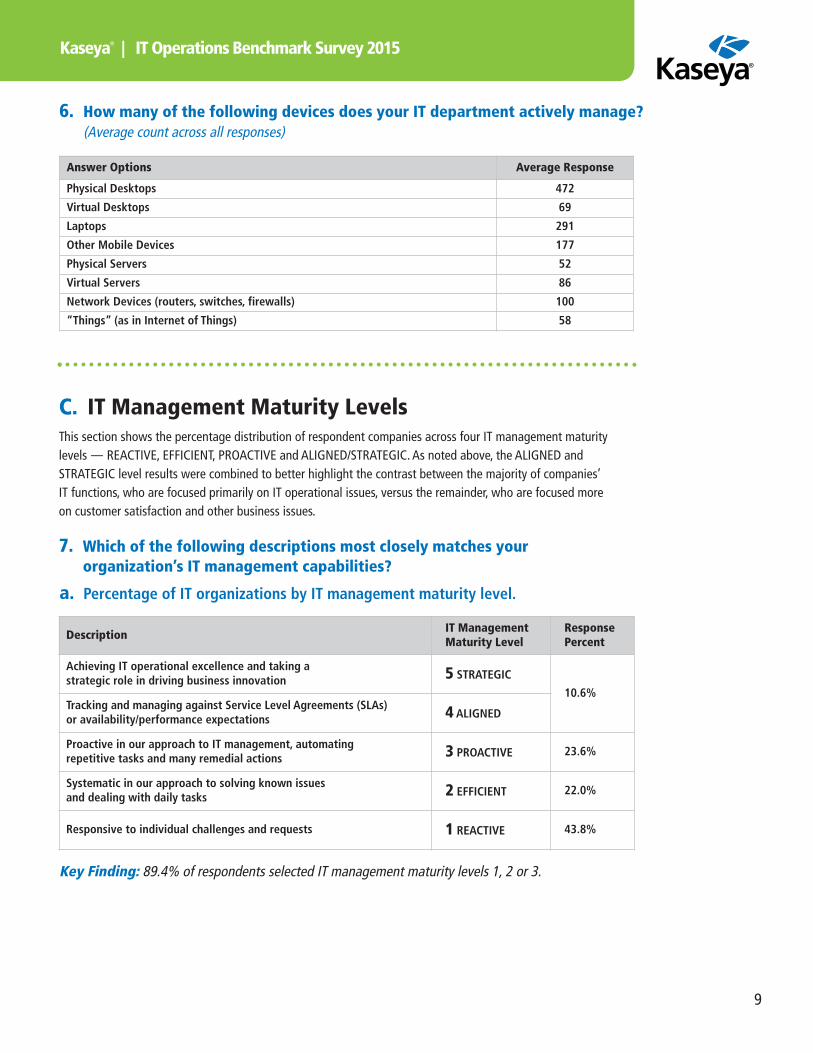
6. How many of the following devices does your IT department actively manage? (Average count across all responses)
Answer Options Average Response
Physical Desktops 472
Virtual Desktops 69
Laptops 291
Other Mobile Devices 177
Physical Servers 52
Virtual Servers 86
Network Devices (routers, switches, firewalls) 100
“Things” (as in Internet of Things) 58
10
Kaseya® | IT Operations Benchmark Survey 2015
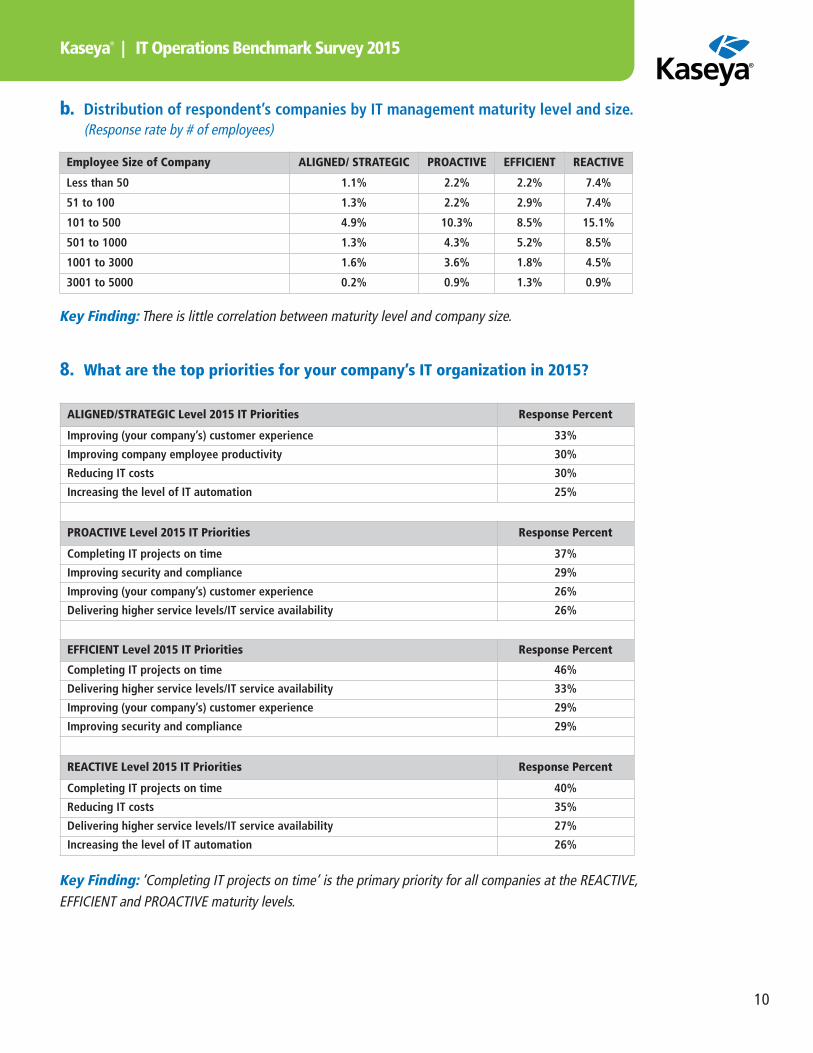
b. Distribution of respondent’s companies by IT management maturity level and size.(Response rate by # of employees)
Key Finding: There is little correlation between maturity level and company size.
Key Finding: ‘Completing IT projects on time’ is the primary priority for all companies at the REACTIVE, EFFICIENT and PROACTIVE maturity levels.
Employee Size of Company ALIGNED/ STRATEGIC PROACTIVE EFFICIENT REACTIVE
Less than 50 1.1% 2.2% 2.2% 7.4%
51 to 100 1.3% 2.2% 2.9% 7.4%
101 to 500 4.9% 10.3% 8.5% 15.1%
501 to 1000 1.3% 4.3% 5.2% 8.5%
1001 to 3000 1.6% 3.6% 1.8% 4.5%
3001 to 5000 0.2% 0.9% 1.3% 0.9%
8. What are the top priorities for your company’s IT organization in 2015?
ALIGNED/STRATEGIC Level 2015 IT Priorities Response Percent
Improving (your company’s) customer experience 33%
Improving company employee productivity 30%
Reducing IT costs 30%
Increasing the level of IT automation 25%
PROACTIVE Level 2015 IT Priorities Response Percent
Completing IT projects on time 37%
Improving security and compliance 29%
Improving (your company’s) customer experience 26%
Delivering higher service levels/IT service availability 26%
EFFICIENT Level 2015 IT Priorities Response Percent
Completing IT projects on time 46%
Delivering higher service levels/IT service availability 33%
Improving (your company’s) customer experience 29%
Improving security and compliance 29%
REACTIVE Level 2015 IT Priorities Response Percent
Completing IT projects on time 40%
Reducing IT costs 35%
Delivering higher service levels/IT service availability 27%
Increasing the level of IT automation 26%
11
Kaseya® | IT Operations Benchmark Survey 2015
D. IT Management Maturity AdvantagesThis section highlights the benefits that are achieved by IT organizations as their level of IT management maturity increases.
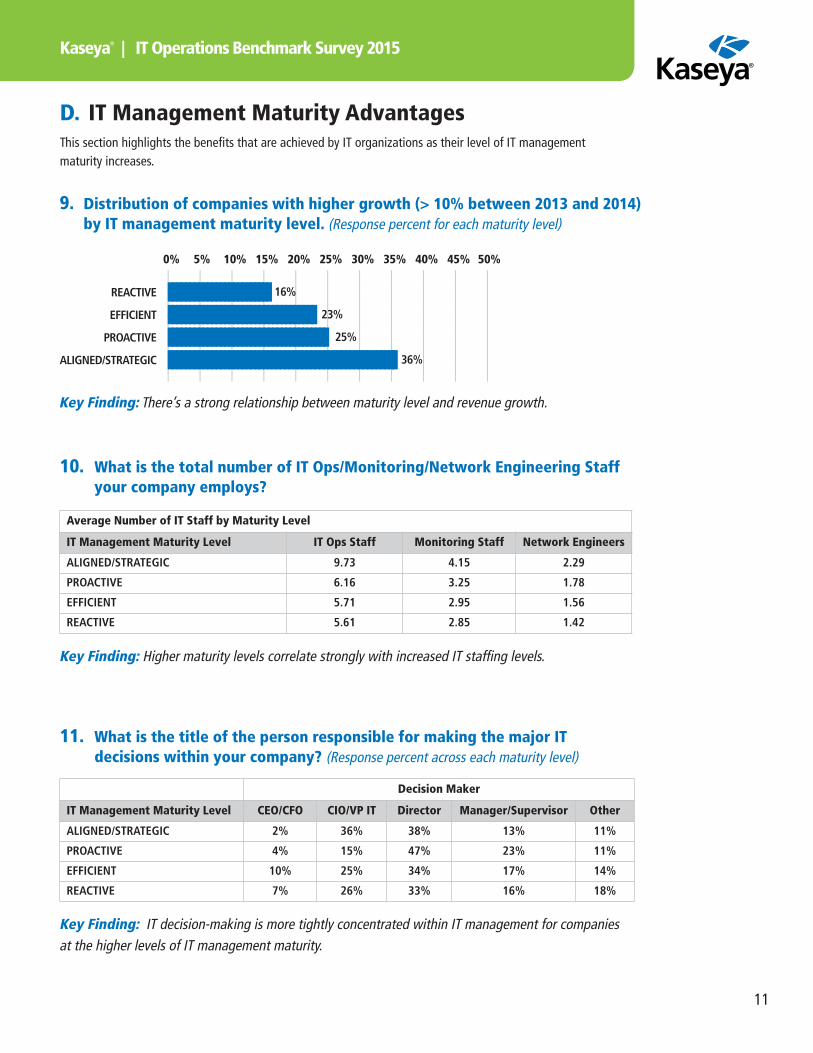
9. Distribution of companies with higher growth (> 10% between 2013 and 2014) by IT management maturity level. (Response percent for each maturity level)
10. What is the total number of IT Ops/Monitoring/Network Engineering Staff your company employs?
11. What is the title of the person responsible for making the major IT decisions within your company? (Response percent across each maturity level)
0% 5% 10% 15% 20% 25% 30% 35% 40% 45% 50%
REACTIVE
EFFICIENT
PROACTIVE
ALIGNED/STRATEGIC
_____________
_____________
_____________
_____________
_____________
_____________
_____________
_____________
_____________
_____________
_____________
����������������������������������������������������������������������������������������������������������������������������������������������������
16%
23%
25%
36%
Key Finding: There’s a strong relationship between maturity level and revenue growth.
Key Finding: Higher maturity levels correlate strongly with increased IT staffing levels.
Key Finding: IT decision-making is more tightly concentrated within IT management for companies at the higher levels of IT management maturity.
Average Number of IT Staff by Maturity Level
IT Management Maturity Level IT Ops Staff Monitoring Staff Network Engineers
ALIGNED/STRATEGIC 9.73 4.15 2.29
PROACTIVE 6.16 3.25 1.78
EFFICIENT 5.71 2.95 1.56
REACTIVE 5.61 2.85 1.42
Decision Maker
IT Management Maturity Level CEO/CFO CIO/VP IT Director Manager/Supervisor Other
ALIGNED/STRATEGIC 2% 36% 38% 13% 11%
PROACTIVE 4% 15% 47% 23% 11%
EFFICIENT 10% 25% 34% 17% 14%
REACTIVE 7% 26% 33% 16% 18%
12
Kaseya® | IT Operations Benchmark Survey 2015
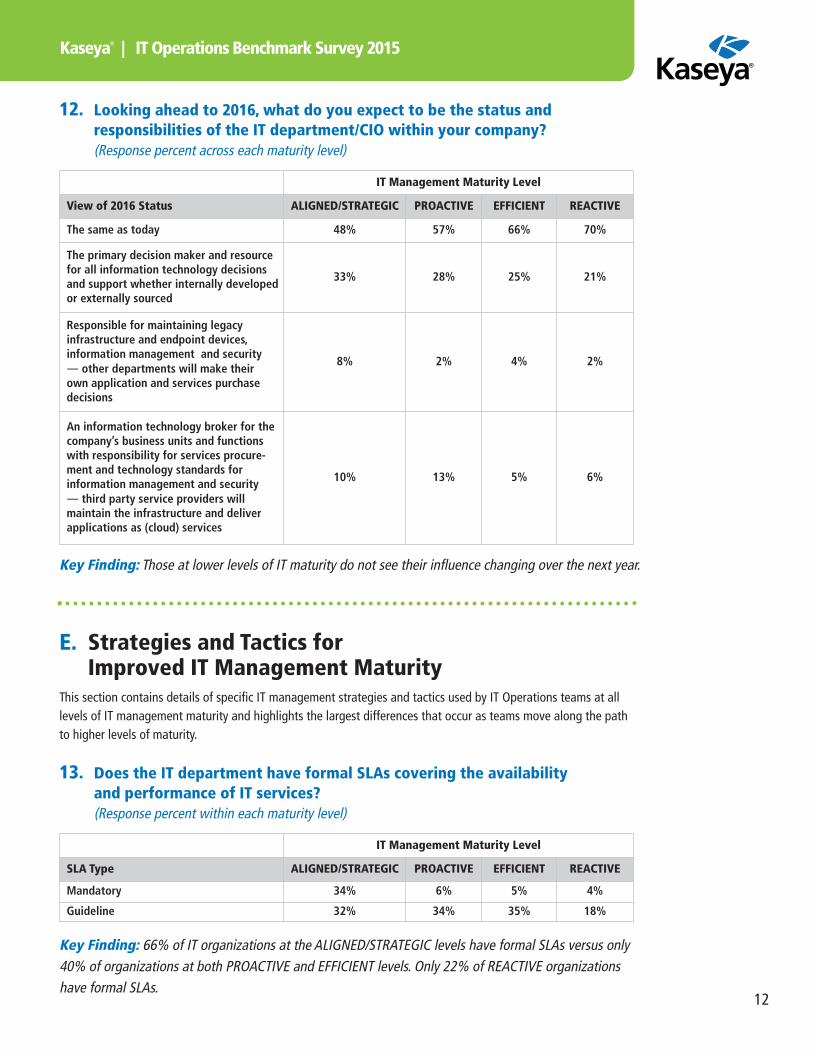
12. Looking ahead to 2016, what do you expect to be the status and responsibilities of the IT department/CIO within your company? (Response percent across each maturity level)
Key Finding: Those at lower levels of IT maturity do not see their influence changing over the next year.
IT Management Maturity Level
View of 2016 Status ALIGNED/STRATEGIC PROACTIVE EFFICIENT REACTIVE
The same as today 48% 57% 66% 70%
The primary decision maker and resourcefor all information technology decisionsand support whether internally developedor externally sourced
33% 28% 25% 21%
Responsible for maintaining legacy infrastructure and endpoint devices, information management and security ― other departments will make their own application and services purchase decisions
8% 2% 4% 2%
An information technology broker for thecompany’s business units and functionswith responsibility for services procure-ment and technology standards for information management and security ― third party service providers will maintain the infrastructure and deliver applications as (cloud) services
10% 13% 5% 6%
E. Strategies and Tactics for Improved IT Management Maturity
This section contains details of specific IT management strategies and tactics used by IT Operations teams at alllevels of IT management maturity and highlights the largest differences that occur as teams move along the pathto higher levels of maturity.
13. Does the IT department have formal SLAs covering the availability and performance of IT services? (Response percent within each maturity level)
IT Management Maturity Level
SLA Type ALIGNED/STRATEGIC PROACTIVE EFFICIENT REACTIVE
Mandatory 34% 6% 5% 4%
Guideline 32% 34% 35% 18%
Key Finding: 66% of IT organizations at the ALIGNED/STRATEGIC levels have formal SLAs versus only40% of organizations at both PROACTIVE and EFFICIENT levels. Only 22% of REACTIVE organizationshave formal SLAs.
13
Kaseya® | IT Operations Benchmark Survey 2015
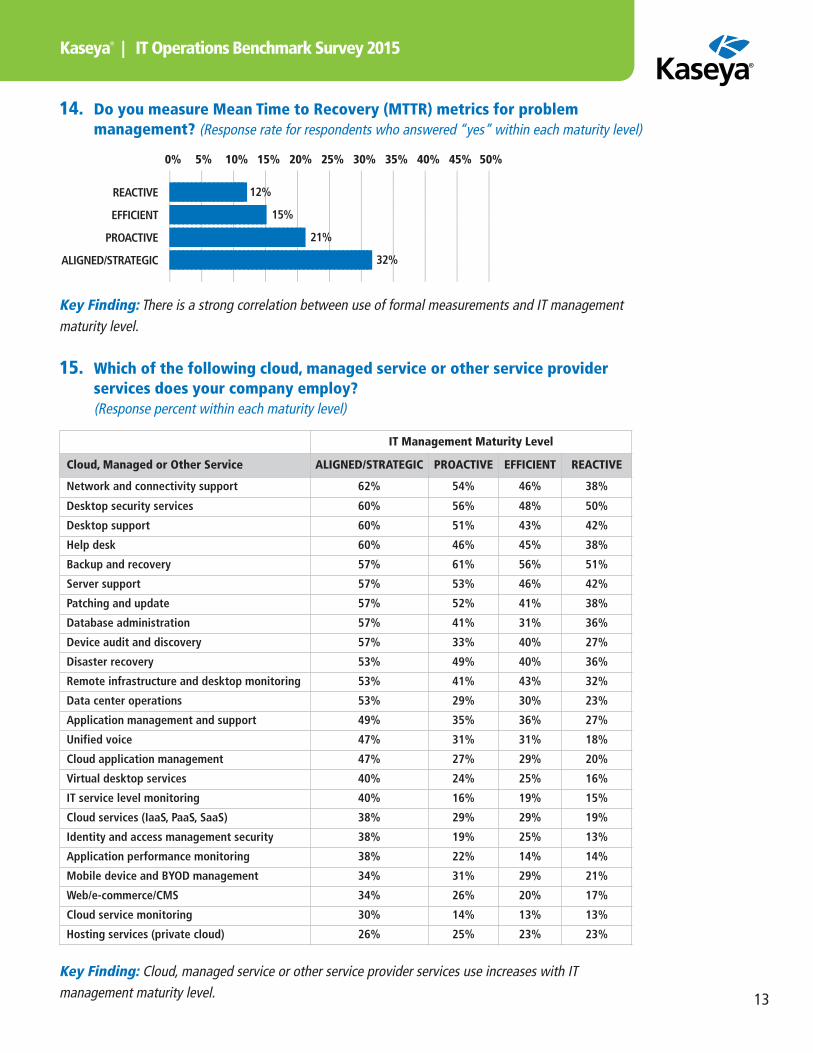
14. Do you measure Mean Time to Recovery (MTTR) metrics for problem management? (Response rate for respondents who answered “yes” within each maturity level)
Key Finding: There is a strong correlation between use of formal measurements and IT managementmaturity level.
0% 5% 10% 15% 20% 25% 30% 35% 40% 45% 50%
REACTIVE
EFFICIENT
PROACTIVE
ALIGNED/STRATEGIC
_____________
_____________
_____________
_____________
_____________
_____________
_____________
_____________
_____________
_____________
_____________
����������������������������������������������������������������������������������������������������������������������
12%
15%
21%
32%
15. Which of the following cloud, managed service or other service provider services does your company employ? (Response percent within each maturity level)
IT Management Maturity Level
Cloud, Managed or Other Service ALIGNED/STRATEGIC PROACTIVE EFFICIENT REACTIVE
Network and connectivity support 62% 54% 46% 38%
Desktop security services 60% 56% 48% 50%
Desktop support 60% 51% 43% 42%
Help desk 60% 46% 45% 38%
Backup and recovery 57% 61% 56% 51%
Server support 57% 53% 46% 42%
Patching and update 57% 52% 41% 38%
Database administration 57% 41% 31% 36%
Device audit and discovery 57% 33% 40% 27%
Disaster recovery 53% 49% 40% 36%
Remote infrastructure and desktop monitoring 53% 41% 43% 32%
Data center operations 53% 29% 30% 23%
Application management and support 49% 35% 36% 27%
Unified voice 47% 31% 31% 18%
Cloud application management 47% 27% 29% 20%
Virtual desktop services 40% 24% 25% 16%
IT service level monitoring 40% 16% 19% 15%
Cloud services (IaaS, PaaS, SaaS) 38% 29% 29% 19%
Identity and access management security 38% 19% 25% 13%
Application performance monitoring 38% 22% 14% 14%
Mobile device and BYOD management 34% 31% 29% 21%
Web/e-commerce/CMS 34% 26% 20% 17%
Cloud service monitoring 30% 14% 13% 13%
Hosting services (private cloud) 26% 25% 23% 23%
Key Finding: Cloud, managed service or other service provider services use increases with IT management maturity level.
14
Kaseya® | IT Operations Benchmark Survey 2015
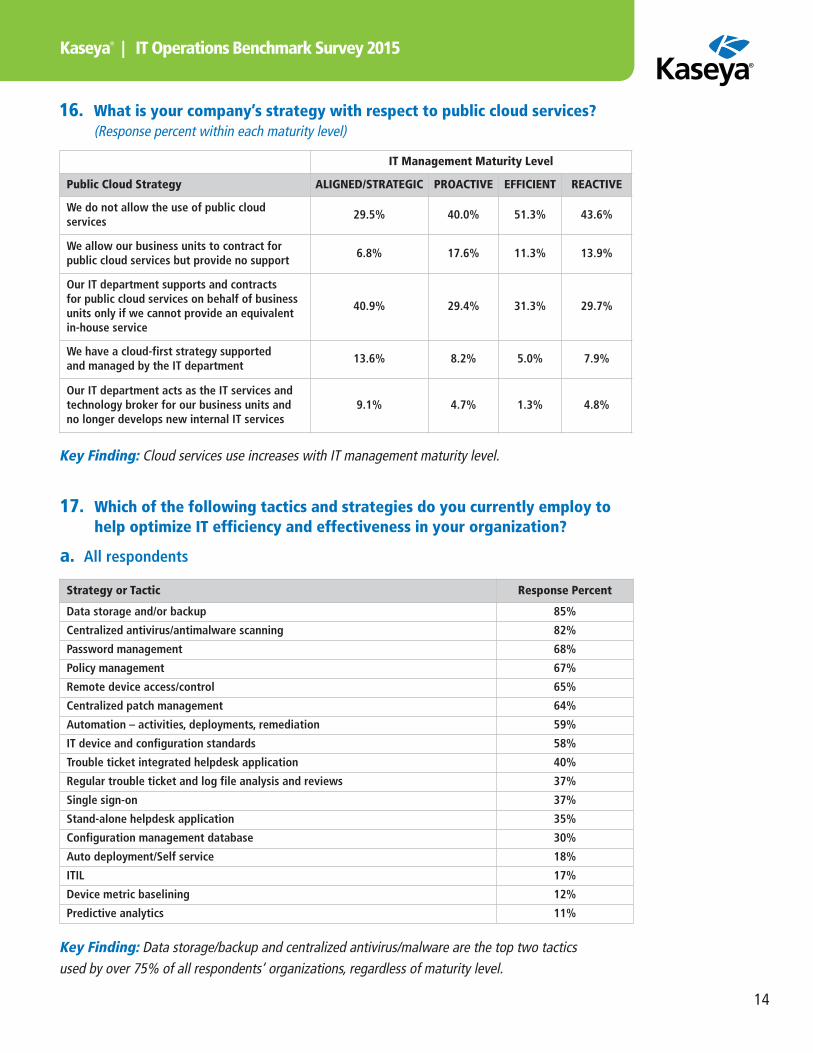
16. What is your company’s strategy with respect to public cloud services? (Response percent within each maturity level)
17. Which of the following tactics and strategies do you currently employ to help optimize IT efficiency and effectiveness in your organization?
IT Management Maturity Level
Public Cloud Strategy ALIGNED/STRATEGIC PROACTIVE EFFICIENT REACTIVE
We do not allow the use of public cloud services
29.5% 40.0% 51.3% 43.6%
We allow our business units to contract for public cloud services but provide no support
6.8% 17.6% 11.3% 13.9%
Our IT department supports and contracts for public cloud services on behalf of businessunits only if we cannot provide an equivalentin-house service
40.9% 29.4% 31.3% 29.7%
We have a cloud-first strategy supported and managed by the IT department
13.6% 8.2% 5.0% 7.9%
Our IT department acts as the IT services andtechnology broker for our business units and no longer develops new internal IT services
9.1% 4.7% 1.3% 4.8%
Key Finding: Cloud services use increases with IT management maturity level.
Key Finding: Data storage/backup and centralized antivirus/malware are the top two tacticsused by over 75% of all respondents’ organizations, regardless of maturity level.
a. All respondents
Strategy or Tactic Response Percent
Data storage and/or backup 85%
Centralized antivirus/antimalware scanning 82%
Password management 68%
Policy management 67%
Remote device access/control 65%
Centralized patch management 64%
Automation – activities, deployments, remediation 59%
IT device and configuration standards 58%
Trouble ticket integrated helpdesk application 40%
Regular trouble ticket and log file analysis and reviews 37%
Single sign-on 37%
Stand-alone helpdesk application 35%
Configuration management database 30%
Auto deployment/Self service 18%
ITIL 17%
Device metric baselining 12%
Predictive analytics 11%
Kaseya® | IT Operations Benchmark Survey 2015
15
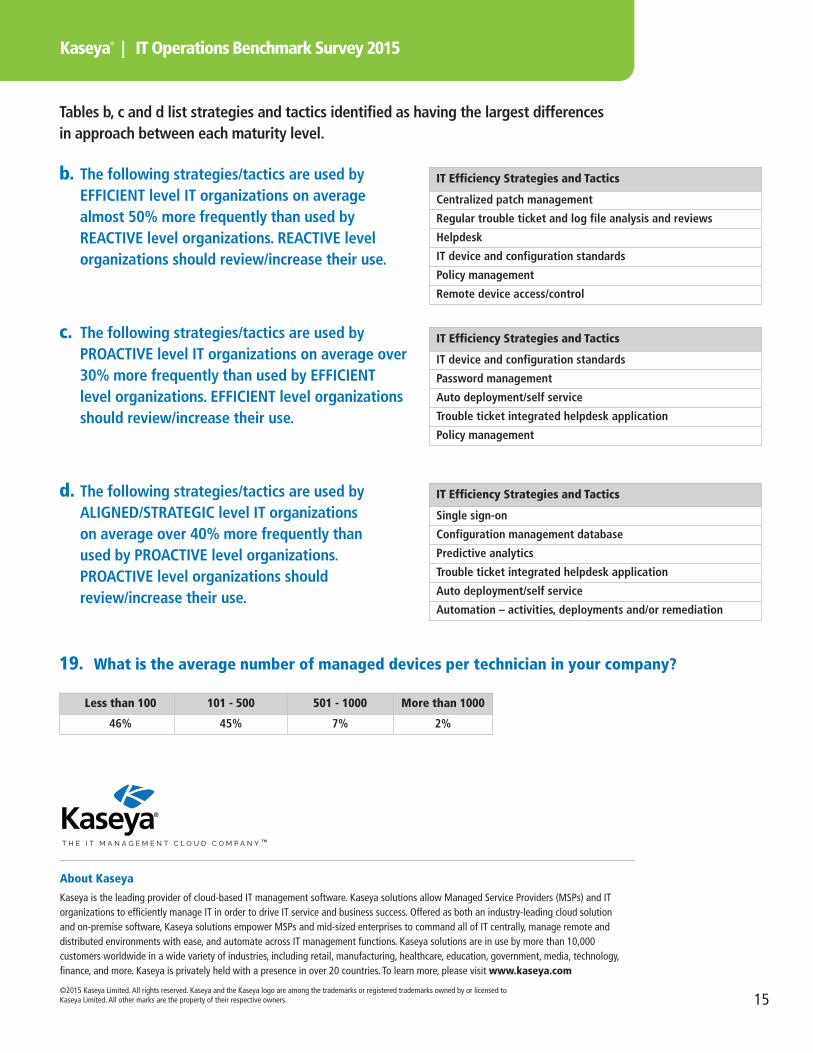
Tables b, c and d list strategies and tactics identified as having the largest differences in approach between each maturity level.
b. The following strategies/tactics are used by EFFICIENT level IT organizations on average almost 50% more frequently than used by REACTIVE level organizations. REACTIVE level organizations should review/increase their use.
IT Efficiency Strategies and Tactics
Centralized patch management
Regular trouble ticket and log file analysis and reviews
Helpdesk
IT device and configuration standards
Policy management
Remote device access/control
IT Efficiency Strategies and Tactics
Single sign-on
Configuration management database
Predictive analytics
Trouble ticket integrated helpdesk application
Auto deployment/self service
Automation – activities, deployments and/or remediation
c. The following strategies/tactics are used by PROACTIVE level IT organizations on average over30% more frequently than used by EFFICIENT level organizations. EFFICIENT level organizations should review/increase their use.
IT Efficiency Strategies and Tactics
IT device and configuration standards
Password management
Auto deployment/self service
Trouble ticket integrated helpdesk application
Policy management
d. The following strategies/tactics are used by ALIGNED/STRATEGIC level IT organizations on average over 40% more frequently than used by PROACTIVE level organizations. PROACTIVE level organizations should review/increase their use.
19. What is the average number of managed devices per technician in your company?
Less than 100 101 - 500 501 - 1000 More than 1000
46% 45% 7% 2%
About Kaseya
Kaseya is the leading provider of cloud-based IT management software. Kaseya solutions allow Managed Service Providers (MSPs) and IT organizations to efficiently manage IT in order to drive IT service and business success. Offered as both an industry-leading cloud solution and on-premise software, Kaseya solutions empower MSPs and mid-sized enterprises to command all of IT centrally, manage remote and distributed environments with ease, and automate across IT management functions. Kaseya solutions are in use by more than 10,000 customers worldwide in a wide variety of industries, including retail, manufacturing, healthcare, education, government, media, technology, finance, and more. Kaseya is privately held with a presence in over 20 countries. To learn more, please visit www.kaseya.com
©2015 Kaseya Limited. All rights reserved. Kaseya and the Kaseya logo are among the trademarks or registered trademarks owned by or licensed to Kaseya Limited. All other marks are the property of their respective owners.