Embed Size (px)
Citation preview
February 13, 2010
MMoonniittoorriinngg CCoonnffiigguurraattiioonn
Quick Start Guide Kaseya 2
About Kaseya Kaseya is a global provider of IT automation software for IT Solution Providers and Public and Private Sector IT organizations. Kaseya's IT Automation Framework allows IT Professionals to proactively monitor, manage and maintain distributed IT infrastructure remotely, easily and efficiently with one integrated Web based platform. Kaseya's technology is licensed on over three million machines worldwide. Copyright © 2000-2010 Kaseya International Limited. All Rights Reserved.
i
Contents Introduction 1
Notification 3
Alarms ............................................................................................................................................................ 4 Dashboard Views and Dashlets .................................................................................................................... 7 Emails, Tickets, and Procedures ................................................................................................................... 8
Monitoring Methods 11
Alerts ............................................................................................................................................................ 12 Event Log Alerts .......................................................................................................................................... 13
Event Logs ........................................................................................................................................ 13 Sample Event Sets ............................................................................................................................ 14 Assigning Event Sets ........................................................................................................................ 14 Editing Event Sets ............................................................................................................................. 15
System Checks ............................................................................................................................................ 16 Monitor Sets ................................................................................................................................................ 16
Monitor Sets ...................................................................................................................................... 17 Sample Monitor Sets ......................................................................................................................... 17 Defining Monitor Sets ........................................................................................................................ 18 Setting Counter Thresholds Manually - An Example ........................................................................ 20 Assigning Monitor Sets ..................................................................................................................... 22 Individualized Monitor Sets ............................................................................................................... 22 Auto Learn Monitor Sets ................................................................................................................... 23
Monitoring and Templates ........................................................................................................................... 23 SNMP Sets .................................................................................................................................................. 24
SNMP Sets ........................................................................................................................................ 24 LAN Watch ........................................................................................................................................ 25 SNMP Quick Sets .............................................................................................................................. 25 Standard SNMP Sets ........................................................................................................................ 26 Assigning SNMP Sets ....................................................................................................................... 27 Individualized SNMP Sets ................................................................................................................. 28 Auto Learn SNMP Sets ..................................................................................................................... 28 SNMP Types ..................................................................................................................................... 29 Adding SNMP Objects ...................................................................................................................... 29 SNMP Traps Alert ............................................................................................................................. 30
Index 31

Introduction The Monitoring module in Kaseya® Virtual System Administrator™ provides five methods of monitoring machines and log files: Alerts - Monitors events on agent-installed machines. Monitor Sets - Monitors the performance state on agent-installed machines. SNMP Sets - Monitors the performance state on non-agent-installed devices. System Check - Monitors events on non-agent-installed machines. Log Monitoring - Monitors events in log files.
This quick start guide provides an introduction to the first four methods of monitoring and to notification in general. See the Configuring Log Parsers Step-by-Step quick start guide for information about the monitoring of log files.


3
Notification In This Chapter
Alarms 4 Dashboard Views and Dashlets 6 Emails, Tickets, and Procedures 8
C h a p t e r 1
Notification
4
Alarms The same alarm management concepts and guidelines apply to all methods of monitoring.
Alarm Conditions An alarm condition exists when a machine's performance succeeds or fails to meet a pre-defined criteria.
Alarms In graphical displays throughout the VSA, when an alarm condition exists, the VSA displays, by default, a red traffic light icon. If no alarm condition exists, a green traffic light icon displays. These icons can be customized. Alarms, and other types of responses, are enabled using the following pages: Agent > LAN Watch Backup > Backup Alerts Monitor > Alerts Monitor > Assign Monitoring Monitor > SNMP Traps Alert Monitor > Assign SNMP Monitor > System Checks Monitor > Parser Summary Monitor > Assign Parser Sets Patch Management > Patch Alerts Remote Control > Offsite Alerts Security > Apply Alarm Sets
Five Methods of Monitoring Each of the five methods of monitoring in Kaseya® Virtual System Administrator™ is either event-based or state-based. Event-based
Alerts - monitors events on agent-installed machines System Check - monitors events on non-agent-installed machines Log Monitoring - monitors events in log files
State-based Monitor Sets - monitors the performance state on agent-installed machines SNMP Sets - monitors the performance state on non-agent-installed devices
Event-Based Alarms Alerts, System Check and Log Monitoring represent event-based alarms that occur perhaps once. For example a backup may fail. There is no transition out of the condition, it just happens. Since there is no state, the red alarm in a dashlet never transitions back to green until you close the alarm in the alarm log. Typically event-based alarms are easier to configure, since the possibilities are reduced to whether one or more of the events happened or did not happen within a specified time period.
Notification
5
State-Based Alarms Monitor set counters, services, and processes and SNMP set objects are either currently within their expected state range or outside of it and display as red or green alarm icons dynamically. These are known as state-based alarms. If an alarm state currently exists, monitor dashlets show red alarms. If an alarm state does not currently exist, monitor dashlets show green alarms.
For monitor sets and SNMP sets, the criteria for an alarm condition can be tailored using Auto Learn and Individualized sets. Alarms for monitor sets and SNMP sets can be be dismissed using the Network Status dashlet. Typically state-based alarms require more thought to configure then event-based alarms, because the intent is to measure the level of performance rather than outright failure.
Reviewing Created Alarms All alarm conditions that have the Create Alarm checkbox checked—both state-based alarms and event-based alarms—are recorded in the alarm log. An alarm listed in the alarm log does not represent the current state of a machine or device, rather it is a record of an alarm that has occurred in the past. An alarm log record remains Open until you close it. Alarms can also be deleted from the alarm log. Note that a state-based alarm, like a monitor set or SNMP set, can trigger an alarm state that changes to red and then changes back to green. This same state-based alarm, if the Create Alarm checkbox is checked, can also generate an alarm record that remains Open until you close it. Created alarms can be, reviewed, Closed or Deleted... using: Monitor > Alarm Summary Monitor > Dashboard List > any Alarm Summary Window within a dashlet Agent > Agent Logs > Alarm Log Live Connect > Agent Data > Agent Logs > Alarm Log
Created alarms can also be reviewed using: Monitor > Dashboard List > Alarm List Monitor > Dashboard List > Alarm Network Status Monitor > Dashboard List > Alarm Rotator Monitor > Dashboard List > Alarm Ticker Monitor > Dashboard List > Group Alarm Status Monitor > Dashboard List > Monitor Set Status Monitor > Dashboard List > Monitor Status Monitor > Dashboard List > Top N - Monitor Alarm Count Monitor > Dashboard List > KES Status Monitor > Dashboard List > KES Threats Info Center > Reports > Monitoring > Logs > Alarm Log Info Center > Reports > Monitoring > Monitor Action Log
Reviewing Alarm Conditions with or without Creating Alarms A user can assign monitor sets, SNMP sets, alerts, system checks or log monitoring to machine IDs without checking the Create Alarm checkbox and a Monitor Action Log entry will still be created. These logs enable a VSA user to review alarm conditions that have occurred with or without being specifically notified by the creation of an alarm, email or ticket. You can generate a report using Info Center > Reports > Monitoring > Monitor Action Log.
Notification
6
Reviewing Performance with or without Creating Alarms You can review monitor sets and SNMP set performance results, with or without creating alarms, using: Monitor > Live Counter Monitor > Monitor Log Monitor > SNMP Log Monitor > Dashboard > Network Status Monitor > Dashboard > Group Alarm Status Monitor > Dashboard > Monitoring Set Status Info Center > Reports > Monitoring > Logs
Note: You must run Update Lists by Scan for each machine ID you assign a monitor set, to ensure a complete list of monitoring definitions exists on the VSA to monitor that machine.
Reviewing Performance Data using Quick Sets A Quick Status feature enables you to select any monitor set counter, service or process from any machine ID and add it to the same single display window. Using Quick Status, you can quickly compare the performance of the same counter, service or process on different machines, or display selected counters, services and processes from different monitor sets all within a single view. SNMP sets provide a similar Quick Status view for selected SNMP objects. Any Quick Status view you create exists only for the current session. The Quick Status window is accessed using Monitor > Dashboard > Monitoring Set Status, then clicking the Quick Status link or the Quick Status icon .
Reviewing Performance Data using Machine Status or Device Status A Machine Status feature enables you to select any monitor set counter, service or process for a single machine ID and add it to the same single display window. Unlike the Quick Status window, a Machine Status view persists from one session to the next. SNMP sets display a similar window called the Device Status window for selected SNMP objects. The Machine Status window and Device Status window are accessed using Monitor > Dashboard > Monitoring Set Status, then clicking the machine/device status icon .
Suspending Alarms The triggering of alarms can be suspended. The Suspend Alarms page suppresses alarms for specified time periods, including recurring time periods. This allows upgrade and maintenance activity to take place without generating alarms. When alarms are suspended for a machine ID, the agent still collects data, but does not generate corresponding alarms.
Group Alarms Alert, system check, and log monitoring alarms are automatically assigned to a group alarm category. If an alarm is triggered, the group alarm it belongs to is triggered as well. The group alarm categories for monitor sets and SNMP sets are manually assigned when the sets are defined. Group alarms display in the Group Alarm Status dashlet of the Monitor > Dashboard List page. You can create new groups using the Group Alarm Column Names tab in Monitor > Monitor Lists. Group alarm column names are assigned to monitor sets using Define Monitor Set.
Notification
7
Dashboard Views and Dashlets The Dashboard List page is the VSA's primary method of visually displaying monitoring data, including triggered alarm conditions. The Dashboard List page maintains configurable monitoring windows called Dashboard Views. Each dashboard contains one or more panes of monitoring data called Dashlets. Each VSA user can create their own customized dashboards.
Adding Dashboard Views and Dashlets To add a new dashboard:
1. Click to create a new Dashboard View. The new dashboard displays in a popup window. 2. Enter a Title and Description for your new dashboard. 3. Click the Add Dashlets tab. A side panel displays a list of dashlets. These choices include:
Alarm List Alarm Network Status Alarm Rotator Alarm Ticker Network Status Group Alarm Status Monitoring Set Status Monitor Status Machines Online Top N - Monitor Alarm Chart KES Status KES Threats
4. Check as many checkboxes as you like, then click the Add button. The side panel closes and the Dashlets display in the Dashboard View.
5. Move and resize the Dashlets within the Dashboard View. 6. Click the Delete tab to delete dashlets already displayed in the Dashboard View.
7. Click to save the Dashboard View. Click to save the Dashboard View using a different title and description.
8. Click Share to share this Dashboard View with other users, user roles or to make it public for all users to use and edit.
9. Click Take Ownership to take ownership of a Dashboard View. This option only displays for master role users.
Configuring Dashlet Options You can size and position each dashlet within the Dashboard View. You can also access additional configuration options for each dashlet by clicking the configure icon located in the upper left hand corner of the dashlet. Common configuration options include: Show Title Bar - If checked, displays the dashlet with a title bar. Title - Specifies the title of the dashlet. Refresh Rate - Specifies how often the data in the dashlet is refreshed. Machine - Filters the dashlet by machine ID. Include an asterisk (*) wildcard with the text you
enter to match multiple records.
Notification
8
Machine Group - Filters the dashlets by group ID. Select <All Groups> to see all groups you are authorized to see.
Note: Dashlets are unaffected by the main machine ID / machine group filter at the top of the VSA page.
Emails, Tickets, and Procedures Creating an alarm represents one of three ways to notify users of an alarm condition. The other two ways are to send an email or to create a ticket. In addition, alarm conditions can run an agent procedure to automatically respond to the alarm condition. These four types of responses are called the ATSE response code. Whether assigned to a machine ID, a group ID, or an SNMP device, the designation indicates which types of responses are active for the alarm condition defined. A = Create Alarm T = Create Ticket S = Run Agent Procedure E = Email Recipients
None of the ATSE responses are required. The alarm condition and the ATSE responses, including no response, is reported in the Info Center > Monitor - Monitor Action Log report. The same ATSE design applies to all methods of monitoring provided by the VSA.
Sending Emails Every page that enables you to create an alarm also provides you with an Email Recipient checkbox. Checking this checkbox triggers the sending of an email to users and users when an alarm condition occurs. The details of the alarm condition are embedded in the outgoing email. You can customize the format of outgoing emails using a Format Email popup window. Regardless of the monitoring method or alarm condition, the same email setup guidelines apply: The email address of the currently logged in user displays in the Email Recipients field. It defaults
from System > Preferences. Click Format Email to display the Format Alert Email popup window. This window enables you to
format the display of emails generated by the system when an alarm condition is encountered. If the Add to current list radio option is selected, when Apply is clicked alert settings are applied
and the specified email addresses are added without removing previously assigned email addresses.
If the Replace list radio option is selected, when Apply is clicked alert settings are applied and the specified email addresses replace the existing email addresses assigned.
If Removed is clicked, all email addresses are removed without modifying any alert parameters. Email is sent directly from the KServer to the email address specified in the alert. Set the From
Address using System > Outbound Email.
Creating Tickets Most pages that enable you to create an alarm also provide you with a Create Ticket checkbox. Checking this checkbox triggers the creation of a ticket when an alarm condition occurs. Tickets document your organization's response to alarm conditions in a more formal way than can be handled by the single initial note associated with each alarm. Tickets can be classified and passed from one user to next if multiple actions are required. For more information, see online user assistance for Ticketing or Service Desk.

Notification
9
Running Agent Procedures Most pages that enable you to create an alarm also provide you with a Run Procedure checkbox. Checking this checkbox triggers the running of an agent procedure when an alarm condition occurs. You must click the select procedure link to choose an agent procedure to run. You can optionally direct the agent procedure to run on a specified range of machine IDs by clicking this machine ID link. These specified machine IDs do not have to match the machine ID that triggered the alarm condition. For more information, see Agent Procedures in online user assistance.

11
Monitoring Methods In This Chapter
Alerts 12 Event Log Alerts 13 System Checks 16 Monitor Sets 16 Monitoring and Templates 23 SNMP Sets 24
C h a p t e r 2
Monitoring Methods
12
Alerts The Alerts page enables you to quickly define alerts for typical alarm conditions found in an IT environment. For example, low disk space is frequently a problem on managed machines. Selecting the Low Disk type of alarm displays a single additional field that lets you define the % free space threshold. Once defined, you can apply this alarm immediately to any machine ID displayed on the Alerts page and specify the response to the alarm. There are multiple types of alerts available to you.
Alert Types The Alerts - Summary page shows what alerts are enabled for each machine. You can apply or
clear settings or copy enabled alerts settings. The Alerts - Agent Status page triggers an alert when an agent is offline, first goes online, or
someone has disabled remote control on the selected machine. The Application Changes page triggers an alert when a new application is installed or removed on
selected machines. The Alerts - Get File page triggers an alert when a procedure's Get File or Get File in Directory Path
command executes, uploads the file, and the file is now different from the copy previously stored on the KServer. If there was not a previous copy on the KServer, the alarm condition is encountered.
The Alerts - Hardware Changes page triggers an alert when a hardware configuration changes on the selected machines. Detected hardware changes include the addition or removal of RAM, PCI devices, and disk drives.
The Low Disk page triggers an alert when available disk space falls below a specified percentage of free disk space.
The Alerts - Event Logs page triggers an alert when an event log entry for a selected machine matches a specified criteria. After selecting the event log type, you can filter the alarm conditions specified by event set and by event category.
The Alerts - LAN Watch page works in conjunction with the LAN Watch page. LAN Watch scans a machine ID's local LAN and detects new machines and devices connected to the machine's LAN. Both LAN Watch and the Alerts - LAN Watch page can subsequently trigger an alert when a new machine or device is discovered on a LAN. Only the Alerts - LAN Watch page can create a ticket when a new machine or device is discovered on a LAN.
The Agent Procedure Failure page triggers an alert when an agent procedure fails to execute on a managed machine.
The Alerts - Protection Violation page triggers an alert when a file is changed or access violation detected on a managed machine.
The New Agent Installed page triggers an alert when a new agent is installed on a managed machine by selected machine groups.
The Patch Alert page triggers an alert for patch management events on managed machines. The Backup Alert page triggers an alert for backup events on managed machines. The Alerts - System page triggers an alert for selected events occurring on the KServer.
Machine Summary Alerts Tab The Alerts tab in the Machine Summary page provides, in summary fashion, all the alerts defined for a machine ID. You can use this tab to quickly review, enable, or disable all the alerts applied to a single machine. Typically you display this page by alt-clicking the check-in status icon—for example, the icon—next to any machine ID.
Monitoring Methods
13
To Create An Alert The same general procedure applies to all alert types.
1. Select an alert function from the Select Alert Function drop-down list. 2. Check any of these checkboxes to perform their corresponding actions when an alarm condition
is encountered: Create Alarm Create Ticket Run Agent Procedure Email Recipients
3. Set additional email parameters. 4. Set additional alert-specific parameters. These differ based on the alert function selected. 5. Check the paging rows to apply the alert to. 6. Click the Apply button.
To Cancel an Alert 1. Select one or more paging rows. 2. Click the Clear button.
The alert information listed next to the paging row is removed.
Event Log Alerts The Alerts - Events Log page is one of the more advanced types of alerts and requires special configuration. It starts with a good understanding of event logs.
Event Logs An event log service runs on Windows operating systems (Not available with Win9x). The event log service enables event log messages to be issued by Window based programs and components. These events are stored in event logs located on each machine. The event logs of managed machines can be stored in the KServer database, serve as the basis of alerts and reports, and be archived. Depending on the operating system, the event log types available include but are not limited to: Application log Security log System log Directory service log File Replication service log DNS server log
The list of event types available to select can be updated using Monitoring > Update Lists by Scan. Windows events are further classified by the following event log categories: Error Warning Information Success Audit Failure Audit Critical - Applies only to Vista. Verbose - Applies only to Vista.
Monitoring Methods
14
Event logs are used or referenced by the following VSA pages: Monitor > Agent Logs Monitor > Alerts > Event Logs Monitor > Alerts > Edit Event Sets Monitor > Update Lists by Scan Agent > Log History Agent > Event Log Settings Agent > Agent Logs Reports > Logs System > Database Views > vNtEventLog
Sample Event Sets A growing list of sample event sets are provided. The names of sample event sets begin with ZC. You can modify sample event sets, but its better practice to copy a sample event set and customize the copy. Sample event sets are subject to being overwritten every time the sample sets are updated during a maintenance cycle.
Assigning Event Sets You apply events sets to target machine IDs using the Monitor > Alerts - Event Logs page.
Creating an Event Log Alert 1. On the Monitor > Alerts page select the event log type using the drop-down list. 2. Select the Event Set filter used to filter the events that trigger alerts. By default <All Events>
is selected. 3. Check the box next to any of the following event category:
Error Warning Information Success Audit Failure Audit Critical - Applies only to Vista. Verbose - Applies only to Vista.
Note: Red letters indicate logging disabled. Event logs may be disabled by the VSA for a particular machine, based on settings defined using Agent > Event Log Settings. A particular event category may be not be available for certain machines, such as the Critical and Verbose event categories for non-Vista machines.
4. Specify the frequency of the alarm condition required to trigger an alert: Alert when this event occurs once. Alert when this event occurs <N> times within <N> <periods>. Alert when this event doesn't occur within <N> <periods>. Ignore additional alarms for <N> <periods>.
5. Click the Add or Replace radio options, then click Apply to assign selected event type alerts to selected machine IDs.
6. Click Remove to remove all event based alerts from selected machine IDs.
Monitoring Methods
15
Editing Event Sets In step 2 of the Creating an Event Log Alert procedure above you are asked to select an event set. The following discussion describes how to edit events sets. Edit Event Sets filters the triggering of alerts based on the monitoring of events in event logs maintained by the Windows OS of a managed machine. You can assign multiple event sets to a machine ID. Event sets contain one or more conditions. Each condition contains filters for different fields in an event log entry. The fields are source, category, event ID, user, and description. An event log (page 13) entry has to match all the field filters of a condition to be considered a match. A field with an asterisk character (*) means any string, including a zero string, is considered a match. A match of any one of the conditions in an event set is sufficient to trigger an alert for any machine that event set is applied to.
Note: Normally, if two conditions are added to an event set, they are typically interpreted as an OR statement. If either one is a match, the alert is triggered. The exception is when the Alert when this event doesn't occur within <N> <periods> option is selected. In this case the two conditions should be interpreted as an AND statement. Both must not happen within the time period specified to trigger an alert.
Note: You can display event logs directly. On a Windows machine click Start, then click Control Panel, then click Administrative Tools, then click Event Viewer. Click Application, Security or System to display the events in that log. Double-click an event to display its Properties window. You can copy and paste text from the Properties window of any event into Edit Event Set fields.
To Create a New Event Set 1. On the Alerts page, select Events Logs from the Select Alert Function drop-down list. 2. Select an Event Log Type from the second drop-down list. 3. Select <New Event Set> from the Define events to match or ignore drop-down list. The Edit Event
Set popup window displays. You can create a new event set by: • Entering a new name and clicking the New button. • Pasting event set data as text. • Importing event set data from a file. 1. If you enter a new name and click New, the Edit Event Set window displays the five properties
used to filter events. 2. Click Add to add a new event to the event set. 3. Click Ignore to specify an event that should not trigger an alarm. 4. You can optionally Rename, Delete or Export Event Set.
Ignore Conditions If an event log entry matches one more more ignore conditions in an event set, then no alert is triggered by any event set, even if multiple conditions in multiple event sets match an event log entry. Because ignored conditions override all event sets, it's a good idea to define just one event set for all ignored conditions, so you only have to look in one place if you suspect an ignored condition is affecting the behavior of all your alerts. You must assign the event set containing an ignored condition to a machine ID for it to override all other event sets applied to that same machine ID. Ignore conditions only override events sharing the same log type. So if you create an "ignore set" for all ignore conditions, it must be applied multiple times to the same machine ID, one for each log type. For example, an ignore set applied only as a System log type will not override event conditions applied as Application and Security log type events.
Monitoring Methods
16
1. On the Alerts page, select Event Logs from the Select Alert Function drop-down list. 2. Check the Error checkbox and select <All Events> from the event set list. Click the Apply
button to assign this setting to all selected machine IDs. This tells the system to generate an alert for every error event type. Note the assigned log type.
3. Create and assign an "ignore event set" to these same machine IDs that specifies all the events you wish to ignore. The log type must match the log type in step 2.
Using the Asterisk (*) Wildcard Include an asterisk (*) wildcard with the text you enter to match multiple records. For example: *yourFilterWord1*yourFilterWord2*
This would match and raise an alarm for an event with the following string: "This is a test. yourFilterWord1 as well as yourFilterWord2 are in the description."
Exporting and Importing Edit Events You can export and import event set records as XML files. You can export an existing event set record to an XML file using the Edit Event Set popup
window. You can import an event set XML file by selecting the <Import Event Set> or <New Event
Set> value from the event set drop-down list. Example: <?xml version="1.0" encoding="ISO-8859-1" ?> <event_sets> <set_elements setName="Test Monitor Set" eventSetId="82096018"> <element_data ignore="0" source="*SourceValue*" category="*CategoryValue*" eventId="12345" username="*UserValue*" description="*DescriptionValue*"/> </set_elements> </event_sets>
System Checks The VSA can monitor machines that don't have an agent installed on them. This function is performed entirely within a single page called System Check. Machines without an agent are called external systems. A machine with an agent is assigned the task of performing the system check on the external system. A system check typically determines whether an external system is available or not. Types of system checks include: web server, DNS server, port connection, ping, and custom.
Monitor Sets Monitor Sets use Windows-based performance counters to provide information as to how well the operating system or an application, service, or driver is performing. Counter data can help determine system bottlenecks and fine-tune system and application performance. For example, a server may continue working without generating any errors or warnings in the event logs. Nevertheless, users may complain the server's response time is slow.
Note: Counters in VSA monitor sets are based on real time state-based data, not log files. See Alarms (page 4) for more information.
Monitoring Methods
17
Performance Objects, Instances and Counters When setting up counter thresholds in monitor sets (page 17), it's helpful to keep in mind exactly how both Windows and the VSA identify the components you can monitor: Performance Object - A logical collection of counters that is associated with a resource or service
that can be monitored. For example: processors, memory, physical disks, servers each have their own sets of predefined counters.
Performance Object Instance - A term used to distinguish between multiple performance objects of the same type on a computer. For example: multiple processors or multiple physical disks. The VSA lets you skip this field if there is only one instance of an object.
Performance Counter - A data item that is associated with a performance object, and if necessary, the instance. Each selected counter presents a value corresponding to a particular aspect of the performance that is defined for the performance object and instance.
Monitor Sets A monitor set is a set of counter objects, counters, counter instances, services and processes used to monitor the performances of machines. Typically, a threshold is assigned to each object/instance/counter, service, or process in a monitor set. Alarms can be set to trigger if any of the thresholds in the monitor set are exceeded. A monitor set should be used as a logical set of things to monitor. A logical grouping, for example, could be to monitor all counters and services integral to running an Exchange Server. You can assign a monitor set to any machine that has an operating system of Windows 2000 or newer. The general procedure for working with monitor sets is as follows:
1. Update monitor set counter objects, instances and counters by source machine ID using Monitor > Update Lists by Scan.
Note: You must run Update Lists by Scan for each machine ID you assign a monitor set, to ensure a complete list of monitoring definitions exists on the VSA to monitor that machine.
2. Optionally update monitor set counter objects, instances and counters manually and review them using Monitor Lists.
3. Create and maintain monitor sets using Monitor > Monitor Sets. 4. Assign monitor sets to machine IDs using Monitor > Assign Monitoring. 5. Optionally customize standard monitor sets as individualized monitor sets. 6. Optionally customize standard monitor sets using Auto Learn. 7. Review monitor set results using:
Monitor > Monitor Log Monitor > Live Counter Monitor > Dashboard > Network Status Monitor > Dashboard > Group Alarm Status Monitor > Dashboard > Monitoring Set Status Info Center > Reports > Monitor > Monitor Set Report Info Center > Reports > Monitor > Monitor Action Log
Sample Monitor Sets The VSA provides a growing list of sample monitor sets. The names of sample monitor sets begin with ZC. You can modify sample monitor sets, but its better practice to copy a sample monitor set and customize the copy. Sample monitor sets are subject to being overwritten every time the sample sets are updated during a maintenance cycle.
Monitoring Methods
18
Defining Monitor Sets Each monitor set is defined using four tabs. The Counter Thresholds tab defines alarm conditions for all performance
objects/instances/counters associated with a monitor set. These are the same performance objects, instances and counters displayed when you run PerfMon.exe on a Windows machine.
The Services Check tab defines alarms conditions for a service if the service on a machine ID has stopped, and optionally attempts to restart the stopped service.
The Process Status tab defines alarm conditions based on whether a process has started or stopped on a machine ID.
The Monitor Icons tab selects the monitor icons that display in the Monitor Log page when various alarm states occur.
Configuring Counter Thresholds After you add a new monitor set using Monitor > Monitor Sets, you can add or edit counter thresholds using the Counter Thresholds tab. Click Add or the edit icon to use a wizard that leads you through the six steps required to add or edit a performance counter.
1. Select a Object, Counter and, if necessary, an Instance using their respective drop-down lists. If only one instance of a performance object exists, the Instance field can usually be
skipped. The drop-down lists used to select performance objects, counters, and instances are
based on the "master list" maintained using the Monitor Lists page. If an object/instance/counter does not display in its respective drop-down list, you can add it manually using Add Object, Add Counter, and Add Instance. You can also update the "master list" of all objects, instances and counters by scanning specific machine IDs using Update Lists By Scan. Once the update is completed, the drop lists should be populated with the options you require.
When multiple instances exist, you often have the option of using an instance called _Total. The _Total instance means you want to monitor the combined value of all the other instances of a performance object as a single counter. The _Total can be used as a kind of "wildcard instance". Without the _Total instance you would have to specify each instance by its exact name, which makes applying the same monitor set to multiple machines difficult. The true benefit of the _Total instance is determining if there are any performance issues for any instance of this object at all. Once you know that you can investigate the specific cause.
When multiple instances exist, you sometimes have the option of using an instance called *ALL. The *ALL instance means you want to monitor all instances for the same performance object using individual counters.
2. Optionally change the default counter object Name and Description. 3. Select the log data collected. If the returned value is numeric, you can minimize unwanted log
data by setting a collection operator just over or just under the collection threshold. Collection Operator - For character string return values, the options are Changed, Equal or
NotEqual. For numeric return values, the options are Equal, NotEqual, Over, or Under.
Collection Threshold - Set a fixed value that the returned value is compared to, using the selected Collection Operator, to determine what log data is collected.
Sample Interval - Defines how frequently the data is sent by the agent to the KServer.
Monitoring Methods
19
4. Specify when an alarm condition is encountered. Alarm Operator - For character string return values, the options are Changed, Equal or
NotEqual. For numeric return values, the options are Equal, NotEqual, Over or Under.
Alarm Threshold - Set a fixed value that the returned value is compared to, using the selected Alarm Operator, to determine when an alarm condition is encountered.
Duration - Specify the time the returned values must continuously exceed the alarm threshold to generate the alarm condition. Many alarm conditions are only alarming if the level is sustained over a long period of time.
Ignore additional alarms for - Suppress additional alarm conditions for this same issue for this time period. This reduces the confusion of many alarm conditions for the same issue.
5. Warn when within X% of alarm threshold - Optionally display a warning alarm condition when the returned value is within a specified percentage of the Alarm Threshold. The default warning icon is a yellow traffic light icon . See Monitor Icons.
6. Optionally activate a trending alarm. Trending alarms use historical data to predict when the next alarm condition will occur. Trending Activated? - If yes, a linear regression trendline is calculated based on the last
2500 data points logged. Trending Window - The time period used to extend the calculated trendline into the future. If
the predicted trendline exceeds the alarm threshold within the future time period specified, a trending alarm condition is generated. Typically a trending window should be set to the amount of time you need to prepare for an alarm condition, if it occurs. Example: a user may want 10 days notice before a hard drive reaches the alarm condition, to accommodate ordering, shipping and installing a larger hard drive.
Ignore additional trending alarms for - Suppress additional trending alarm conditions for this same issue for this time period.
By default, trending alarms display as an orange icon . You can change this icon using the Monitor Icons tab.
Warning status alarm conditions and trending status alarm conditions don't create alarm entries in the alarm log, but they change the image of the alarm icon in various display windows. You can generate a trending alarm report using Reports > Monitor.
Configuring Services Check Monitor services using a monitor set as follows. Click Add or the edit icon to maintain a Services Check record.
1. Service - Selects the service to be monitored from the drop-down list. The drop-down list is based on the "master list" maintained using the Monitor Lists page. If
a service does not display in the drop-down list, you can add it manually using Add Service. You can also update the "master list" by scanning specific machine IDs using Update Lists By Scan.
Select the *ALL selection to monitor all services on a monitored machine. 2. Description - Describes the service and the reason for monitoring. 3. Restart Attempts - The number of times the system should attempt to restart the service. 4. Restart Interval - The time period to wait between restart attempts. Certain services need more
time. 5. Ignore additional alarms for - Suppresses additional alarm conditions for the specified time period.
Monitoring Methods
20
Configuring Process Status Click Add or the edit icon to maintain a Process Status record.
1. Process - Selects the process to be monitored from the drop-down list. The drop-down list is based on the "master list" maintained using the Monitor Lists page. If a process does not display in the drop-down list, you can add it manually using Add Process. You can also update the "master list" by scanning specific machine IDs using Update Lists By Scan.
2. Description - Describes the process and the reason for monitoring. 3. Alarm on Transition - Triggers an alarm condition when a process (application) is started or
stopped. 4. Ignore additional alarms for - Suppresses additional alarm conditions for the specified time period.
Setting Counter Thresholds Manually - An Example In this example, the ZC-PS1-Print Server Monitor monitor set is reviewed to illustrate how monitor sets counter thresholds are defined.
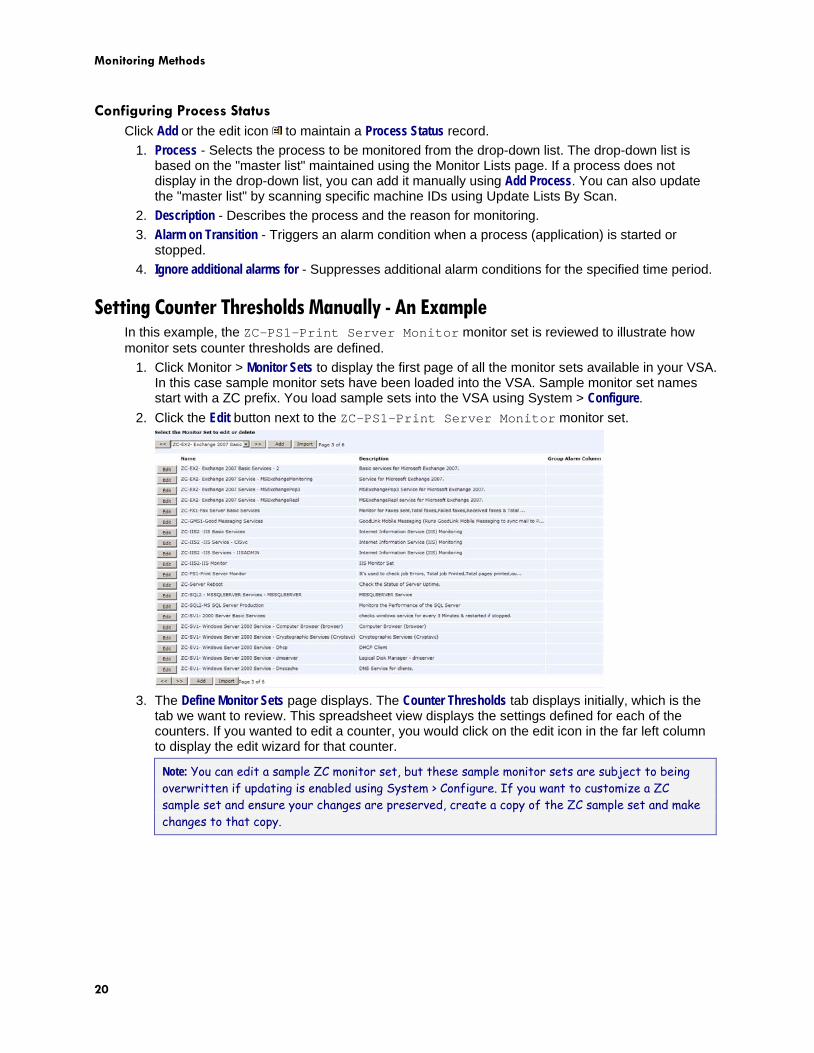
1. Click Monitor > Monitor Sets to display the first page of all the monitor sets available in your VSA. In this case sample monitor sets have been loaded into the VSA. Sample monitor set names start with a ZC prefix. You load sample sets into the VSA using System > Configure.
2. Click the Edit button next to the ZC-PS1-Print Server Monitor monitor set.
3. The Define Monitor Sets page displays. The Counter Thresholds tab displays initially, which is the
tab we want to review. This spreadsheet view displays the settings defined for each of the counters. If you wanted to edit a counter, you would click on the edit icon in the far left column to display the edit wizard for that counter.
Note: You can edit a sample ZC monitor set, but these sample monitor sets are subject to being overwritten if updating is enabled using System > Configure. If you want to customize a ZC sample set and ensure your changes are preserved, create a copy of the ZC sample set and make changes to that copy.
Monitoring Methods
21
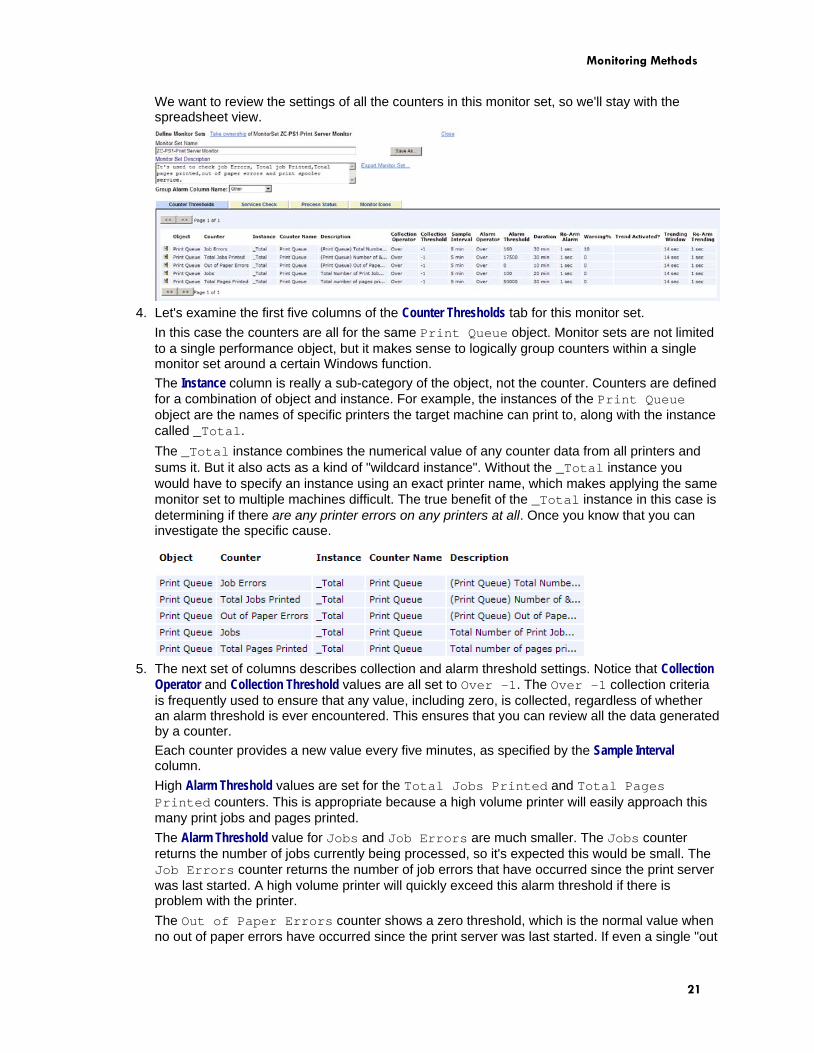
We want to review the settings of all the counters in this monitor set, so we'll stay with the spreadsheet view.
4. Let's examine the first five columns of the Counter Thresholds tab for this monitor set.
In this case the counters are all for the same Print Queue object. Monitor sets are not limited to a single performance object, but it makes sense to logically group counters within a single monitor set around a certain Windows function. The Instance column is really a sub-category of the object, not the counter. Counters are defined for a combination of object and instance. For example, the instances of the Print Queue object are the names of specific printers the target machine can print to, along with the instance called _Total. The _Total instance combines the numerical value of any counter data from all printers and sums it. But it also acts as a kind of "wildcard instance". Without the _Total instance you would have to specify an instance using an exact printer name, which makes applying the same monitor set to multiple machines difficult. The true benefit of the _Total instance in this case is determining if there are any printer errors on any printers at all. Once you know that you can investigate the specific cause.
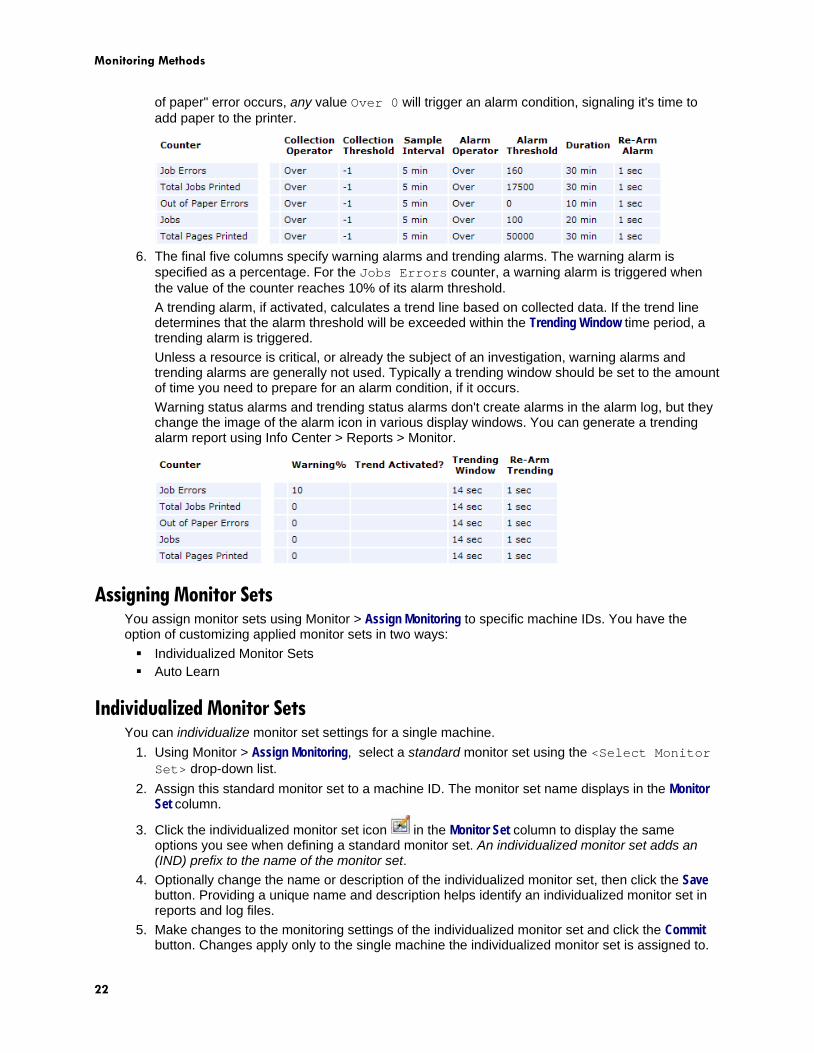
5. The next set of columns describes collection and alarm threshold settings. Notice that Collection
Operator and Collection Threshold values are all set to Over -1. The Over -1 collection criteria is frequently used to ensure that any value, including zero, is collected, regardless of whether an alarm threshold is ever encountered. This ensures that you can review all the data generated by a counter. Each counter provides a new value every five minutes, as specified by the Sample Interval column. High Alarm Threshold values are set for the Total Jobs Printed and Total Pages Printed counters. This is appropriate because a high volume printer will easily approach this many print jobs and pages printed. The Alarm Threshold value for Jobs and Job Errors are much smaller. The Jobs counter returns the number of jobs currently being processed, so it's expected this would be small. The Job Errors counter returns the number of job errors that have occurred since the print server was last started. A high volume printer will quickly exceed this alarm threshold if there is problem with the printer. The Out of Paper Errors counter shows a zero threshold, which is the normal value when no out of paper errors have occurred since the print server was last started. If even a single "out
Monitoring Methods
22
of paper" error occurs, any value Over 0 will trigger an alarm condition, signaling it's time to add paper to the printer.
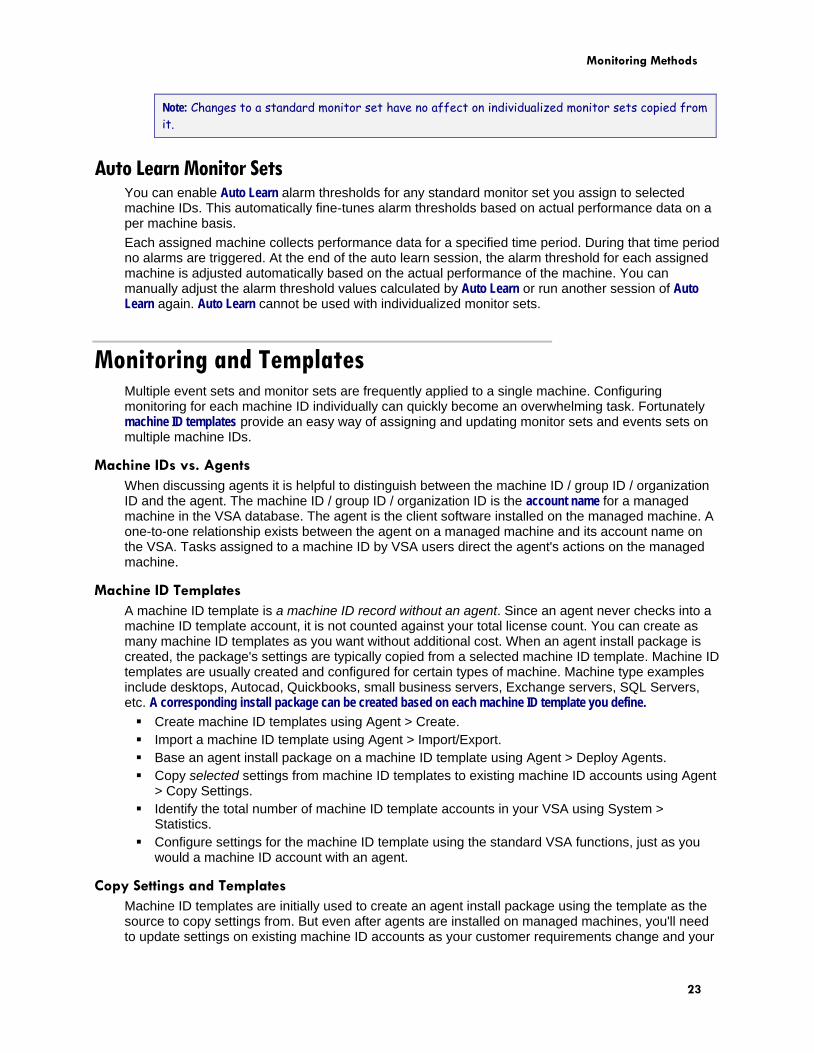
6. The final five columns specify warning alarms and trending alarms. The warning alarm is
specified as a percentage. For the Jobs Errors counter, a warning alarm is triggered when the value of the counter reaches 10% of its alarm threshold. A trending alarm, if activated, calculates a trend line based on collected data. If the trend line determines that the alarm threshold will be exceeded within the Trending Window time period, a trending alarm is triggered. Unless a resource is critical, or already the subject of an investigation, warning alarms and trending alarms are generally not used. Typically a trending window should be set to the amount of time you need to prepare for an alarm condition, if it occurs. Warning status alarms and trending status alarms don't create alarms in the alarm log, but they change the image of the alarm icon in various display windows. You can generate a trending alarm report using Info Center > Reports > Monitor.
Assigning Monitor Sets You assign monitor sets using Monitor > Assign Monitoring to specific machine IDs. You have the option of customizing applied monitor sets in two ways: Individualized Monitor Sets Auto Learn
Individualized Monitor Sets You can individualize monitor set settings for a single machine.
1. Using Monitor > Assign Monitoring, select a standard monitor set using the <Select Monitor Set> drop-down list.
2. Assign this standard monitor set to a machine ID. The monitor set name displays in the Monitor Set column.
3. Click the individualized monitor set icon in the Monitor Set column to display the same options you see when defining a standard monitor set. An individualized monitor set adds an (IND) prefix to the name of the monitor set.
4. Optionally change the name or description of the individualized monitor set, then click the Save button. Providing a unique name and description helps identify an individualized monitor set in reports and log files.
5. Make changes to the monitoring settings of the individualized monitor set and click the Commit button. Changes apply only to the single machine the individualized monitor set is assigned to.
Monitoring Methods
23
Note: Changes to a standard monitor set have no affect on individualized monitor sets copied from it.
Auto Learn Monitor Sets You can enable Auto Learn alarm thresholds for any standard monitor set you assign to selected machine IDs. This automatically fine-tunes alarm thresholds based on actual performance data on a per machine basis. Each assigned machine collects performance data for a specified time period. During that time period no alarms are triggered. At the end of the auto learn session, the alarm threshold for each assigned machine is adjusted automatically based on the actual performance of the machine. You can manually adjust the alarm threshold values calculated by Auto Learn or run another session of Auto Learn again. Auto Learn cannot be used with individualized monitor sets.
Monitoring and Templates Multiple event sets and monitor sets are frequently applied to a single machine. Configuring monitoring for each machine ID individually can quickly become an overwhelming task. Fortunately machine ID templates provide an easy way of assigning and updating monitor sets and events sets on multiple machine IDs.
Machine IDs vs. Agents When discussing agents it is helpful to distinguish between the machine ID / group ID / organization ID and the agent. The machine ID / group ID / organization ID is the account name for a managed machine in the VSA database. The agent is the client software installed on the managed machine. A one-to-one relationship exists between the agent on a managed machine and its account name on the VSA. Tasks assigned to a machine ID by VSA users direct the agent's actions on the managed machine.
Machine ID Templates A machine ID template is a machine ID record without an agent. Since an agent never checks into a machine ID template account, it is not counted against your total license count. You can create as many machine ID templates as you want without additional cost. When an agent install package is created, the package's settings are typically copied from a selected machine ID template. Machine ID templates are usually created and configured for certain types of machine. Machine type examples include desktops, Autocad, Quickbooks, small business servers, Exchange servers, SQL Servers, etc. A corresponding install package can be created based on each machine ID template you define. Create machine ID templates using Agent > Create. Import a machine ID template using Agent > Import/Export. Base an agent install package on a machine ID template using Agent > Deploy Agents. Copy selected settings from machine ID templates to existing machine ID accounts using Agent
> Copy Settings. Identify the total number of machine ID template accounts in your VSA using System >
Statistics. Configure settings for the machine ID template using the standard VSA functions, just as you
would a machine ID account with an agent.
Copy Settings and Templates Machine ID templates are initially used to create an agent install package using the template as the source to copy settings from. But even after agents are installed on managed machines, you'll need to update settings on existing machine ID accounts as your customer requirements change and your
Monitoring Methods
24
knowledge of the VSA grows. In this case use Agent > Copy Settings to copy these changes to any number of machines IDs you are authorized to access. Be sure to select Do Not Copy for any settings you do not want to overwrite. Use Add to copy settings without removing existing settings. Kaseya recommends making changes to a selected template first, then using that template as the source machine ID to copy changes from. This ensures that your machine ID templates remain the "master repositories" of all your agent settings and are ready to serve as the source of agent install packages and existing machine ID accounts.
SNMP Sets Certain network devices such as printers, routers, firewalls, servers and UPS devices can't support the installation of an agent. But a VSA agent installed on a managed machine on the same network as the device can read or write to that device using simple network management protocol (SNMP). Read/write instructions are communicated using a set of object variables. Collectively, the set of object variables made available by a device is called its Management Information Base or MIB. The objects within a MIB are therefore referred to as MIB objects. Vendors typically provide a specific data file for each device called a MIB file. MIB files are used by monitoring systems such as the VSA to identify the MIB objects available on a device and the typical read or write values for each MIB object. The MIB file includes the "friendly name" associated with an object's ID number or OID number, enabling you to easily identify the object in SNMP sets.
SNMP Sets A SNMP set is a set of MIB objects used to monitor the performance of SNMP enabled network devices. The SNMP protocol is used because an agent cannot be installed on the device. You can assign alarm thresholds to any performance object in a SNMP set. If you apply the SNMP set to a device, you can be notified if the alarm threshold is exceeded. The following methods can be used to configure and assign SNMP sets to machine IDs. SNMP quick sets - Creates and assigns a device-specific SNMP set based on the objects
discovered on that device during a LAN Watch. SNMP quick sets are the easiest method of implementing SNMP monitoring on a device.
SNMP standard sets - These are usually generic SNMP sets that are maintained and applied to multiple devices. A quick set, once created, can be maintained as a standard set.
SNMP individualized sets - This is a standard SNMP set that is applied to an individual device and then customized manually.
SNMP auto learn - This is a standard SNMP set that is applied to an individual device and then adjusted automatically using auto learn.
SNMP types - This is a method of assigning standard SNMP sets to devices automatically, based on the SNMP type (page 29) determined during a LAN Watch.
Typically the following procedure is used to configure and apply SNMP sets to devices. 1. Discover SNMP devices using Monitor > LAN Watch. 2. Assign SNMP sets to discovered devices using Monitor > Assign SNMP. This can include quick,
standard, individualized or auto learn SNMP sets. 3. Display SNMP alarms using Monitor > SNMP Log or Dashboard List.
The following additional SNMP functions are available and can be used in any order. Optionally review the list of all imported SNMP objects using Monitor > Monitor Lists. Optionally maintain SNMP sets using Monitor > SNMP Sets. Optionally add an SNMP object using Monitor > Add SNMP Object. Optionally assign a SNMP type to an SNMP device manually using Monitor > Set SNMP Type. Optionally write values to SNMP devices using Monitor > Set SNMP Values.
Monitoring Methods
25
LAN Watch All methods of monitoring SNMP devices begin by running a LAN Watch. LAN Watch uses an existing agent on a managed machine to periodically scan the local area network for any and all new devices connected to that LAN since the last time LAN Watch ran. These new devices can be workstations and servers without agents or SNMP devices. Optionally, the VSA can send an alert when a LAN Watch discovers any new device. LAN Watch effectively uses the agent as a proxy to scan a LAN behind a firewall that might not be accessible from a remote server. To enable scanning of SNMP devices, set the following options before performing the LAN Watch:
1. Check the Enable SNMP checkbox. 2. Enter the SNMP community name in the Read Community Name and Confirm text boxes. A LAN
Watch can only identify SNMP devices that share the same read SNMP community name. The default read community name value is public.
SNMP Quick Sets The SNMP Info link page displays a list of SNMP objects provided by the specific SNMP device you selected. These objects are discovered by performing a limited SNMP "walk" on all discovered SNMP devices each time a LAN Watch is performed. You can subsequently define device-specific SNMP sets called quick sets and associate alerts with these quick sets. Quick sets can be individualized for a single device. The standard version of the quick set can be shared with other users and applied to similar devices throughout the VSA. The prefix (QS) is used to distinguish quick set names from other kinds of SNMP sets.
1. Discover SNMP devices using Monitor > LAN Watch. 2. Assign SNMP sets to discovered devices using Monitor > Assign SNMP. 3. Click the hyperlink underneath the name of the device, called the SNMP info link, in the Assign
SNMP page to display a list of SNMP objects that apply to the specific SNMP device you selected. When the window opens, follow its instructions.
4. Display SNMP alarms using Monitor > SNMP Log or Dashboard List. Use the following tabs on the SNMP Info link page to configure an SNMP quick set.
Discovered MIB Objects tab The Discovered MIB Objects tab lists all objects sets discovered by the last SNMP "walk" that apply to the selected SNMP device. You can use this tab to add objects and instances to an SNMP quick set for this device. Add Instance - Click to add this instance of this object to an SNMP "quick set" displays in the
SNMP Set tab of this same window. Add All Instances - Click to add all instances of this object to an SNMP "quick set" displays in the
SNMP Set tab of this same window. SNMP Object - The name of the SNMP object. If no name is provided for the object, the OID
numerical designation displays. Instance - The instance of the object. Many objects have multiple instances, each of which have
a different value. For example, the different instances could be ports on a router, or paper trays on a printer. The field is blank if the last number of an OID is zero, which indicates there can only be one member of this object. If an instance is not blank, or any number other than 0, than more than one "instance" of this same object exists for the device. You can specify monitoring of multiple instances of an object by entering a range of numbers, such as 1-5,6 or 1,3,7. You can also enter All.
Current SNMP Value - The value returned by the object/instance combination by the latest SNMP "walk".
Monitoring Methods
26
Quick Set Items tab The Quick Set Items tab configures the objects and instances selected to be included in your SNMP quick set. Click the edit icon to define SNMP monitoring attributes for the selected objects. You can also use the Add button to add a new object and set these same attributes. SNMP Object - The SNMP object name or OID number. SNMP Instance - The last number of an object ID may be expressed as a table of values instead
of as a single value. If the instance is a single value, enter 0. If the instance is a table of values, enter a range of numbers, such as 1-5,6 or 1,3,7. You can also enter All.
Alarm Operator - For character string return values, the options are Changed, Equal or NotEqual. For numeric return values, the options are Equal, NotEqual, Over, or Under.
Alarm Threshold - Set a fixed value that the returned value is compared to, using the selected Alarm Operator, to determine when an alarm is triggered.
Value Returned as - If the MIB object returns a numeric value, you can choose to return this value as a Total or a Rate Per Second.
Current SNMP Value - The value returned by the object/instance combination by the latest SNMP "walk".
Standard SNMP Sets You can optionally maintain standard SNMP sets, including quick sets, using Monitor > SNMP Sets. You can also add individual objects from an imported MIB file. Once you've displayed the SNMP Sets page, use the following procedure.
Click Add or the edit icon to use a wizard that leads you through the six steps required to add or edit the monitoring of a MIB object.
1. Add the object/version/instance combination required to retrieve information from a SNMP device. MIB Object - Select the MIB object. Click Add Object to add a MIB object that currently
does not exist on the Monitor Lists page. SNMP Version - Select a SNMP version. Version 1 is supported by all devices and is the
default. Version 2c defines more attributes and encrypts the packets to and from the SNMP agent. Only select version 2c if you know the device supports version 2c.
SNMP Instance - The last number of an object ID may be expressed as a table of values instead of as a single value. If the instance is a single value, enter 0. If the instance is a table of values, enter a range of numbers, such as 1-5,6 or 1,3,7. You can also enter All. An All instance represents all the instances available for an object.
Note: If you're not sure what numbers are valid for a particular SNMP instance, select a machine ID that has performed a LAN Watch using Monitoring > Assign SNMP. Click the SNMP Info hyperlink for the device you're interested in. This displays all MIB object IDs and the SNMP instances available for the device.
Value Returned as - If the MIB object returns a numeric value, you can choose to return this value as a Total or a Rate Per Second.
2. Optionally change the default MIB object Name and Description. 3. Select the log data collected. If the returned value is numeric, you can minimize the
collection of unwanted log data by setting a collection operator just over or just under the collection threshold. Collection Operator - For character string return values, the options are Changed,
Equal or NotEqual. For numeric return values, the options are Equal, NotEqual, Over or Under.
Monitoring Methods
27
Collection Threshold - Set a fixed value that the returned value is compare to, using the selected Collection Operator, to determine what log data is collected.
SNMP Timeout - Specify the number of periods the agent waits for a reply from the SNMP device before giving up. Two seconds is the default.
4. Specify when a SNMP alarm condition is triggered. Alarm Operator - For character string return values, the options are Changed, Equal
or NotEqual. For numeric return values, the options are Equal, NotEqual, Over, Under or Percent Of.
Alarm Threshold - Set a fixed value that the returned value is compared to, using the selected Alarm Operator, to determine when an alarm condition is triggered.
Percent Object - Selecting the Percent Of option for Alarm Operator causes this field to display. Enter another object/version/instance in this field whose value can serve as a 100% benchmark for comparison purposes.
Duration - Specify the time the returned values must continuously exceed the alarm threshold to generate the alarm condition. Many alarm conditions are only alarming if the level is sustained over a long period of time.
Ignore additional alarms for - Suppress additional alarm conditions for this same issue for this time period. This reduces the confusion of many alarm conditions for the same issue.
5. Warn when within X% of alarm threshold - Optionally display a warning alarm condition in the Dashboard List page when the returned value is within a specified percentage of the Alarm Threshold. The default warning icon is a yellow traffic light icon . See SNMP Icons.
6. Optionally activate a trending alarm. Trending alarms use historical data to predict when the next alarm condition will occur. Trending Activated? - If yes, a linear regression trendline is calculated based on the last
2500 data points logged. Trending Window - The time period used to extend the calculated trendline into the
future. If the predicted trendline exceeds the alarm threshold within the future time period specified, a trending alarm condition is generated. Typically a trending window should be set to the amount of time you need to prepare for an alarm condition, if it occurs.
Ignore additional trending alarms for - Suppresses additional trending alarm conditions for this same issue during this time period.
By default, trending alarms display as an orange icon in the Dashboard List page. You can change this icon using the SNMP Icons tab.
Warning status alarms and trending status alarms don't create alarm entries in the alarm log, but they change the image of the alarm icon in various display windows. You can generate a trending alarm report using Reports > Monitor.
Assigning SNMP Sets You assign SNMP sets using Monitor > Assign SNMP to specific devices. You have the option of customizing applied SNMP sets in two ways: Individualized SNMP Sets Auto Learn SNMP Sets
Monitoring Methods
28
Individualized SNMP Sets You can individualize SNMP set settings for a single machine.
1. Select a standard SNMP set using the <Select Monitor Set> drop-down list. 2. Assign this standard SNMP set to a SNMP device. The SNMP set name displays in the SNMP
Info / SNMP Set column.
3. Click the individualized monitor set icon in the SNMP Info / SNMP Set column to display the same options you see when defining a standard SNMP set. An individualized SNMP set adds an (IND) prefix to the name of the SNMP set.
4. Make changes to your new individualized SNMP set. These changes apply only to the single SNMP device it is assigned to.
Note: Changes to a standard SNMP set have no affect on individualized SNMP sets copied from it.
Auto Learn SNMP Sets You can enable Auto Learn alarm thresholds for any standard SNMP set you assign to selected SNMP devices. This automatically fine-tunes alarm thresholds based on actual performance data on a per SNMP device basis. Each assigned SNMP device generates performance data for a specified time period. During that time period no alarms are triggered. At the end of the Auto Learn session, the alarm threshold for each assigned SNMP device is adjusted automatically based on the actual performance of the SNMP device. You can manually adjust the alarm threshold values calculated by Auto Learn or run another session of Auto Learn again. Auto Learn cannot be used with individualized SNMP sets. To apply Auto Learn settings to selected SNMP devices:
1. Select a standard SNMP set using the <Select SNMP Set> drop-down list. 2. Click Auto Learn to display the Auto Learn popup window. Use a wizard to define parameters
used to calculate alarm threshold values. 3. Assign this standard SNMP set, modified by your Auto Learn parameters, to selected SNMP
devices.
Note: You cannot apply Auto Learn settings to an SNMP set that is already assigned to a device. If necessary, clear the existing assignment of the SNMP set to the device, then perform steps 1 through 3 above.
Once Auto Learn is applied to a machine ID and runs for the specified time period, you can click the override auto learn icon for a specific SNMP device and manually adjust the calculated alarm threshold values. You can also re-run Auto Learn again, using a new session of actual performance data to re-calculate alarm threshold values. Use the following procedure to configure SNMP auto learn settings in the Auto Learn popup window:
Click the edit icon to use a wizard that leads you through the three steps required to edit auto learn alarm thresholds.
1. Enable Auto Learn for this SNMP object, if appropriate, by selecting Yes - Include. If No - Do not include is selected, no other selections in this wizard are applicable. Time Span - Enter the period of time performance data is collected and used to
calculate alarm thresholds automatically. Alarms will not be reported during this time period.
2. Displays the SNMP Object of the alarm threshold being modified. This option cannot be changed.
Monitoring Methods
29
3. Enter calculated value parameters. Computation - Select a calculated value parameter. Options include MIN, MAX or AVG.
For example, selecting MAX means calculate the maximum value collected by an SNMP object during the Time Span specified above.
% Increase - Add this percentage to the Computation value calculated above, with the Computation value representing 100%. The resulting value represents the alarm threshold.
Minimum - Set a minimum value for the alarm threshold. The value is automatically calculated as two standard deviations below the calculated Computation value, but can be manually overridden.
Maximum - Set a maximum value for the alarm threshold. The value is automatically calculated as two standard deviations above the calculated Computation value, but can be manually overridden.
SNMP Types You can assign SNMP sets (page 24) to devices by type automatically as follows:
1. Add or edit SNMP types using the SNMP Device tab in Monitor > Monitor Lists. 2. Add or edit the sysServicesNumber associated with SNMP types using the SNMP Services tab
in Monitor > Monitor Lists. Broad categories of SNMP devices share the same sysServiceNumber.
3. Associate a SNMP type with a SNMP set using the Automatic Deployment to drop-down list in Monitor > SNMP Sets > Define SNMP Set.
4. Perform a LAN Watch. During a LAN Watch SNMP devices are automatically assigned to be monitored by SNMP sets if the SNMP device returns a sysServicesNumber associated with a SNMP type used by those SNMP sets.
5. Manually assign a SNMP type to an SNMP device using Monitor > Set SNMP Type. Doing so causes SNMP sets using that same type to start monitoring the SNMP device.
Adding SNMP Objects When you select objects to include in an SNMP set you're given the opportunity of adding a new SNMP object. This should not be necessary for the most part, because a LAN Watch retrieves the objects you typically require. But if you do need to add an SNMP object from a MIB file manually you can do so using Monitor > Add SNMP Object or by clicking the Add Object... button while configuring an SNMP set. The SNMP MIB Tree page loads a Management Information Base (MIB) file and displays it as an expandable tree of MIB objects. All MIB objects are classified by their location on the MIB tree. Once loaded you can select the MIB objects you want to install on your VSA. SNMP device manufacturers typically provide MIB files on their websites for the devices they manufacture.
Note: You can review the complete list of MIB objects already installed, by selecting the MIB OIDs tab in Monitoring > Monitor Lists. This is the list of MIB objects you currently can include in an SNMP set.
If a vendor has supplied you with a MIB file, you can follow these steps: 1. Load the vendor's MIB file by clicking Load MIB .... There may be a message stating there are
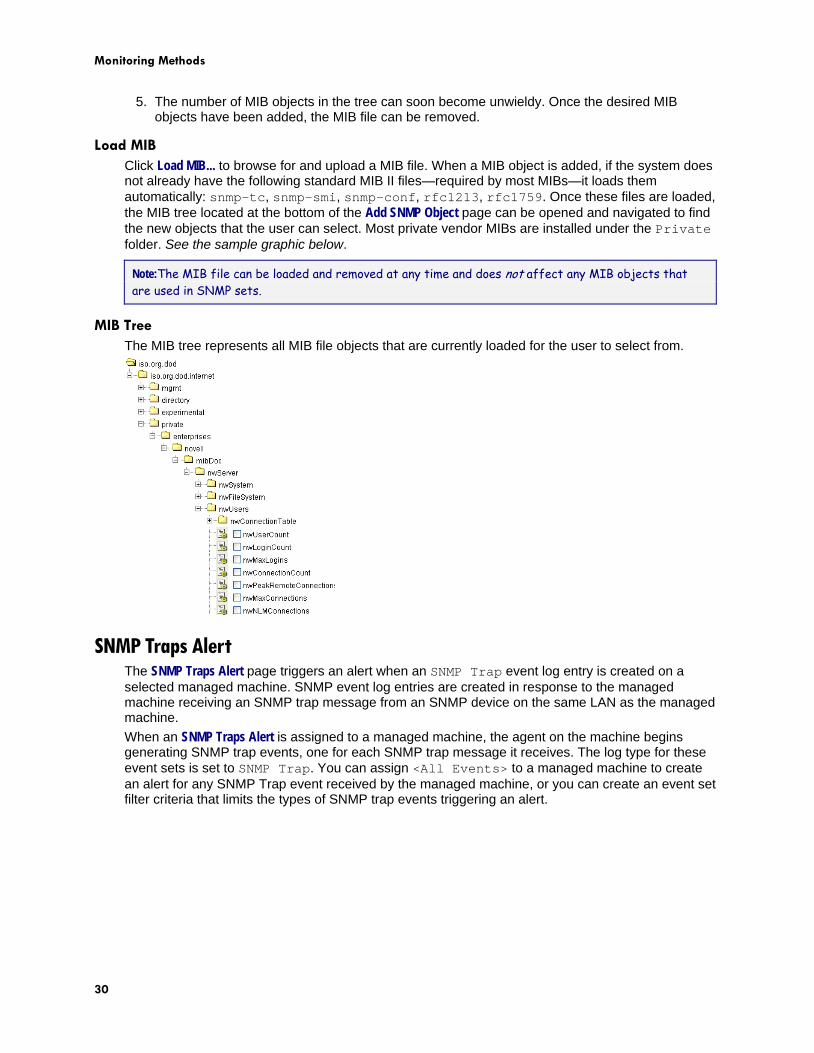
dependent files that need to be loaded first. The vendor may need to provide those also. 2. Click the expand icons in the MIB tree—see the sample graphic below—and find the desired
items to monitor. Select each corresponding check box. 3. Click Add MIB Objects to move the selected items from Step 2 into the MIB object list. 4. Configure the settings for monitoring the new SNMP object within an SNMP set as you normally
would.
Monitoring Methods
30
5. The number of MIB objects in the tree can soon become unwieldy. Once the desired MIB objects have been added, the MIB file can be removed.
Load MIB Click Load MIB... to browse for and upload a MIB file. When a MIB object is added, if the system does not already have the following standard MIB II files—required by most MIBs—it loads them automatically: snmp-tc, snmp-smi, snmp-conf, rfc1213, rfc1759. Once these files are loaded, the MIB tree located at the bottom of the Add SNMP Object page can be opened and navigated to find the new objects that the user can select. Most private vendor MIBs are installed under the Private folder. See the sample graphic below.
Note:The MIB file can be loaded and removed at any time and does not affect any MIB objects that are used in SNMP sets.
MIB Tree The MIB tree represents all MIB file objects that are currently loaded for the user to select from.
SNMP Traps Alert The SNMP Traps Alert page triggers an alert when an SNMP Trap event log entry is created on a selected managed machine. SNMP event log entries are created in response to the managed machine receiving an SNMP trap message from an SNMP device on the same LAN as the managed machine. When an SNMP Traps Alert is assigned to a managed machine, the agent on the machine begins generating SNMP trap events, one for each SNMP trap message it receives. The log type for these event sets is set to SNMP Trap. You can assign <All Events> to a managed machine to create an alert for any SNMP Trap event received by the managed machine, or you can create an event set filter criteria that limits the types of SNMP trap events triggering an alert.
Index
31
Index A Adding SNMP Objects • 29 Alarms • 4 Alerts • 12 Assigning Event Sets • 14 Assigning Monitor Sets • 22 Assigning SNMP Sets • 27 Auto Learn Monitor Sets • 23 Auto Learn SNMP Sets • 28
D Dashboard Views and Dashlets • 7 Defining Monitor Sets • 18
E Editing Event Sets • 15 Emails, Tickets, and Procedures • 8 Event Log Alerts • 13 Event Logs • 13
I Individualized Monitor Sets • 22 Individualized SNMP Sets • 28
L LAN Watch • 25
M Monitor Sets • 16, 17 Monitoring and Templates • 23 Monitoring Methods • 11
N Notification • 3
S Sample Event Sets • 14 Sample Monitor Sets • 17 Setting Counter Thresholds Manually - An Example •
20 SNMP Quick Sets • 25 SNMP Sets • 24 SNMP Traps Alert • 30 SNMP Types • 29 Standard SNMP Sets • 26 System Checks • 16