Embed Size (px)
Citation preview
Pig Production Focus on the Global market
5.October 2017
“It is about Pork choice”
2
SwineIndustry today...
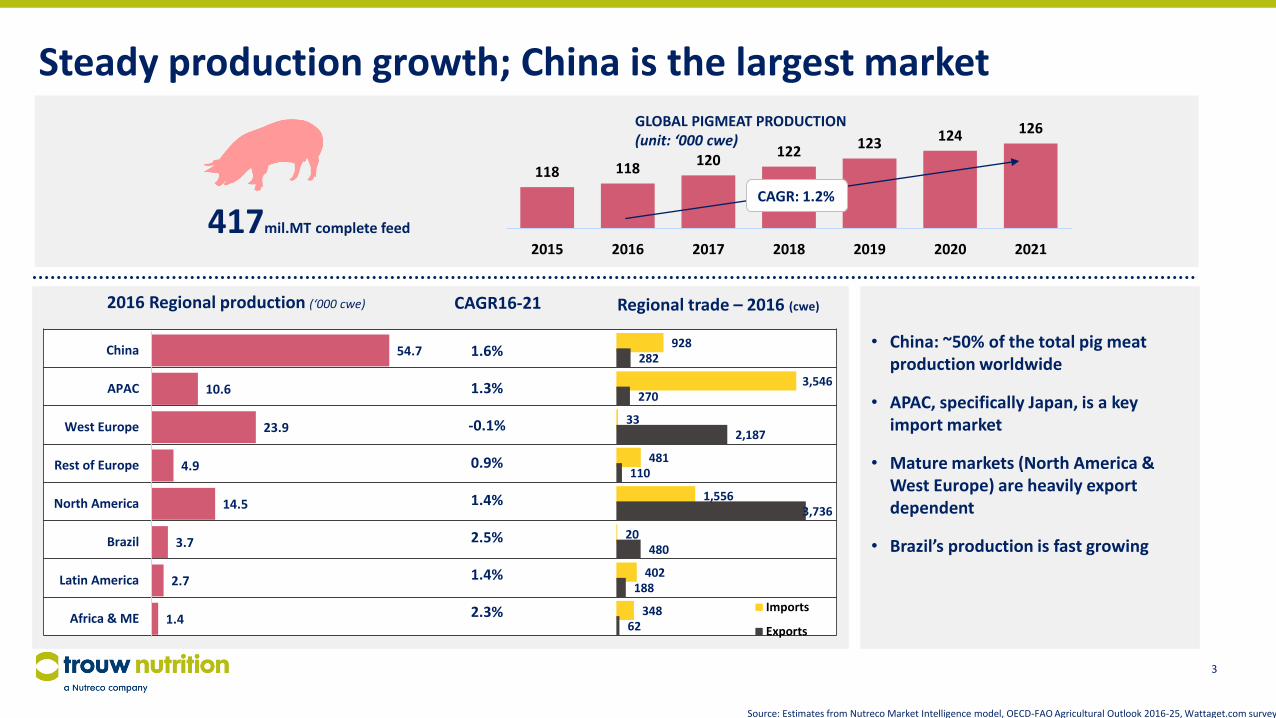
Regional trade – 2016 (cwe)
Steady production growth; China is the largest market
3
Source: Estimates from Nutreco Market Intelligence model, OECD-FAO Agricultural Outlook 2016-25, Wattaget.com survey
118 118120
122123 124 126
2015 2016 2017 2018 2019 2020 2021
GLOBAL PIGMEAT PRODUCTION (unit: ‘000 cwe)
CAGR: 1.2%
• China: ~50% of the total pig meat production worldwide
• APAC, specifically Japan, is a key import market
• Mature markets (North America & West Europe) are heavily export dependent
• Brazil’s production is fast growing
417mil.MT complete feed
54.7
10.6
23.9
4.9
14.5
3.7
2.7
1.4
China
APAC
West Europe
Rest of Europe
North America
Brazil
Latin America
Africa & ME
CAGR16-21
1.6%
1.3%
-0.1%
0.9%
1.4%
2.5%
1.4%
2.3%
928
3,546
33
481
1,556
20
402
348
282
270
2,187
110
3,736
480
188
62
Imports
Exports
2016 Regional production (‘000 cwe)
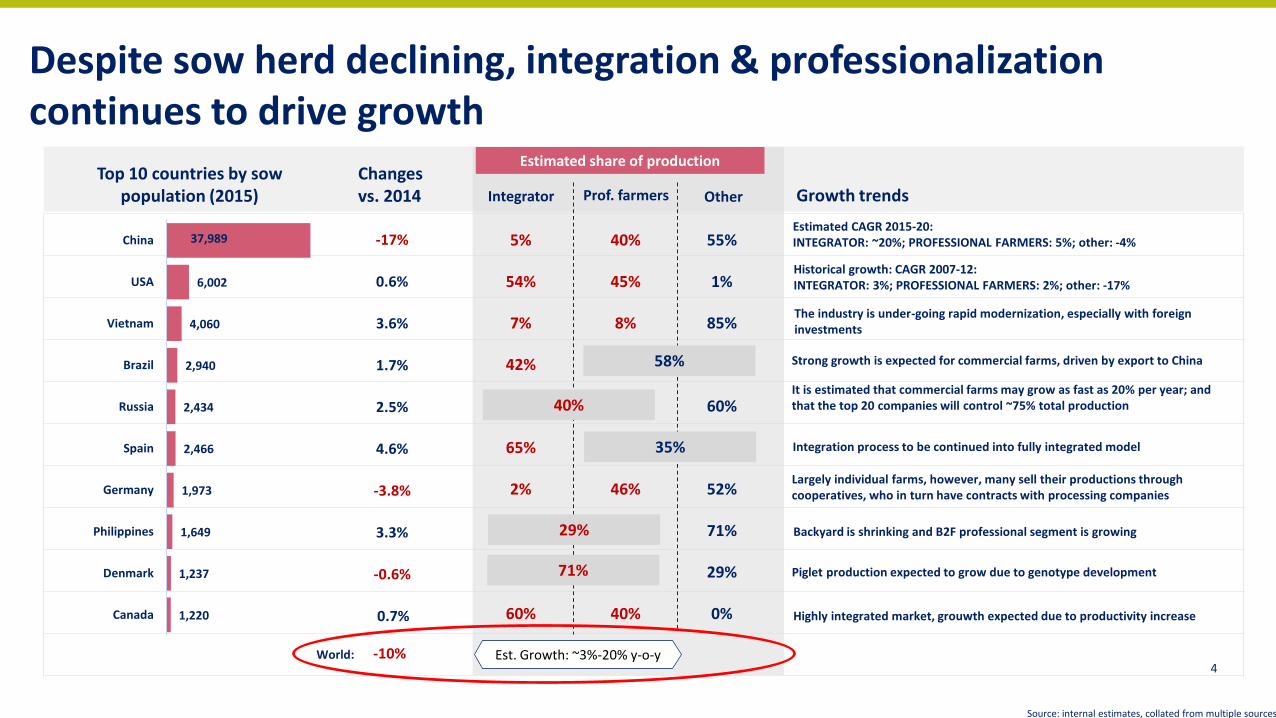
Despite sow herd declining, integration & professionalization continues to drive growth
4
Source: internal estimates, collated from multiple sources
37,989
6,002
4,060
2,940
2,434
2,466
1,973
1,649
1,237
1,220
China
USA
Vietnam
Brazil
Russia
Spain
Germany
Philippines
Denmark
Canada
Top 10 countries by sow population (2015)
-17%
Changes vs. 2014
0.6%
3.6%
1.7%
2.5%
4.6%
-3.8%
0.7%
3.3%
-0.6%
Growth trends
Estimated share of production
Integrator Prof. farmers Other
5%
54%
7%
42%
65%
2%
60%
40%
45%
8%
46%
40%
55%
1%
85%
60%
52%
71%
29%
0%
58%
40%
35%
29%
71%
Estimated CAGR 2015-20:INTEGRATOR: ~20%; PROFESSIONAL FARMERS: 5%; other: -4%
Historical growth: CAGR 2007-12:INTEGRATOR: 3%; PROFESSIONAL FARMERS: 2%; other: -17%
It is estimated that commercial farms may grow as fast as 20% per year; and that the top 20 companies will control ~75% total production
Largely individual farms, however, many sell their productions through cooperatives, who in turn have contracts with processing companies
The industry is under-going rapid modernization, especially with foreign investments
Strong growth is expected for commercial farms, driven by export to China
Integration process to be continued into fully integrated model
Piglet production expected to grow due to genotype development
Highly integrated market, grouwth expected due to productivity increase
Backyard is shrinking and B2F professional segment is growing
-10%World: Est. Growth: ~3%-20% y-o-y
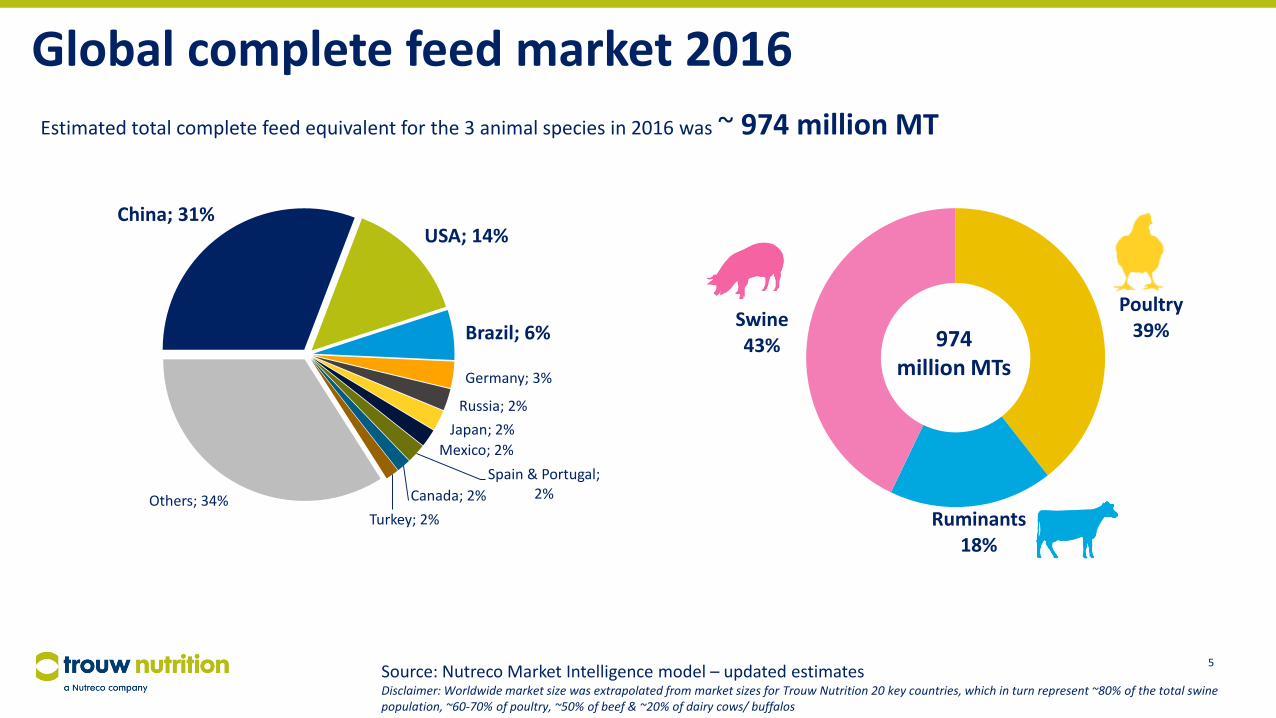
Global complete feed market 2016
China; 31%USA; 14%
Brazil; 6%
Germany; 3%
Russia; 2%
Japan; 2%
Mexico; 2%
Spain & Portugal; 2%Canada; 2%
Turkey; 2%Others; 34%
Source: Nutreco Market Intelligence model – updated estimatesDisclaimer: Worldwide market size was extrapolated from market sizes for Trouw Nutrition 20 key countries, which in turn represent ~80% of the total swine population, ~60-70% of poultry, ~50% of beef & ~20% of dairy cows/ buffalos
Poultry39%
Ruminants18%
Swine43%
Estimated total complete feed equivalent for the 3 animal species in 2016 was ~ 974 million MT
5
974million MTs
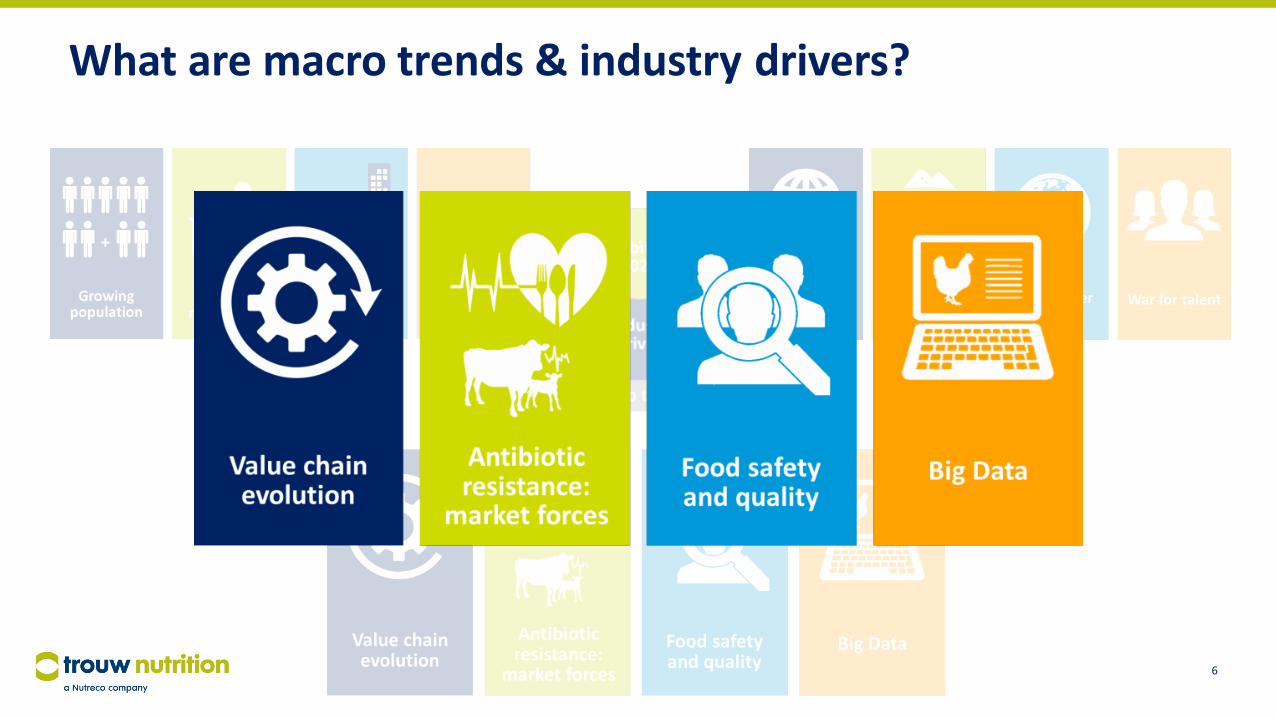
What are macro trends & industry drivers?
6
1. Macro trends-
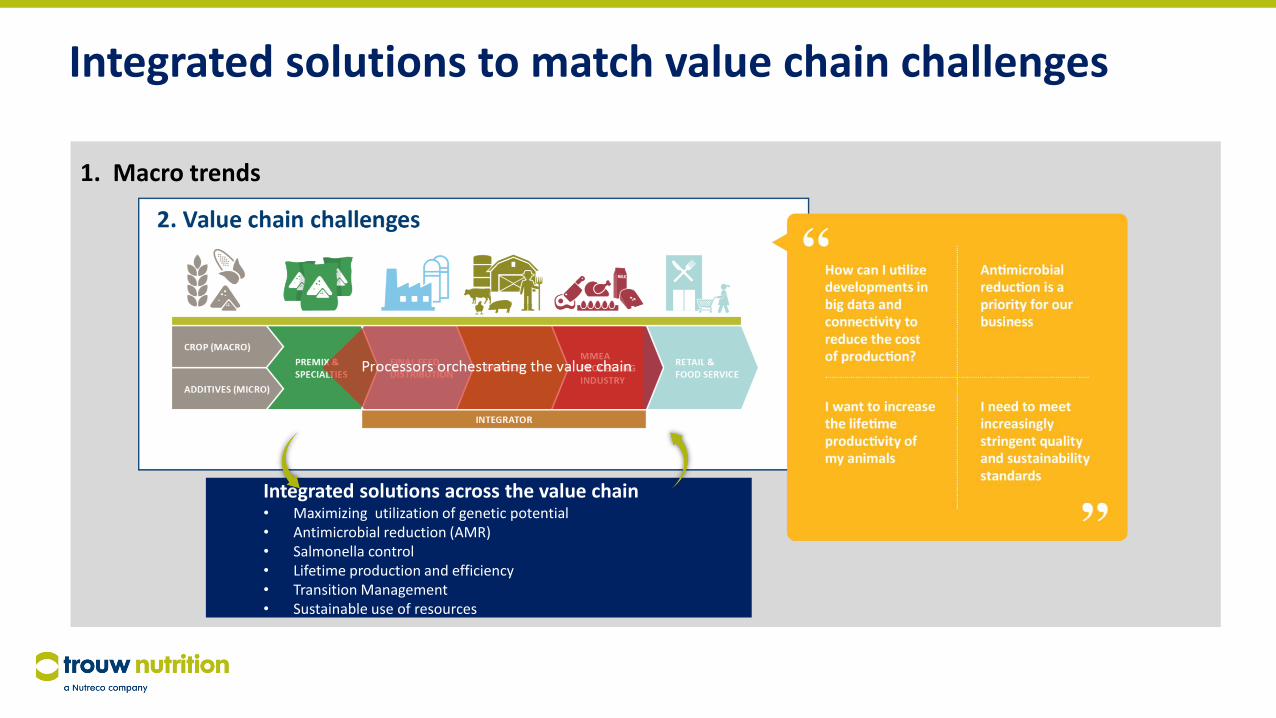
Integrated solutions to match value chain challenges
Integrated solutions across the value chain• Maximizing utilization of genetic potential• Antimicrobial reduction (AMR)• Salmonella control• Lifetime production and efficiency• Transition Management• Sustainable use of resources
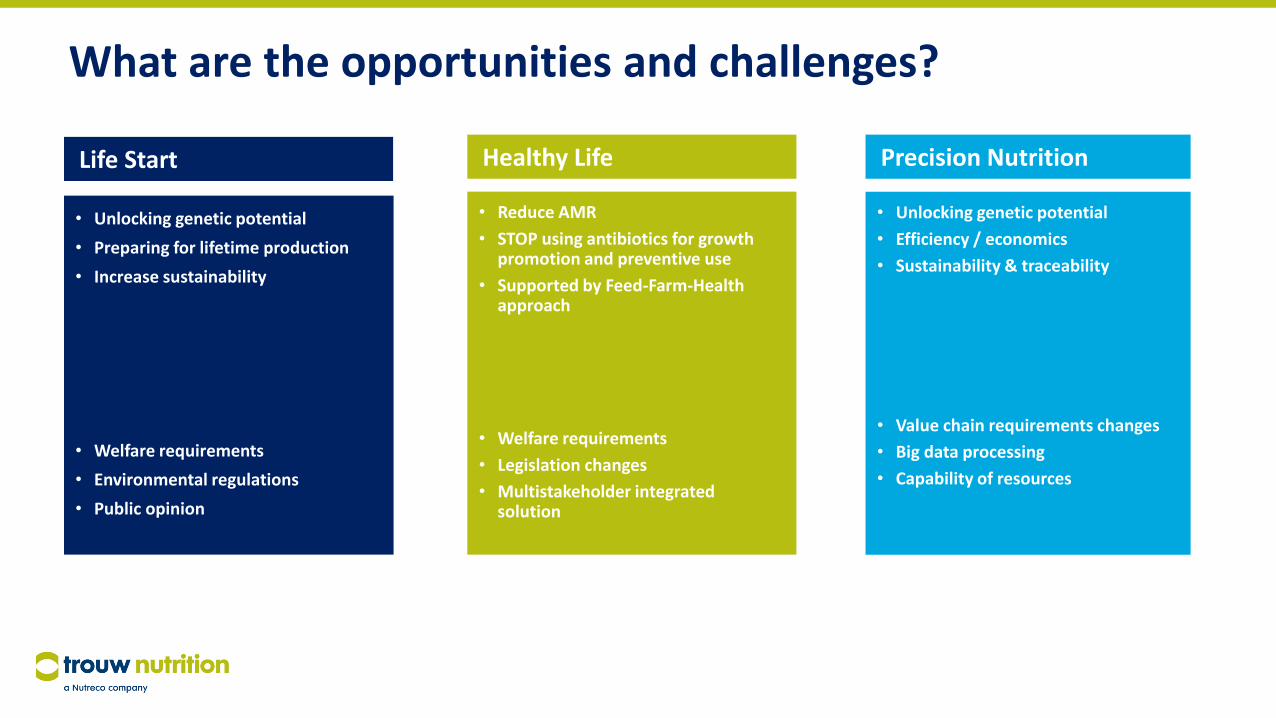
What are the opportunities and challenges?
• Unlocking genetic potential
• Efficiency / economics
• Sustainability & traceability
• Value chain requirements changes
• Big data processing
• Capability of resources
• Unlocking genetic potential
• Preparing for lifetime production
• Increase sustainability
• Welfare requirements
• Environmental regulations
• Public opinion
• Reduce AMR
• STOP using antibiotics for growth promotion and preventive use
• Supported by Feed-Farm-Health approach
• Welfare requirements
• Legislation changes
• Multistakeholder integrated solution
Life Start Healthy Life Precision Nutrition
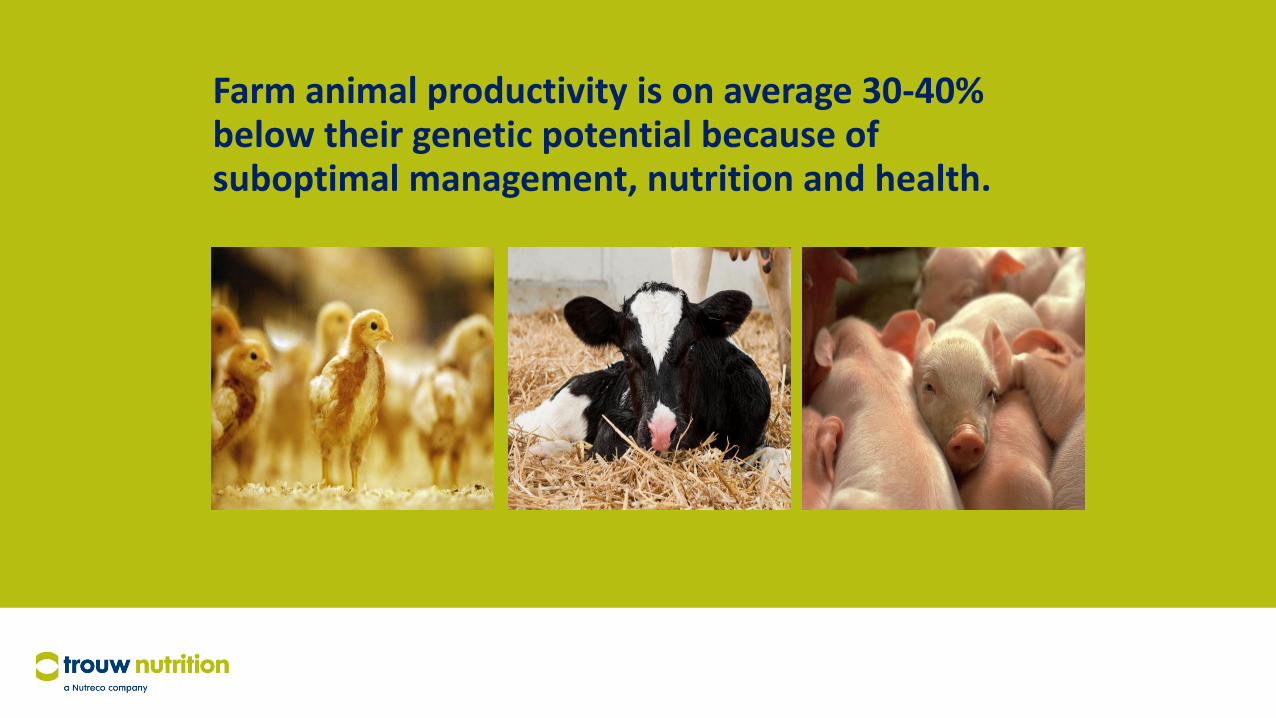
Farm animal productivity is on average 30-40% below their genetic potential because of suboptimal management, nutrition and health.
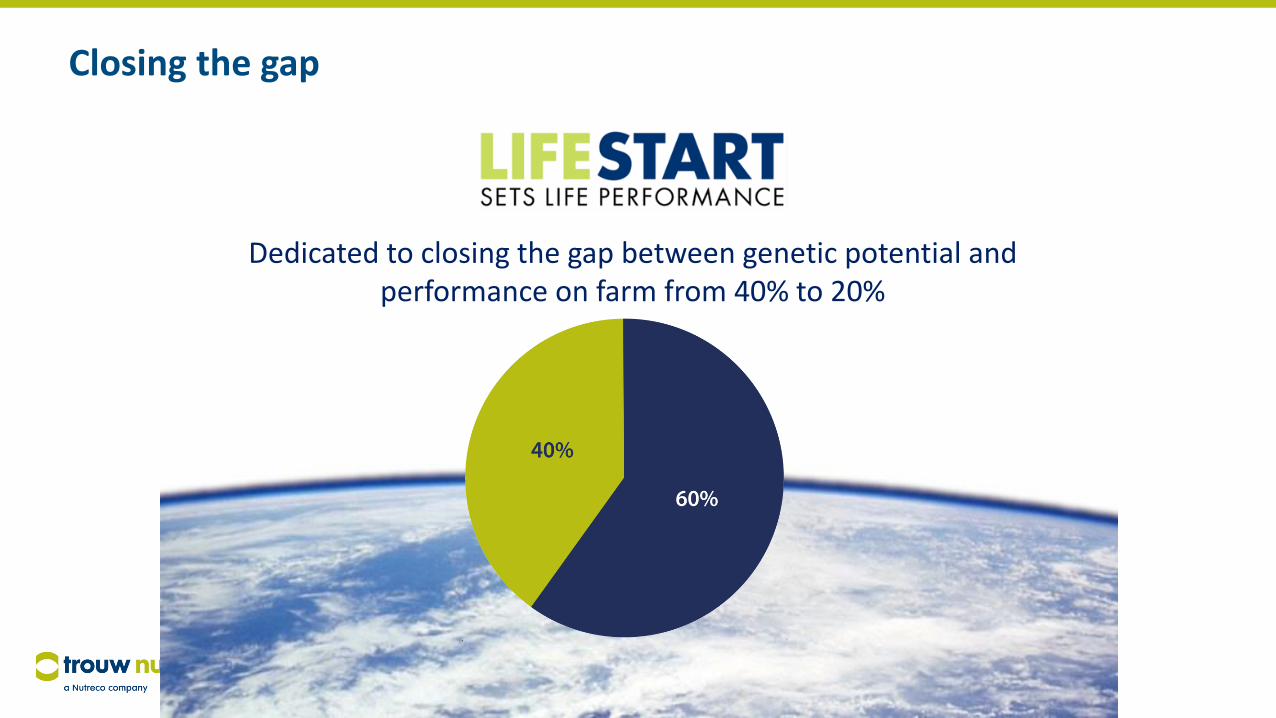
Closing the gap
Dedicated to closing the gap between genetic potential and performance on farm from 40% to 20%
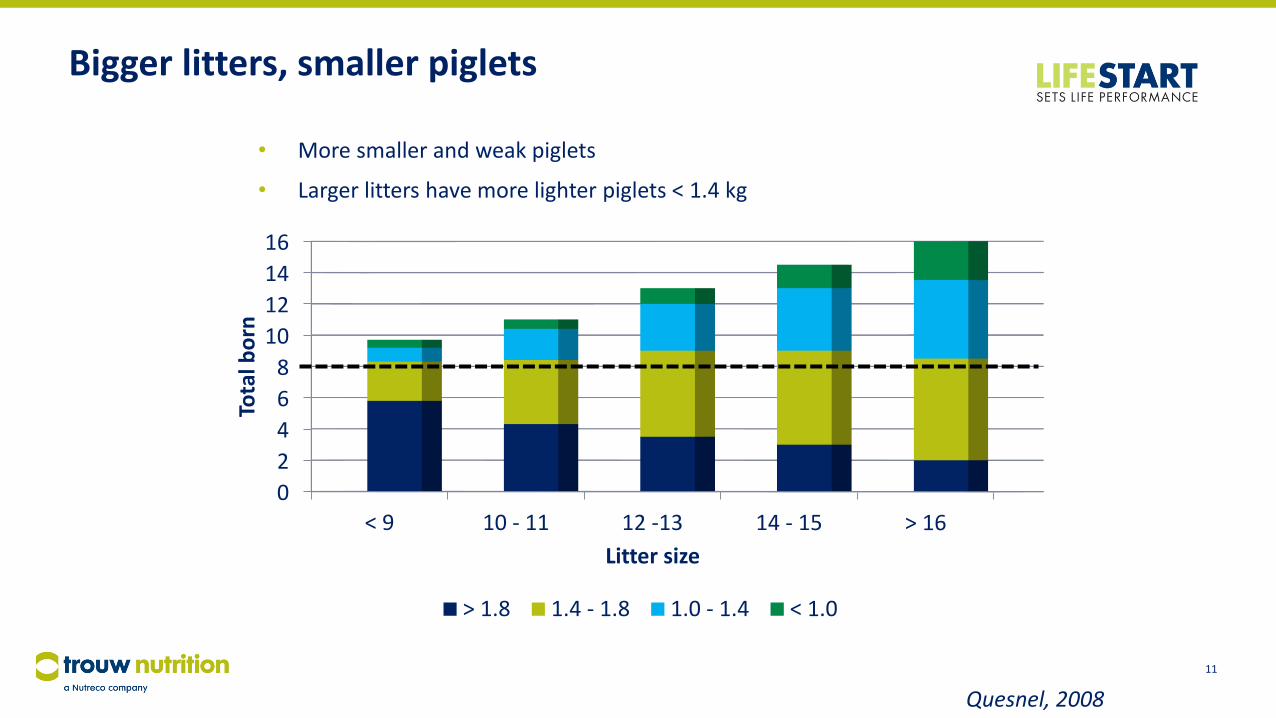
Bigger litters, smaller piglets
0
2
4
6
8
10
12
14
16
< 9 10 - 11 12 -13 14 - 15 > 16
Tota
l bo
rn
Litter size
> 1.8 1.4 - 1.8 1.0 - 1.4 < 1.0
11
• More smaller and weak piglets
• Larger litters have more lighter piglets < 1.4 kg
Quesnel, 2008
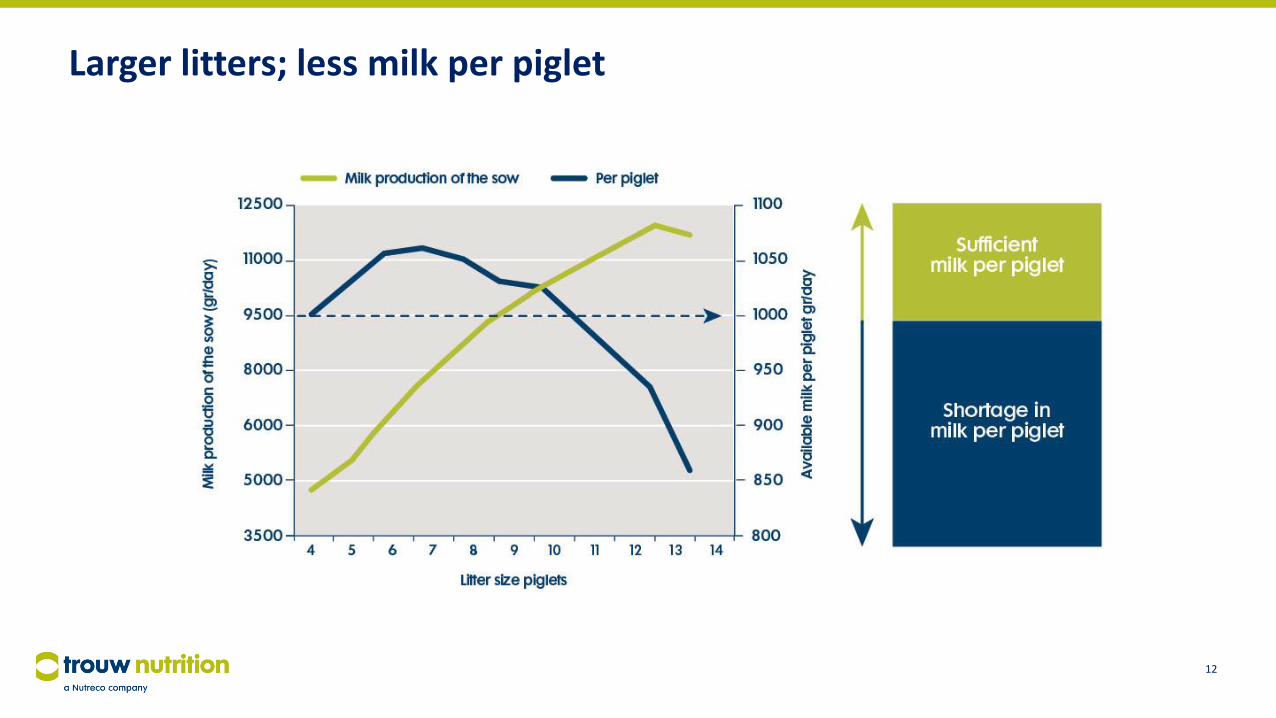
Larger litters; less milk per piglet
12
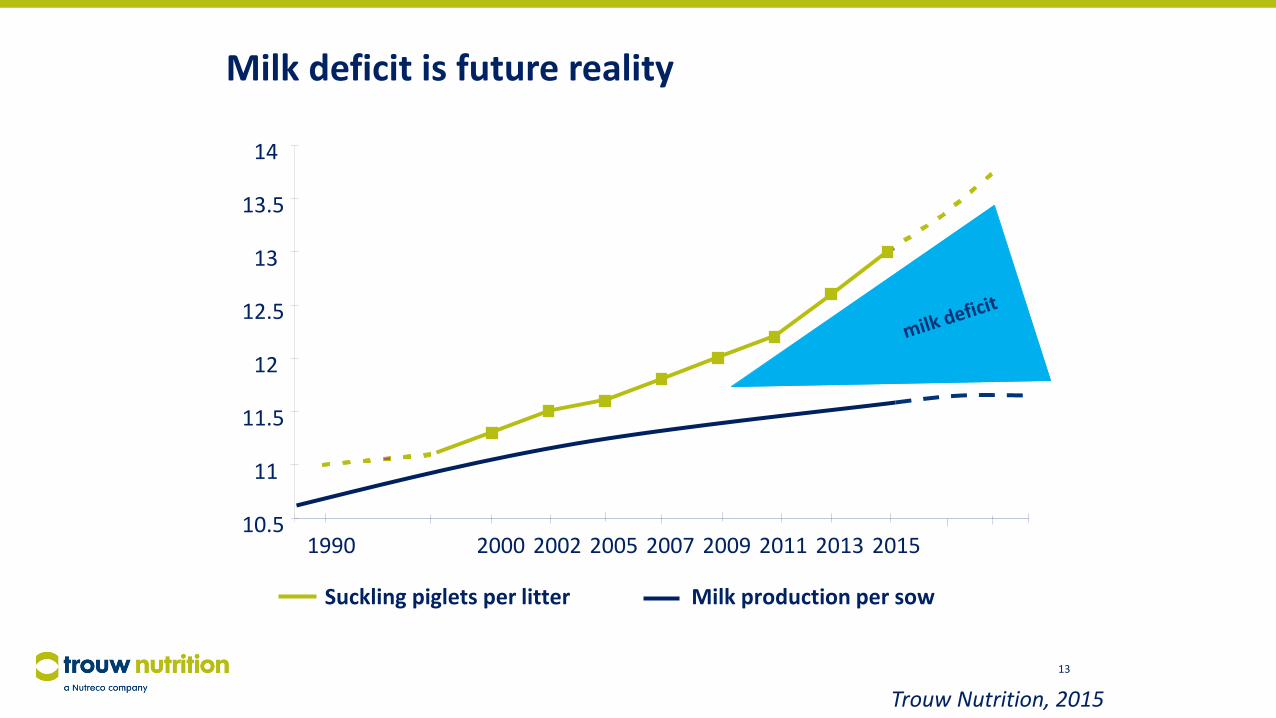
Milk deficit is future reality
13
10.5
11
11.5
12
12.5
13
13.5
14
1990 2000 2002 2005 2007 2009 2011 2013 2015
Milk production per sow
Trouw Nutrition, 2015
Suckling piglets per litter
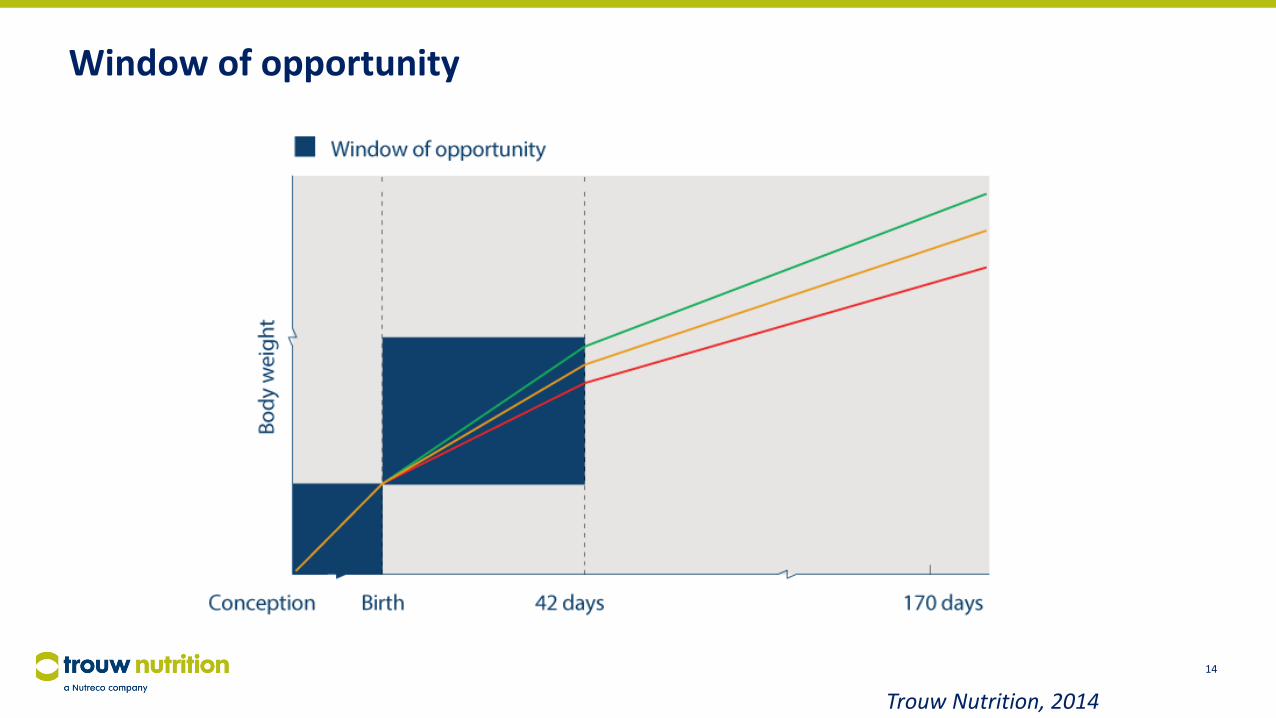
Window of opportunity
14
Trouw Nutrition, 2014
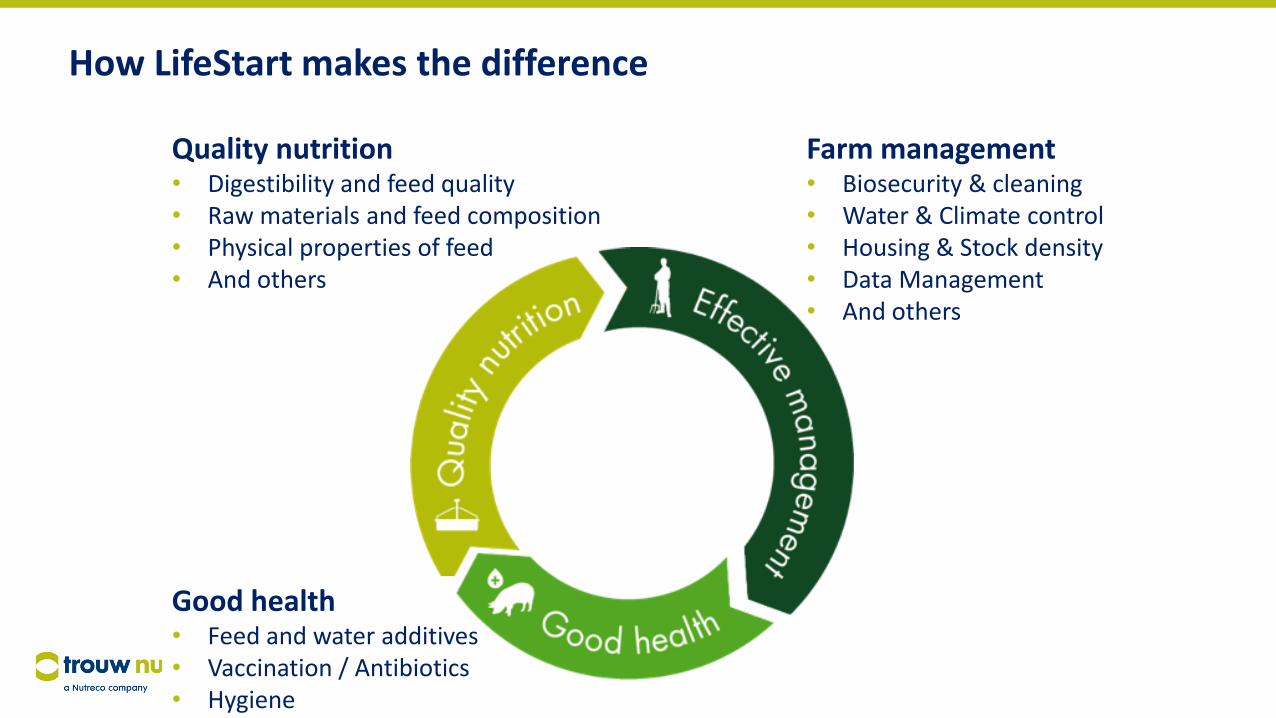
Farm management• Biosecurity & cleaning • Water & Climate control • Housing & Stock density • Data Management• And others
Quality nutrition• Digestibility and feed quality • Raw materials and feed composition• Physical properties of feed• And others
How LifeStart makes the difference
Good health• Feed and water additives • Vaccination / Antibiotics• Hygiene
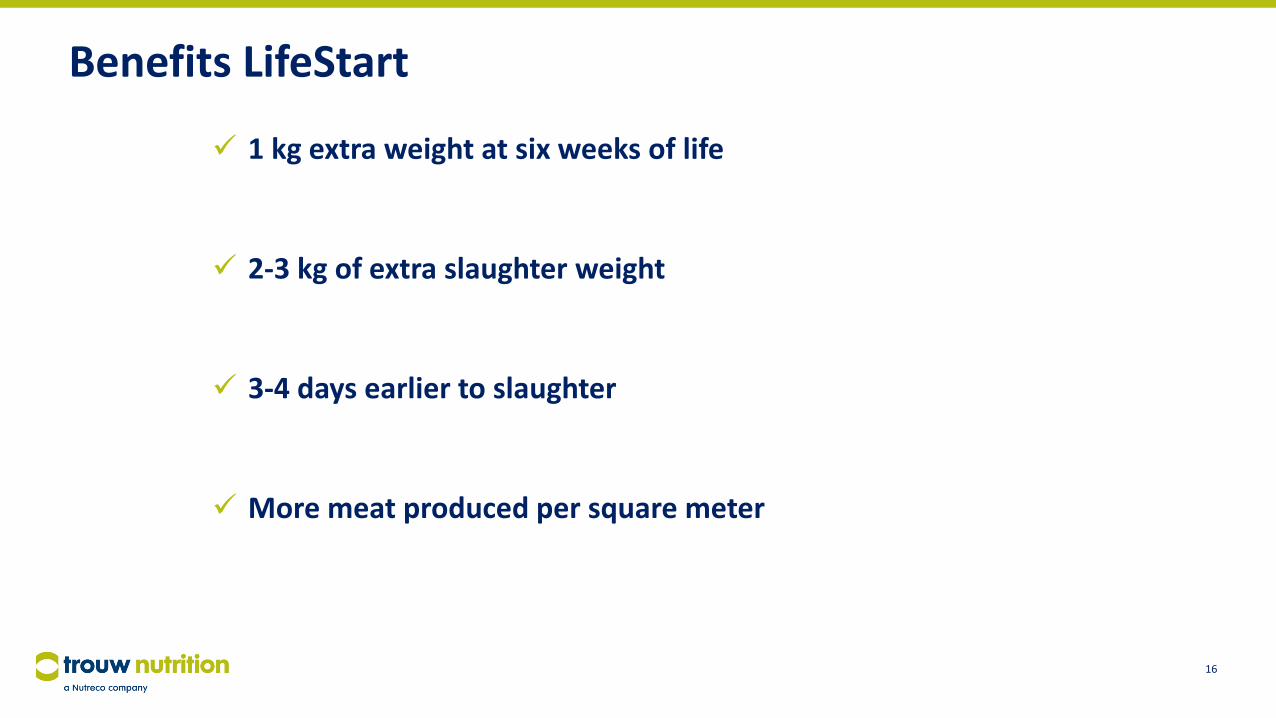
Benefits LifeStart
1 kg extra weight at six weeks of life
2-3 kg of extra slaughter weight
3-4 days earlier to slaughter
More meat produced per square meter
16
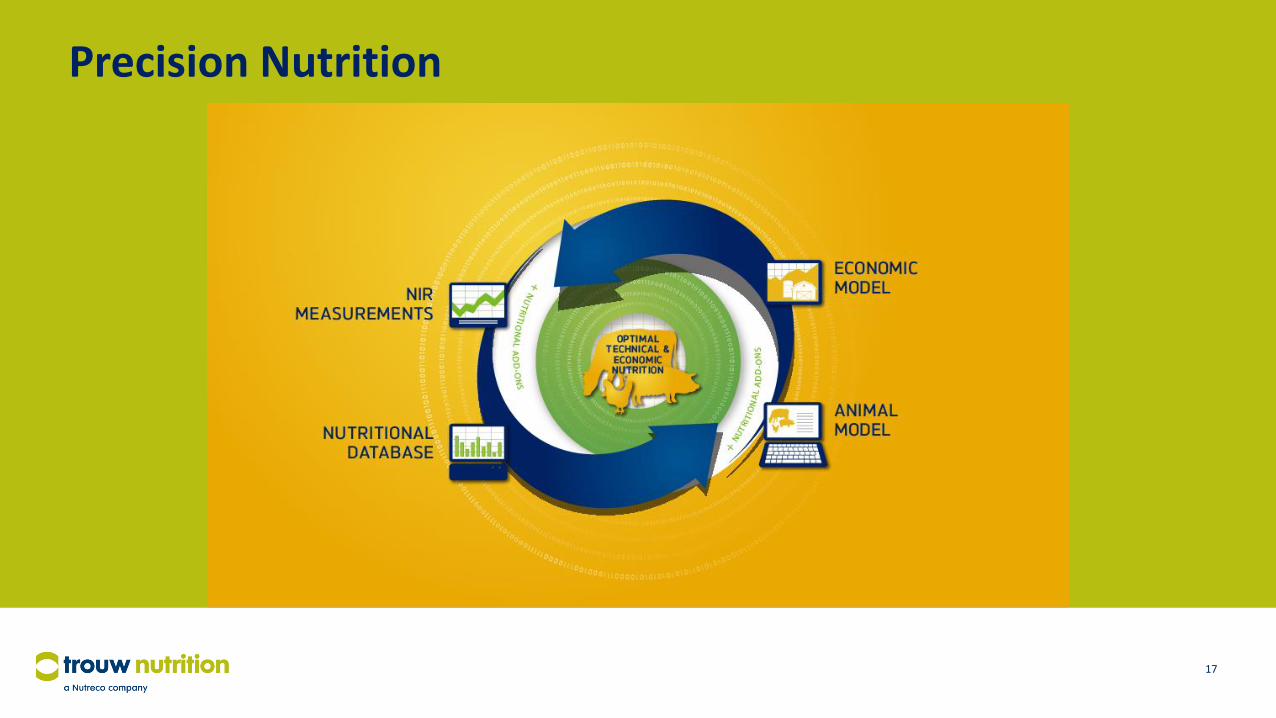
Precision Nutrition
17
Feeding strategy for Sows
The NutriOpt Sow model is a flexible, user friendly tool to
optimize feed management in order to achieve longevity
of high prolific sows in a predictable way.
18
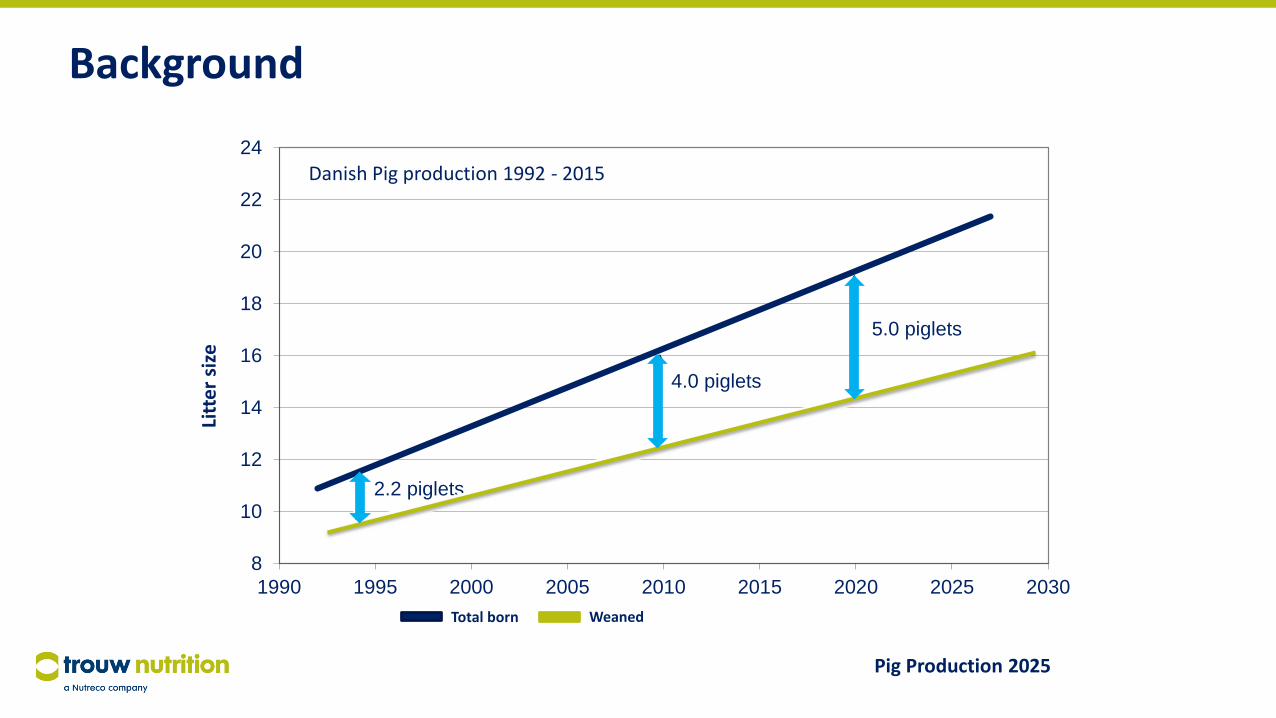
Background
Pig Production 2025
8
10
12
14
16
18
20
22
24
1990 1995 2000 2005 2010 2015 2020 2025 2030
Litter size
Total born Weaned
5.0 piglets
4.0 piglets
2.2 piglets
Danish Pig Production 1992 - 2015
Total born Weaned
Litt
er
size
Danish Pig production 1992 - 2015
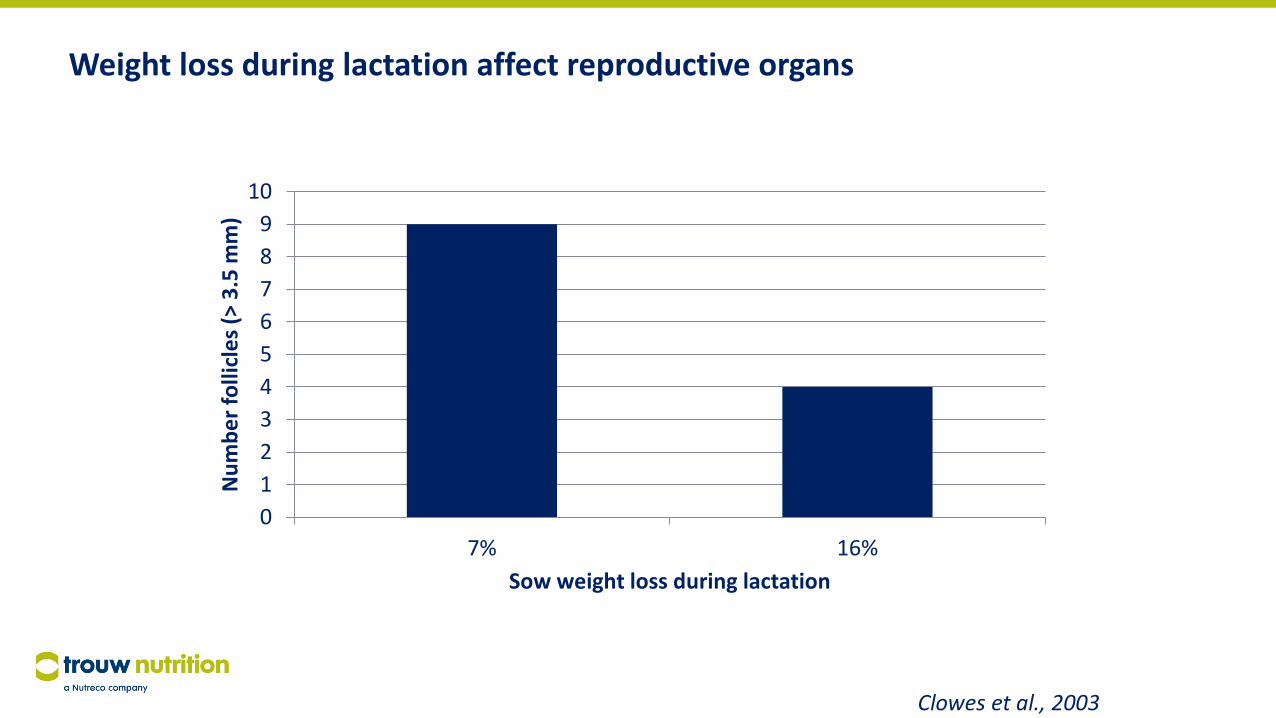
Weight loss during lactation affect reproductive organs
0
1
2
3
4
5
6
7
8
9
10
7% 16%
Nu
mb
er
folli
cle
s (>
3.5
mm
)
Sow weight loss during lactation
Clowes et al., 2003
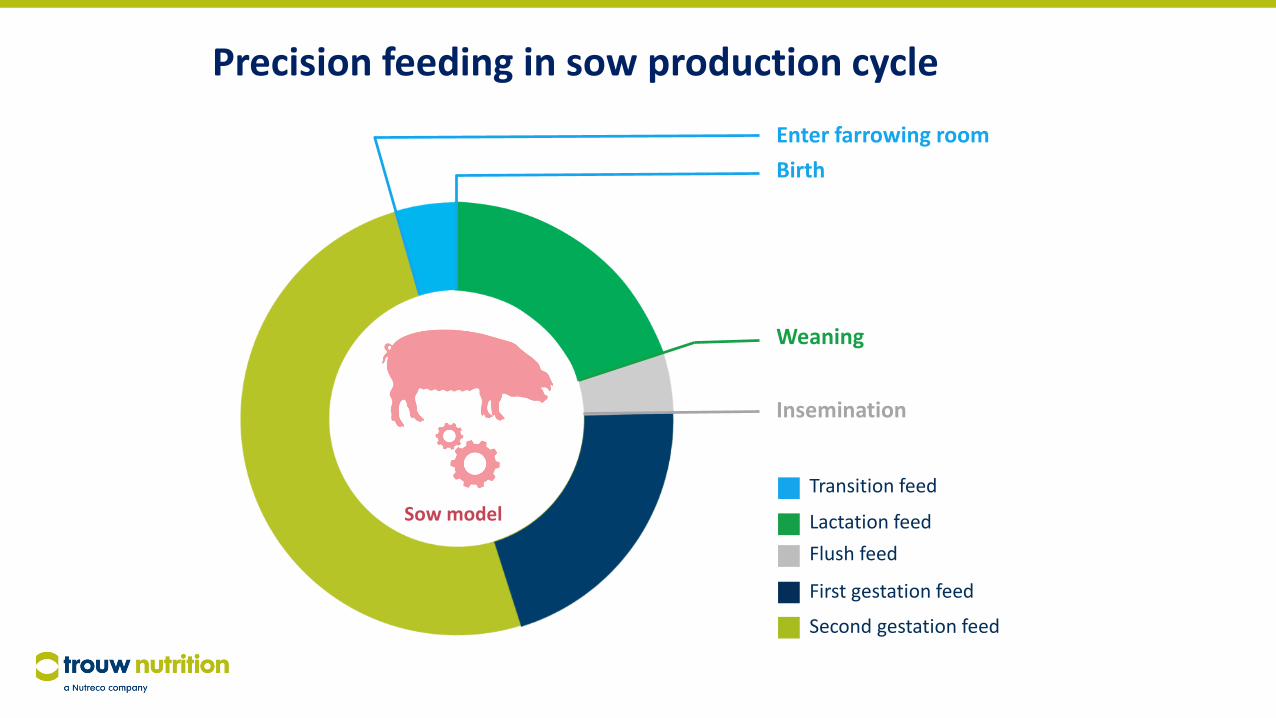
Transition feed
First gestation feed
Lactation feed
Second gestation feed
Enter farrowing room
Birth
Weaning
Insemination
Precision feeding in sow production cycle
Flush feed
Sow model
Benefits of Sow Model
€ 3.0 - € 6.0 per sow per year due to
Reduced gilt replacement costs
Better sow condition management leads to a reduced culling rate
Increased litter size
Reduction of body weight loss in previous lactation leads to more piglets per litter
Lower feed costs
- Lower percentage of fat sows
- Blending diets during gestation
22
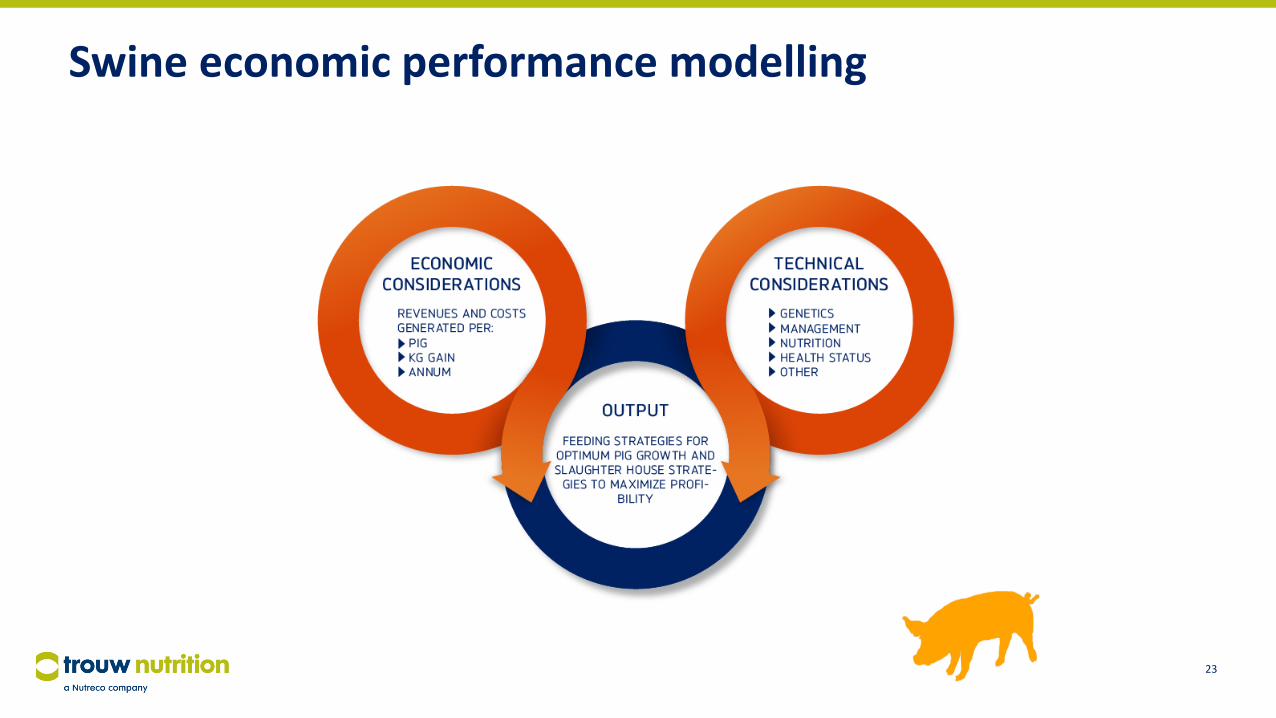
Swine economic performance modelling
23
Swine model
Management support trough real time modelling
Guides management decisions
● improves profitability
● no need for a costly trial-and-error process.
Real time modelling - enables you to react rapidly to changing
● commodity prices
● pork prices, slaughter house grids
● health changes
● Genetics
Herd and shipping management
24
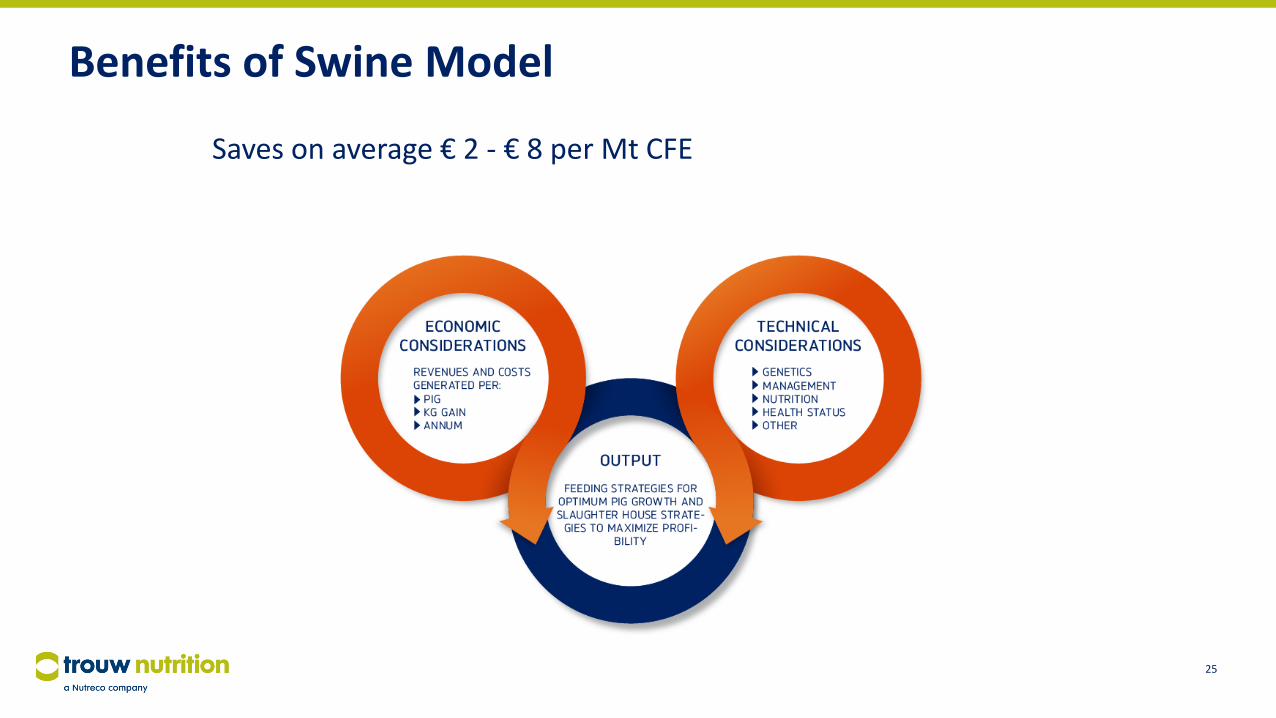
Benefits of Swine Model
Saves on average € 2 - € 8 per Mt CFE
25
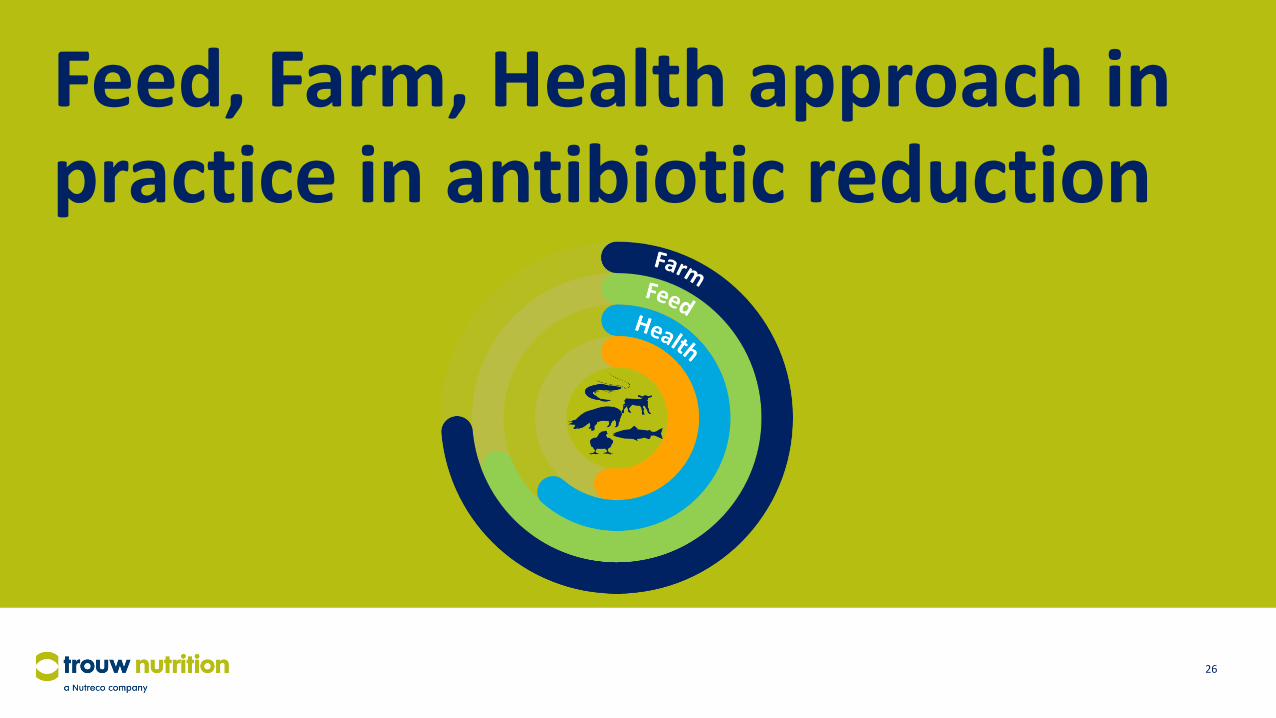
Feed, Farm, Health approach in practice in antibiotic reduction
26
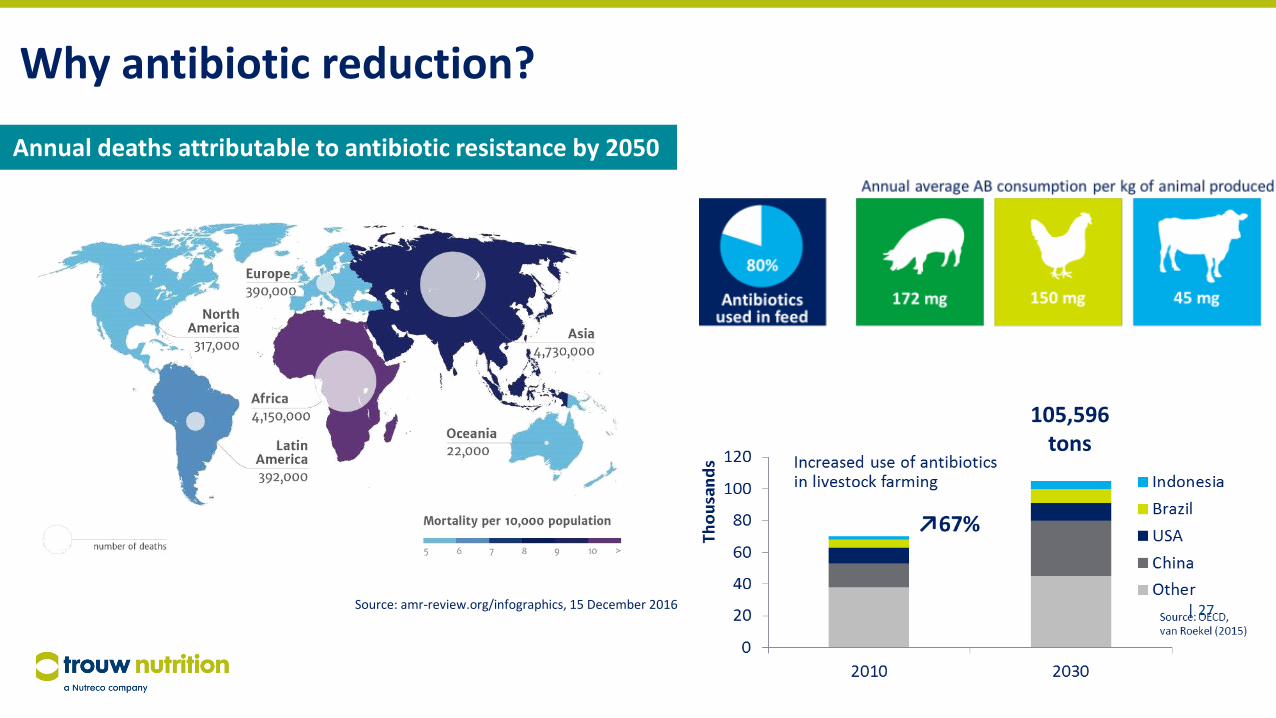
Why antibiotic reduction?
Source: amr-review.org/infographics, 15 December 2016
Annual deaths attributable to antibiotic resistance by 2050
| 27
105,596tons
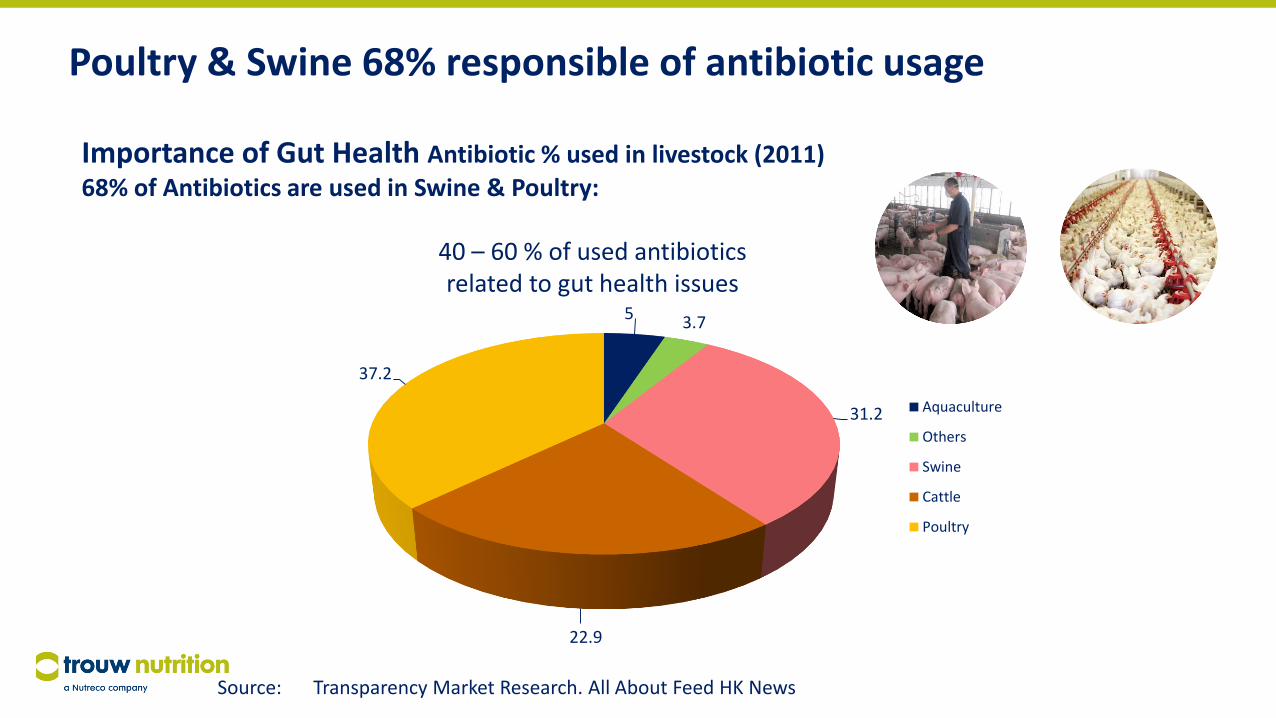
Poultry & Swine 68% responsible of antibiotic usage
Source: Transparency Market Research. All About Feed HK News
5 3.7
31.2
22.9
37.2
Aquaculture
Others
Swine
Cattle
Poultry
Importance of Gut Health Antibiotic % used in livestock (2011)
68% of Antibiotics are used in Swine & Poultry:
40 – 60 % of used antibioticsrelated to gut health issues
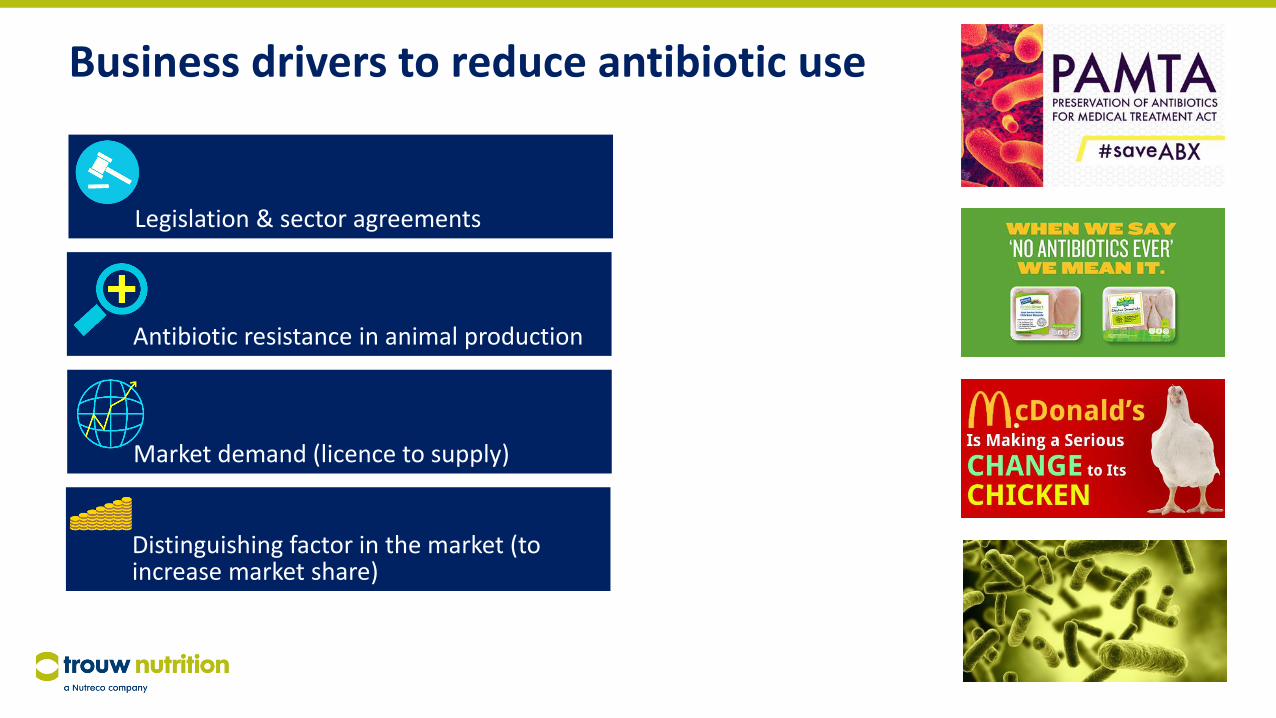
Business drivers to reduce antibiotic use
29
Legislation & sector agreements
Antibiotic resistance in animal production
Market demand (licence to supply)
Distinguishing factor in the market (to increase market share)
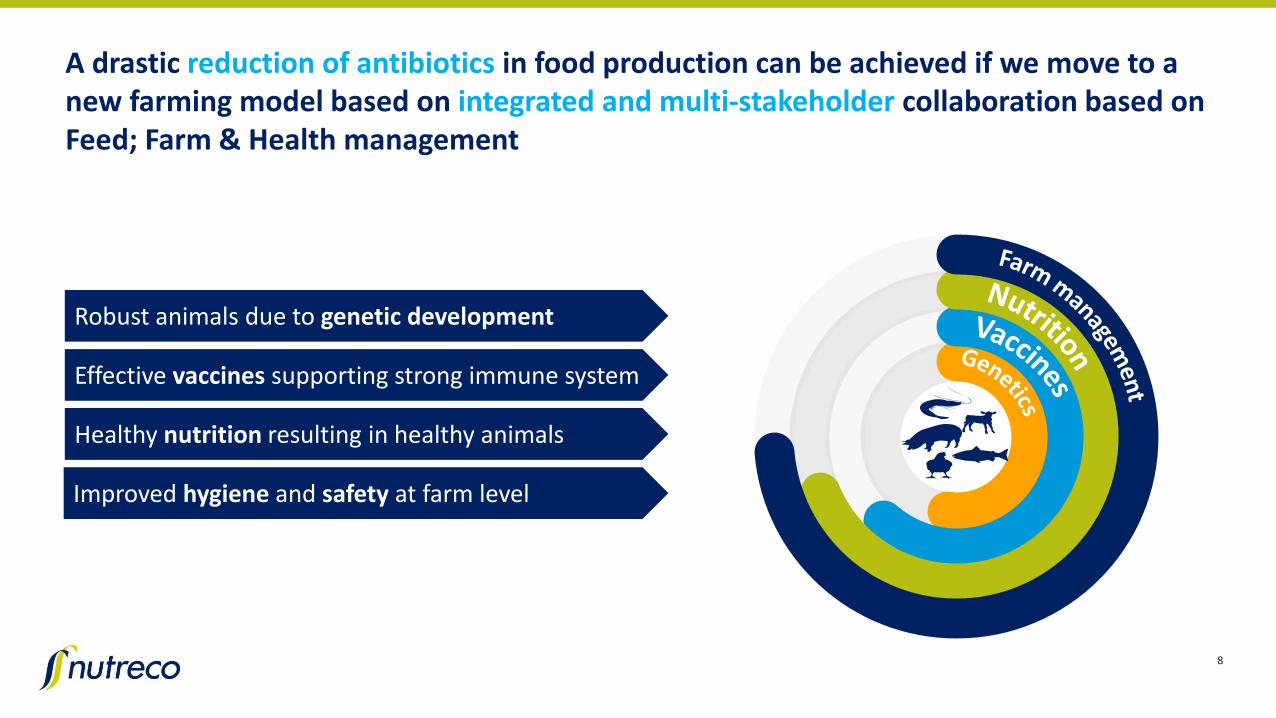
A drastic reduction of antibiotics in food production can be achieved if we move to a new farming model based on integrated and multi-stakeholder collaboration based on Feed; Farm & Health management
8
Robust animals due to genetic development
Effective vaccines supporting strong immune system
Healthy nutrition resulting in healthy animals
Improved hygiene and safety at farm level
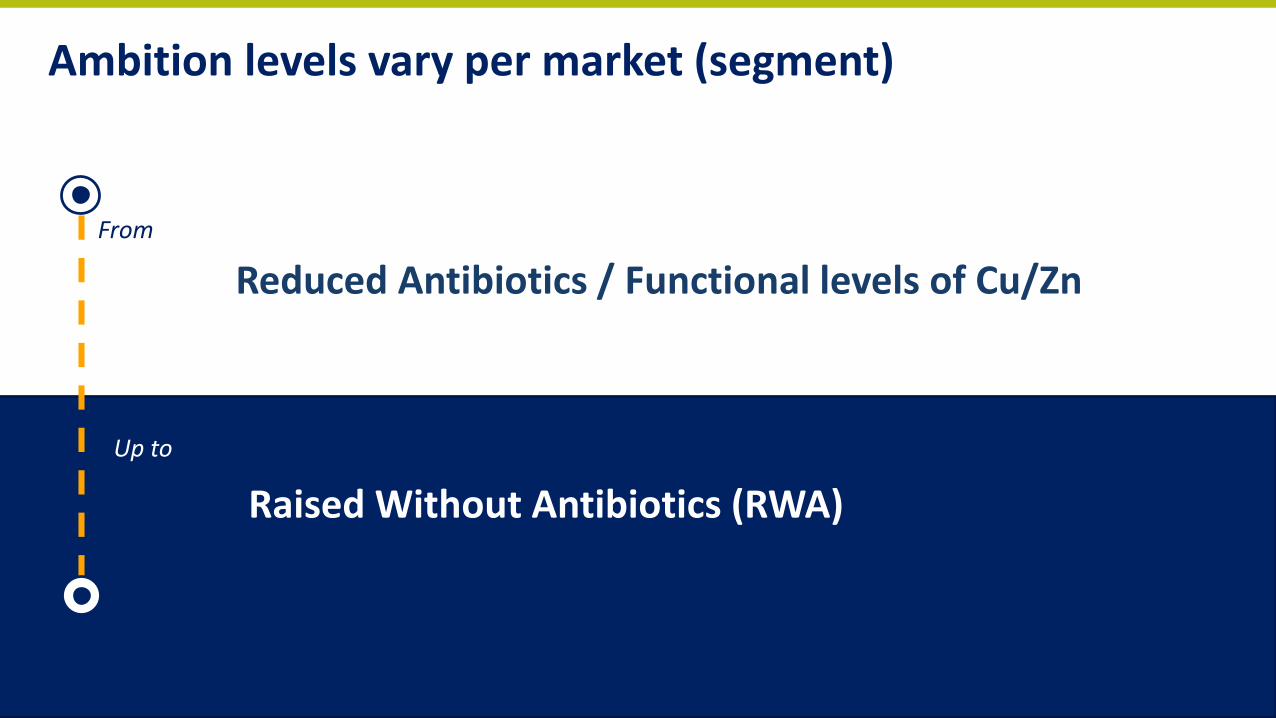
Reduced Antibiotics / Functional levels of Cu/Zn
Ambition levels vary per market (segment)
13
Raised Without Antibiotics (RWA)
From
Up to
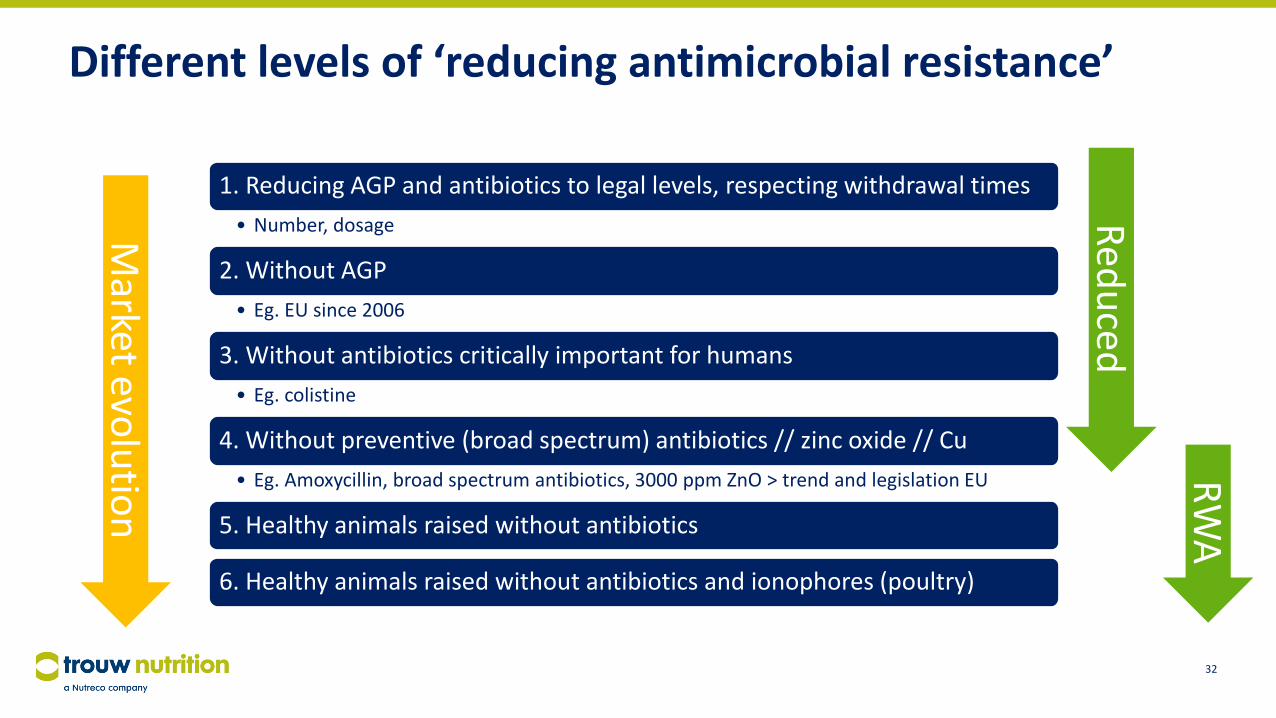
Different levels of ‘reducing antimicrobial resistance’
32
1. Reducing AGP and antibiotics to legal levels, respecting withdrawal times
• Number, dosage
2. Without AGP
• Eg. EU since 2006
3. Without antibiotics critically important for humans
• Eg. colistine
4. Without preventive (broad spectrum) antibiotics // zinc oxide // Cu
• Eg. Amoxycillin, broad spectrum antibiotics, 3000 ppm ZnO > trend and legislation EU
5. Healthy animals raised without antibiotics
6. Healthy animals raised without antibiotics and ionophores (poultry)
Market evo
lutio
n
Red
uced
RW
A
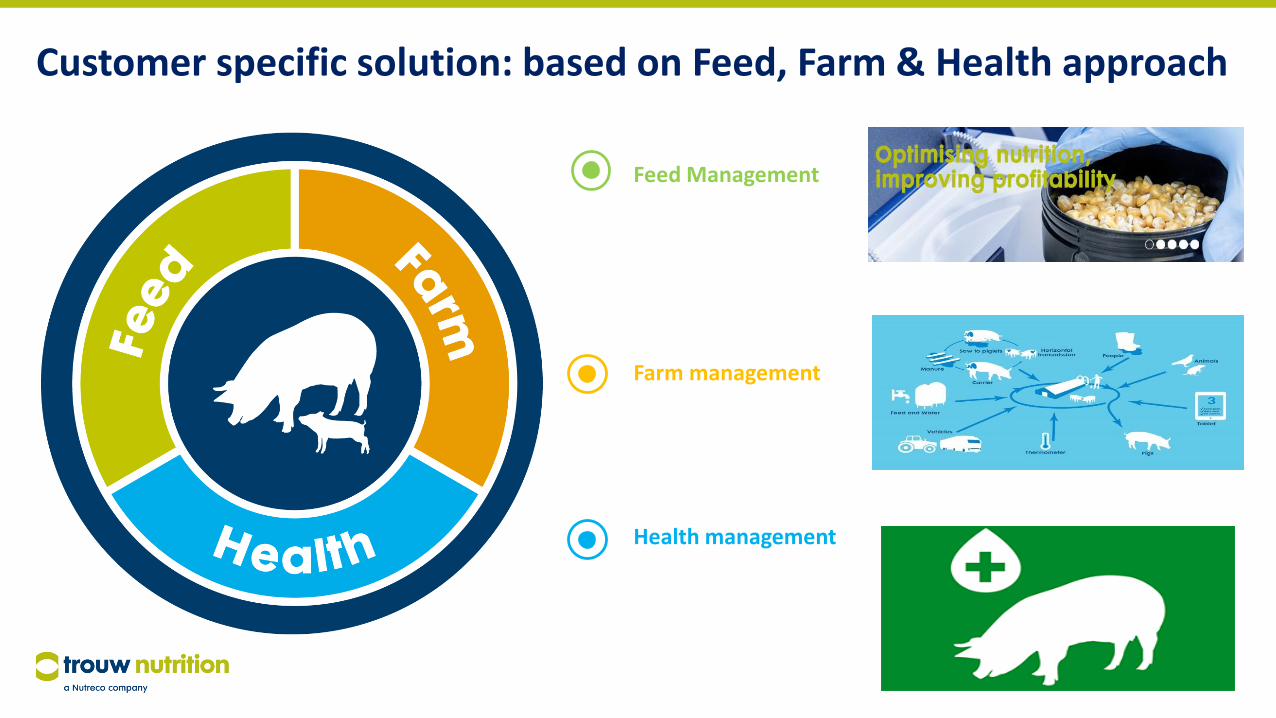
Farm management
Health management
Feed Management
Customer specific solution: based on Feed, Farm & Health approach
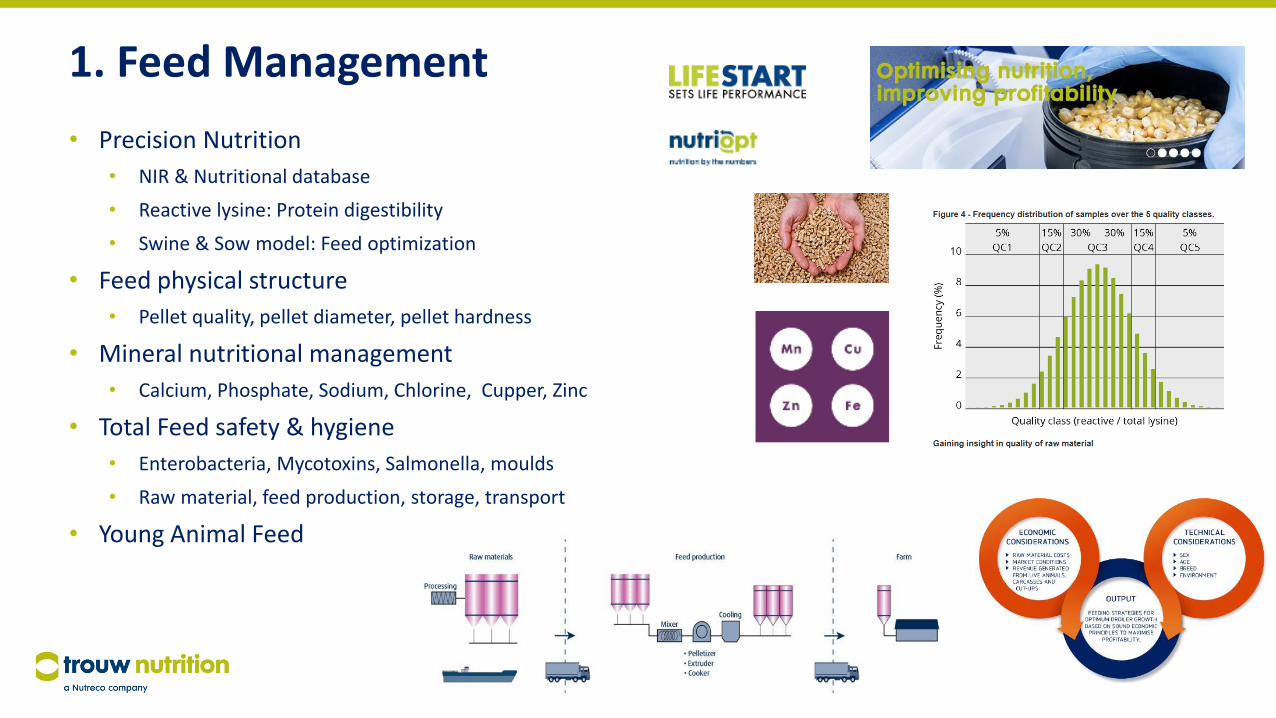
1. Feed Management
• Precision Nutrition
• NIR & Nutritional database
• Reactive lysine: Protein digestibility
• Swine & Sow model: Feed optimization
• Feed physical structure
• Pellet quality, pellet diameter, pellet hardness
• Mineral nutritional management
• Calcium, Phosphate, Sodium, Chlorine, Cupper, Zinc
• Total Feed safety & hygiene
• Enterobacteria, Mycotoxins, Salmonella, moulds
• Raw material, feed production, storage, transport
• Young Animal Feed
34
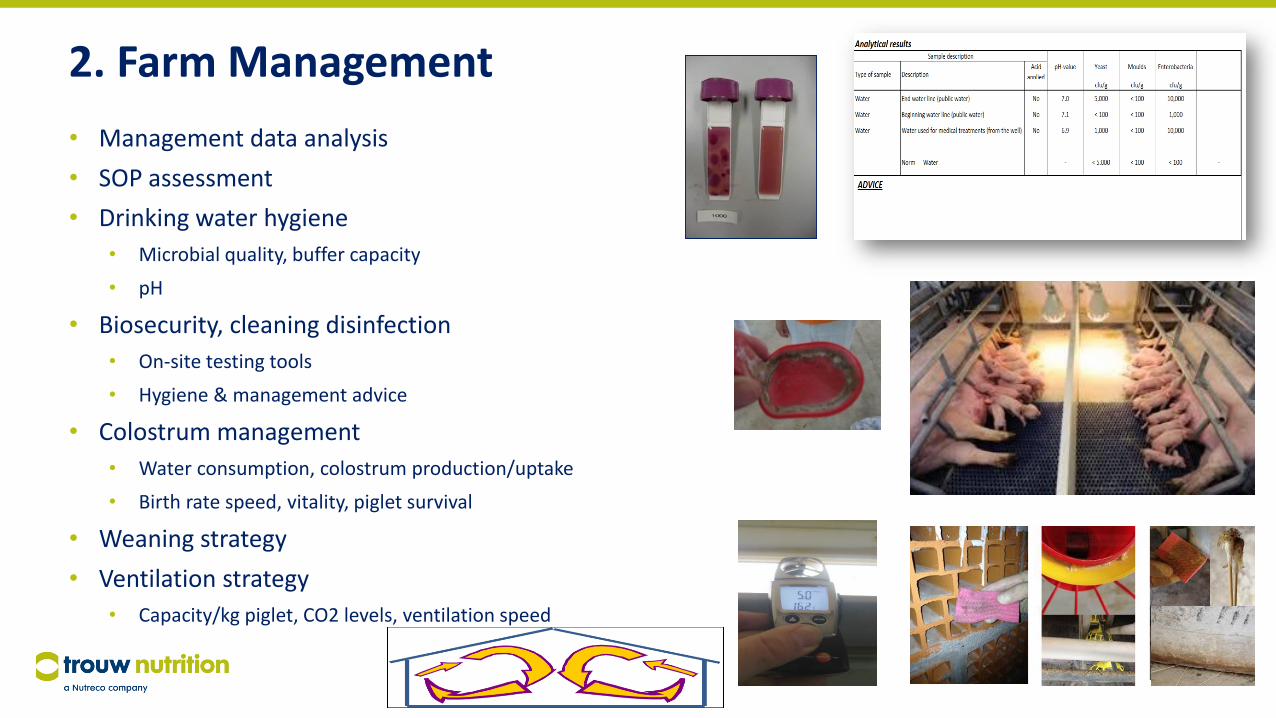
2. Farm Management
• Management data analysis
• SOP assessment
• Drinking water hygiene
• Microbial quality, buffer capacity
• pH
• Biosecurity, cleaning disinfection
• On-site testing tools
• Hygiene & management advice
• Colostrum management
• Water consumption, colostrum production/uptake
• Birth rate speed, vitality, piglet survival
• Weaning strategy
• Ventilation strategy
• Capacity/kg piglet, CO2 levels, ventilation speed
35
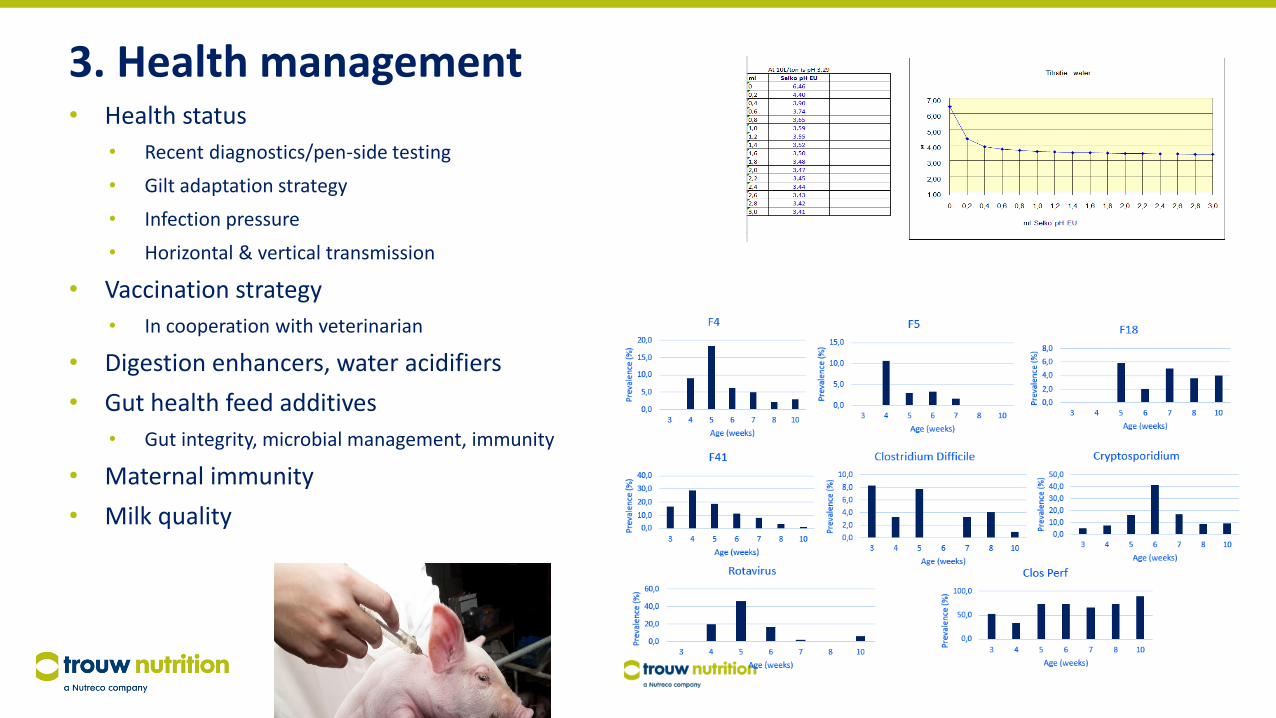
3. Health management• Health status
• Recent diagnostics/pen-side testing
• Gilt adaptation strategy
• Infection pressure
• Horizontal & vertical transmission
• Vaccination strategy
• In cooperation with veterinarian
• Digestion enhancers, water acidifiers
• Gut health feed additives
• Gut integrity, microbial management, immunity
• Maternal immunity
• Milk quality
36
• LifeStart sets life performance
• Precision nutrition improves profitability and financial benefits
• Antibiotic use reduction with no negative effect on optimal growth and lifetime performance
37
Creating more value together
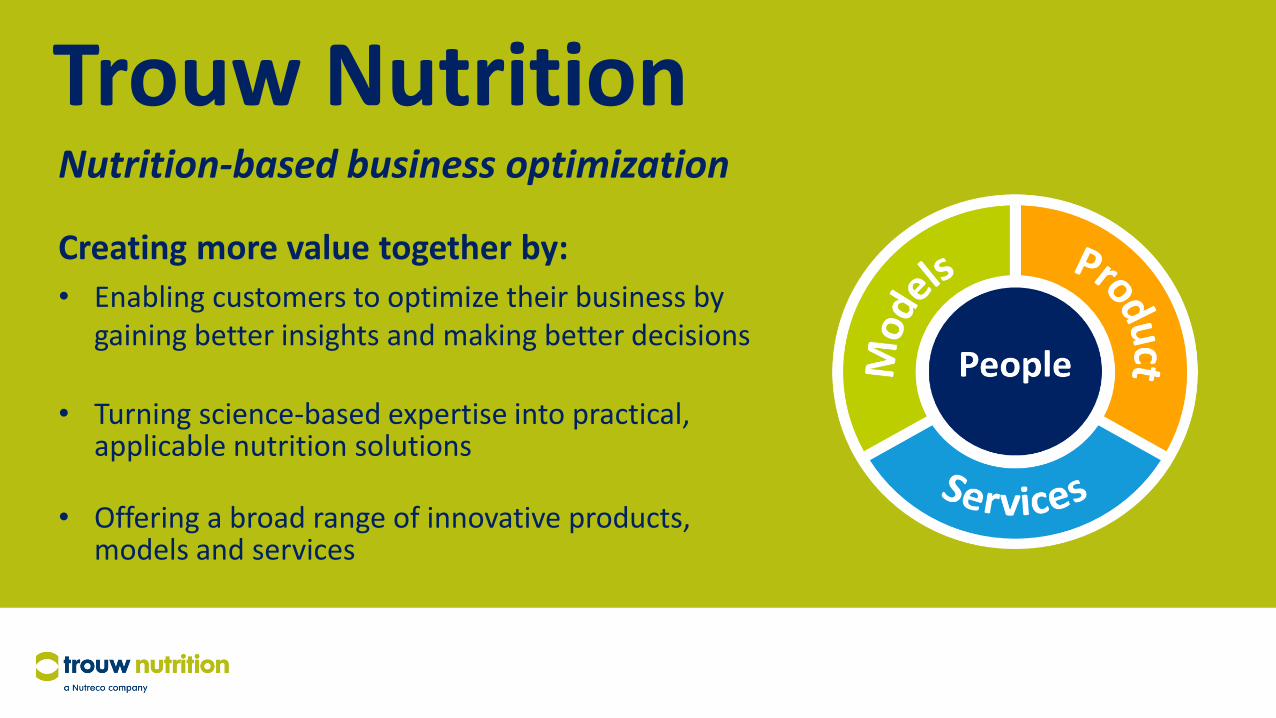
Trouw NutritionNutrition-based business optimization
Creating more value together by:
• Enabling customers to optimize their business by gaining better insights and making better decisions
• Turning science-based expertise into practical, applicable nutrition solutions
• Offering a broad range of innovative products, models and services
Thank you
39