Embed Size (px)
Citation preview

CWE Price Zone Study Taskforce Study of existing cases and preparation of the
qualitative analysis
- PZS TF initiation report for CWE Regulators -
Version 1.0
Date 25 May 2012
Status Draft Final
Document creation and distribution
Document Owner PZS TF
Function PZS TF initiation report to CWE Regulators
File location
Distribution AG, JSC, TF, Statnett, SvK, PSE-O
Approval
Version Date Name Function Signature
1.0 25052012 Study of existing cases and preparation of the qualitative analysis
PZS TF initiation report to CWE Regulators
CWE JSC
Previous versions
Version Date Author Summary of changes
Related documents
Attachments

Disclaimer:
This report is not an indication for further steps or further studies.

CWE Price Zone Study TF – Study of existing cases and preparation of the qualitative analysis
3
Executive summary
The CWE Price Zone Study Task Force (PZS TF) was installed by the CWE JSC (Joint Steering Committee, chaired by a
CWE TSO and CWE PX representative) on December 9, 2011. A combined TSO/NRA working group (hereafter called
AG- Advisory Group) has met on 25 October 2011 to kick-off the work, where they defined the general objective of the
study:
Analysis of current zones in CWE and, if judged necessary, a revision of zones boundaries, taking into account important
criteria for the market, especially the maximization of social welfare as the overall goal.
The study is split up in three parts:
Initiation phase
Qualitative analysis
Quantitative analysis
This report is the deliverable of the first phase, the initiation phase, of the TF. Main objective of this initiation phase
was to gather materials, studies, and experiences, such in order to establish a proper basis for the qualitative analysis
and possibly a quantitative analysis (if needed).
The following reports have been studied by the TF:
Relevance of established national bidding areas for European power market integration – an approach to
welfare oriented evaluation, October 2011, Frontier Economics and Consentec
BNetzA case (Germany/Austria)
Impact of a German/Austrian market splitting on the transmission grid of Austrian Power Grid (APG) and
critical lines in Germany, Poland and Czech Republic, 20 September 2011, RWTH Aachen University, IAEW
(Institut für Elektrische Anlagen und Energiewirtschaft)
APG case (Germany/Austria)
The economic consequences of capacity limitations on the Oresund connection, 11 December 2006,
Copenhagen Economics
Energinet.dk case (Denmark/Sweden)
Congestion Management in the Nordic Market - evaluation of different market models, May 2008, Ea Energy
Analyses, Hagman Energy and COWI
Nordic Council of Ministers case (Nordic)
In addition interviews were organized with TSOs that applied a zonal delineation within their country (Statnett
(Norway) and Svenska Kraftnät (Sweden)), and a TSO that is implementing a nodal energy market in its country (PSE-O,
Poland).
We have started this study from a common understanding on the bidding zone delineation issue comprising the
following elements:
The delineation of bidding zones is one method of congestion management among other measures
There are different systems of zone delineations in Europe and the world
European regulation foresees that when assessing bidding zones, TSO should take account of overall market
efficiency and shall base the analysis on costs of redispatch/countertrade as well as structural congestion
The flows in an AC power system fan out in accordance to Kirchoff’s laws, as such loop flows are inevitable as
they follow the law of physics
Loop flows can have both a restraining as well as a relieving effect on the grid
We have found these elements represented in some way in each of the cases. However, none of the studies in general
covered all congestions relevant for our study (CWE plus neighbouring areas). This will be taken care of in our
qualitative analysis.

CWE Price Zone Study TF – Study of existing cases and preparation of the qualitative analysis
4
From our analysis we have also learned that the function of a market split in managing congestions was not fully
covered in any case study. Two major learning points that will be taken into account in our next phase are:
A market split can bring exchanges, which cause substantial loop flows, within the scope of capacity allocation
In a grid with substantial loop flows, a market split alone is not sufficient to allocate capacity to the relevant
exchanges in an efficient way; it must be combined with a coordinated flow-based capacity calculation and
market coupling to guarantee an efficient allocation.
From the case studies as well as the interviews, we have identified the general function of a market split as follows. A
market split makes additional exchanges subject to an allocation mechanism.
The reasons to apply a market split, and to make additional exchanges subject to an allocation mechanism, that we
have identified so far are in order to:
1. manage inner-country congestions, by applying the split at the place of the congestion
2. manage congestions that are expected in the future, due to shortage of energy stock
3. manage a congestion in a bidding area caused by loop flows, by applying a market split in a neighbouring
bidding area at the path of the exchange (not used up to now)
Especially the latter one received more attention in this report, as this one is not currently applied, and has not been
(satisfactorily) addressed in the case studies.
Application of the third function of market split requires extensive assessment and potentially also coordination over
the whole congestion management chain beyond the scope of CWE alone.
Also, the European regulation is examined which foresees that when assessing bidding zones, TSOs should take
account of overall market efficiency and shall base the analysis on costs of redispatch/countertrade as well as
structural congestion. In this regard, the occurrence of loop flows is not the only factor in the analysis of current zone
delineation but an important issue to consider.
We do realize that this initiation report is not exhaustive. Indeed, there are many ways to deal with congestions. There
are different time frames (long term, day ahead, intraday, balancing, settlement), different actors, different methods,
active and passive measures that all together describe the complete picture. It is however not the objective of this
report to provide and analyse this complete picture. Indeed, the main objective of this initiation phase was to gather
materials, studies, and experiences, such in order to establish a proper basis for the qualitative analysis.
An outlook to the qualitative phase concludes this report.
The CWE PZS TF would like to thank the interviewed TSOs, Statnett (Norway), Svenska Kraftnät (Sweden), and PSE-O
(Poland), for their time, effort and willingness to share information; their inputs and feedback are highly appreciated.

CWE Price Zone Study TF – Study of existing cases and preparation of the qualitative analysis
5
Contents
Glossary ................................................................................................................................................... 7
1 Scope and background of the work of the CWE PZS TF .......................................................................... 8
2 Introduction on the relation between bidding zones and congestion management .............................. 9 2.1 Different forms of zone delineation .................................................................................................................. 9 2.2 Regulations ...................................................................................................................................................... 10
3 Summary of the case studies ............................................................................................................... 12 3.1 BNetzA case (Germany/Austria) ...................................................................................................................... 12
3.1.1 Reference to the report, to whom issued the case study, and to whom performed the case study12 3.1.2 Scope and objective of the case study ............................................................................................. 13 3.1.3 Trigger of the case study .................................................................................................................. 14 3.1.4 Outcome of the case study .............................................................................................................. 14 3.1.5 Criteria/method used to support this outcome ............................................................................... 14 3.1.6 How was the case study performed ................................................................................................ 15 3.1.7 Summary .......................................................................................................................................... 16 3.1.8 Relevance for CWE / learning points ............................................................................................... 17 3.1.9 PZS TF criteria addressed in the case study ..................................................................................... 17 3.1.10 Discussion points on loop flows ....................................................................................................... 18
3.2 APG case (Germany/Austria) ........................................................................................................................... 18 3.2.1 Reference to the report, to whom issued the case study, and to whom performed the case study18 3.2.2 Scope and objective of the case study ............................................................................................. 19 3.2.3 Trigger of the case study .................................................................................................................. 20 3.2.4 Outcome of the case study .............................................................................................................. 20 3.2.5 Criteria/method used to support this outcome ............................................................................... 20 3.2.6 How was the case study performed ................................................................................................ 21 3.2.7 Summary .......................................................................................................................................... 21 3.2.8 Relevance for CWE / learning points ............................................................................................... 22 3.2.9 PZS TF criteria addressed in the case study ..................................................................................... 22 3.2.10 Discussion points ............................................................................................................................. 23
3.3 Energinet.dk case (Denmark/Sweden) ............................................................................................................ 24 3.3.1 Reference to the report, to whom issued the case study, and to whom performed the case study24 3.3.2 Scope and objective of the case study ............................................................................................. 24 3.3.3 Trigger of the case study .................................................................................................................. 25 3.3.4 Outcome of the case study .............................................................................................................. 25 3.3.5 Criteria/method used to support this outcome ............................................................................... 25 3.3.6 How was the case study performed ................................................................................................ 26 3.3.7 Summary .......................................................................................................................................... 26 3.3.8 Relevance for CWE / learning points ............................................................................................... 27 3.3.9 PZS TF criteria addressed in the case study ..................................................................................... 28
3.4 Nordic Council of Ministers case (Nordic) ....................................................................................................... 28 3.4.1 Reference to the report, to whom issued the case study, and to whom performed the case study28 3.4.2 Scope and objective of the case study ............................................................................................. 28 3.4.3 Trigger of the case study .................................................................................................................. 28 3.4.4 Outcome of the case study .............................................................................................................. 29 3.4.5 Criteria/method used to support this outcome ............................................................................... 30 3.4.6 How was the case study performed ................................................................................................ 32 3.4.7 Summary .......................................................................................................................................... 32 3.4.8 Relevance for CWE / learning points ............................................................................................... 32 3.4.9 PZS TF criteria addressed in the case study ..................................................................................... 33
3.5 Overview of the studies ................................................................................................................................... 33
4 Summary of interviews taken .............................................................................................................. 34 4.1 Statnett (Norway) – Q & A ............................................................................................................................... 34 4.2 Svenska Kraftnät (Sweden) – Q & A ................................................................................................................. 37 4.3 PSE-O (Poland) – Q & A .................................................................................................................................... 40 4.4 Recap ............................................................................................................................................................... 43

CWE Price Zone Study TF – Study of existing cases and preparation of the qualitative analysis
6
5 The function of a market split on congestion management ................................................................. 44 5.1 Exchanges inside and outside the allocation mechanism ................................................................................ 44 5.2 Market split to manage inner-country congestions ........................................................................................ 47 5.3 Market split to manage a congestion in a bidding area caused by loop flows ................................................ 48
5.3.1 Transit flows and loop flows ............................................................................................................ 48 5.3.2 Market split to manage a congestion in a bidding area caused by loop flows and the need for flow-based capacity calculation and allocation ....................................................................................................... 50
6 Conclusions and outlook for the qualitative assessment ..................................................................... 52 6.1 Main learning points for the qualitative assessment ...................................................................................... 52
7 Appendix ............................................................................................................................................. 54 7.1 Statnett (Norway) – Summary of the interview .............................................................................................. 54 7.2 Svenska Kraftnät (Sweden) – Summary of the interview ................................................................................ 56 7.3 PSE-O (Poland) – Summary of the interview ................................................................................................... 60

CWE Price Zone Study TF – Study of existing cases and preparation of the qualitative analysis
7
Glossary
AG Advisory Group
ATC Available Transfer Capacity
ATC MC ATC Market Coupling
CB Critical Branch
CBCO Critical Branch / Critical Outage
CWE Central Western Europe
D-1 Day Ahead
D-2 Two Days Ahead
D-2CF or D2CF Two Day Ahead Congestion Forecast
DA Day Ahead
DACF Day Ahead Congestion Forecast
FB Flow Based
FBMC Flow Based Market Coupling
ID Intraday
MC Market Coupling
NRA National Regulatory Authority
NTC Net Transmission Capacity
PTDF Power Transfer Distribution Factor
PZS Price Zone Study
PX Power Exchange
TF Task Force
TSO Transmission System Operator
UCTE Union for the Coordination of Transmission of Electricity

CWE Price Zone Study TF – Study of existing cases and preparation of the qualitative analysis
8
1 Scope and background of the work of the CWE PZS TF The CWE Price Zone Study Task Force (PZS TF) was installed by the CWE JSC (Joint Steering Committee, chaired by a
CWE TSO and CWE PX representative) on December 9, 2011. A combined TSO/NRA working group (hereafter called
AG- Advisory Group) has met on 25 October 2011 to kick-off the work, where they defined the general objective of the
study:
Analysis of current zones in CWE and, if judged necessary, a revision of zones boundaries, taking into account important
criteria for the market, especially the maximization of social welfare as the overall goal.
The following criteria have been identified by the PZS TF and the AG in their joint meeting in January 2012:
1. Overall welfare effects 2. Security of Supply 3. Congested lines and adequate congestion treatment 4. Competitiveness 5. Investment signals 6. Benefits and costs of “free” capacity (within zones) 7. Operational costs 8. Transition costs 9. Robustness/stability of zone delimitation
The approach followed by the PZS TF is shown schematically in Figure 1.
Figure 1 Schematic and stepwise approach followed by the CWE PZS TF
This report is the deliverable of the first phase, the initiation phase, of the TF. Main objective of this initiation phase
was to gather materials, studies, and experiences, such in order to establish a proper basis for the qualitative analysis
and possibly a quantitative analysis (if needed).
The following reports have been studied by the TF, and summarized in chapter 2:
Relevance of established national bidding areas for European power market integration – an approach to
welfare oriented evaluation, October 2011, Frontier Economics and Consentec
BNetzA case (Germany/Austria)
Initiation Qualitative analysis Quantitative analysis
Main activities:
• TOR, goal, scope of work• Consultant selection• Deliverables, Time and Budget• Field study• Qualitative Analysis Approach
Deliverable:
• Study Initiation Document
Main activities:
• Evaluation criteria• Effects of existing zones• Effects of zonal changes• Quantitative analysis plan and
budget
Deliverable:
• Qualitative Analysis Report
Main activities:
• Models and scenarios• Input data• Validations• Simulations• Results analysis• Synthesis• Conclusions
Deliverables:
• Quantitative Analysis Report• Synthesis Report
January – April 2012 April – July 2012 July 2012– January 2013
Study
delivery
Q1 2013
GO/NOGO

CWE Price Zone Study TF – Study of existing cases and preparation of the qualitative analysis
9
Impact of a German/Austrian market splitting on the transmission grid of Austrian Power Grid (APG) and
critical lines in Germany, Poland and Czech Republic, 20 September 2011, RWTH Aachen University, IAEW
(Institut für Elektrische Anlagen und Energiewirtschaft)
APG case (Germany/Austria)
The economic consequences of capacity limitations on the Oresund connection, 11 December 2006,
Copenhagen Economics
Energinet.dk case (Denmark/Sweden)
Congestion Management in the Nordic Market - evaluation of different market models, May 2008, Ea Energy
Analyses, Hagman Energy and COWI
Nordic Council of Ministers case (Nordic)
In addition interviews were organized with TSOs that applied a zonal delineation within their country (Statnett
(Norway) and Svenska Kraftnät (Sweden)), and a TSO that is implementing a nodal energy market in its country (PSE-O,
Poland). This allows the CWE PZS TF to take into account and learn from their practical experiences.
A summary of the interviews is provided in the appendix of the report, whereas dedicated questions, formulated by
the CWE PZS TF, and the corresponding answers received from the interviewed TSOs are included in chapter 4. The
TSOs interviewed, have been given the opportunity to review the texts that are included in this report. They are aware
that this report is public material, as is the text of the interview.
Matti Supponen wrote in his Ph.D. thesis: ‘The Central Western European regulators have agreed to make a regional
study on optimal bidding zones. This study will probably constitute a real laboratory for analysing national and
company interests, starting from the terms of reference, through input received from stakeholders, to interpreting the
results.’ 1
This report is the initial report that stems from this laboratory.
2 Introduction on the relation between bidding zones and congestion management
There are several ways to deal with congestions. There are different time frames to consider (long term, day ahead,
intraday, balancing, settlement), different actors, different methods, active and passive measures that all together
describe the complete picture. The challenge is to select a set of measures that together can deal with this complete
picture.
Bidding zone delineation is just one of the potential measures in such a set. The challenge of this CWE price zone study
is to find out if and how zone delineation fits in such a set in order to deal with congestions in the best possible way.
"The best possible way" itself will be studied in the qualitative analysis phase and, if needed, also in the quantitative
analysis phase.
In this chapter a short, and high over, introduction on the relation between bidding zones and congestion management
is provided to introduce the concepts touched upon in the summaries of the case studies and interviews.
2.1 Different forms of zone delineation
In case of constraints in the transmission network, the sizing of bidding areas is one potential way to alleviate these
constraints. Three systems may be distinguished:
the uniform system, where only one area covers the whole system and where no transmission capacity limit is
defined inside the area and where all congestions are managed by redispatching/countertrade;
the nodal system, where all flows are optimized by the allocation mechanism and where the transmission
capacities tend to the capacities of the transmission elements and where no redispatching/countertrade is
required (for that reason);
1 Influence of National and Company Interests on European Electricity Transmission Investments, Matti Supponen,
Helsinki 2011, ISBN 978-952-60-4269-5 (printed).

CWE Price Zone Study TF – Study of existing cases and preparation of the qualitative analysis
10
the zonal system, where capacities are defined between zones and where some congestions are solved using
redispatching/countertrade.
The European energy market is based on the zonal system. The bidding areas correspond in most of the cases to
national borders (generation, grid and supply were before the liberalisation organized mainly on a national basis by
integrated companies) and consequently vary largely in size. The Nordic market is an exception to that, as well as the
Italian one; they have multiple bidding areas within national borders. The bidding areas in the Nordic region and in
Italy are shown in
Figure 2. 2, 3
Figure 2 Bidding areas in the Nordic region (left) and in Italy (right)
The nodal system is implemented by several ISOs (Independent System Operators) in North America, in New Zealand,
Argentina, and Singapore. The Polish TSO, PSE-O, is currently implementing the nodal system for the electricity market
in Poland (see also section 4.3).
2.2 Regulations
In the Guidelines On The Management And Allocation Of Available Transfer Capacity Of Interconnections Between
National Systems (Annex I of Regulation (EC) No 714/2009 Of The European Parliament And Of The Council of 13 July
2009 on conditions for access to the network for cross-border exchanges in electricity and repealing Regulation (EC) No
1228/2003) 4, it states in article 1.7:
2 http://www.nordpoolspot.com/Market-data1/Maps/Elspot-Market-Overview/Elspot-Prices/
3 http://www.mercatoelettrico.org/En/MenuBiblioteca/documenti/20091112VademecumofIpex.pdf
4 http://eur-lex.europa.eu/LexUriServ/LexUriServ.do?uri=OJ:L:2009:211:0015:0035:EN:PDF

CWE Price Zone Study TF – Study of existing cases and preparation of the qualitative analysis
11
When defining appropriate network areas in and between which congestion management is to apply, TSOs shall be
guided by the principles of cost-effectiveness and minimisation of negative impacts on the internal market in
electricity. Specifically, TSOs shall not limit interconnection capacity in order to solve congestion inside their own
control area, save for the abovementioned reasons and reasons of operational security (1). If such a situation
occurs, this shall be described and transparently presented by the TSOs to all the system users. Such a situation
shall be tolerated only until a long-term solution is found. The methodology and projects for achieving the long-
term solution shall be described and transparently presented by the TSOs to all the system users.
(1) Operational security means ‘keeping the transmission system within agreed security limits’.
In the Framework Guidelines on Capacity Allocation and Congestion Management for Electricity, FG-2011-E-002, 29
July 2011, an article on ‘Definition of Zones for Capacity Allocation and Congestion Management’ is embedded, of
which below some extracts are presented: 5
The CACM Network Code(s) shall define a zone as a bidding area, i.e. a network area within which market
participants submit their energy bids day-ahead, in intraday and in the longer term timeframe. The CACM
Network Code(s) shall ensure that, when defining the zones, the TSOs are guided by the principle of overall
market efficiency. This includes all economic, technical and legal aspects of relevance, such as, socio
economic welfare, liquidity, competition, network
structure and topology, planned network reinforcement and redispatching costs. The definition of zones
shall further contribute towards correct price signals and support adequate treatment of internal
congestion.
Zone definitions concern all timeframes: long-term, day-ahead and intraday. Moreover, zone delimitations
should be coordinated with balancing zones.
The CACM Network Code(s) shall provide that TSOs propose the delimitation of zones for subsequent
approval by the relevant NRAs. In cases where it can be shown that there is no significant internal
congestion within or between control areas, one or several control areas may constitute one zone. The
above-mentioned market efficiency principle and aspects such as system security must be reflected in the
proposal and be assessed in a sound and comprehensive substantiation for either the proposed new
delimitation or preservation of existing zones. The assessment shall be prepared in a region-wide
coordinated way, also taking into account possible impact on other zones in the respective region. The
CACM Network Code(s) shall envisage that the relevant TSOs repeat the assessment when network topology
or patterns of generation and load, or local energy situations (deficits or surplus) are significantly changed
or if it is necessary to ensure system security. NRAs shall assess the delimitation of zones against the criteria
of overall market efficiency. In case a change in the zone delimitation is foreseen, it is of the utmost
importance that market participants be consulted and have sufficient time to prepare.
While limiting cross-border capacity to solve internal congestion inside a control area is generally not
permitted, the CACM Network Code(s) shall provide that, if such a situation occurs, it is reported
transparently. Detailed information on internal and cross-border congestion and limiting constraints (exact
location, exact hour of congestion) shall also be reported to the relevant NRAs.
The CACM Network Code(s) shall require TSOs to submit every two years, on a regional basis to the
responsible NRAs and to the Agency, an analysis of the current zone delimitation based on detailed data on
redispatching/countertrade costs and structural congestion. Based on this analysis, the market structure
and possible market power issues shall be evaluated by the relevant NRAs and the Agency and, where
necessary, measures shall be adopted. The CACM Network Code(s) shall foresee stable and robust zones
over time.
As such, the work being performed by the CWE PZS TF can be seen as a first regional analysis of the current zone
delineation.
5 http://www.acer.europa.eu/portal/page/portal/ACER_HOME/Communication/News/FG-2011-E-002%20(Final).pdf

CWE Price Zone Study TF – Study of existing cases and preparation of the qualitative analysis
12
3 Summary of the case studies The case studies summarized in this chapter are based on the following reports:
Relevance of established national bidding areas for European power market integration – an approach to
welfare oriented evaluation, October 2011, Frontier Economics and Consentec
BNetzA case (Germany/Austria)
Impact of a German/Austrian market splitting on the transmission grid of Austrian Power Grid (APG) and
critical lines in Germany, Poland and Czech Republic, 20 September 2011, RWTH Aachen University, IAEW
(Institut für Elektrische Anlagen und Energiewirtschaft)
APG case (Germany/Austria)
The economic consequences of capacity limitations on the Oresund connection, 11 December 2006,
Copenhagen Economics
Energinet.dk case (Denmark/Sweden)
Congestion Management in the Nordic Market - evaluation of different market models, May 2008, Ea Energy
Analyses, Hagman Energy and COWI
Nordic Council of Ministers case (Nordic)
The contents of the paragraphs in this chapter are completely based on the reports in the bullet list above. Use of
these materials will therefore not be explicitly referenced in the paragraph. If material from another document is used,
it will be indicated as such.
As the reports are quite extensive, and highly incomparable with regards to structure and content, the following
approach has been adopted to give a summary of the various case studies in a way that allows to compare them on a
high level:
1. Reference to the report, to whom issued the case study, and to whom performed the case study
2. Scope and objective of the case study
3. Trigger of the case study
4. Outcome of the case study
5. Criteria/method used to support this outcome
6. How was the case study performed
a. Qualitative assessment performed? How? Who?
b. Quantitative assessment performed? How? Who?
7. Summary
8. Relevance for CWE / learning points
9. PZS TF criteria addressed in the case study
10. Discussion points
In order to stay as close as possible to the facts and original points of view of the case studies, the items 1 up to and
including 6 in the summary are completely factual (the sentences in the sections will be formatted in italics to highlight
this). This means that the sentences have been taken from the reports as is; no rewording has been applied, such in
order to prevent that the meaning becomes different from what the original authors had in mind. Note that the report
of the APG case was written in German language; in this case it was inevitable to translate the sentences into English.
The English summary has however been validated by the case owner (APG).
For some case studies, discussion points are given. This is the case if the PZS TF felt the need to highlight some aspects
of the case study that are questionable – from the point of view of the TF – and require more attention/elaboration in
the work to be performed by the TF during the qualitative and (possibly) quantitative phase.
3.1 BNetzA case (Germany/Austria)
3.1.1 Reference to the report, to whom issued the case study, and to whom performed the case study
The BNetzA case (Germany/Austria)
Case owner: BNetzA

CWE Price Zone Study TF – Study of existing cases and preparation of the qualitative analysis
13
Study report: Relevance of established national bidding areas for European power market integration – an approach to
welfare oriented evaluation, October 2011, Frontier Economics and Consentec
Case study issued by: BNetzA
Case study performed by: Frontier Economics and Consentec
3.1.2 Scope and objective of the case study
Motivated by recent developments and the current discussions on the EC level the Bundesnetzagentur has retained
Frontier Economics Ltd (“Frontier”) and Consentec GmbH (“Consentec”) to explore the economic merits and downsides
of breaking up the joint German-Austrian bidding area into smaller zones. The study is to cover two dimensions:
• Develop a (generic) reference framework within which to explore quantitatively and qualitatively the creation
of additional zones in any market (through market splitting);
• Apply the generic framework to the specific situation in Germany-Austria.
The study is also to consider the option of using Nodal pricing as a congestion management regime. The focus,
however, is on the comparison of wider bidding areas or the introduction of market splitting within wider areas.
Figure 3 (Generic) reference framework within which to explore quantitatively and qualitatively the creation of
additional zones in any market (through market splitting)
Figure 4 Background and scope of the study
Congestion
analysis
Technical and economical analysisCongestion analysis
Identification
of a potential
structure of
split bidding
areas
Market
splitting of
bidding
areas
Technical
evaluation
Economic
evaluation
Recom-
mendation
• On a number of key routes, grid
expansion and investment should be
prioritised.
• Some management of locating new
power stations could be desirable in
future, but would need to be
developed in a stable manner,
especially with the aim of
• locating new gas fired power
generation close to loads; and
• locating coal stations along the
Rhine.
• The option to redispatch power
stations needs to be upheld for
security reasons.
Report - 2011
Relevance of established
national bidding areas for
European power market
integration – an approach to
welfare oriented evaluation
Report - 2008
Methodische Fragen bei der
Bewirtschaftung
innerdeutscher Engpässe im
Übertragungsnetz (Energie)
• Develop a (generic) reference
framework within which to explore
quantitatively and qualitatively the
creation of additional zones in any
market (through market splitting);
• Apply the generic framework to the
specific situation in Germany-Austria.

CWE Price Zone Study TF – Study of existing cases and preparation of the qualitative analysis
14
3.1.3 Trigger of the case study
Figure 5 Trigger of the new study
3.1.4 Outcome of the case study
A (generic) reference framework within which to explore quantitatively and qualitatively the creation of additional
zones in any market (through market splitting (see Figure 3).
• The generic framework has been applied to the specific situation in Germany-Austria.
• no bottleneck in Germany that qualifies as structural and sustained. Thus, the necessary precondition
for considering a split of the existing bidding area is currently not fulfilled.
• Nevertheless, we continue the evaluation in order to perform an “as if” application to the Germany-
Austria case. (Note: this means the study was continued under the assumption “as if” there was a
congestion)
A more dynamic consideration of expected loop flows during the (daily or intraday) NTC assessment could help
increasing cross-border transmission capacities at times of low wind power infeed.
3.1.5 Criteria/method used to support this outcome
• Assessment of statistical data about redispatching and countertrading measures from April 2008 to September
2010
• Our analysis of the present situation of network congestion in Germany yields only one internal transmission
line with significant frequency of congestion.
• Also we have not found any evidence that internal congestions have been or could be shifted to the country
borders.
• Furthermore we have shown that the occurrence of loop flows does not constitute a reason for altering the
size of bidding areas.
• We want to note that based on our analysis of the network situation in Germany, there is currently no need for
market splitting due to the lack of structural congestion.
Report - 2011
Relevance of established
national bidding areas for
European power market
integration – an approach to
welfare oriented evaluation
Report - 2008
Methodische Fragen bei der
Bewirtschaftung
innerdeutscher Engpässe im
Übertragungsnetz (Energie)
Market developments
• Delays in network development
• Generation development
• wind expansion
• PV expansion
Policy developments
• ERGEG Framework Guidelines on Capacity Allocation and Congestion Management for Electricity;
• an EU Com Decision on Svenska Kraftnät; and
• the introduction of CWE Market Coupling.

CWE Price Zone Study TF – Study of existing cases and preparation of the qualitative analysis
15
3.1.6 How was the case study performed
• Qualitative assessment performed?
Yes
• How?
This case study is a qualitative study, though sometimes supported by using existing numerical data
(historical data, Platts data, PTDF factors, wind infeed)
The qualitative assessment is divided in four parts:
1 - Current situation in the bidding area Germany-Austria
2 - Market splitting – generalised evaluation approach
3 - Application to Germany-Austria
4 - Congestion management – up-and downsizing
details per item are provided hereunder
• Who?
Frontier Economics and Consentec
• Quantitative assessment performed?
Yes
• How?
This case study is a qualitative study, though sometimes supported by using existing numerical data
(historical data, Platts data, PTDF factors, wind infeed)
• Who?
Frontier Economics and Consentec
The qualitative assessment is divided in four parts:
1 - Current situation in the bidding area Germany-Austria
• Network situation – congestion and congestion management
• Statistical evaluation of congestion management measures
• Is congestion shifted to the borders?
• The role of loop flows
• Conclusion on network situation
• Role of the German/Austrian electricity market for the European market
• Geographic location
• Size of the German/Austrian electricity market
• Wholesale market liquidity
• Competition situation
• Conclusions
2 - Market splitting – generalised evaluation approach
• Options for dealing with congestion
• Main arguments in favor and against market splitting
• Defining the framework
• Step 1: congestion analysis
• Step 2: Technical analysis (technical effect of splitting the bidding areas)
• Step 3: Economic analysis (economical effect of splitting the bidding areas)
• Cost-benefit analysis
• Static efficiency – least cost dispatch
• Dynamic efficiency – power plant investments
• Dynamic efficiency – locational signals from electricity prices and renewables
• Dynamic efficiency – locational signals from electricity prices for demand
• Dynamic efficiency – incentives for grid investments from market splitting
• Competition and market concentration
• Market liquidity
• Transaction costs of market splitting
• Distributional effects

CWE Price Zone Study TF – Study of existing cases and preparation of the qualitative analysis
16
3 - Application to Germany-Austria
• Step 1: congestion analysis
• Structural versus intermittent
• Sustained versus temporary
• Step 2: Technical analysis (technical effect of splitting the bidding areas)
• Effect on transmission capacities
• Influence of renewable generation on the utilisation of transmission capacities
• Step 3: Economic analysis (economical effect of splitting the bidding areas)
• Definition – status quo and market splitting
• Market splitting – the impact on market concentration
• Market splitting and status quo– disclosure of market power?
• Market splitting – static efficiency
• Market splitting – locational signals for power plants
• Market splitting – locational signals and renewables
• Market splitting – incentives for investments into transmission grid
• Market splitting – market liquidity and impact on competition
• Transaction costs
• Distributional effects
• European perspective
4 - Congestion management – up-and downsizing
• Nodal pricing
• Static efficiency of nodal pricing
• Dynamic efficiency of nodal pricing
• Market concentration and market liquidity under nodal pricing
• Transaction costs under nodal pricing
• Enlargement of bidding areas
• Static efficiency of enlarging of bidding areas
• Dynamic efficiency of enlarging of bidding areas
• Market concentration and market liquidity in enlarged bidding areas
• Transaction costs of enlarging of bidding areas
3.1.7 Summary
The study is to cover two dimensions:
• Develop a (generic) reference framework within which to explore quantitatively and qualitatively the creation
of additional zones in any market (through market splitting);
• Apply the generic framework to the specific situation in Germany-Austria.
The generic framework has been applied to the specific situation in Germany-Austria.
• no bottleneck in Germany that qualifies as structural and sustained. Thus, the necessary precondition for
considering a split of the existing bidding area is currently not fulfilled.
• Nevertheless, the evaluation was performed “as if” to the Germany-Austria case (see Figure 6).
The study also considers the option of using Nodal pricing as a congestion management regime. The focus, however, is
on the comparison of merging existing bidding areas into a wider area or the introduction of market splitting within
existing areas.

CWE Price Zone Study TF – Study of existing cases and preparation of the qualitative analysis
17
Figure 6 Market split studied in the BNetzA case (Germany/Austria)
3.1.8 Relevance for CWE / learning points
• Qualitative assessment
• The (generic) reference framework within which to explore quantitatively and qualitatively the
creation of additional zones in any market (through market splitting) is a useful and well-structured
approach
• Quantitative assessment
• Some calculations, statistical analysis, load flows etc. can already be useful for the qualitative stage of
the study
• Good framework and a clear report. The framework and criteria are useful for the CWE PZS TF study
CWE PZS TF work could follow the same structure and include the same criteria
• The evaluations on criteria are right by itself but lack sometimes the necessary context to fully understand the
practical implications and may thus lead to questionable conclusions CWE PZS TF will elaborate on the
specific points and add the necessary context during the qualitative analysis
3.1.9 PZS TF criteria addressed in the case study
The list of criteria defined by the CWE PZS TF, and the extent in which they are addressed in the BNetzA case is
schematically indicated in the table below.
PZS TF Criteria BNetzA
case
1. Overall welfare effects
2. Security of Supply
3. Congested lines and adequate congestion treatment
4. Competitiveness
5. Investment signals
6. Benefits and costs of “free” capacity (within zones)
7. Operational costs
8. Transition costs
9. Robustness/stability of zone delimitation
Legenda:
: not addressed : addressed : partly addressed
CWE Price Zone Study TF – Study of existing cases and preparation of the qualitative analysis
18
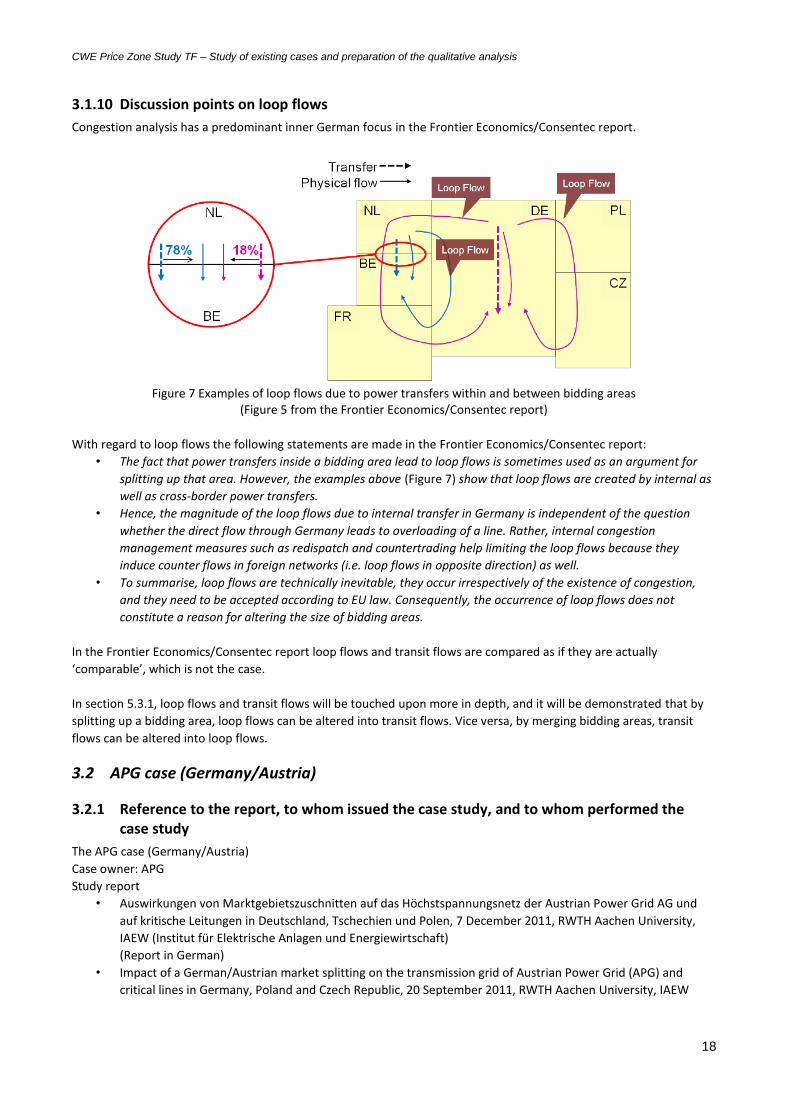
3.1.10 Discussion points on loop flows
Congestion analysis has a predominant inner German focus in the Frontier Economics/Consentec report.
Figure 7 Examples of loop flows due to power transfers within and between bidding areas
(Figure 5 from the Frontier Economics/Consentec report)
With regard to loop flows the following statements are made in the Frontier Economics/Consentec report:
• The fact that power transfers inside a bidding area lead to loop flows is sometimes used as an argument for
splitting up that area. However, the examples above (Figure 7) show that loop flows are created by internal as
well as cross-border power transfers.
• Hence, the magnitude of the loop flows due to internal transfer in Germany is independent of the question
whether the direct flow through Germany leads to overloading of a line. Rather, internal congestion
management measures such as redispatch and countertrading help limiting the loop flows because they
induce counter flows in foreign networks (i.e. loop flows in opposite direction) as well.
• To summarise, loop flows are technically inevitable, they occur irrespectively of the existence of congestion,
and they need to be accepted according to EU law. Consequently, the occurrence of loop flows does not
constitute a reason for altering the size of bidding areas.
In the Frontier Economics/Consentec report loop flows and transit flows are compared as if they are actually
‘comparable’, which is not the case.
In section 5.3.1, loop flows and transit flows will be touched upon more in depth, and it will be demonstrated that by
splitting up a bidding area, loop flows can be altered into transit flows. Vice versa, by merging bidding areas, transit
flows can be altered into loop flows.
3.2 APG case (Germany/Austria)
3.2.1 Reference to the report, to whom issued the case study, and to whom performed the case study
The APG case (Germany/Austria)
Case owner: APG
Study report
• Auswirkungen von Marktgebietszuschnitten auf das Höchstspannungsnetz der Austrian Power Grid AG und
auf kritische Leitungen in Deutschland, Tschechien und Polen, 7 December 2011, RWTH Aachen University,
IAEW (Institut für Elektrische Anlagen und Energiewirtschaft)
(Report in German)
• Impact of a German/Austrian market splitting on the transmission grid of Austrian Power Grid (APG) and
critical lines in Germany, Poland and Czech Republic, 20 September 2011, RWTH Aachen University, IAEW
CWE Price Zone Study TF – Study of existing cases and preparation of the qualitative analysis
19
(Institut für Elektrische Anlagen und Energiewirtschaft)
(Slideshow in English)
Case study issued by: APG
Case study performed by: RWTH Aachen University, IAEW (Institut für Elektrische Anlagen und Energiewirtschaft)
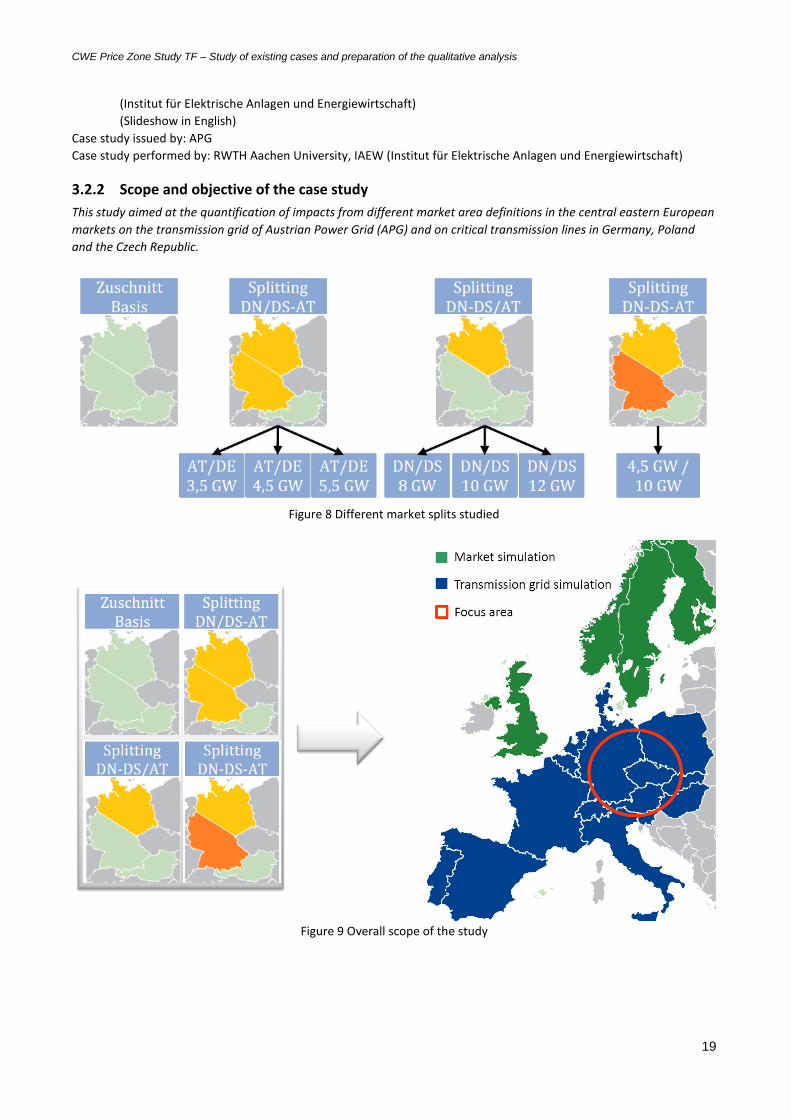
3.2.2 Scope and objective of the case study
This study aimed at the quantification of impacts from different market area definitions in the central eastern European
markets on the transmission grid of Austrian Power Grid (APG) and on critical transmission lines in Germany, Poland
and the Czech Republic.
Figure 8 Different market splits studied
Figure 9 Overall scope of the study

CWE Price Zone Study TF – Study of existing cases and preparation of the qualitative analysis
20
3.2.3 Trigger of the case study
• Increasing amount of intermittent power generation, i.e. solar and wind energy, in the European power
system.
• Increasing need for energy storage, which is mostly located in Central Europe. Due to the large distance
between the wind sites, that are mostly located near the shore or offshore (North of Germany), and the energy
storage in Central Europe (Austria), heavy North-South transports and congestions occur.
• Large loop flows occur in the neighbouring grids (mostly the grids to the West and East of Germany-Austria),
due to the highly-meshed network and the large geographical concentration of sources in the North of
Germany and sinks in the South of Germany. Those loop flows create clear problems in the system operations.
• Given this background, APG investigated whether the current single market area Germany-Austria is still
reasonable from a technical and social welfare point of view, or that new market cuts could be reasonable
alternatives.
3.2.4 Outcome of the case study
• The results show, that the definition of new market areas and the splitting of existing ones can decrease
congestions on the new cross-border transmission lines. The impact on other transmission lines can be
described as relatively low. There is for example only little effect of an inner German market splitting on
transmission lines in Poland and the Czech Republic, if realistic net-transfer capacities6 are applied. This little
impact is on the one hand a result of only marginal changes in the power generation and the power exchange
between market areas, and on the other hand the large electrical distance (and small resulting sensitivities)
between Germany and most of the critical lines in Poland and the Czech Republic.
• Based on the observations obtained with realistic transfer capacities, the splitting of the market area
Germany-Austria does not provide an effective measure to relieve the lines in the neighboring market areas.
Furthermore, only a minor decrease in the redispatch costs can be observed (maximal 4,1 %).
3.2.5 Criteria/method used to support this outcome
• Results obtained from quantitative analyses covering one year of hourly simulations (2010)
• Quantitative analysis, based on two major building blocks
• Transmission grid model (continental Europe) including hourly nodal renewable feed-in
• Market model that, based on NTC values, provides hourly dispatch of power plants, market prices and
exchanges
• Both are combined in an hourly grid simulation in order to evaluate grid congestions, by running a
contingency analysis, and showing possible overloads and need for/impact of redispatch measures
• Four scenarios
• Basecase (DE/AT one market area)
• DE-AT (NTC = 5500 MW, NTC = 4500 MW, NTC = 3500 MW)
• DE_N-DE_S/AT (NTC = 12.000 MW, NTC = 10.000 MW, NTC = 8000 MW)
• DE_N-DE_S-AT (NTC (DE_N-DE_S) = 10.000 MW, NTC (DE_S-AT) = 4500 MW)
• Compared in terms of
• Grid congestions
• Generation and power exchange
• Prices
• Redispatch measures and costs
6 for the inner German/Austrian borders values were used that were assumed to be practically possible. For the
existing borders, existing NTCs were used.

CWE Price Zone Study TF – Study of existing cases and preparation of the qualitative analysis
21
Figure 10 Four market split scenarios and the quantitative method applied to analyse them
3.2.6 How was the case study performed
• Qualitative assessment performed?
No
• Quantitative assessment performed?
Yes
• How?
• determination of hourly nodal feed-in of generation from RES
• hourly market simulations, taking into account cross-border NTCs, to determine the
generation dispatch, market prices, and cross-border exchanges
• contingency analysis and redispatch in a grid model of continental Europe, consisting of the
380kV and 220kV networks (a detailed grid model of AT was embedded)
• Who?
RWTH Aachen University, IAEW (Institut für Elektrische Anlagen und Energiewirtschaft)
3.2.7 Summary
• This study aims at the quantification of impacts from different market area definitions in the central eastern
European markets on the transmission grid of Austrian Power Grid (APG) and on critical transmission lines in
Germany, Poland and the Czech Republic
• Four scenarios with varying NTCs are analyzed by means of a quantitative analysis: DE/AT (base), DE-AT,
DE_N-DE_S/AT, DE_N-DE_S-AT
• The quantitative analyses covers one year of hourly simulations (2010), and estimates the impacts of market
splits in terms of
• Grid congestions
• Generation, power exchanges, and prices
• Redispatch measures and costs
• The results show, that the definition of new market areas and the splitting of existing ones can decrease
loading on the newly defined cross-border transmission lines. The impact on other transmission lines can be

CWE Price Zone Study TF – Study of existing cases and preparation of the qualitative analysis
22
described as relatively low. There is for example only little effect of an inner German market splitting on
transmission lines in Poland and the Czech Republic, if realistic net-transfer capacities are applied.
• Based on the observations obtained with realistic transfer capacities, the splitting of the market area
Germany-Austria does not provide an effective measure to relieve the lines in the neighboring market areas.
Furthermore, only a minor decrease in the redispatch costs can be observed (maximal 4,1 %).
3.2.8 Relevance for CWE / learning points
• Qualitative assessment
• NA
• Quantitative assessment
• The combined use of a market model and grid simulations is an interesting approach, especially the
fact that the redispatch is taken into account.
3.2.9 PZS TF criteria addressed in the case study
The list of criteria defined by the CWE PZS TF, and the extent in which they are addressed in the APG case is
schematically indicated in the table below.
PZS TF Criteria APG
case
1. Overall welfare effects
2. Security of Supply
3. Congested lines and adequate congestion treatment
4. Competitiveness
5. Investment signals
6. Benefits and costs of “free” capacity (within zones)
7. Operational costs
8. Transition costs
9. Robustness/stability of zone delimitation
Legenda:
: not addressed : addressed : partly addressed

CWE Price Zone Study TF – Study of existing cases and preparation of the qualitative analysis
23
3.2.10 Discussion points
The study seems to compare the base scenario with the scenario I, in the example shown in Figure 11. The impact of
the market split is low (and in this example negligible). A coordinated capacity calculation is not reflected in the study.
It is not stated whether, or to which extent, this causes drawbacks for the results. As the trigger for the study is
amongst others the loop flows in neighboring countries and the corresponding security issues, a coordinated capacity
calculation should reflect the mutual regional influence in the ATC between the new zones. If the impact on the
neighbouring grid was significant this could look like scenario II in the example in Figure 11; a commercial congestion
now appears in between the new zones, thereby limiting the South-North exchange and the corresponding loop flow.
Figure 11 Market split in order to limit the loop flow observed in the base scenario.
Scenario I: capacity between the new bidding areas is too high to have an impact on the loop flow. Scenario II: capacity between the new bidding areas is now limiting the exchange and thereby the loop flow.
Some statements from the APG report:
1. The results show, that the definition of new market areas and the splitting of existing ones can decrease
congestions on the new cross-border transmission lines. The impact on other transmission lines can be
described as relatively low. There is for example only little effect of an inner German market splitting on
transmission lines in Poland and the Czech Republic, if realistic net-transfer capacities are applied…
2. …This little impact is on the one hand a result of only marginal changes in the power generation and the power
exchange between market areas…
3. …and on the other hand the large electrical distance (and small resulting sensitivities) between Germany and
most of the critical lines in Poland and the Czech Republic.
Some comments linked to these specific statements:
1. What is introduced in the report is a market split between parts of Germany/Austria without a coordinated
capacity calculation.
2. Indeed, if in the simulations the power generation hardly changes, as well as the power exchanges, the
loading of the grid remains merely the same. This is because there is no coordinated capacity calculation: the
capacities between the new bidding areas are that large that the exchanges are hardly impacted.
3. The current issue of the loop flows, being one of the triggers of this report, shows that the sensitivities are
significant.
In section 5.3.2, it will be elaborated upon that the shortcoming of ATCs (the fact that under ATC the capacity split over
the borders is TSO driven) is addressed by the FB methodology, where a FB capacity domain is provided to the market,
and where it is up to the market to decide how this capacity is used and by whom. Indeed, under FB the capacity split
is market driven (at the time of allocation). Only with a flow-based coordinated capacity calculation and allocation, a
true competition between exchanges for the scarce capacity can be established. As FBMC (Flow-Based Market
Coupling) is the target for coordinated capacity calculation and allocation model for the highly-meshed European grid
in 2014, the conclusion in the APG report “the splitting of the market area Germany-Austria does not provide an
effective measure to relieve the lines in the neighboring market areas” only holds for the years before the introduction
of FB market coupling.
Exchange
Physical
flow
Congestion
ATC = 0
-1000
500
+1000
500
Base scenario
ATC = 1500
Scenario I: split with high ATC
ATC = 0
-1000
500
+1000
500 250250
-500
+500
ATC = 500
Scenario II: split with low ATC
ATC = 0

CWE Price Zone Study TF – Study of existing cases and preparation of the qualitative analysis
24
3.3 Energinet.dk case (Denmark/Sweden)
3.3.1 Reference to the report, to whom issued the case study, and to whom performed the case study
Energinet.dk case (Denmark/Sweden)
Case owner: Energinet.dk
Study report: The economic consequences of capacity limitations on the Oresund connection, 11 December 2006,
Copenhagen Economics
Case study issued by: Energinet.dk
Case study performed by: Copenhagen Economics
3.3.2 Scope and objective of the case study
Figure 12 Svenska Kraftnät regularly resorts to limiting export capacity on the Oresund-connection in order to solve
internal bottleneck problems in the Swedish electricity network (‘Cut 4’)7
• Svenska Kraftnät regularly resorts to limiting export capacity on the Oresund-connection in order to solve
internal bottleneck problems in the Swedish electricity network. In theory, the practice of limiting transmission
capacity on the Oresund-connection may cause economic losses to Danish consumers due to higher spot prices
and price volatility; and may benefit Swedish consumers due to lower spot prices and lower costs of network
management.
• On the basis of these insights, Energinet.dk, the Danish system operator, has asked Copenhagen Economics to
verify empirically whether these claims are correct and, if affirmative, to estimate the size of the losses to
Danish consumers and the gains to Swedish consumers caused by the behaviour of Swedish Kraftnät.
• We do not consider the alternative to counter trade, market splitting, where Sweden becomes divided in two
price areas, as this would violate the political principle in Sweden of uniform electricity pricing throughout the
country. In contrast, counter trade is clearly consistent with uniform electricity pricing. However, it is generally
recognised that - in economic terms – market splitting is superior to counter trade.
7 Graphs taken from: COMMISSION DECISION of 14.4.2010 relating to a proceeding under Article 102 of the Treaty on
the Functioning of the European Union and Article 54 of the EEA Agreement (Case 39351 – Swedish Interconnectors)
http://ec.europa.eu/competition/antitrust/cases/dec_docs/39351/39351_1211_8.pdf
Schematic overview of the Nordic bidding zones and interconnectors on 17 November 2008 (source: EC, Case 39351 – Swedish interconnectors)
Network in Sweden with bottlenecks as of 22 April 2006 (source: EC, Case 39351 – Swedish Interconnectors)

CWE Price Zone Study TF – Study of existing cases and preparation of the qualitative analysis
25
3.3.3 Trigger of the case study
• Svenska Kraftnät regularly experiences internal bottlenecks in the Swedish transmission network in hours
where demand in southern Sweden is high and where this demand must be partly satisfied by power plants
located in northern Sweden. In these situations, transmission capacity at certain locations in Sweden is
insufficient and Svenska Kraftnät typically resorts to limiting export out of Sweden in order to limit demand on
the excess demand side of the bottlenecks. In practice, this is done by artificially limiting transmission capacity
– among others - on the Oresund-connection.
• We have examined capacity limitation and congestion on the Oresund-connection on hourly data for the
period 1 October 2001 - 28 June 2006, in total 50,328 observations. In this period, transmission capacity in the
direction to Denmark has been limited in 8,262 hours (16.5 percent) giving rise to congestion on the Oresund-
connection in 2,808 hours (5.6 percent). The average hourly capacity limitation is about 725 MWh meaning
that in each hour where capacity is limited, available capacity for the market is cut by about half.
• Both Energinet.dk and Svenska Kraftnät have requested capacity limitations on the Oresund connection, but
Svenska Kraftnät has been by far the most active. Since 2004, 90 percent of all actual capacity limitations have
been requested by Svenska Kraftnät, only 1 percent by Energinet.dk. The remaining 9 percent are due to joint
causes. By far the most common motivation for Svenska Kraftnät requesting capacity limitation on the
Oresund-connection has been internal bottlenecks in the Swedish transmission network, in total more than 85
percent of all hours with capacity limitations.
3.3.4 Outcome of the case study
• Overall, we confirm that the Svenska Kraftnäts policy of limiting transmission capacity on the Oresund-
connection has lead to large-scale losses for Danish consumers and to significant gains for Swedish consumers.
• We show that Danish consumers experience large-scale economic losses arising from higher spot prices
estimated to be at least 725 million DKK. Prices increase in east Denmark because capacity limitations very
often lead to congestion such that the marginal power plant must be found among high cost thermal power
plants (in east Denmark) instead of low cost hydro or nuclear power plants (in Sweden). This figure in reality
underestimates the true economic costs as the costs of price volatility have not been quantified.
• We also show that Swedish consumers experience economic gains due to lower costs of network management:
By using capacity limitations Svenska Kraftnät can minimize the use of counter trade, the costs of which would
be passed-on to Swedish consumers. We estimate the gain (avoided costs) passed-on to Swedish consumers to
be 215-265 million DKK.
• Both Energinet.dk and Svenska Kraftnät experienced an income from the congestion revenues of the constraint
Oresund connection.
3.3.5 Criteria/method used to support this outcome
The economic consequences of capacity limitations depend on what will happen on the Swedish and east Danish
electricity markets if Svenska Kraftnät ceases to use capacity limitations on the Oresund connection to solve internal
Swedish bottleneck problems. Accordingly, we have to predict how the market outcome would have been in all hours
with capacity limitation (8,252 hours).
• First, consider hours with capacity limitation but without congestion (6,454 hours)
Ignore: we expect prices to be unaltered.
• Second, turn to hours with capacity limitation and congestion (2,808 hours). In those hours there are again
two possible outcomes.
• Either there will still be congestion even though all transmission capacity is available for the market
and prices will still be determined independently in separate east Danish and Swedish price areas.
Ignore: Total transmission capacity on the Oresund-connection is very high compared to the size of
the two markets and – in the past – congestion has only arisen in less than 4 percent of all hours with
full available capacity. We have estimated the number of capacity limited and congested hours that
were still likely to be congested in the absence of capacity limitations, and consistently reach numbers
in the neighbourhood of 2-4 percent (corresponding to 50-100 hours).
• Or there will be no congestion leading to a joint Swedish-east Danish price area with a uniform price.
Given that we are studying hours where hydro power is abundant and cheap, we will expect that

CWE Price Zone Study TF – Study of existing cases and preparation of the qualitative analysis
26
the likelihood of the ‘new’ marginal plant being a hydro plant is significant. For this reason, we expect
prices in east Denmark would have dropped significantly in the absence of capacity limitations. In
most cases, the ‘old’ marginal plant in Sweden was a low cost hydro power plant. Again, given that
we are studying hours where hydro power was abundant and cheap we expect that the likelihood of
the ‘new’ marginal plant being a hydro plant is significant. For this reason, we will expect that prices
in Sweden would remain more or less at the same level in the absence of capacity limitations.
• We have set up a large number of econometric models to estimate the price in east Denmark and in
Sweden contingent on the presence of congestion (caused by capacity limitations requested by
Svenska Kraftnät due to internal bottlenecks) and a large number of other explanatory variables. In
each of these models, we can isolate the effect of congestion and simulate what the price would have
been in the absence of congestion, the so-called but-for price. On this basis, we can calculate the
expected change in prices in eastern Denmark and Sweden.
3.3.6 How was the case study performed
• Qualitative assessment performed?
Yes
• How?
The study started with an empirical assessment of the economical impact of limiting the transmission
capacity on the Oresund connection
• Who?
Copenhagen Economics
• Quantitative assessment performed?
Yes
• How?
After the claims were verified with a qualitative assessment, a quantitative assessment started to
estimate the economical impact by means of econometrical models
• Who?
Copenhagen Economics
• How?
Simulation of market outcome in the absence of capacity limitations on the Oresund connection for
22 congested hours
• Who?
Nord Pool
3.3.7 Summary
• Svenska Kraftnät regularly experiences internal bottlenecks in the Swedish transmission network in hours
where demand in southern Sweden is high and where this demand must be partly satisfied by power plants
located in northern Sweden. In these situations, transmission capacity at certain locations in Sweden is
insufficient and Svenska Kraftnät typically resorts to limiting export out of Sweden in order to limit demand on
the excess demand side of the bottlenecks. In practice, this is done by artificially limiting transmission capacity
– among others - on the Oresund-connection.
• Overall, we confirm that the Svenska Kraftnäts policy of limiting transmission capacity on the Oresund-
connection has lead to large-scale losses for Danish consumers and to significant gains for Swedish consumers.
• We show that Danish consumers experience large-scale economic losses arising from higher spot prices
estimated to be at least 725 million DKK. Prices increase in east Denmark because capacity limitations very
often lead to congestion such that the marginal power plant must be found among high cost thermal power
plants (in east Denmark) instead of low cost hydro or nuclear power plants (in Sweden). This figure in reality
underestimates the true economic costs as the costs of price volatility have not been quantified.
• We also show that Swedish consumers experience economic gains due to lower costs of network management:
By using capacity limitations Svenska Kraftnät can minimize the use of counter trade, the costs of which would
be passed-on to Swedish consumers. We estimate the gain (avoided costs) passed-on to Swedish consumers to
be 215-265 million DKK.

CWE Price Zone Study TF – Study of existing cases and preparation of the qualitative analysis
27
3.3.8 Relevance for CWE / learning points
• Qualitative assessment
• The approach to structure, categorize and identify congested hours as shown in Figure 13 (Figure 2,
page 19 in the Copenhagen Economics report)
Figure 13 During the qualitative assessment, this approach was used to structure, categorize and identify congested
hours (Figure 2, page 19 of the Copenhagen Economics report).
• Quantitative assessment
• The use of the econometric models to isolate the effect of congestion and simulate what the price
would have been in the absence of congestion, the so-called but-for price.

CWE Price Zone Study TF – Study of existing cases and preparation of the qualitative analysis
28
3.3.9 PZS TF criteria addressed in the case study
The list of criteria defined by the CWE PZS TF, and the extent in which they are addressed in the Energinet case is
schematically indicated in the table below.
PZS TF Criteria Energinet
case
1. Overall welfare effects
2. Security of Supply
3. Congested lines and adequate congestion
treatment
4. Competitiveness
5. Investment signals
6. Benefits and costs of “free” capacity (within zones)
7. Operational costs
8. Transition costs
9. Robustness/stability of zone delimitation
Legenda:
: not addressed : addressed : partly addressed
3.4 Nordic Council of Ministers case (Nordic)
3.4.1 Reference to the report, to whom issued the case study, and to whom performed the case study
The Nordic Council of Ministers case (Nordic)
Case owner: Nordic Council of Ministers
Study report: Congestion Management in the Nordic Market - evaluation of different market models – Final report,
May 2008, Ea Energy Analyses, Hagman Energy and COWI
Case study issued by: Nordic Council of Ministers
Case study performed by: Ea Energy Analyses, Hagman Energy and COWI
3.4.2 Scope and objective of the case study
The question of market splitting versus counter trade has long been the focus of the Nordic discussion regarding
congestion management (CM). The main purpose of this project is to evaluate and analyse these two approaches for
congestion management in the Nordic power market and on the basis of this analysis make concrete recommendations
for a Nordic solution to CM aiming at an optimal balance between com-petition issues and efficiency.
3.4.3 Trigger of the case study
• A uniform standard for congestion management is important for a well functioning power market. The
electrical system in the Nordic countries was from the beginning primarily designed to support national power
demand. The development of an integrated Nordic market, with steady increased power trade and changed
power flows, has pointed out the need for adjustments. The package of five prioritised Nordic grid
reinforcements is one important step forward in this respect.

CWE Price Zone Study TF – Study of existing cases and preparation of the qualitative analysis
29
• The question of market splitting vs. counter-trade remains for all congestions/bottlenecks. This question seems
to be a highly political issue with strong national views – which method is most beneficial and effective for the
future development of the Nordic electricity market; dynamic price areas or few and large areas, with counter
trade. The most controversial issue is how the different models influence the cross-border trade.
• The main purpose of the project is to evaluate and analyse the two approaches for congestion management in
the Nordic power market and on the basis of this analysis present concrete recommendations for a Nordic
solution, aiming an optimal balance between competition issues and efficiency. This requires synthesis of the
many studies already performed but also new analysis of benefits and disadvantages of different alternatives.
3.4.4 Outcome of the case study
The report comes with the following conclusions
• Conclusions regarding efficient resource utilization
• All changes from today’s practice regarding capacity reductions yield a socioeconomic benefit in the
range of EUR 15 – 30 million a year with the 11 area case being the most beneficial. The total benefit
in all the cases is in the same range, but the costs and benefits are distributed quite differently
between stakeholder groups and countries.
• Conclusions regarding competition
• Market concentration can be problematic even when all Nordic areas have common price.
• From 2007 to 2015 two counter-acting trends can be expected regarding the market concentration.
On the one hand will the new decided transmission links further integrate the markets, on the other
hand will mergers and acquisitions probably continue to increase the HHI for the common Nordic
market.
• The PSI analysis shows that during 2007 there were hours in all spot areas when a special company
was necessary or pivotal for clearing of the Elspot market.
• There are no general conclusions whether market splitting or counter trade give the best scope for
profit increases for a generator with market power.
• Many spot areas instead of a few means that more CfD products are needed and an obvious risk for
even lower liquidity and higher “insurance premiums” in the different CfD products.
• Many spot areas means also smaller balancing areas and an increased risk for price spikes in the
regulation market because of market power.
• Conclusions regarding counter trade
• Assuming perfect competition and no strategic bidding, the total social welfare and the final dispatch
will be the same regardless whether market splitting or counter trade is used to manage congestion.
• The main result of these analyses is that in situations when congestion is anticipated, there is more
strategic bidding and less resource efficiency if counter trade is used instead of market splitting. The
main advantage of counter trade is that it enables the use of fewer spot areas and thereby more
competitive retail markets, at least in areas where the customers choose fixed price contracts.
Negative effects of strategic bidding and less resource efficiency have to be compared with negative
effects on the retail competition on a case by case basis in order to reach an optimal balance between
efficiency and competition.
• Our conclusion is that we will not get a more efficient market if Nordic TSOs are obliged to guarantee
that the transmission capacities are always a certain percentage of the normal levels. In a developed
market, changes in dispatch because of changes in the physical transmission capacities are managed
more efficient in the day-ahead market than by the TSOs. A market clearing of the day-ahead market
that reflects the physical realities should be encouraged – not concealed.
• Conclusions regarding possible use of new bid areas
• The most preferable counter trade alternative is counter trade in Elspot.
• A necessary prerequisite for CM by counter trade in Elspot is that there are different bid areas so that
bids in the surplus area can be separated from bids in the deficit area. In that case it is possible to
calculate one uniform Elspot price for the Elspot area and simultaneously perform counter trade in
Elspot that relieves the congestion and gives an effective resource utilisation in the day-ahead
market. All bids in the common Elspot area will meet the common spot price, except the bids that are
counter traded.

CWE Price Zone Study TF – Study of existing cases and preparation of the qualitative analysis
30
• The scope for strategic bidding is reduced compared to an alternative with full counter trade after
Elspot.
• Our conclusion is that the different bid areas in the day-ahead market should transform into different
bid areas in the intra-day and the regulation markets as a natural consequence of counter trade in
Elspot.
• New spot areas and CM by market splitting give even better resource efficiency than new bid areas
and counter trade in Elspot since there is no risk for strategic bidding because of anticipated counter
trade and there are also more efficient long-term price signals. On the other hand, new spot areas
can give negative effects on the competition
• No firm recommendation as to whether the new areas should be established as separate Elspot areas
or separate bid areas within existing Elspot areas
• The most important for resource efficiency is that the present reduced capacity allocations to Elspot
comes to an end. If there is uncertainty regarding the division of a special Elspot area into bid areas or
spot areas, it is better to first establish the new areas as separate bid areas and then later decide if
they are to be changed to separate Elspot areas based on experience of the amount of counter trade
in the common Elspot area.
The report comes with the following four recommendations
1. We recommend that new areas are established as separate Elspot areas or separate bid areas within
existing Elspot areas for CM of cut 2 and cut 4 in Sweden, cut P1 in Finland and the congestions west
of Oslo
2. We recommend the following method as a feasible method for counter trade in Elspot if new bid
areas are established within an Elspot area. The new bid areas shall be established within the Elspot
area so that bids on the deficit and surplus sides of the congestion can be separated from each other.
In the first Elspot calculation, all bid areas are treated as Elspot areas. Congestions between bid areas
are thus managed by market splitting and the result is the same market clearing and the same power
flows as if the bid areas had been Elspot areas. Afterwards, a second calculation is performed for a
certain Elspot area if the first calculation has resulted in different prices for bid areas that are within
that Elspot area. As input, the second calculation uses the same power flows with other Elspot areas
that were established in the first calculation. The purpose of the second calculation is only to establish
a common spot price for the Elspot area and to perform the most cost-effective counter trade to
relieve the congestion that arises as a consequence of the common spot price. The most cost-effective
counter trade is a counter trade that gives the same dispatch within the Elspot area as the dispatch
that was achieved in the first calculation. Thus, the second calculation does not change the power
flows with adjacent Elspot areas. The final result in the Elspot market will be the same price signals in
other Elspot areas and the same dispatch in all areas as if all bid areas had been different Elspot areas
and only market splitting had been used.
3. We recommend that all bid areas and Elspot areas are treated as separate areas in the intra-day
market (Elbas) and the regulation market
4. We do not recommend that the TSOs shall always allocate a guaranteed transmission capacity to the
Elspot market even if the physical capacity is lower because of e.g. outages
3.4.5 Criteria/method used to support this outcome
• Two types of analyses:
• quantitative analyses of the Nordic electricity market assuming ideal competition, using the market
model Balmorel.
• quantitative and qualitative analyses of the ability and incentive to exercise market power by using
market concentration indexes and descriptive “case story” analyses.
• Quantitative analyses focusing on the efficiency of resource utilization under different CM regimes. Two main
issues are analysed:
• How different CM regimes influence the total welfare
• How different CM regimes influence the welfare distribution between countries and between different
interests, i.e., consumers, producers, TSO's and public proceeds in each country

CWE Price Zone Study TF – Study of existing cases and preparation of the qualitative analysis
31
• Quantitative and qualitative analyses of the ability and incentive to exercise market power
• Two indexes of supply-side market concentration have been calculated for the situation in 2007; the
Herfindahl-Hirschman Index (HHI) and the Pivotal Supplier Index (PSI).
• Possible development of the market concentration between 2007 and 2015 is discussed.
• Consequences of different CM regimes for competition and market power in the financial and retail
markets are described.
• Some principle models for market power in wholesale markets in alternative CM regimes are
illustrated.
The Balmorel simulations are carried out for the Nordic power system in year 2015 (with the 5 prioritized links). Counter
trade is handled in the model by first simulating the spot market, in which appropriate transmission constraints are
relaxed, and subsequently reintroducing these constraints and resolving the model. Spot prices and quantities are
output from the first simulation, counter trade prices, from the second and counter trade quantities by the difference
between the two model executions. In essence, the market is simulated by a two step optimization approach.
The following Elspot area divisions are analysed (see also Figure 14):
• 11 Elspot areas (full market splitting - does not involve counter trade)
• 7 Elspot areas with capacity reductions (current Elspot – Baseline)
• 7 Elspot areas with counter trade within national boundaries
• 6 Elspot areas with full counter trade in the Nordic countries
• 4 Elspot areas with full counter trade in the Nordic countries
• 1 Elspot area with full counter trade in the Nordic countries
Figure 14 The analysed Elspot area divisions

CWE Price Zone Study TF – Study of existing cases and preparation of the qualitative analysis
32
3.4.6 How was the case study performed
• Qualitative assessment performed?
Yes
• How?
Quantitative and qualitative analyses of the ability and incentive to exercise market power by
using market concentration indexes and descriptive “case story” analyses
• Who?
Ea Energy Analyses, Hagman Energy and COWI
• Quantitative assessment performed?
Yes
• How?
Quantitative analyses of the Nordic electricity market assuming ideal competition, using the
market model Balmorel
• Who?
Ea Energy Analyses, Hagman Energy and COWI
3.4.7 Summary
• The question of market splitting versus counter trade has long been the focus of the Nordic discussion
regarding congestion management (CM). The main purpose of this study is to evaluate and analyse these two
approaches for congestion management in the Nordic power market and on the basis of this analysis make
concrete recommendations for a Nordic solution to CM aiming at an optimal balance between competition
issues and efficiency.
• Two types of analyses have been performed:
• quantitative analyses of the Nordic electricity market assuming ideal competition, using the market
model Balmorel.
• quantitative and qualitative analyses of the ability and incentive to exercise market power by using
market concentration indexes and descriptive “case story” analyses.
• The report comes with the following four recommendations
• It is recommended that new areas are established as separate Elspot areas or separate bid areas
within existing Elspot areas for CM of cut 2 and cut 4 in Sweden, cut P1 in Finland and the
congestions west of Oslo
• A method is recommended as a feasible method for counter trade in Elspot if new bid areas are
established within an Elspot area
• It is recommended that all bid areas and Elspot areas are treated as separate areas in the intra-day
market (Elbas) and the regulation market
• It is not recommended that the TSOs shall always allocate a guaranteed transmission capacity to the
Elspot market even if the physical capacity is lower because of e.g. outages
3.4.8 Relevance for CWE / learning points
• The method proposed to have counter trade embedded in the Day-Ahead allocation mechanism by
introducing bidding areas within the bidding zones.
• Qualitative assessment
• The combined quantitative and qualitative analyses of the ability and incentive to exercise market
power
• Quantitative assessment
• The quantitative assessment of counter trade by using a market model, assuming ideal competition.
Counter trade is handled in the model by first simulating the spot market, in which appropriate
transmission constraints are relaxed, and subsequently reintroducing these constraints and resolving
the model. Spot prices and quantities are output from the first simulation, counter trade prices, from
the second and counter trade quantities by the difference between the two model executions. In
essence, the market is simulated by a two step optimization approach.

CWE Price Zone Study TF – Study of existing cases and preparation of the qualitative analysis
33
3.4.9 PZS TF criteria addressed in the case study
The list of criteria defined by the CWE PZS TF, and the extent in which they are addressed in the Nordic Council of
Ministers (NCM) case is schematically indicated in the table below.
PZS TF Criteria NCM
case
1. Overall welfare effects
2. Security of Supply
3. Congested lines and adequate congestion treatment
4. Competitiveness
5. Investment signals
6. Benefits and costs of “free” capacity (within zones)
7. Operational costs
8. Transition costs
9. Robustness/stability of zone delimitation
Legenda:
: not addressed : addressed : partly addressed
3.5 Overview of the studies
In this section, the list of criteria defined by the CWE PZS TF, and the extent in which they are addressed by the four
case studies summarized in the sections before, is schematically indicated in the table below.
PZS TF Criteria BNetzA
case
APG
case
Energinet
case
NCM
case
1. Overall welfare effects
2. Security of Supply
3. Congested lines and adequate congestion treatment
4. Competitiveness
5. Investment signals
6. Benefits and costs of “free” capacity (within zones)
7. Operational costs
8. Transition costs
9. Robustness/stability of zone delimitation
Legenda:
: not addressed : addressed : partly addressed

CWE Price Zone Study TF – Study of existing cases and preparation of the qualitative analysis
34
4 Summary of interviews taken Interviews were organized with TSOs that applied a zonal delineation within their country (Statnett (Norway) and
Svenska Kraftnät (Sweden)), and a TSO that is implementing a nodal energy market in its country (PSE-O, Poland). This
allows the CWE PZS TF to take into account and learn from their practical experiences.
A summary of the interviews is provided in the appendix of the report, whereas dedicated questions, formulated by
the CWE PZS TF, and the corresponding answers received from the interviewed TSOs are included in the paragraphs of
this chapter. The TSOs interviewed, have been given the opportunity to review the texts that are included in this
report. They are aware that this report is public material, as is the text of the interview.
4.1 Statnett (Norway) – Q & A
Interview with Statnett, March 6, 2012.
Statnett: Ole Gjerde, Gunnar Nilssen, Jan Hystad
CWE: Rene Beune, Pieter Schavemaker
Currently, Norway has 5 price areas as shown in Figure 15. In 2010, Statnett introduced a fourth and fifth price area in
Norway.
Why was Norway split up in three market areas (before 2010)? 1. Were alternative measures considered to achieve the goals? Why was market splitting chosen instead of
alternative measures? When the power system in Norway was developed in the first half of the 20
th century, it was developed in
several regions. In the 1950’s up to the beginning of the 1970’s the regions were connected. In 1972 an electricity market was introduced for producers. Bidding areas were part of this market. When the electricity market was liberalized in 1992 these areas were kept. The concept of price areas is therefore embedded in the history of Norway and part of the regulation today. It is part of the game, and within the game rules from the start. Hence all players are used to it, and accept it. Possible reasons to introduce new price zones are:
Figure 15 Five price zones in Norway

CWE Price Zone Study TF – Study of existing cases and preparation of the qualitative analysis
35
1 - structural congestions 2 - damage of grid elements or long lasting maintenance activities. 3 - energy deficiency (linked specifically to a hydro system as in Norway) Rule of thumb: if the expected counter trade, in case of damages on grid elements, exceeds 2.5 MEUR per situation, a new market zone is considered. This number is based on experience. For structural congestions this rule of thumb does not hold; the cost for counter trade would well exceed this amount.
2. Based on a qualitative and/or quantitative analysis? Who did the analysis? Can we get a summary of the analyses performed and the outcomes? Analysis were performed by Statnett operational planners. Jan Hystad gave a presentation of the analysis and the outcome.
3. Based on observations of actual network congestions (historical data)? Yes
4. Based on expected market situations and network congestions (scenarios)? Yes
5. Based on an economic assessment: welfare under market splitting versus counter trade? Yes
Why did Statnett introduce two new market areas (leading to, in total, five market areas in Norway)? The reasons to introduce two new market areas had a different origin.
- NO2 was introduced to handle a structural congestion that appeared due to malfunctioning of three subsea AC cables and subsequent lower transmission capacities from West to East through the Oslo fjord in the South of Norway. This resulted on an ad-hoc basis to a reduced capacity on the border to Sweden (i.e. a shift of the internal congestion to the border). Countertrade was not an option in this case, as production is only located on the ‘wrong’ side of the congestion, and the flexibility of the consumption is not sufficient (and more focused on capacity issues (instead of energy issues)). As soon as the three undersea cables are repaired (e.g. replaced, requiring a 3 year project), and the structural congestion has disappeared, the price zone NO2 can be removed.
- NO5 was introduced in order to deal with a foreseen period of energy deficiency. In the legislation in Norway on elspot areas, next to structural congestions, there is a possibility to introduce price areas on a short notice in case a shortage of energy is expected (little rain/water specific to the Norwegian hydro system). Low reservoir levels in Western Norway were foreseen. Higher prices were desired in the deficit areas in order to save water, and to establish higher imports (create expectations on higher prices, making the hydro producers delay their production, and saving water for the real high prices to be expected just before the melting season). In addition a reduction of the consumption is anticipated. The efficiency of this measure in the dry years is roughly 5% reduction in the consumption (in Norway everything is electrically driven: heating, cooking). Different alternative areas were considered: - Option 1: Moving the existing area BKK (Bergen) part of NO1 (instead of NO2) only marginal
rise in prices but no options to control the flows. - Option 2: Moving the existing area even further BKK (Bergen) ++ part of NO1 (instead of NO2)
rationale to have the prices such that the gas power plants in SKL would start - Option 3: having only BKK as a new price zone: problem only one producer market power - Option 4: NO5. West coast area in a new price area. Higher price expected gas power plant would
run. Power flows in the west coast region controlled. - Option 5: smaller NO5 option. No gas power plant included any more. Alternatives were considered by having qualitative assessments (reasoning like above) and the most promising options were analyzed by quantitative analyses (market simulations and loadflow analyses by means of Sintef’s SAMLAST tool). Reality turned out to be better than expected, due to weather conditions. Now the snow melts, the region NO5 is an exporting one. An additional power line is being built and put into operation next year This will increase the import capacity for the region and thus NO5 can be removed.
CWE Price Zone Study TF – Study of existing cases and preparation of the qualitative analysis
36
6. Were alternative measures considered to achieve the goals? Why was market splitting chosen instead of alternative measures? Covered in the answer above.
7. Based on a qualitative and/or quantitative analysis? Who did the analysis? Can we get a summary of the analyses performed and the outcomes? Covered in the answer above.
8. Based on observations of actual network congestions (historical data)? Covered in the answer above.
9. Based on expected market situations and network congestions (scenarios)? Covered in the answer above.
10. Based on an economic assessment: welfare under market splitting versus counter trade? Covered in the answer above.
Experiences with the five market areas
11. Is the situation with five market areas in Norway evaluated after its introduction? What was the outcome? Which method/approach has been applied for that? What is the effect of market splitting on internal and external (cross-border) congestion? The situation has been evaluated. It is checked whether the observations are in line with the expectations from the qualitative and quantitative assessments. Impacts on internal and cross-border congestions are not always straightforward… For example, the introduction of NO2 removed the necessity to lower the cross-border capacity, and therefore the number of cross-border congestions, to Sweden.
12. Is the situation with five market areas in Norway to be re-evaluated? If yes, at what pace? Which method/approach has been applied for that? Re-evaluation is triggered either by commissioning new infrastructure, or when damaged infrastructure is replaced. A market area introduced to handle energy deficiency in dry years is removed after the dry period.
13. How stable/robust are the five market areas? As soon as a structural congestion is solved, a market area can be removed. A market area introduced to handle energy deficiency in dry years is removed after the dry period.
14. Are there any issues with market concentration and/or liquidity due to the smaller market areas in Norway? No, in principle the areas are defined such that there are at least 4 ‘relevant’ market parties, and both types production and consumption, in a zone. Market power studies are not applied on every case, it is based on experience (gained a.o. from former studies). The number 4 is rather specific to Norway.
15. Are the price signals observed up to now in the five markets areas in line with the expectations? Yes, the observations are in line with the general expectation (i.e. the prices as predicted by SAMLAST)
16. Did the volatility of prices in Norway increase after the introduction of the five market areas? No
17. Did other internal Norwegian network congestions appear due to the introduction of the five market areas? No, not because of this.
18. What is the impact of the market split in Norway on the flows in the Nordic region? Were impact studies made before the split? Although in the quantitative assessment, the focus is on the prices and flows within Norway, the flows in the other Nordic countries are simulated and taken into account as well. The introduction of NO2 removed the necessity to lower the cross-border capacity to Sweden, thereby bringing the cross-border flows back to normal levels.
19. How is the transmission capacity computed between the zones? ATC values are computed by Statnett on a daily basis.
20. What is the impact on market splitting (and transmission capacity given to the market between zones) on the location and/or volume of generation reserve? The generation reserve is quite specific in the hydro system in Norway. The balancing market is a voluntary market (60%/70% of the total reserves is provided to the balancing market). Bids on the balancing market are not on a portfolio basis, but more detailed information (station groups). The main congestions are handled by market splitting, the rest by the balancing market (the temporary congestions). Roughly, the following numbers for the balancing market hold: 50% congestion management/counter trade, and 50% balancing.
21. Which other market instruments have been applied/introduced in combination with Market Splitting (e.g. locational Transmission Network Use of System charges, transmission loss adjustment factors, capacity
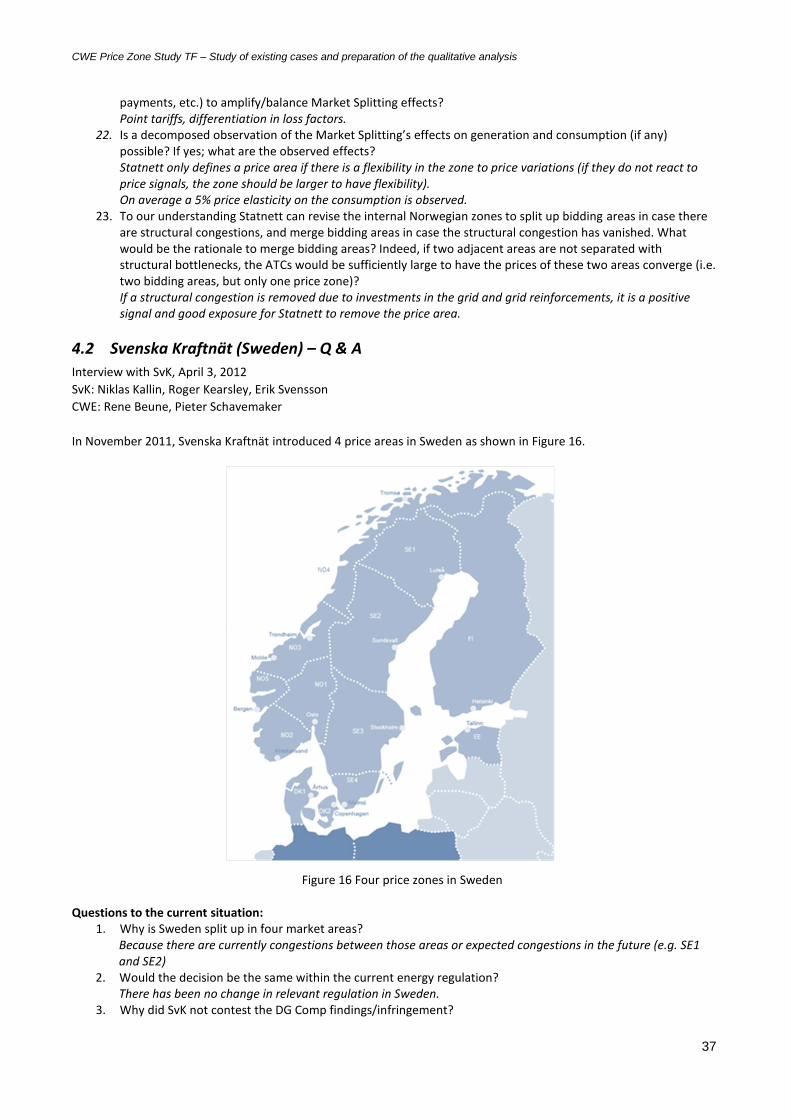
CWE Price Zone Study TF – Study of existing cases and preparation of the qualitative analysis
37
payments, etc.) to amplify/balance Market Splitting effects? Point tariffs, differentiation in loss factors.
22. Is a decomposed observation of the Market Splitting’s effects on generation and consumption (if any) possible? If yes; what are the observed effects? Statnett only defines a price area if there is a flexibility in the zone to price variations (if they do not react to price signals, the zone should be larger to have flexibility). On average a 5% price elasticity on the consumption is observed.
23. To our understanding Statnett can revise the internal Norwegian zones to split up bidding areas in case there are structural congestions, and merge bidding areas in case the structural congestion has vanished. What would be the rationale to merge bidding areas? Indeed, if two adjacent areas are not separated with structural bottlenecks, the ATCs would be sufficiently large to have the prices of these two areas converge (i.e. two bidding areas, but only one price zone)? If a structural congestion is removed due to investments in the grid and grid reinforcements, it is a positive signal and good exposure for Statnett to remove the price area.
4.2 Svenska Kraftnät (Sweden) – Q & A
Interview with SvK, April 3, 2012
SvK: Niklas Kallin, Roger Kearsley, Erik Svensson
CWE: Rene Beune, Pieter Schavemaker
In November 2011, Svenska Kraftnät introduced 4 price areas in Sweden as shown in Figure 16.
Questions to the current situation:
1. Why is Sweden split up in four market areas? Because there are currently congestions between those areas or expected congestions in the future (e.g. SE1 and SE2)
2. Would the decision be the same within the current energy regulation? There has been no change in relevant regulation in Sweden.
3. Why did SvK not contest the DG Comp findings/infringement?
Figure 16 Four price zones in Sweden
CWE Price Zone Study TF – Study of existing cases and preparation of the qualitative analysis
38
There were two complaints to DG COMP from two different Danish energy associations, one in 2003 – which was rejected by DG COMP -, a second one in 2006 by Danish Energy after a high prices period in DK-E in 2005 and a following Swedish study. The Danes did not support the conclusions of the study.
4. Were alternative measures considered to achieve the goals? Why was market splitting chosen instead of alternative measures (e.g. entry/exit tariffs)? Market splitting is the only feasible option capable of managing the internal congestions without restricting cross-border trade capacities, and without unreasonable countertrade commitments. A different market split (splitting hydro and thermal Nordic area) was suggested by the Swedish study but not followed by the other Nordic countries. Entry/exit tariffs were not considered, in as far as this refers to cross-border tariffs, it’s because any such tariffs (previously existing) had been removed in conjunction with EU rules – the “pancaking” issue.
5. Based on a qualitative and/or quantitative analysis? Who did the analysis? Can we get a summary of the analyses performed and the outcomes? In 2009 Swedish government instructed SvK to start the price zone subdivision process in Sweden. So SvK did the analysis. SvK considered quantitative analyses not to be practical because of lack of adequate zonal market data (historical NPS market data does not have the necessary locational information and bidding behavior does not reflect the new situation).
6. Based on observations of actual network congestions (historical data)? Yes. Voltage problems are the major cause of congestions, not thermal overloadings.
7. Based on expected market situations and network congestions (scenarios)? Yes, also. Expected future congestions were the reason for a SE1/SE2 split
8. Based on an economic assessment: welfare under market splitting versus counter trade? No. fundamental principles and market functioning considerations, obviously made concrete by the DG COMP case triggered the market split, not welfare considerations. Although, earlier studies have indicated that the more bidding areas the higher the overall social welfare will be. This can to some extent be considered intuitive and was a factor, even if not explicitly mentioned in our reports/decisions.
Experiences with the four market areas
9. Is the situation with four market areas in Sweden evaluated after its introduction? What was the outcome? Which method/approach has been applied for that? What is the effect of market splitting on internal and external (cross-border) congestion? Not yet, but the Regulator – in collaboration with SvK, the Swedish Competition and Consumer Authorities – is in the process of analyzing the effects for the first winter. A report will be presented in mid May. Detailed preliminary results are explained hereafter. However it is obvious to SvK that the grid is used closer to its maximum and more efficient to the market players so that the areas with the highest price gets all the power and the areas next in price gets what is left. A big difference from before with prorate allocation.
10. Is the situation with four market areas in Sweden to be re-evaluated? If yes, at what pace? Which method/approach has been applied for that? No plans at present. However, SvK reports to DG COMP on an annual basis (a quarter yearly basis was applied during the interim period before the bidding areas were implemented). These reports have been made available to the TF.
11. How stable/robust are the four market areas? According to SvK’s Commitment with DG COMP, market areas are to be able to change with 3 months’ notice if physical conditions require it. However with regard to stability for the market, especially the financial market (CfD etc.), SvK’s initial judgment was that the present subdivision into 4 zones will be flexible enough and that no change will be needed during the foreseeable future.
12. If grid reinforcement is put in operation, thereby removing the structural congestion which underlies a certain price area, will the price area be removed or will the ATC be increased? ATC is increased.
13. Are there any issues with market concentration and/or liquidity due to the smaller market areas in Sweden? The preliminary results of the winter review report concluded that HHI indices on resulting price areas did not increase. SE4 is the area mostly endangered in this respect, however it's interconnections with SE3, DK2, PL and GE mitigate the market concentration effects.
14. Are the price signals observed up to now in the four markets areas in line with the expectations? Yes.
15. Did the volatility of prices in Sweden increase after the introduction of the four market areas?

CWE Price Zone Study TF – Study of existing cases and preparation of the qualitative analysis
39
Marginally. In line with expectations. 16. Did other internal Swedish network congestions appear due to the introduction of the four market areas?
Not yet. This might become an issue with new interconnections, increased power flow due to increased trade and RES.
17. What is the impact of the market split in Sweden on the flows in the Nordic region? Were impact studies made before the split? Market model takes only the bidding areas into account. It does not take the grid into account. This leads to transit flows that deviate from optimum. Example: Outcome from PX is that power from SE1 will primarily go to FI and then back to Sweden (SE3). When this flow reaches its maximum the capacity between SE1 and SE2 will be used. This is managed in the operating hour by the control Centre. Yes, some studies where made (POMPE). The study was performed by the Energy Markets Inspectorate (NRA), Svenska Kraftnät (TSO), Swedenergy (energy industry org.) and the Confederation of Swedish Enterprise (consumers). The main conclusion was that a division between thermal and hydro power on a Nordic basis would create efficiency gains. Such division would go through cross-section 2 (between SE2 and SE3) in Sweden.
18. How is the transmission capacity computed between the zones? The restriction between the bidding areas is mostly restricted due to voltage collapse. Also angle stability, thermal capacity (also in 130 kV) etc. is calculated. http://www.nordpoolspot.com/Global/Download%20Center/TSO/entsoe_Principles%20-for-determining-the-transfer-capacities-20120328.pdf
19. What is the impact on market splitting (and transmission capacity given to the market between zones) on the location and/or volume of generation reserve? Location of bidding zones is where the physical restrictions have been for some time. These bottlenecks have also previously been managed with restrictions on import/export trade capacity, taking into account for example the volume and location of reserves.
20. Which other market instruments have been applied/introduced in combination with Market Splitting (e.g. locational Transmission Network Use of System charges, transmission loss adjustment factors, capacity payments, etc.) to amplify/balance Market Splitting effects? CfDs have been introduced for the new Swedish bidding areas. In addition, the locational signals in the tariff have been softened.
21. Is a decomposed observation of the Market Splitting’s effects on generation and consumption (if any) possible? If yes; what are the observed effects? Not locally and not yet. (The winter review report analyzed effects on spot market prices, impact on retail and wholesale market as well as on the financial market but it did not study generation and consumption separately, nor is it foreseen)

CWE Price Zone Study TF – Study of existing cases and preparation of the qualitative analysis
40
4.3 PSE-O (Poland) – Q & A
Interview with PSE-O, March 23, 2012.
PSE-O: Tomasz Sikorski, Robert Paprocki, Konrad Purchała, Tomasz Gapys, Andrzej Midera.
CWE: Rene Beune, Pieter Schavemaker
Currently, Poland is implementing a nodal energy market (LMP, Locational Marginal Pricing). The Polish transmission
grid is shown in Figure 17.
Switching from a zonal to a nodal energy market 1. What was the trigger for Poland to alter the market design?
Implementation of a nodal system in Poland is strongly determined by structural problems that are present in the current zonal energy market model. These problems are mainly due to the lack of the accurate representation of the Polish transmission network in the clearing of the Energy and Ancillary Services Markets (aggregate representation of resources). The problems with zonal market approach are deepened by specific conditions in which the Polish market operates: - Inelastic and unevenly distributed (mainly in the south) coal-fired power plants (90%, > 6 hours start-up
time, >50% minimum load) - Weakly developed transmission grid especially in the north, with voltage stability problems - Significant unplanned power flows through the Polish system (from the west to the south) - Increase in volatile RES generation. Polish experience from market-based operations of the power system clearly indicates that the current zonal market model fails to meet the requirements for an efficient market design for Poland, and does not trigger the correct decisions of market participants. The following main problems are identified for the Polish system:
There is a divergence between the market model where the commercial activities take place (i.e. “copper plate”), and the underlying physical grid that is governed by the laws of physics. Sale and purchase decisions of market participants are taken without consideration of the transmission and generation constraints, leading to operational problems that must be tackled by the TSO. Most of these TSO measures entail costs, that are further passed on to all consumers via transmission tariffs. However, these costs are not allocated to the ones responsible for incurring them, but are averaged-out (socialized).
Figure 17 The Polish transmission grid

CWE Price Zone Study TF – Study of existing cases and preparation of the qualitative analysis
41
Because of the above, price signals are distorted. Single price, or even several zonal prices, are not able to correctly reflect the costs of delivering electrical energy to end consumers at a particular location. These costs are constantly changing depending on the topology of the transmission system, types of generating units on-line, and load and weather conditions. These costs for delivering at a particular location can never be fully reflected in a zonal model.
As a consequence of the above, the Polish power system and both its transmission and generation resources would be used inefficiently. The benefits to consumers, the guarantee of the lowest possible energy cost would not be fully realized. One of the examples is a separation between securing the energy and reserve adequacy, making co-optimization of these two commodities impossible.
In Poland, after implementing in 2001 the current zonal market design similar to the one that prevails in Europe, PSE-O very quickly noticed the materialization of its flaws and imperfections concerning its ability to ensure system security and economic efficiency. The main reasons were the inherent approximations necessary in the zonal approach, including socialization of various costs needed to run the power system securely and deliver energy to end consumers. PSE-O immediately started an effort to redesign that market model and concluded that LMP-based market was the right way to go. This was back in 2004. Unfortunately, at that time PSE-O was unsuccessful in finding support from the stakeholders. However, PSE-O was continuously experiencing the same problems that kept coming over and over again. In 2010 the LMP project has finally started. As Poland already has a centralized dispatch today, implementation of LMP-based market is easier, however implementation of internal FTRs markets would be a revolutionary step, challenging for market participants.
2. Were alternative measures considered to achieve the goals? Splitting up PL in two or more zones will not work due to the nature of problems, e.g. frequently changing pattern of network constraints ( no big study has been performed to justify this because the situation is obvious; at the end of the 90s a study was performed though, which confirmed these expectations). The zonal approach can help, but is not the complete solution for the Polish problems. Moreover, it adds complexity related to proper size of zones and their reconfiguration. LMP is linked to FTRs which are hedging instruments for market participants and at the same time TSO’s instruments for offering transmission resources to market participants. LMP facilitates integration of CHP and wind farms in the energy market. LMP is the only complete solution to their problems. Future proof in terms of renewable generation (RES priority, CHP priority) generation will become less flexible, and demand response is foreseen to provide the necessary flexibility (pricing mechanism must be incentive compatible and locational). In short: alternative options are exhausted, and LMP addresses all the issues that they have.
3. Why was a nodal market preferred over a zonal one, e.g. with smaller zones (market splitting)? see answer at Q2. LMP market reflects the physics of the power system much better than zonal flow-based, i.e. market schedules are feasible and commercial exchanges much closer to real power flows. In LMP there is no need for redispatching and higher reliability margins, so LMP market allows to utilize resources, i.e. grid, generation and demand response, in a more efficient way. The whole transmission capacity is allocated in the market clearing process.
4. Based on a qualitative and/or quantitative analysis? Who did the analysis? Can we get a summary of the analyses performed and the outcomes? In the frame of the market redesign project, a number of simulations has been carried out. These indicate the following potential benefits of implementing LMP-based market in Poland:
Lower energy supply costs to end users. The gain in aggregated weighted marginal costs of energy supply ranges from 1.22% to 1.91%, which amounts to some 75 mln EUR per year.
Maintaining the prices in Poland at a similar level to the current one.
Only limited differentiation of average locational prices throughout the different demand aggregation areas in Poland.
Significant variation of the hourly energy prices in particular nodes in case of active constraints.
Increase of transmission capacity available for commercial transactions thanks to more detailed grid modeling, and less needs for approximations and the entailed reliability margins
Consistency between the price signals and the power system security, leading to such behavior of market participants that are beneficial both for them and the power system.
Ability to integrate more intermittent generation in a secure way.
see also answer at Q1 and Q2.

CWE Price Zone Study TF – Study of existing cases and preparation of the qualitative analysis
42
5. Based on an economic assessment? welfare under nodal versus zonal system? see answer at Q4. Please see also report “Europe’s Challenge: A Smart Power Market at the Centre of a Smart Grid” prepared by Climate Policy Initiative.
6. Was flow-based in combination with a zonal system considered as an alternative to embed a more detailed grid modeling in the market design? If so, in what aspects did it not answer the needs? See answer at Q2. Flow-based is the preferred solution for Poland, to incorporate constraints in the cross-border capacity allocation. Flow-based Market Coupling and LMP-based market belong to the same group of market models. Both are based on marginal pricing, both are flow-based. The main difference is the size of location – node or set of nodes. However, inherent zonal approximations entail the need to use DC models for the transmission networks representation in market clearing process, which limits the possibility of a correct representation of the system security requirements in this process and is therefore not sufficient to the Polish system.
7. Have other market instruments been considered (e.g. locational Transmission Network Use of System charges, transmission loss adjustment factors, capacity payments, etc.) to introduce locational effects? They have not been considered due to the fact that they are dedicated to the long term system run. PSE Operator has decided to start works on a LMP energy market to address short term issues. See also answer at Q2.
8. Has the transition cost for going to a nodal market been compared to that of an improved zonal system? If so, how do the two relate to one another? Implementation has not been compared to a zonal system (as it is not an option). The transition cost is not known in detail, but should be ‘normal’, as quite some changes were needed for the current system as well, e.g. - need to have observability of the 110kV network (sub-transmission one) - full network model / IT systems The cost for the market is unknown. At this stage, the transition cost for the market has not been assessed. However, it is expected that these costs will be covered by the market efficiency gain achieved in one year (based on the experience from U.S. ). After implementation, a 1,5% yearly efficiency gain is expected in the area of the total cost of energy delivery to consumers. It gives roughly 100 MEUR/yr.
9. Does the nodal system provide the TSO with more opportunities to have control on renewable production compared to a zonal system? RES can be integrated in a more efficient way, due to: - detailed ramp rates and start-up characteristics of the thermal units can be taken into account in the
capacity allocation - generation will become less flexible, and demand response is foreseen to provide the necessary flexibility
(pricing mechanism must be incentive compatible). - Existing network capacity can accommodate higher volumes of RES because of more detailed system
representation in market mechanisms allowing the use of smaller security margins. 10. How does the TSO determine the volume of obligation FTRs?
TSO conducts Simultaneous Feasibility Test for FTR allocation and auction process. All FTRs outstanding at a given time must be simultaneously feasible. In other words, the transmission system under security constrained conditions must be able to accommodate all the potential energy flows represented by an outstanding set of FTRs. The system constraints used in the modeling process for feasibility will be consistent with the model used in determining the Day-Ahead LMPs.
11. Is there a difference in need for regulation in a zonal or nodal market? Is market power less an issue in a nodal market than in a zonal market? If the reason for market power is the transmission grid, you do not solve it by making the area bigger. If the reason for market power is the lack of competitors in a congested zone, you do not solve it by a larger zone, but by having larger capacities between the zones. The issue of market power is the same in the zonal and nodal system and in both models proper market power mitigation measures must be implemented, however in LMP model the market power can be identified more accurately because of transparent picture of the market, provided there is a valid reference base to the real variable costs. What is also important to stress, under the zonal approach more incentives may exist to exercise market power. There are more situations in which costs are socialized rather than directly allocated to resources that cause congestion. Typical example: incentive to over-schedule at congested intra-zonal locations (so called Dec game).
CWE Price Zone Study TF – Study of existing cases and preparation of the qualitative analysis
43
When we would like to draft a procedure to review the zonal delineation in CWE (to be applied now and in the upcoming years as well), how should we take into account the nodal Polish system as a part of the zonal European system?
12. How is the link established between the Polish nodal prices and the zonal European prices by means of the European market coupling system? Simplified representation of nodal market in zonal market clearing - Nodes aggregated into zones - Only main transmission constraints reflected Separate nodal market clearing that includes results from zonal market clearing (i.e. energy exchange between and within zones) The polish market price will be defined by the PX price (all XB exchanges go through the PX)
13. What are the capacity constraints that Poland defines with the surrounding zones? See answer Q12. Capacity constraints are determined on the basis of full network model.
Operational aspects
14. When will the nodal energy market be operational? The first phase of implementation, i.e. the LMP for balancing, is scheduled for 2015.
15. What can we learn from the Polish approach towards traders when adjusting the market design? Market participants are not happy with the current Polish market design, mainly due to the fact that significant part of the energy delivery cost is socialized. Moreover, market participants are used to a centralized dispatch already, which probably makes the step towards a nodal system a reasonable and acceptable one.
16. What can we learn from the Polish approach towards regulators when adjusting the market design? The regulator strongly supports market design which is in line with secure system operation but at the same time the implementation of Target Model for Europe is the main aim. This makes implementation of LMP based market more complex.
4.4 Recap In general what we have learned from the interviews (summarized in the sections before and in the appendix), is that the history and country-specific situations determine to a large extent the decisions taken with regard to zonal/nodal/zone delineation. Common for both Sweden and Norway is the application of a market split in order to manage inner-country congestions by applying the split at the place of the congestion. In Norway, managing congestions that are expected in the future, due to shortage of energy stock, are another reason to introduce a market split. This application is specific for the Norwegian hydro system. In Poland zone delineation can help, but it is understood that Locational Marginal Pricing is the only complete solution to the problems they are facing now, and in the future. As Poland already has a centralized dispatch, the step towards a nodal system is for them a ‘logical next step’.

CWE Price Zone Study TF – Study of existing cases and preparation of the qualitative analysis
44
5 The function of a market split on congestion management From the case studies as well as the interviews, we have identified the general function of a market split on congestion
management as follows. A market split makes additional exchanges subject to an allocation mechanism. This will be
elaborated upon in this chapter.
The reasons to apply a market split, and to make additional exchanges subject to an allocation mechanism, that we
have identified so far are in order to:
1. manage inner-country congestions, by applying the split at the place of the congestion
2. manage congestions that are expected in the future, due to shortage of energy stock
3. manage a congestion in a bidding area caused by loop flows, by applying a market split in a neighbouring
bidding area at the path of the exchange (not used up to now)
As the second one is quite specific to the Norwegian hydro system, and is touched upon in section 4.1, only the first
and third reason to apply a market split are addressed in this chapter. Especially the latter one will receive some more
attention in this report, as this one is not currently applied, and has not been (satisfactorily) addressed in the case
studies.
5.1 Exchanges inside and outside the allocation mechanism
Electrical power systems can be regarded as one of the most complex systems designed, constructed and operated by
humans. The consumers are supplied with the requested amount of active and reactive power at constant frequency
and with a constant voltage. Loads are switched on and off continuously, and because electricity cannot efficiently be
stored in large quantities, the balance between the amount of generated and consumed electricity has to be
maintained by control actions.8 The power system frequency, 50 Hz in Europe, is a common parameter in the whole
synchronous zone and is the measure to quantify the imbalance between production and consumption. On the other
hand is the voltage a local parameter; injection of reactive power will increase the voltage only in the vicinity of the
reactive power injection.
The electrical power system connects sources and sinks of electrical power with one another. The flows in an AC power
system fan out in accordance to Kirchoff’s laws (they follow the way of least electrical "resistance" in the network). The
so-called active power flows in the grid (the MWs) cannot be controlled, unless Kirchoff’s law is ‘tricked’, for example
by using Phase Shifting Transformers (PSTs) or when fully controllable DC interconnections are used within the AC grid.
The observation that most bidding areas coincide with country borders lies within the history of the power systems
and the interconnected power system. Indeed, power systems started as local systems, and they have grown from
municipality, province/county, to country-wide networks, and towards the interconnected power system that we have
today. The interconnections between the national power systems were originally designed for mutual support only,
and not for the exchange of large volumes of power between the countries. As such, the inner-country power grids
were rather well-developed compared to the tie-lines that interconnected them. Even though the inner-country grids
were well developed for internal use, they were originally not constructed for the large exchanges that cause today’s
inter-country as well as inner-country flows/congestions.
The zonal approach comes down to a ‘copper plate’ within the bidding area. This means that any electricity consumer
in a bidding area is able to contract with any generator in the same bidding area without limitations due to network
constraints. When congestion does appear TSOs can apply redispatch or countertrade in order to relieve the
congestion and to maintain the grid security: 9
Redispatch means that the TSO instructs particular generators – whose power injection contribute to the
congestion – to generate less power than planned. At the same time other generators – whose generation
relieves congestion – are instructed to generate more power. The selection of generators for redispatching is
on the one hand based on their location in the network and on the other hand either on their cost (where the
8 Schavemaker, Pieter, and Van der Sluis, Lou.: Electrical Power System Essentials, Wiley, April 2008, ISBN: 978-0-470-
51027-8. 9 Based on the definitions given in: Relevance of established national bidding areas for European power market
integration – an approach to welfare oriented evaluation, October 2011, Frontier Economics and Consentec.

CWE Price Zone Study TF – Study of existing cases and preparation of the qualitative analysis
45
adequacy of costs is reviewed periodically; so-called cost-based redispatch) or on prices (based on bids
submitted by the generation companies; so-called market-based redispatch).
Countertrading means that the TSOs act on short-term markets in order to buy and sell power in bidding areas
such that the corresponding inter-area power exchange relieves congestion. In contrast to redispatching,
countertrading is a zonal activity which does not explicitly address specific generators (although the bidding
areas may be smaller than those of the regular, e.g. day-ahead, market).
In between bidding areas however, the capacity of the transmission grid is in principle limited and the use of it is
auctioned by either an explicit or implicit allocation mechanism. This means that any electricity consumer in a bidding
area is only able to contract with any generator in another bidding area through a cross-border capacity allocation
mechanism.
The balance between Security of Supply on the one hand and market facilitation on the other is the continuous form of
risk management that the TSOs need to apply when they calculate the available capacity for the cross-border
allocation mechanisms, reaching from year-ahead to intraday markets, as shown schematically in Figure 18.10
Figure 18 Congestion management in the broadest sense
The bottomline of congestion management is that the TSOs determine the level of available transmission capacity
such, that the market is facilitated in the best possible way while at the same time safeguarding the security of supply.
For a better understanding of the interaction between the physical flows and the impact of market behavior inside and
between bidding areas, a clear distinction between commercial and physical congestions is needed.
A physical congestion can arise in real-time when the operational security is at stake; operational security is defined in
Annex I of Regulation (EC) No 714/2009 as ‘keeping the transmission system within agreed security limits’. 11
The
operational security is at stake, when the n-1 criterion is violated. The n-1 criterion is a common operational-security
criterion whereby the electricity system as a whole should be able to withstand the sudden loss of any single
component – generating unit, transmission line or switching station – without experiencing a blackout of large areas of
the system. 12
Please note that the n-1 criterion covers more than thermal overloading only; also voltage stability can
be within the scope.
The cross-border capacity calculation, or (in line with the wording in Figure 18) the determination of available
transmission capacity, should be such that the amount of cross-border capacity provided to the allocation mechanism
should not lead to an expected physical congestion. This limitation of available cross-border capacity to the extent that
10
Schavemaker, Tessensohn, Beune, “Optimal European Electricity Market Design Under Future Grid Developments”,
European cross border power trading forum, Berlin, May 2011. 11
http://eur-lex.europa.eu/LexUriServ/LexUriServ.do?uri=OJ:L:2009:211:0015:0035:EN:PDF 12
Swedish Interconnectors – Comp Case No 39351; Background Explanations Submitted By Svenska Kraftnät Regarding
The Offered Commitments For This Case, October 1st, 2009.
determination ofavailable
transmissioncapacity
capacityallocation
congestionforecast
if needed:congestion relief
Bids /reservations
Generationschedules
Timeline
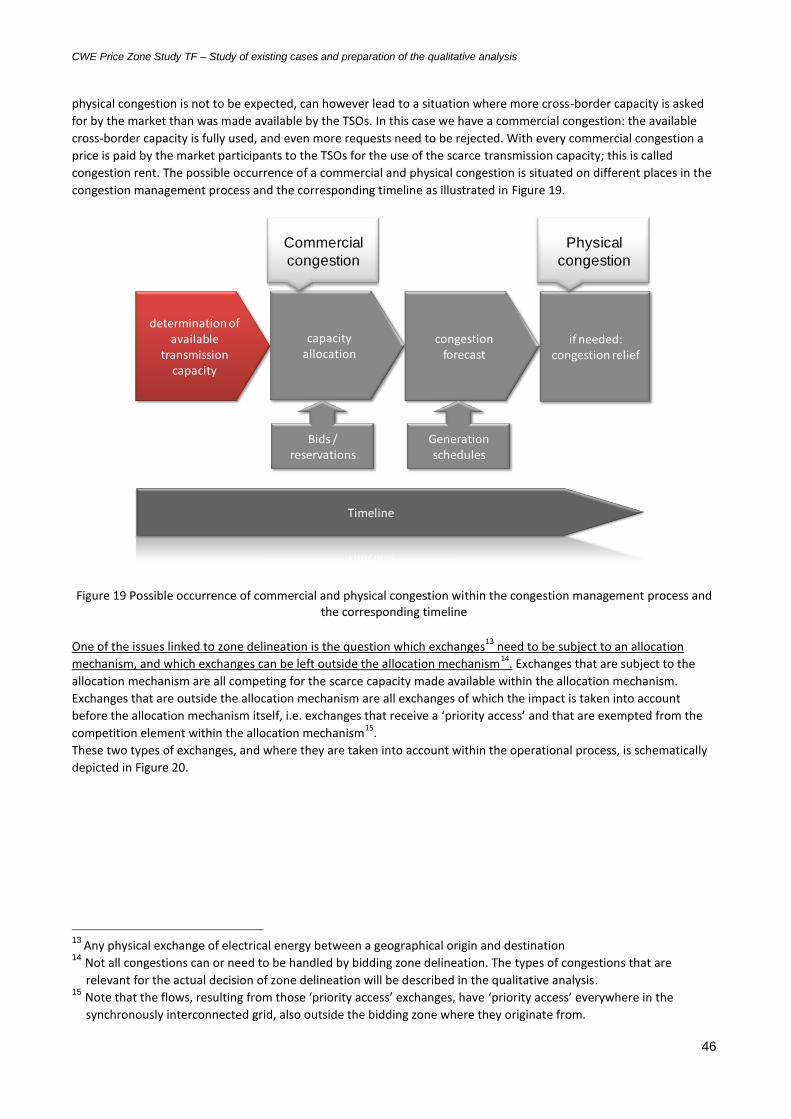
CWE Price Zone Study TF – Study of existing cases and preparation of the qualitative analysis
46
physical congestion is not to be expected, can however lead to a situation where more cross-border capacity is asked
for by the market than was made available by the TSOs. In this case we have a commercial congestion: the available
cross-border capacity is fully used, and even more requests need to be rejected. With every commercial congestion a
price is paid by the market participants to the TSOs for the use of the scarce transmission capacity; this is called
congestion rent. The possible occurrence of a commercial and physical congestion is situated on different places in the
congestion management process and the corresponding timeline as illustrated in Figure 19.
Figure 19 Possible occurrence of commercial and physical congestion within the congestion management process and
the corresponding timeline
One of the issues linked to zone delineation is the question which exchanges13
need to be subject to an allocation
mechanism, and which exchanges can be left outside the allocation mechanism14
. Exchanges that are subject to the
allocation mechanism are all competing for the scarce capacity made available within the allocation mechanism.
Exchanges that are outside the allocation mechanism are all exchanges of which the impact is taken into account
before the allocation mechanism itself, i.e. exchanges that receive a ‘priority access’ and that are exempted from the
competition element within the allocation mechanism15
.
These two types of exchanges, and where they are taken into account within the operational process, is schematically
depicted in Figure 20.
13
Any physical exchange of electrical energy between a geographical origin and destination 14
Not all congestions can or need to be handled by bidding zone delineation. The types of congestions that are
relevant for the actual decision of zone delineation will be described in the qualitative analysis. 15
Note that the flows, resulting from those ‘priority access’ exchanges, have ‘priority access’ everywhere in the
synchronously interconnected grid, also outside the bidding zone where they originate from.
determination ofavailable
transmissioncapacity
capacityallocation
congestionforecast
if needed:congestion relief
Bids /reservations
Generationschedules
Timeline
Physical
congestion
Commercial
congestion

CWE Price Zone Study TF – Study of existing cases and preparation of the qualitative analysis
47
Figure 20 Exchanges within and outside the allocation mechanism
To summarize: In order to prevent physical congestion, not only the determination of available transmission capacity
itself is a key decisional element in the congestion management chain, the selection of exchanges that should be
subject to the allocation mechanism is one as well16
. Of course the occurrence of structural congestion in relation with
high redispatch and countertrading costs is a key criterion in selecting those exchanges.
5.2 Market split to manage inner-country congestions
Applying a market split in order to manage inner-country congestions is the most common reason to apply a market
split. The principle is illustrated in Figure 21.
Figure 21 A market split in order to manage inner-country congestions
In this case, the exchange formerly having a priority access to the transmission grid and leading to physical
congestions, is subjected to an allocation mechanism by applying a market split. By the determination of available
16
Today some large exchanges are due to priority access of certain sources of generation which are not subject to an
allocation mechanism.
determination ofavailable
transmissioncapacity
capacityallocation
congestionforecast
if needed:congestion relief
Bids /reservations
Generationschedules
Timeline
Physical
congestion
Exchanges
within the allocation
mechanism
Exchanges
outside the allocation
mechanism
Commercial
congestion

CWE Price Zone Study TF – Study of existing cases and preparation of the qualitative analysis
48
transmission capacity for the allocation mechanism, expected physical congestions are now prevented by the
introduction of possible commercial congestions.
5.3 Market split to manage a congestion in a bidding area caused by loop flows
Market split to manage a congestion in a bidding area caused by loop flows is not applied today. Nevertheless, the
CWE PZS TF would like to touch upon this possible reason in their qualitative and possible quantitative analysis.
Indeed, this section is mainly triggered by two of the case studies (BNetzA and APG): it was felt that this specific reason
to apply a market split has not been (satisfactorily) addressed in the case studies.
In the sections below, it will be explained how a market split can be applied to manage a congestion in a bidding area
caused by loop flows, by applying a market split in a neighbouring bidding area at the path of the exchange.
5.3.1 Transit flows and loop flows
In an interconnected electricity transmission system there are multiple parallel routes in which electricity can flow
from generation to load. Where parallel routes exist, electricity will always divide and flow in each route in inverse
proportion to the impedance (or resistance) presented by that route. It is therefore the laws of physics that determine
power flows (and not market trading or geographic boundaries). In an ideal world, in the absence of any trading
between neighbouring TSO control areas there would be no flows across the interconnecting circuits. However there
will always be some flows dictated by the relevant impedance (resistance) of the parallel routes (and also the location
and magnitude of generation and demand). Such flows are categorised as either Loop Flows or (Unscheduled) Transit
Flows.
Transit flows and loop flows are frequently used terms. Quite often, however, the terminology is mixed up. This is
probably due to the fact that the origin of loop flows and transit flows is the same: a strong geographical concentration
of sources and/or sinks in the grid. However, the two concepts should be distinguished from an allocation point of
view.
Figure 22 Loop flows represented by the red arrows in the figure on the left,
and transit flows represented by the red arrows in the figure on the right
For the purpose of this study, loop flows are defined as physical flows over other bidding areas caused by an exchange
of which the origin and destination are located within one bidding area, as shown in Figure 22 (left). As both the origin
and destination of the exchange are located within the same bidding area, the exchange is outside the allocation
mechanism. Therefore, the impact of loop flows is taken into account before the allocation mechanism itself, i.e. the
loop flows receive a ‘priority access’ and are exempted from the competition element within the allocation
mechanism.
For the purpose of this study, transit flows are defined as physical flows over third bidding areas caused by an
exchange of which the origin and destination are located in two different bidding areas, as shown in Figure 22 (right).
In this case, the exchange is subject to the allocation mechanism and is in competition with all the other cross-border
exchanges that want to make use of the scarce capacity.

CWE Price Zone Study TF – Study of existing cases and preparation of the qualitative analysis
49
By splitting up a bidding area, loop flows can be altered into transit flows, as shown in Figure 23.
Figure 23 Introducing a market split between the area of origin and
the area of destination changes loop flows into transit flows
Vice versa, by merging bidding areas, transit flows can be altered into loop flows, as shown in Figure 24.
Figure 24 Merging bidding areas changes transit flows into loop flows
It is important to note that although loop flows may be changed into transit flows, by adding a split between the area
of origin and area of destination, this does not change the physical flows themselves unless the capacity made
available over the new split is limiting the exchange.
The flows in the grid are the result of all the exchanges in the grid and Kirchoff’s laws. As such, the physical flows
induced by exchanges can have a relieving or a straining effect on physical congestions in the grid, as illustrated in
Figure 25.

CWE Price Zone Study TF – Study of existing cases and preparation of the qualitative analysis
50
Figure 25 A situation where the loop flow relieves the line loading (left; a tie-line is indicated in yellow with the arrow
indicating the direction of the physical flow) and where it increases the loading of the line (right)
The intention of this section is only to describe how loop flows can be transformed into transit flows (and vice versa),
irrespective of whether they have a positive or negative effect. Or in other words: to describe how exchanges can be
made subject to an allocation mechanism by creating a market split, or how exchanges can be withdrawn from the
allocation mechanism by merging bidding areas.
5.3.2 Market split to manage a congestion in a bidding area caused by loop flows and the need for flow-based capacity calculation and allocation
If exchanges that are outside the allocation mechanism - all exchanges of which the impact is taken into account
before the allocation mechanism itself, i.e. exchanges that receive a ‘priority access’ and that are exempted from the
competition element within the allocation mechanism – influence to a significant extent the available cross-border
capacity that can be made available to the allocation mechanism, an efficient congestion management cannot be
established. This is irrespective of the fact whether or not these flows help to relieve a physical congestion in real time.
An example of a situation where exchanges receive a ‘priority access’, and are exempted from the competition
element within the allocation mechanism, and that influence to a significant extent the available cross-border capacity,
is in the case of a large loop flow.
The conversion of the loop flow into a transit flow by splitting the concerning bidding area, as illustrated in Figure 23, is
then a necessary condition for fair competition on scarce capacity between exchanges. It is however in itself not a
sufficient condition, as it depends on the amount of commercial capacities made available as well, as illustrated in the
example in Figure 26. We would like to underline that the configuration in the drawing - the large bidding area and two
small neighboring ones - have been chosen for pragmatic reasons only: not only small(er) bidding areas are impacted
by loop flows.
Figure 26 Market split in order to limit the loop flow observed in the base scenario.
Scenario I: capacity between the new bidding areas is too high to have an impact on the loop flow. Scenario II: capacity between the new bidding areas is now limiting the exchange and thereby the loop flow.
In this example, a large loop flow induced by an exchange of which the origin and destination are located in the same
bidding area, reduced the cross-border capacity with a neighboring bidding area to a zero value. Or in other words: the
preloading of the grid due to the expected loop flow is taken into account in the capacity calculation, and in the case of
Exchange
Physical
flow
Congestion
ATC = 0
-1000
500
+1000
500
Base scenario
ATC = 1500
Scenario I: split with high ATC
ATC = 0
-1000
500
+1000
500 250250
-500
+500
ATC = 500
Scenario II: split with low ATC
ATC = 0

CWE Price Zone Study TF – Study of existing cases and preparation of the qualitative analysis
51
the small neighboring bidding area, even by reducing the cross-border capacity to zero, expected n-1 violations in the
internal grid of the bidding area cannot be prevented. A market split in the bidding area where the exchange has its
origin and destination (the market split is applied at the path of the exchange) can be introduced to make the
exchange, being the cause of the loop flow, subject to the regional allocation mechanism. If, however, the capacity
between the two newly introduced bidding areas is chosen too high (by setting a bilateral ATC value between the two
bidding areas instead of a regional coordinated value), the exchange is not limited and the market split brings no
effects (scenario I). In case a regional coordinated capacity calculation is applied, leading to a reduced ATC between
the two new bidding areas, the exchange is limited, leading to a commercial congestion between the two new bidding
areas; in this case, the transit flow has reduced significantly and the n-1 violations in the regional grids are relieved
(scenario II).
The situation as depicted in Figure 26 is rather specific for the ATC world, where the capacity split over the borders is
TSO driven. Market preferences and prices cannot be taken into account as they are not known at the time of the
capacity calculation. This shortcoming (the fact that under ATC the capacity split over the borders is TSO driven) is
addressed by the FB methodology, where a FB capacity domain is provided to the market, and where it is up to the
market to decide how this capacity is used and by whom. Indeed, under FB the capacity split is market driven (at the
time of allocation).
Only with a flow-based coordinated capacity calculation and allocation, a true competition between all relevant
exchanges for the scarce capacity can be established. FBMC (Flow-Based Market Coupling) – being the target
coordinated capacity calculation and allocation model for the highly-meshed European grid – matches perfectly well
with the concept of market splitting, for the following reasons:
- The FB constraints (CBCOs, critical branches monitored under certain grid situations) are in principle not
linked to where a market split, i.e. a border between bidding areas, is located. This means that the capacity
calculation in essence remains unchanged when a market split is applied; only the impact of the new bidding
areas on the CBCOs should be computed in addition to all other bidding areas.
- Under FB, the impact of all relevant bidding areas on the FB constraints is taken into account. This, in
combination with the market coupling as the allocation mechanism, makes that indeed all exchanges subject
to the implicit allocation mechanism compete for the scarce capacity on the critical branches.

CWE Price Zone Study TF – Study of existing cases and preparation of the qualitative analysis
52
6 Conclusions and outlook for the qualitative assessment The approach followed by the PZS TF is shown schematically in Figure 27.
Figure 27 Schematic and stepwise approach followed by the CWE PZS TF
This report is the deliverable of the first phase, the initiation phase, of the TF. Main objective of this initiation phase
was to gather materials, studies, and experiences, such in order to establish a proper basis for the qualitative analysis
and possibly a quantitative analysis (if needed).
6.1 Main learning points for the qualitative assessment
We have started this study from a common understanding on the bidding zone delineation issue comprising the
following elements:
The delineation of bidding zones is one method of congestion management among other measures
There are different systems of zone delineations in Europe and the world
European regulation foresees that when assessing bidding zones, TSO should take account of overall market
efficiency and shall base the analysis on costs of redispatch/countertrade as well as structural congestion
The flows in an AC power system fan out in accordance to Kirchoff’s laws, as such loop flows are inevitable as
they follow the law of physics
Loop flows can have both a restraining as well as a relieving effect on the grid
We have found these elements represented in some way in each of the cases. However, none of the studies in general
covered all congestions relevant for our study (CWE plus neighbouring areas). This will be taken care of in our
qualitative analysis.
From our analysis we have also learned that the function of a market split in managing congestions was not fully
covered in any case study. Two major learning points that will be taken into account in our next phase are:
A market split can bring exchanges, which cause substantial loop flows, within the scope of capacity allocation
In a grid with substantial loop flows, a market split alone is not sufficient to allocate capacity to the relevant
exchanges in an efficient way; it must be combined with a coordinated flow-based capacity calculation and
market coupling to guarantee an efficient allocation.
From the case studies as well as the interviews, we have identified the general function of a market split as follows. A
market split makes additional exchanges subject to an allocation mechanism.
Initiation Qualitative analysis Quantitative analysis
Main activities:
• TOR, goal, scope of work• Consultant selection• Deliverables, Time and Budget• Field study• Qualitative Analysis Approach
Deliverable:
• Study Initiation Document
Main activities:
• Evaluation criteria• Effects of existing zones• Effects of zonal changes• Quantitative analysis plan and
budget
Deliverable:
• Qualitative Analysis Report
Main activities:
• Models and scenarios• Input data• Validations• Simulations• Results analysis• Synthesis• Conclusions
Deliverables:
• Quantitative Analysis Report• Synthesis Report
January – April 2012 April – July 2012 July 2012– January 2013
Study
delivery
Q1 2013
GO/NOGO

CWE Price Zone Study TF – Study of existing cases and preparation of the qualitative analysis
53
The reasons to apply a market split, and to make additional exchanges subject to an allocation mechanism, that we
have identified so far are in order to:
1. manage inner-country congestions, by applying the split at the place of the congestion
2. manage congestions that are expected in the future, due to shortage of energy stock
3. manage a congestion in a bidding area caused by loop flows, by applying a market split in a neighbouring
bidding area at the path of the exchange (not used up to now)
Especially the latter one received more attention in this report, as this one is not currently applied, and has not been
(satisfactorily) addressed in the case studies.
The (generic) reference framework within which to explore quantitatively and qualitatively the creation of additional
zones in any market (through market splitting), as proposed by Frontier Economics and Consentec 17
, is the structure
adopted by the CWE PZS TF in order to take up the qualitative assessment. This framework is shown in Figure 28.
Figure 28 (Generic) reference framework within which to explore quantitatively and qualitatively the creation of
additional zones in any market (through market splitting)
The congestion analysis is the first step in the qualitative assessment. When reviewing zone delineation, exchanges
that cause congestions in the grid are the primary key to look for potential places to split the market. Vice versa, the
lack of congestions from exchanges over existing delineations would indicate a potential removal of existing market
splits. To find such potential places, the congestions in the grid must be carefully analyzed, historically and for the
foreseeable future. An important learning point from the case study analysis is that this congestion analysis should not
be limited to the area which is under review for zone delineation but also include neighbouring areas which might
suffer from physical congestions co-influenced by the area under review. Application of the third function of market
split requires extensive assessment and potentially also coordination over the whole congestion management chain
beyond the scope of CWE alone. In addition, the analysis should also review the expected developments in the grid.
This in order to find the structural and sustainable congestions for which a stable delineation can be found.
If a potential stable delineation is found, the next question would be if this delineation is the best approach to deal
with the expected congestions or whether other methods to manage the congestions would be better. Also a
combination of methods for different congestions could be considered. In order to answer this question, the
qualitative analysis should evaluate all potential methods to manage the congestions found, both on a longer term as
well as on a shorter term, e.g. within the operational time scale. These methods should be described in qualitative
terms: how do they work, when will they take effect and what are the qualitative effects (results and/or impacts). A list
of methods and evaluation criteria should be developed and confirmed by the regulators. Also the regulation
framework, as mentioned in section 2.2, has highlighted that European regulation foresees that when assessing
bidding zones, TSOs should take account of overall market efficiency and shall base the analysis on costs of
redispatch/countertrade as well as structural congestion. In this regard, the occurrence of loop flows is not the only
factor in the analysis of current zone delineation but an important issue to consider.
17
Relevance of established national bidding areas for European power market integration – an approach to welfare
oriented evaluation, October 2011, Frontier Economics and Consentec
Congestion
analysis
Technical and economical analysisCongestion analysis
Identification
of a potential
structure of
split bidding
areas
Market
splitting of
bidding
areas
Technical
evaluation
Economic
evaluation
Recom-
mendation

CWE Price Zone Study TF – Study of existing cases and preparation of the qualitative analysis
54
7 Appendix Interviews were organized with TSOs that applied a zonal delineation within their country (Statnett (Norway) and
Svenska Kraftnät (Sweden)), and a TSO that is implementing a nodal energy market in its country (PSE-O, Poland). This
allows the CWE PZS TF to take into account and learn from their practical experiences.
A summary of the interviews is provided in this appendix of the report, whereas dedicated questions, formulated by
the CWE PZS TF, and the corresponding answers received from the interviewed TSOs are included in the paragraphs of
chapter 4. The TSOs interviewed, have been given the opportunity to review the texts that are included in this report.
They are aware that this report is public material, as is the text of the interview.
7.1 Statnett (Norway) – Summary of the interview
Interview with Statnett, March 6, 2012.
Statnett: Ole Gjerde, Gunnar Nilssen, Jan Hystad
CWE: Rene Beune, Pieter Schavemaker
Currently, Norway has 5 price areas as shown in Figure 29. In 2010, Statnett introduced a fourth and fifth price area in
Norway.
Presentation entitled ‘The need for market zones’. Specificities for Norway are touched upon.
- Lots of BRPs (150), complete separation between generation and consumption large balancing market (70% of remaining reserves after day ahead market are bid into the "balancing" market. Note: the Norwegian "balancing" market is a single buyer market for the TSO for internal congestion management plus balancing; 50% of the used bids are for congestion management. The bids are done on a connection point (network station) basis. Most BRPs are only manned on daytime hours (around 15 are manned during night time). In the remainder "balancing" and "balancing actions" refer to both countertrading for congestion management using
Figure 29 Five price zones in Norway

CWE Price Zone Study TF – Study of existing cases and preparation of the qualitative analysis
55
the station based bids (because the bids are station based this is equally effective as redispatch) and activation of bids to restore frequency
- Philosophy Statnett: need for balancing increases balancing actions shifted to before real-time; not possible to handle the balancing in real-time anymore. Self-balancing is not a key feature: the TSO should facilitate the balancing market to have it in an optimal way (from a welfare point of view). This is linked to the fact that are a lot of small BRPs, with only little resources (quite often with only day time shifts). Imposing the balancing burden on them, would require them to increase the manpower which is not by definition the most optimal way to go (the alternative to facilitate the development of commercial services for this is not considered).
- Competition is an issue in the Nordic market, at least in the balancing market. - Lots of congestions, at various/varying places, and they change heavily from hour to hour - Hydro system: large power stations far away from the load centers - Ramping problems (DC interconnectors, 600 MW ramping constraint each) looking at ramping constraints
on net positions (because of frequency deterioration) - Norway is the biggest provider of flexibility for the Nordic balancing market there is a need to know the
‘free’ capacity in advance to be able to provide this flexibility. This is linked to capacity reservation that is to be introduced on the cable to DK in 2014, where 100 MW is reserved for LFC (Load Frequency Control). The 100 MW is based on social welfare considerations.
- Statnett makes an overview of expected imbalances after day-ahead. This is based on 8 areas that are linked to consumption; they are not linked to the market areas, which are more dynamic than the load centers. Statnett does not use the market information (BRP information) for that, as it is not reliable enough. Reliable data is needed for congestion forecast (internal congestion management, balancing)
- (linked to the previous issue) Statnett is moving more into the direction of a centralized dispatch, this in order to/to be able to keep the frequency in control.
- Market splitting allows the market participants to do their economic dispatch, using the best information available, whereas the TSO does not have the proper information to perform an efficient redispatch (information adequacy issue).
- Main congestions handled by market splitting, rest by balancing market (less structural). Balancing market: 50% congestion management/counter trade, and 50% balancing. Balancing market is a voluntary market (60%/70% of the total reserves is provided to the balancing market). Bids on the balancing market are not on a portfolio basis, but on more detailed information (station groups). This more detailed information is not yet considered for the DA market. Ancillary services (for frequency management) is on portfolio basis. Primary and tertiary control, secondary control is being introduced.
- Volumes in the ID market are limited, because of the balancing market. 2TWh on the ID in the Nordic area. - Sequence of markets: primary and secondary reserve contracting, DA, ID, pro-active balancing and redispatch,
reactive balancing and redispatch - Plans are to have both primary and secondary on D-2 before the DA market (need to reserve capacity) - Legislation in Norway on elspot areas; next to structural congestions, there is a possibility to introduce price
areas on a short notice in case shortage of energy is expected (little rain/water specific to the Norwegian hydro system). At least 2 weeks notice to BRPs.
- No long term products to hedge the financial risks CfDs - 20 years ago, Statnett had very flexible price zones, changing from week to week MPs requested to have
more stable price zones - MPs indicated that they don’t want too much price zones… the feeling is that the current number of 5 is well
accepted and should not grow higher. - Rule of thumb: if the expected counter trade, in case of damages on grid elements, exceeds 2.5 MEUR per
situation, a new market zone is considered. This number is based on experience. For structural congestions this rule of thumb does not hold; the cost for counter trade would well exceeds this amount.
- Structural congestions are being removed by grid extensions/reinforcements. - Considerations when defining a zone:
o Where to put the boundary of the zone because of the high number of congestions, selecting a boundary should take away as much congestions as possible
o At least 4 ‘relevant’ MPs in a zone, covering both types production and consumption in the area. Market power studies are not applied on every case, based on experience (and former studies). The number 4 is rather specific to Norway.

CWE Price Zone Study TF – Study of existing cases and preparation of the qualitative analysis
56
o Flexibility in the zone to price variations (if they do not react to price signals, the zone should be larger to have flexibility)
o Possibilities for metering and settlement between the zones and to prevent parallel flows through distribution grids
o Complexity to determine the ATCs - Daily computation of ATCs for the DA market - Tendency is towards a steady set of price zones, to be redefined as soon as grid reinforcements are
commissioned - Better correlation between markets and physics is needed: FB is being considered - Loop flows are only marginal - Costs of countertrade in Norway: 15 MEUR/year
Presentation entitled ‘Results from Nordel Work on Congestion Management (2005)’. Presentation on work done in the period 2003-2005. New price areas were proposed in 2002, but MPs opposed. Therefore, a trial period with counter trade by using the regulating power market (balancing market) bids was performed. Simulation of counter trade was performed between the elspot areas and based on the elspot up to two levels of NTCs: 70% and 100% NTC. The conclusion from the simulations were that the disadvantages of this approach were higher than the advantages.
7.2 Svenska Kraftnät (Sweden) – Summary of the interview
Interview with SvK, April 3, 2012
SvK: Niklas Kallin, Roger Kearsley, Erik Svensson
CWE: René Beune, Pieter Schavemaker
Following the offered Commitment to the Commission to subdivide the country into two or more bidding zones,
Svenska Kraftnät completed the investigation into which subdivision will apply. The final report “Anmälningsområden
på den svenska elmarknaden - Förslag till marknadsdelning” was completed on 15 October, submitted to the Swedish
Government on 19 October and made public on 20 October 2009. The report recommends a subdivision of the
Swedish electricity market into four bidding zones using cross-sections 1, 2 and 4 in the grid. The document is not
available in English, but the basic principles from the report were explained during the interview.
In November 2011, Svenska Kraftnät introduced 4 price areas in Sweden as shown in Figure 30.
Figure 30 Four price zones in Sweden

CWE Price Zone Study TF – Study of existing cases and preparation of the qualitative analysis
57
Introduction
Statnett had 20-25 price zones that was reviewed on a weekly basis (in between 1993-1999). Market was very dissatisfied with this, and they went down to 2-3 price zones (currently 5).
Subtransmission (and lower) is not owned by SvK (only 400kV…220kV).
History
1996 when the Nordic market started it was decided to start Sweden as one price area because of Market power (at that time, Sweden had roughly 15 producers (3 of them had 90% of the market)
Traditionally NO and DK were in favour of more areas whereas SE and FI were against
DK has been split by physical reality (DK-W belonging to the UCTE synchronized grid and DK-E belonging to the Nordic synchronized grid)
DK consumers complained in 2003 to the commission (DG Comp). SvK was able to counter this: SvK offered to countertrade for DK as well if ELTRA was willing to share the costs. ELTRA was not willing to do so because the congestion was in the Swedish grid. The EC refused the complaint.
DK-SK interconnections were sized to share the Swedish nuclear power from the Barsebäck station near to Malmö. This nuclear power plant has subsequently been decommissioned (strong Danish pressure).
In 2005 DK-W was hit by some very high prices. The issue became contagious and triggered a Swedish study POMPE (regulator, SvK, NPS, Swedenergy (producers and traders)) 2006-2007:
o Possibly divide Sweden in cross-section 2, but also to investigate a geographical split in the whole Nordic region between thermal and hydro
o Market power analysis o Simulations to study effects of investments o The Danes did not approve the conclusions in the report
June 2006 Danish Energy filed a second complaint to DG COMP, Norwegian counterpart supported the complaint. Energinet.dk started the Copenhagen Economics study and this study helped the commission to make a real case of this
In the mean time DK-W prices hit some records which didn’t happen before
SvK highlighted the following caveats in the Copenhagen Economics Study: o An incorrect assumption in the study was that SvK would countertrade to give DK-W access to the
Swedish prices, which was unrealistic because SvK thought it fair that Energinet.dk should share the costs and Energinet.dk refused.
o DK was still exporting to Germany at the same time that they claimed that they had the right to import from Sweden (which was not possible due to capacity reduction); this was due to some peculiarities in the DK-W market, and generators in DK with fixed export contracts to Germany.
o Assumption was made that DK2 would get the SE1 prices (instead of the SE4 prices that they have now).
In parallel with the EC case, in autumn 2008 Nordic ministries stated that the Nordic region should be divided into more bidding zones
In 2009, SvK got instruction from the Swedish government to start the process of price zone subdivision in Sweden
In June 2009 DG COMP came to the preliminary conclusion that SvK was violating competition law in discriminating foreign customers. SvK offered commitment in exchange that the EC dropped the case.
October 2009, draft commitment that EC published for public consultation, at least 2 price zones, and 18 months implementation time (agreed upon with MPs) including an interim period with preventive countertrade (if expected to be efficient) to increase capacities.
o There has been a local congestion in the west-coast area which SvK succeeded to get exemption from the commission to reduce capacities in these case: reason was that the congestion cannot be solved technically by market splitting or counter trade. Additional (weaker) arguments, was that it will be partially resolved by new investments (go-live June this year).
o Commission received a lot of responses, some minor adjustments made based on this (conditions interim period and go-live date).
o Financial hedging by CfDs, sold at three years ahead, were an argument from the MPs against the 18 months implementation time. CfDs were linked to Stockholm, after the split every zone has its own place where the CfDs are linked to.

CWE Price Zone Study TF – Study of existing cases and preparation of the qualitative analysis
58
14 april 2010 DG Competition made the SvK commitment binding
The transition period was already started ahead of the DG Competition decision to be ready for go-live on 1 November 2011
The actual zonal split, and thereby the actual number of price zones, was decided by SvK in May 2010. The Swedish regulator was informed but no decision by regulator or parliament was needed. Later, this has been challenged by critics.
The only regulation that had to change in Sweden was the balance settlement rules and the BRP contracts
How to split?
The final report “Anmälningsområden på den svenska elmarknaden - Förslag till marknadsdelning” was completed on 15 October, submitted to the Swedish Government on 19 October and made public on 20 October 2009. The report recommends a subdivision of the Swedish electricity market into four bidding zones.
Starting point: no longer reduce capacities on interconnections due to internal constraints
Two short term measures: o Bid-based redispatch o Split the market
As there is not really a good way to make a quantitative analysis (as the historical NPS data is not linked to the foreseen price areas, and fits to the reduced XB capacities that will be prevented by introducing the price areas), the whole study is mainly based on qualitative reasoning
Basically an issue of who should pay (fairness): countertrade costs are for all Swedish customers, with market split it is localized to the market. Upwards regulation in the south of Sweden to prevent XB reduction and allow the export to Denmark redispatch is socialized in Sweden Swedish customers pay for cheap energy in Denmark not fair. Market splitting introduces a realistic/fair market price in the area, localized to the market actors in that region. Not enough regulating bids in the south of Sweden (probably import from Poland, Germany, but his would distort the market in Sweden and the other countries).
Market power analysis
HHI calculations were performed to check market concentration. As the competition part was the major argument not to split up Sweden before, the focus was on these numbers.
HHI was used to check after bidding zone split, not as a guidance for bidding zone split
However HHI were calculated over expected price areas which included several bidding zones including from surrounding countries (e.g. SE1+SE2+NO4+FI)
SE1: almost all production in the hand of one company high HHI but will always be connected to other areas (SE2 and/or import/export).
SE4 has a HHI high value, but as it is never isolated (mostly linked to DK2/SE3), this is not really an issue.
Price hedging
Price hedging issue in the south of Sweden was the biggest concern. CfDs are mostly sold by producers; little production and lots of consumptions not enough CfDs to cover the consumption.
Identified and indicated as a drawback in the report, but is the price to pay / comes with the market split of SE4 which is the most relevant price zone to prevent reduction of XB capacity.
Transitional problem, because new lines are build between SE3 and SE4, reducing congestions
MPs propose that SvK, as the owner of the capacity, sells CfDs or FTRs
Actual split
All splits are linked to voltage stability problems.
Uncertainties with regard to the future in terms of renewable and interconnections.
Commitment with DG competition for 10 years: if new congestions arise, new bidding areas may be introduced in three months. From the point of view of stability, SvK wanted to prevent to introduce new bidding areas on a short term. Also alternative measures like countertrade could be preferred.
While today a split in 3 zones would be sufficient, further splitting in the future would be needed (currently SE1 and SE2 have one price in 100% of the time)
"You will always have to stand against the fairness question"
Key principle: a local grid (one distribution grid e.g. settlement area) should belong to one bidding zone. Definition of settlement area is regulated

CWE Price Zone Study TF – Study of existing cases and preparation of the qualitative analysis
59
Price zones are comparable in terms of total generation (+ import) and consumption (+export), e.g. compared to DK1 (order of magnitude 7000MW for both values).
Market split review (discussions relating to the preliminary report)
general o A report reviewing last winter’s period (covering November-April) is to be published end of May o The review is carried out by the Swedish regulator in consultation with SvK, and the consumer and
competition authority o Some strategic bidding has been observed (especially in SE1 to preserve market price for generators) o When the new bidding areas were introduced many nuclear power plants were still in maintenance
(delay) increasing the congestion problems less capacity between the bidding areas, higher price differences, this lasted until December did not help in the public debate
o Because of the nuclear phase out in Germany, DE prices rose to the level where SE4 started exporting, thus increasing SE4 prices (compared to SE3) further (SE3 SE4 flow was already at the limit)
4 areas investigated, small price differences since December, review areas: o Price behaviour
Small price differences in general Some larger price differences occurred basically between SE4 and the rest SE4-DK-E convergence has not been compared to historical values
o Retail market impact 3 contract types
1 year fixed price contracts
3 year fixed price contracts
Price contracts with a monthly variable component linked to the spot-market price Average price in different zones analyzed Price spread in the different zones analyzed Both are compared with area SE1 and SE2 which is supposed not to have changed much Some larger price differences were found than actually occurred in the spot market because
of market expectations and uncertainties Large number of companies in each zone offering the abovementioned products (all zones
roughly 60-65, in SE4 roughly 35) o Wholesale market impact
HHI index calculations show comparable results between the price zones and compared to before
SE1 and SE4 have never been isolated 65 suppliers 35 balancing responsible parties 4 large generating companies with more than 90% of Swedish production (Vattenfall,
Fortum, E.on, Statkraft) Bidding behaviour now under active spot market surveillance while previously, under the
balancing market, this was not the case o Financial market impact
So far 3 market players were interviewed on this aspect Liquidity of CfDs in SE4 is lower than before Suggested solutions impose burden on SvK
Guarantee a minimum capacity on the borders (by means of counter trading)
SvK sells CfDs/FTRs
Note: this report doesn’t pay attention to the effectiveness of the measure, that is what SvK is reporting to the commission
The long term effects are not covered in any report yet
Conclusions of review
No real damaging impacts found so far
CfD market in SE4 would benefit from more liquidity.

CWE Price Zone Study TF – Study of existing cases and preparation of the qualitative analysis
60
Operational experience
Due to less reduction of cross-border capacities, the system is used more to it’s limits
Due to the market split the uncertainty in generation location decreases in the operational planning which enables more capacity to the market (smaller uncertainty margin)
Assumption is to keep the price zones, although with the implementation of new lines (grid investments) it could be a good public message to remove the price zones.
7.3 PSE-O (Poland) – Summary of the interview
Interview with PSE-O, March 23, 2012.
PSE-O: Tomasz Sikorski, Robert Paprocki, Konrad Purchała, Tomasz Gapys, Andrzej Midera.
CWE: Rene Beune, Pieter Schavemaker
Currently, Poland is implementing a nodal energy market (LMP, Locational Marginal Pricing). The Polish transmission
grid is shown in Figure 31.
Main messages / findings: - Implementation of a nodal system in Poland is strongly determined by structural problems in the zonal energy
market model that have materialized specifically in Poland. These problems are mainly due to the lack of the accurate representation of the Polish transmission network in the clearing of the Energy and Ancillary Services Markets (aggregate representation of resources). The problems with the zonal market approach are deepened by specific conditions in which the Polish market operates:
o Inelastic and unevenly distributed coal-fired power plants (90%) o Weakly developed transmission grid in the north, with voltage stability problems o Significant unscheduled power flows through the Polish system from the west to the south o Increase in volatile RES generation
- Nodal implementation in PL only solves their internal issues, the unplanned transit flow18
issue remains. LMP provides PSE-O with additional flexibility though.
- PL already had a centralized dispatch, the step towards LMP is easier (‘logical next step’).
18
This is a term used by PSE-O. It equals loop flows in the definition of the taskforce.
Figure 31 The Polish transmission grid

CWE Price Zone Study TF – Study of existing cases and preparation of the qualitative analysis
61
- PL has serious problems with unplanned transit flows (n-1 security breaches); due to the unplanned transit flows the import capacity is often reduced to zero, i.e. PL cannot benefit from the exchange of energy, e.g. power in Germany, as they do not have any import capacity left.
- Less need to go from a zonal to a nodal system, unless there are significant internal constraints within the grid (thereby raising the internal redispatch costs to high levels). Note: redispatch costs for the Polish grid currently amounts 10 MEUR/month (down from 20 MEUR, after introduction of some market restricting rules). However, intermittent and distributed generation as well as demand response will increase the need for locational market design.
- Prequisites for supply security in Europe: sufficient flexibility and capacity. Zonal can provide this if congestions exist only between zones, i.e. transactions within the zone don’t require external transmission capacity to be used (or require negligible part of it from the security viewpoint). Operationally, this requires small zones or/and adequate adjustments of local demand and supply to stay within transmission availability either by proper incentives or by proper central control. In the longer run this requires adequate changes of connected supply/demand capacities and/or transmission capacities.
- PL can handle their issues by grid investments (reactive power injections, grid reinforcement), but too much time is involved before those investments materialize. Moreover, in economic terms having low loaded network indicators (overinvested network), especially with high RES penetration, is not the optimal solution. LMP solves their issues, and in addition, gives them the comfort to face the future challenges ahead (the power market which will require more price coordination due to e-mobility, higher levels of RES, demand response, distributed generation and so on).
- The zonal approach brings market efficiency in terms of competition on the copper plate within the zone. In a nodal system, market efficiency in this sense is achieved by trading hubs and many derivative products based on properly defined and priced physical products (energy in locations, ancillary services in zones, transmission rights). In both market models market power mitigation measures are necessary, which could require a much heavier regulatory review process.
- In a nodal system, to find possible market power, two runs can be performed: one with all network constraints and one with so-called “competitive network constraints” and see which generators have market power. A competitive network constraint is a constraint that can be alleviated by many market participants.
- If the reason for market power is the transmission grid, you do not solve it by making the area bigger. If the reason for market power is the lack of competitors in a congested zone, you do not solve it by a larger zone, but by having larger capacities between the zones.
- Another difference in the zonal approach is that there is one single market price for the given zone. However, in a nodal model the single price for the zone can be also calculated as weighted average of LMPs within the zone. This price can be used for non-dispatchable load settlement.
- Zonal can only hold if redispatching needs are marginal. - A nodal approach requires TSO organized market in order to perform redispatching and discover energy
prices. A nodal approach allows for self-dispatch. If self-dispatch is infeasible it is converted to financial trade, if covered by FTR, or reduced, if not covered by FTR.
- Requirements to continue with zonal: proper size of zones, flow based capacity calculation and allocation, proper incentives and sufficient transmission capacity inside zone (overinvested systems in case of heavily intermittent power generation), proper redispatching tools.
Polish characteristics / situational context:
- (1) Inelastic coal-fired power plants (90% of installed capacity) o high minimum load, at least 50% (360MW capacity, e.g. 200 MW minimum load) o 6-8 hours start-up time o Problems with intermittent generation RES has a priority so there are needed adjustments in set
points for thermal units (reduction of thermal generation to accommodate RES generation). o Plants submit their own schedules, but they will receive detailed instructions for the set points
centralized dispatch - (2) Weakly developed transmission grid in the north; voltage stability in the north is an issue need for
redispatch in order to maintain voltage stability - (3) Significant unscheduled power flows - 1+2+3 are the main three technical drivers for LMP - Unit commitment and centralized dispatch remained within the control center of PSE-O after the switch to the
market introduction of LMP is nothing new, the move to LMP is a natural next step/evolvement. Or in other words: as Poland already has a centralized dispatch, they ‘only’ add the full network model and the real-

CWE Price Zone Study TF – Study of existing cases and preparation of the qualitative analysis
62
time locational price when going to nodal. However, the FTR market is the big issue and will create the challenge for market participants. But in fact this market is the missing element of the current market architecture. There is a need for an allocation mechanism of scarce internal transmission capacity.
- PSE-O spends 10 MEUR per month for redispatching (usually about 10% of energy from nominated transactions must be redispatched). This was 20 MEUR/month in the past. Since 2002, PSE-O has been introducing changes in the balancing market to settle costs more accurately . Market participants (MPs) are still not happy with the market as it is now mainly due to the fact that a significant part of the energy delivery cost is still socialized.
- Cross-border redispatching is incidental, on a bilateral basis and limited, meaning: 1% of redispatching volume and 3% of the total redispatching cost.
- More wind in the PL system more volatile increase of redispatching cost and balancing in the current zonal approach LMP will help.
- More RES in Europe leads to more unplanned flows (when zonal model is implemented), especially it refers to the Polish system (wind generation in Germany).
- Inflexible power plants why no gas plants in PL? Gas in PL is even more inelastic. PL has few gas fired CHPs, which in the winter are not flexible due to heat generation. In summer, they are switched off and need one month to start up as gas contracts are not flexible at all.
- Three power plants in the north, one hydro, two coal; coal mines are located in the south, the two coal power plants in the north are the most expensive because they are located far from the coal mines.
- Wind: 2000 MW installed capacity at the moment; installed in the north. - The more installed wind power, the more often thermal units need to shut down in the night. - Marginal cost of losses can be 10% of the cost of energy delivery cost. For this reason, the cost of losses
should be reflected in the energy prices (the third component of LMP) - PX: currently PX establishes financial contracts between market participants only, no physical contracts - MPs net position is determined by PSE-O, whereas the financial position is set on the basis of PX and by
bilateral contracts. Imbalance created by themselves is charged by means of the imbalance settlement. - PSE-O settles the sum of all generators of a MP (commercial position is a portfolio) redispatching is
between MPs and not within a MP. - Today PSE-O has a system price for the imbalance settlement, no local imbalance prices. However generators
are also settled against individual prices (locational prices) in case generation is forced due to system requirements.
Unplanned transit flow issue (this is the term used by PSE-O for what is called the loop flow issue by the TF) - Import capacity on windy days everything is used by transit flows. Transit / loop flow exceeds sometimes
the n-1 limit. PL cannot benefit from the exchange of energy, e.g. energy in Germany, as they do not have any import capacity left. Loop flow in the order of 300-500 MW in the past, now more volatile, from 0 up to 2000 MW (i.e. sometimes beyond secure level) but still increasing. In order to use the grid as close to the limits as possible, while safeguarding the grid security, the loadability of the lines is based on the actual temperature. PL has one ATC profile (PL DE, CZ, SK), in order to prevent that they need to have the uncertainty split over the three individual ATCs (one per border) and thus to maximize the transfer capacity on the whole profile.
- DE-AT border: realized schedules are much higher than the realized physical flows (as one of the few borders where it is like this) the physical flows go as loop flows / transit flows through Poland and Czech this can be already shown with with Vulcanus data. Example graph shown for PL with the correlation between realized schedules (y) and unplanned transits (x) 0.82 correlation (where the unplanned transit is defined as the schedule – realized flow)
- PSE-O: "If internal local source and sink areas within one bidding zone have a significant impact on available transmission capacities in other zones (i.e. on power flow in other zones), the definition of the zone is not the proper one"
- PL has sometimes no operational measures anymore to deal with the unplanned transit flows. The available measures include the following (in this order): lowering the offered import ATC (even down to 0), cancellation of network maintenances (if available), internal and cross border redispatching; if this is exhausted they can only request increase of the CZ generation, if this is exhausted increase of the AT generation can be requested (multilateral redispatch – currently under development within TSC project) – otherwise risky topological changes can only be implemented leading to significant risk of local black outs. In case of multilateral redispatching, cost sharing is an issue, that is not solved (yet) within the region (TSC). Another option (instead of redispatching) that can be effective is the DC loop: power from 50Hz Denmark Sweden Poland.
CWE Price Zone Study TF – Study of existing cases and preparation of the qualitative analysis
63
This is an effective measure at the PL border, whereas only additional grid losses are involved, but it is possible only if there is free capacity on both HVDC links in the right direction. (The general message: all possible countermeasures have been considered but there have been already incidents where all these measures together were not sufficient to enable (n-1) network security under the unplanned flows).
- Splitting up DE/AT for PL would significantly mitigate/diminish the SoS issues (presuming a coordinated flow-based capacity calculation and allocation):
o Reduces the redispatch needs/costs (XB and internal) with maybe 5% o Transactions in the market zones would more accurately respect the constraints in other networks o All (more) transactions compete with one another
- A coordinated capacity calculation and allocation alone (without market splitting, i.e. proper size of zones) would not solve the unplanned transit flows issue; nor can flow-based methods reduce the unplanned transit flows through the PL network (as the unplanned transit flow is already present in the D2CF basecase, i.e. before the available margin on the FB constraints is assessed).
- The internal congestion is S>N, whereas the unplanned transit flow is W>S. As such, the unplanned transit flow sometimes helps to a certain extent on some internal constraints but produce other (close to the borders). However the level of unplanned transit flow is so uncertain in day-ahead that it is difficult to rely on it.
From zonal to nodal:
- Lessons learned from the zonal system o Difficulties in the incorporation of the transmission grid constraints into commercial trading o Inaccurate price signals
Especially for non-dispatchable units settled through the system-wide imbalance price solution is locational pricing approach (on the contrary in current zonal approach the dispatchable generation simply gets the set points from PSE-O what helps to relieve network congestions but increases redispatching cost covered by TSO) imbalance settlement on the zonal basis one price for the whole system
o Non-optimal market outcome not possible to mitigate the imperfections by improving the current zonal model
- Splitting up PL in two zones will not work due to the nature of problems, e.g. mainly local voltage problems and external transit flows ( no big study has been performed to justify this because the situation is obvious; at the end of the 90s a study was performed though). The zonal approach can help, but is not the complete solution for the Polish problems (basically because the majority of problems relate to voltage issues which are local by nature but, specifically for Poland, also very dynamic in location. Grid investments are planned but will not be available in time and it will not be efficient to solve all voltage problems or RES issues by grid investments). In economic terms having low loaded network indicators (overinvested network), especially with high RES penetration, is not the optimal solution.
- LMP requires FTRs. LMP facilitates all kinds of changes in generation mix such as CHP and so on. LMP is the only complete solution to PSE-O’s problems. It is future proof in terms of renewable generation (RES dispatch priority, CHP dispatch priority) generation will become less flexible, and demand response needs to be developed to provide the necessary efficient flexibility (incentive compatible). In the early beginning of the nodal system, most of the load will be zonal, but there will already be some load nodes (for dispatchable load).
- Main goals of introducing LMP o Optimal use of existing generation and transmission infrastructure o Feasible area of secure system operations increases due to the LMP introduction and the full network
model less uncertainty (with LMP, deviations of the schedules imposed by PSE-O can be settled incentive compatible on a local basis while today this can only be done on a portfolio basis) lower reliability margins needed larger feasible area of secure system operations higher social welfare
o Cost-effective development of new generation and transmission assets including generation mix (due to properly priced energy and Ancillary Services)
o Efficient integration of RES detailed ramp rates and start-up characteristics of the thermal units can be taken into account (as today, the difference being an incentive compatible imbalance settlement)
- LMP based market allows PSE-O to implement the self regulated balancing (which is now not possible)

CWE Price Zone Study TF – Study of existing cases and preparation of the qualitative analysis
64
- Key requirements o Economic efficiency o System security
including a full network model in the market clearing process is a prerequisite to establish the system security
o Incentive compatibility two kind of resources: dispatchable (control the flow and keep the system secure) and non-dispatchable. Note: all generators, even non-dispatchable are settled with LMPs. Demand response is also settled against LMPs.
o Transparency (in terms of market outcome / prices) - Local flexibility is a real need in PL; PSE-O observes similar tendencies in other countries due to RES
integration - Changes in the Polish market (implementation plan)
o Step 1: full network model, better IT tools, imbalance settlement based on LMP prices o Step 2: implementation of the full nodal pricing model for the wholesale market (e.g. introduction of
FTR markets) The intermediate step does not allow physical self-scheduling (like today) reason is the problem to pay to decrease the generation. This will be solved by the implementation of FTRs. Without hedging instruments it is not justified to expose market participants to financial risk related to reduction of generation and also to expose TSO to the risk related to “dec game”.
- FTRs for internal capacity are the biggest change for the market participants. Therefore the two steps approach will be used:
o Bridging solution – zonal forward markets with nodal balancing (balancing based on LMP and full network model, forward contracts are concluded on a zonal basis)
o Target model – full nodal market (full nodal pricing model including FTRs for domestic capacity)
- After implementation of the bridging solution MPs can see real (not simulated) LMP prices and analyze them in the context of implementation of full LMP market. If the MPs at that time oppose to the nodal system, it is an issue for the REG to decide how to go further.
Nodal / LMP:
- The balancing in PL (under LMP) is locational and on a 5 minute basis. Furthermore, the ramp rates are properly embedded in the PL system and the prices. Bottomline: proper incentives for the MPs to follow the system needs.
- Grid investments will materialize in 2020, and lead to a well-developed system - At that time, LMP provides the local flexibility to deal with E-mobility, RES, and so on.
LMPs are market mechanism to coordinate a behavior of small scale generation and DSR (production or reduction which helps the system).
- Feasible set of FTR year ahead, month ahead, all node-to-node (in line with security constraints) by means of auction; load can request for free FTRs (so-called “FTR allocation process”), the rest is allocated through auction to generators. All elements of market model design are subject to REG approval. Free allocation of FTRs (if any) will be based on rules approved by REG.
Energy
Price
wind CHP
All available flexible capacity;
only upwards
Nodal-based self scheduling
Final LMP model
Input data for SCUC (security constrained unit commitment)
CWE Price Zone Study TF – Study of existing cases and preparation of the qualitative analysis
65
- Not mandatory to participate for market participants. - If the price of the MP’s bid is deemed to be the result of market power abuse, it will be replaced by a default
price (cost based price). - Reduction of commercial transaction covered by FTR means converting it into financial transaction. Generator
does not deliver electricity but the income they receive is the same like when generating - Allocate FTRs to a physical limit; this will be needed to collect sufficient congestion income to cover the the
pay-out of the FTRs. Physical schedules (self scheduling) are expected to be close to the FTR (obligations, not options).
- In the US they are considering to settle the FTRs not on DA prices but on Hourly Ahead prices (due to wind). - Integration model
Sequential market coupling (second best solution) o Two-step market clearing
EU zonal Domestic nodal
o Simplified representation of nodal market in EU zonal market clearing Nodes aggregated into zones Only main transmission constraints reflected, however all critical branches are reflected in
the flow-based model. o Separate nodal market clearing that includes results from zonal market clearing (i.e. energy exchange
between and within zones) - The Polish wholesale market price will be defined by the PX price (all XB exchanges go through the PX) - MPs do not need to be balanced (because there is sufficient incentive to be balanced on a nodal basis) - Balancing market will start just after PX day-ahead market is closed. - Current manual redispatch actions, required in zonal approach, will be replaced by Security Constrained
Economic Dispatch based on a full network model. Imbalances will be settled against the real-time LMP prices. - The LMPs could be used for pricing the RES indeed, however, it depends on the regulatory decision (energy
law) which is currently under discussion.