Embed Size (px)
Citation preview

STATE OF WASHINGTON
DEPARTMENT OF HEALTH Public Health Laboratories
1610 NE 150th
Street Shoreline, Washington 98155-9701
ISSC Vibrio Method Submission
January 9, 2015
Method: Vibrio parahaemolyticus enumeration
and detection through MPN and real-time PCR
Developer/Submitter Contact
William A. Glover II, Ph.D., D(ABMM), MT(ASCP)
Microbiology Supervisor: Reference, Enterics, Food & Parasitology Labs
Washington State Public Health Laboratories
1610 NE 150th St
Shoreline, WA 98155-7224
phone: 206 418-5422
email: [email protected]
Proposal No. 15-110

Purpose of method for use in NSSP
The purpose of this method is to provide laboratories supporting the NSSP the ability to rapidly
quantify Vibrio parahaemolyticus (Vp) from oysters using a high throughput real-time PCR
protocol.
History of Method
The Food and Shellfish Bacteriology Laboratory (FSBL) at the Washington State Public Health
Laboratories (WAPHL) tests on average over 200 oyster samples per year for Vibrio
parahaemolyticus (Vp). Culture based assays for the enumeration of Vp take four days or longer
and require the Kanagawa test (media based) to detect pathogenicity. Due to the large number of
samples and need for accurate and timely results, the FSBL at the WAPHL has tested Pacific
oysters (Crassostrea gigas) for (Vp) using a MPN based real-time PCR assay for over 10 years.
The real-time PCR assay utilized by the FSBL at the WAPHL has gone through redesigns and
improvements by various scientists at the WAPHL based on new published literature, clinical Vp
case data, experiences in WA State over the course of a season or seasons, and requests from the
Office of Shellfish & Water Protection for enhanced detection of pathogenic Vp strains and
additional surveillance capabilities.
The real-time PCR assay redesigned and implemented in 2009 and utilized through the 2013 Vp
monitoring season (June – September) was designed to detect Vp using the species-specific
thermolabile hemolysin gene (tlh) and virulent Vp using the thermostable direct hemolysin gene
(tdh). This assay was designed for high throughput in a 384-well based format. Additionally, the
tlh and tdh targets were redesigned yielding amplicons between 50-150 base pairs. This is
optimal for real-time PCR and is known to produce consistent results1. Validation of the assay
Proposal No. 15-110
and concept of a “molecular MPN” was conducted using FERN guidelines and was compared to
the FDA BAM method. This assay served as the backbone for which further improvements and
redesigns were made in 2013.
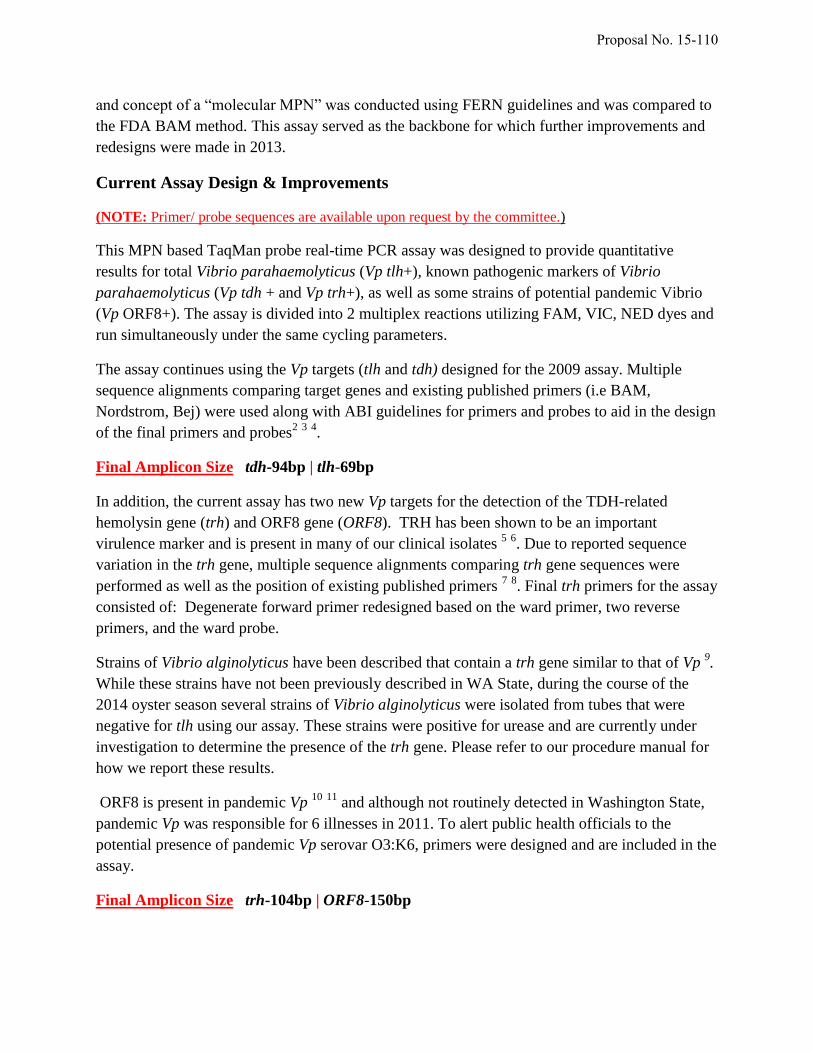
Current Assay Design & Improvements
(NOTE: Primer/ probe sequences are available upon request by the committee.)
This MPN based TaqMan probe real-time PCR assay was designed to provide quantitative
results for total Vibrio parahaemolyticus (Vp tlh+), known pathogenic markers of Vibrio
parahaemolyticus (Vp tdh + and Vp trh+), as well as some strains of potential pandemic Vibrio
(Vp ORF8+). The assay is divided into 2 multiplex reactions utilizing FAM, VIC, NED dyes and
run simultaneously under the same cycling parameters.
The assay continues using the Vp targets (tlh and tdh) designed for the 2009 assay. Multiple
sequence alignments comparing target genes and existing published primers (i.e BAM,
Nordstrom, Bej) were used along with ABI guidelines for primers and probes to aid in the design
of the final primers and probes2 3 4.
Final Amplicon Size tdh-94bp | tlh-69bp
In addition, the current assay has two new Vp targets for the detection of the TDH-related
hemolysin gene (trh) and ORF8 gene (ORF8). TRH has been shown to be an important
virulence marker and is present in many of our clinical isolates 5 6. Due to reported sequence
variation in the trh gene, multiple sequence alignments comparing trh gene sequences were
performed as well as the position of existing published primers 7 8. Final trh primers for the assay
consisted of: Degenerate forward primer redesigned based on the ward primer, two reverse
primers, and the ward probe.
Strains of Vibrio alginolyticus have been described that contain a trh gene similar to that of Vp 9.
While these strains have not been previously described in WA State, during the course of the
2014 oyster season several strains of Vibrio alginolyticus were isolated from tubes that were
negative for tlh using our assay. These strains were positive for urease and are currently under
investigation to determine the presence of the trh gene. Please refer to our procedure manual for
how we report these results.
ORF8 is present in pandemic Vp 10
11
and although not routinely detected in Washington State,
pandemic Vp was responsible for 6 illnesses in 2011. To alert public health officials to the
potential presence of pandemic Vp serovar O3:K6, primers were designed and are included in the
assay.
Final Amplicon Size trh-104bp | ORF8-150bp
Proposal No. 15-110

The new assay also includes an exogenous non-naturally occurring internal control plasmid (WA
IC) which is added to the PCR mastermix for the detection of matrix inhibition or other assay
failures. The 73bp fragment is synthesized and cloned into a pIDTSMART-AMP plasmid by
Intergrated DNA Technologies (IDT). See figure below.
The final addition to the new assay is the Vibrio vulnificus (Vv) cytolysin-hemolysin A gene
(vvha). Published primers and probe are utilized in this assay which yields a 79bp amplicon 12
.
Vibrio vulnificus is an important addition after the detection of several Vv positive samples
during the 2013 season. While it is present in the assay, it is currently for investigational use only
and the reporting of vvha during the 2014 season was for surveillance purposes only. All Vp
targets were validated and are included in the attached validation data. Vv data will be available
to share with the committee after validation of the vvha gene target scheduled to be completed by
the end of 2015.
Current Method Overview
Matrix- Pacific oyster (Crassostrea gigas)
Oyster tissue enriched (18-24 hours) in Alkaline Peptone Water in a 3-tube MPN series
DNA Isolation- Roche© MagnaPure LC using Roche© DNA Isolation Kit III
Instrument Platform- Applied Biosystems™ ViiA™ 7 (384-well format)
Proposal No. 15-110
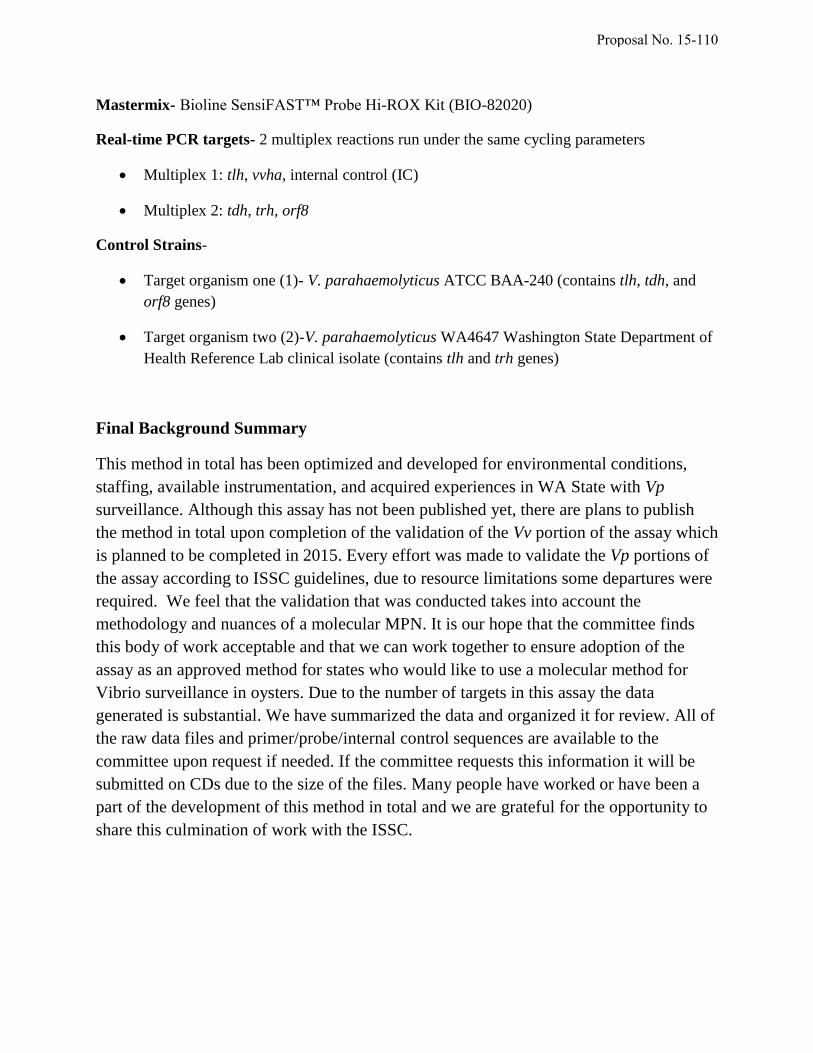
Mastermix- Bioline SensiFAST™ Probe Hi-ROX Kit (BIO-82020)
Real-time PCR targets- 2 multiplex reactions run under the same cycling parameters
Multiplex 1: tlh, vvha, internal control (IC)
Multiplex 2: tdh, trh, orf8
Control Strains-
Target organism one (1)- V. parahaemolyticus ATCC BAA-240 (contains tlh, tdh, and
orf8 genes)
Target organism two (2)-V. parahaemolyticus WA4647 Washington State Department of
Health Reference Lab clinical isolate (contains tlh and trh genes)
Final Background Summary
This method in total has been optimized and developed for environmental conditions,
staffing, available instrumentation, and acquired experiences in WA State with Vp
surveillance. Although this assay has not been published yet, there are plans to publish
the method in total upon completion of the validation of the Vv portion of the assay which
is planned to be completed in 2015. Every effort was made to validate the Vp portions of
the assay according to ISSC guidelines, due to resource limitations some departures were
required. We feel that the validation that was conducted takes into account the
methodology and nuances of a molecular MPN. It is our hope that the committee finds
this body of work acceptable and that we can work together to ensure adoption of the
assay as an approved method for states who would like to use a molecular method for
Vibrio surveillance in oysters. Due to the number of targets in this assay the data
generated is substantial. We have summarized the data and organized it for review. All of
the raw data files and primer/probe/internal control sequences are available to the
committee upon request if needed. If the committee requests this information it will be
submitted on CDs due to the size of the files. Many people have worked or have been a
part of the development of this method in total and we are grateful for the opportunity to
share this culmination of work with the ISSC.
Proposal No. 15-110

References
1 TaqMan® Universal PCR Master Mix Protocol
2 Kaysner, C. A., and A. DePaola. "Bacteriological analytical manual chapter 9: Vibrio." 2009-06-06]. http://www.
fda. gov/Food/ScienceResearch/LaboratoryMethods/BacteriologicalAnalytical ManualBA M/ucm070830. htm
(2004).
3 Nordstrom, Jessica L., et al. "Development of a multiplex real-time PCR assay with an internal amplification
control for the detection of total and pathogenic Vibrio parahaemolyticus bacteria in oysters." Applied and
Environmental Microbiology 73.18 (2007): 5840-5847.
4 Bej, Asim K., et al. "Detection of total and hemolysin-producing Vibrio parahaemolyticus in shellfish using
multiplex PCR amplification of tl, tdh and trh." Journal of Microbiological Methods 36.3 (1999): 215-225.
5 Yeung, PS Marie, and Kathryn J. Boor. "Epidemiology, pathogenesis, and prevention of foodborne Vibrio
parahaemolyticus infections." Foodborne Pathogens & Disease 1.2 (2004): 74-88.
6 IIDA, TETSUYA, et al. "Evidence for genetic linkage between the ure and trh genes in Vibrio parahaemolyticus."
Journal of medical microbiology 46.8 (1997): 639-645.
7 Ward, Linda N., and Asim K. Bej. "Detection of Vibrio parahaemolyticus in shellfish by use of multiplexed real-time
PCR with TaqMan fluorescent probes." Applied and environmental microbiology 72.3 (2006): 2031-2042.
8 Kishishita, Masamichi, et al. "Sequence variation in the thermostable direct hemolysin-related hemolysin (trh)
gene of Vibrio parahaemolyticus." Applied and environmental microbiology 58.8 (1992): 2449-2457.
9 González-Escalona, Narjol, George M. Blackstone, and Angelo DePaola. "Characterization of a Vibrio alginolyticus
strain, isolated from Alaskan oysters, carrying a hemolysin gene similar to the thermostable direct hemolysin-
related hemolysin gene (trh) of Vibrio parahaemolyticus." Applied and environmental microbiology 72.12 (2006):
7925-7929.
10 Myers, Michael L., Gitika Panicker, and Asim K. Bej. "PCR detection of a newly emerged pandemic Vibrio
parahaemolyticus O3: K6 pathogen in pure cultures and seeded waters from the Gulf of Mexico." Applied and
environmental microbiology 69.4 (2003): 2194-2200.
11 Chen, Yuansha, et al. "Comparative genomic analysis of Vibrio parahaemolyticus: serotype conversion and
virulence." BMC genomics 12.1 (2011): 294.
12 Park, Jie Yeun, et al. "Multiplex Real-time Polymerase Chain Reaction Assays for Simultaneous Detection of< i>
Vibrio cholerae, Vibrio parahaemolyticus, and Vibrio vulnificus." Osong Public Health and Research Perspectives 4.3
(2013): 133-139.
Proposal No. 15-110

1
2014 Validation Data
Linear Range, Limit of Detection, Sensitivity
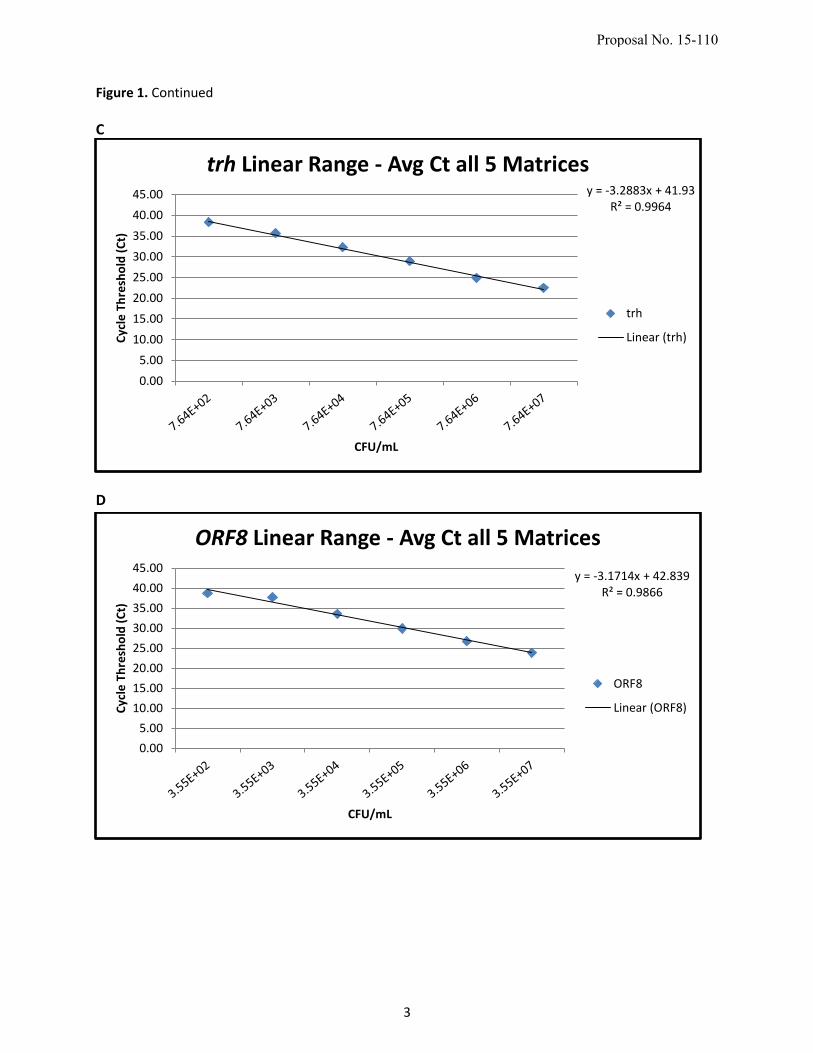
Purpose To determine the range where the results are proportional to the concentration of the analyte present in the sample. To identify the minimum concentration at which the analyte can be identified and determine at what concentration detection occurs with an acceptable level of precision and accuracy. Method In order to determine the Limit of Detection and Linear Range of the assay, 5 oyster matrices were spiked with Vp ATCC BAA-240 and Vp WA4647. In addition, the dilution series for each target without oyster tissue was also tested. For each matrix 18 APW tubes were seeded with 1g of oyster tissue. The tubes were enriched overnight at 35°C for 18-24 hours. A dilution series of the 16-20 hour Vibrio enrichment was made in APW, the enriched APW tubes were then spiked with each dilution of target organism. The spiking level for Vp ATCC BAA-240 ranged from 3.55 x 10⁻¹ to 3.55 x 10⁷ CFU/mL and for Vp WA4647 it ranged from 7.64 x 10⁻¹ to 7.64 x 10⁷ CFU/mL. The spiked APW tubes and dilutions were then immediately lysed. DNA extraction was performed and then PCR was run in duplicate. Instrument detection limit was determined without enrichment of the spiked APW tubes. The method detection limit was determined using APW tubes enriched after spiking for 18-24 hours. Results Vp ATCC BAA-240 was used to determine the Linear Range and Limit of Detection (LOD) for tlh, tdh, and ORF8. WA4647 was used to determine the Linear Range and LOD for trh. The Internal Control (IC) Ct averaged around 25 cycles and was not affected by low or high Vp spiking levels. Instrument detection limit The instrument detection limit for tlh and tdh is 100% at 3500 CFU/mL, 30% at 3.5 CFU/mL and 0% at .35 CFU/mL. ORF8 has a detection limit of 90% at 3500 CFU/mL, 10% at 3.5 CFU/mL, and 0% at .35 CFU/mL. The instrument detection limit for trh is 100% at 7600 CFU/mL, 40% at 76 CFU/mL, and falls to 0% at 7.6 CFU/mL. Method detection limit The method detection limit for tlh, tdh, and ORF8 is 100% at 5.8 cfu/g and falls to 33% at .58 cfu/g. The method detection limit for trh is 100% at .85 cfu/g and falls to 0% at .085 cfu/g. Efficiency See figures below tlh = slope -3.09 = 111% tdh = slope -3.23 = 104% trh = slope -3.28 = 102% ORF8 = slope -3.17 = 107%
Proposal No. 15-110

2
Figure 1. Linear range graphs of (A) tlh,(B) tdh, (C) trh, and (D) ORF8 along with slope equations used to calculate PCR efficiency and R2 values. The data points were calculated by averaging all Ct values across all five spiked matrices.
A
B
y = -3.0933x + 41.929 R² = 0.9951
0.00
5.00
10.00
15.00
20.00
25.00
30.00
35.00
40.00
45.00
Cyc
le T
hre
sho
ld (
Ct)
CFU/mL
tlh Linear Range - Avg Ct all 5 Matrices
tlh
Linear (tlh)
y = -3.2329x + 39.669 R² = 0.995
0.00
5.00
10.00
15.00
20.00
25.00
30.00
35.00
40.00
45.00
Cyc
le T
hre
sho
ld (
Ct)
CFU/mL
tdh Linear Range - Avg Ct all 5 Matrices
tdh
Linear (tdh)
Proposal No. 15-110
3
Figure 1. Continued
C
D
y = -3.2883x + 41.93 R² = 0.9964
0.00
5.00
10.00
15.00
20.00
25.00
30.00
35.00
40.00
45.00
Cyc
le T
hre
sho
ld (
Ct)
CFU/mL
trh Linear Range - Avg Ct all 5 Matrices
trh
Linear (trh)
y = -3.1714x + 42.839 R² = 0.9866
0.00
5.00
10.00
15.00
20.00
25.00
30.00
35.00
40.00
45.00
Cyc
le T
hre
sho
ld (
Ct)
CFU/mL
ORF8 Linear Range - Avg Ct all 5 Matrices
ORF8
Linear (ORF8)
Proposal No. 15-110

4
Figures 2. Graphs of the average Ct values for all data points within a matrix for (A) tlh,(B) tdh,(C) trh,
and (D) ORF8.
A
B
0.00
5.00
10.00
15.00
20.00
25.00
30.00
35.00
40.00
45.00
Cyc
le T
hre
sho
ld (
Ct)
CFU/mL
BAA-240 - tlh All Data
No Matrix
Matrix 6
Matrix 8
Matrix 13
Matrix 22
Matrix 24
0.00
5.00
10.00
15.00
20.00
25.00
30.00
35.00
40.00
Cyc
le T
hre
sho
ld (
Ct)
CFU/mL
BAA-240 - tdh All Data
No Matrix
Matrix 6
Matrix 8
Matrix 13
Matrix 22
Matrix 24
Proposal No. 15-110

5
Figure 2. Continued
C
D
0.00
5.00
10.00
15.00
20.00
25.00
30.00
35.00
40.00
45.00
WA4647 - trh All Data
No Matrix
Matrix 6
Matrix 8
Matrix 13
Matrix 22
Matrix 24
0.005.00
10.0015.0020.0025.0030.0035.0040.0045.00
Cyc
le T
hre
sho
ld (
Ct)
CFU/mL
BAA-240 - ORF8 All Data
Matrix 6
Matrix 8
Matrix 13
Matrix 22
Matrix 24
No Matrix
Proposal No. 15-110

6
Figure 3. Graph of the average Ct for the Internal Control (IC) calculated from all matrices spiked with Vp
BAA-240.
0.00
5.00
10.00
15.00
20.00
25.00
30.00
35.00
40.00
45.00
Cyc
le T
hre
sho
ld (
Ct)
CFU/mL
Average Ct for Internal Control
IC
Proposal No. 15-110

7
Inclusivity
Purpose To assess the ability of the method to detect a wide range of target strains in various oyster tissues. Method Vibrio parahaemolyticus (Vp) strains were grown in APW for 18-24 hours. DNA was extracted using the MagNA Pure LC and was frozen at -20°C until PCR was performed in duplicate. The goal was at least 30 strains for each target. Confirmation was performed through a secondary assay. Since tlh is a species specific marker, a positive Vp identification through biochemicals or by ATCC paperwork was used as confirmation. For tdh some isolates were confirmed by NOAA and others were confirmed using tdh primers from Nordstrom et al. 2007. The trh marker was a little more problematic due to 2 variations of the trh gene. All isolates were confirmed using the the FDA BAM trh primer set and anything with discrepant results between our assay and the FDA assay we confirmed with a biochemical urease test. The ability of Vp to hydrolyze urea has been shown to be indicative of the presence of the trh gene (Iida et al paper 1997). The ORF8 pandemic marker was confirmed using the primer set from Myers et al. 2003. Results See Table 1 for the breakdown of strains used and targets tested. Primer / Probe Sensitivity Sensitivity= (# of true positives/ (# of true positives + # of false negatives)) tlh sensitivity = 78/78 = 100% tlh Sensitivity tdh sensitivity =38/38 = 100% tdh Sensitivity trh sensitivity = 33/33 = 100% trh Sensitivity ORF8 senstivity = 29/29 = 100% ORF8 Sensitivity
Proposal No. 15-110

8
Table 1. Inclusivity panel with results by target. Targets not tested are blocked out.
Strain Source tlh tdh trh orf8
Strain Source tlh tdh trh orf8
F5828 CDC + + +
NWF 797 NOAA - NWFSC + - -
F5835 CDC + + +
NWF 800 NOAA - NWFSC + -
F5847 CDC + + +
NWF 805 NOAA - NWFSC + -
F6820 CDC + + +
NWF 843 NOAA - NWFSC + -
F7630 CDC + + +
NWF 846 NOAA - NWFSC + + +
F7635 CDC + + +
NWF 864 NOAA - NWFSC + + +
F7636 CDC + + +
NWF 930 NOAA - NWFSC + + - +
F7680 CDC + + +
VPHY145 NOAA - NWFSC + + +
F8701 CDC + + +
5412 WA PHL + +
F8949 CDC + + +
5419 WA PHL + +
F9083 CDC + + +
5423 WA PHL + + +
K0071 CDC + + +
5424 WA PHL + +
K0456 CDC + - + - 5425 WA PHL + + +
K1533 CDC + + +
5426 WA PHL + +
17803 ATCC + - +
5429 WA PHL + +
27519 ATCC + -
5430 WA PHL + +
27969 ATCC +
5434 WA PHL + +
33844 ATCC + +
5436 WA PHL + +
33845 ATCC + +
5437 WA PHL + +
33846 ATCC + +
5442 WA PHL + +
33847 ATCC + +
5444 WA PHL + +
35117 ATCC + -
5454 WA PHL + +
35118 ATCC + +
5456 WA PHL + +
43996 ATCC + +
5463 WA PHL + +
49398 ATCC + -
5468 WA PHL + +
AP14861 NOAA - NWFSC + + +
5469 WA PHL + +
BAA-238 ATCC + + +
5470 WA PHL + +
BAA-239 ATCC + + +
5471 WA PHL + +
BAA-240 ATCC + + +
5473 WA PHL + +
BAA-241 ATCC + + +
5474 WA PHL + +
BAA-242 ATCC + + +
5475 WA PHL + +
BAC03255 NOAA - NWFSC + + +
5487 WA PHL + +
BE98-2029 NOAA - NWFSC + + +
5488 WA PHL + +
NWF 261 NOAA - NWFSC + - - -
5492 WA PHL + +
NWF 512 NOAA - NWFSC + - - -
5501 WA PHL + +
NWF 586 NOAA - NWFSC + + - +
5508 WA PHL + +
NWF 605 NOAA - NWFSC + + - +
5518 WA PHL + +
NWF 609 NOAA - NWFSC + + - +
5519 WA PHL + +
NWF 735 NOAA - NWFSC + + +
Total Confirmed Isolated 78 38 33 29
NWF 782 NOAA - NWFSC + + - +
Proposal No. 15-110
9
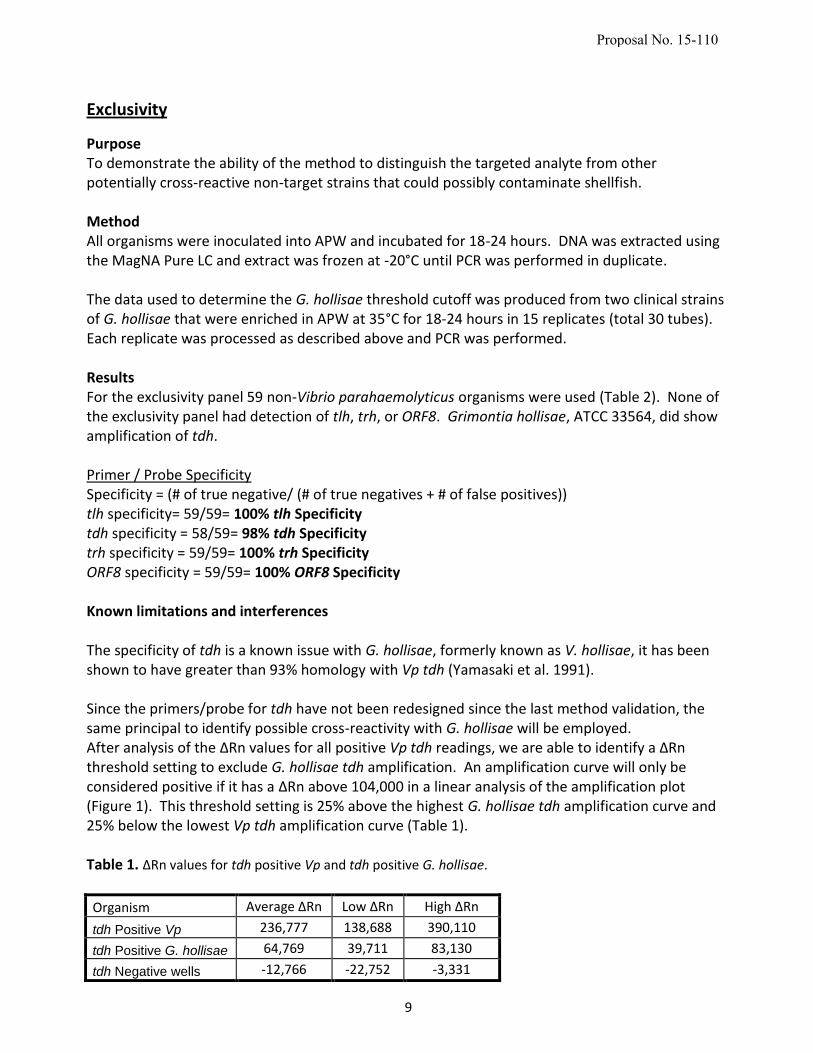
Exclusivity
Purpose To demonstrate the ability of the method to distinguish the targeted analyte from other potentially cross-reactive non-target strains that could possibly contaminate shellfish. Method All organisms were inoculated into APW and incubated for 18-24 hours. DNA was extracted using the MagNA Pure LC and extract was frozen at -20°C until PCR was performed in duplicate. The data used to determine the G. hollisae threshold cutoff was produced from two clinical strains of G. hollisae that were enriched in APW at 35°C for 18-24 hours in 15 replicates (total 30 tubes). Each replicate was processed as described above and PCR was performed. Results For the exclusivity panel 59 non-Vibrio parahaemolyticus organisms were used (Table 2). None of the exclusivity panel had detection of tlh, trh, or ORF8. Grimontia hollisae, ATCC 33564, did show amplification of tdh. Primer / Probe Specificity Specificity = (# of true negative/ (# of true negatives + # of false positives)) tlh specificity= 59/59= 100% tlh Specificity tdh specificity = 58/59= 98% tdh Specificity trh specificity = 59/59= 100% trh Specificity ORF8 specificity = 59/59= 100% ORF8 Specificity Known limitations and interferences The specificity of tdh is a known issue with G. hollisae, formerly known as V. hollisae, it has been shown to have greater than 93% homology with Vp tdh (Yamasaki et al. 1991). Since the primers/probe for tdh have not been redesigned since the last method validation, the same principal to identify possible cross-reactivity with G. hollisae will be employed. After analysis of the ΔRn values for all positive Vp tdh readings, we are able to identify a ΔRn threshold setting to exclude G. hollisae tdh amplification. An amplification curve will only be considered positive if it has a ΔRn above 104,000 in a linear analysis of the amplification plot (Figure 1). This threshold setting is 25% above the highest G. hollisae tdh amplification curve and 25% below the lowest Vp tdh amplification curve (Table 1). Table 1. ΔRn values for tdh positive Vp and tdh positive G. hollisae.
Organism Average ΔRn Low ΔRn High ΔRn
tdh Positive Vp 236,777 138,688 390,110
tdh Positive G. hollisae 64,769 39,711 83,130
tdh Negative wells -12,766 -22,752 -3,331
Proposal No. 15-110

10
Figure 1. Linear amplification plot showing true Vp positive tdh amplification and G. hollisae tdh amplification.
Table 2. All Exclusivity strains tested and results by target. All strains were purchased from ATCC, unless
noted in parentheses.
Organism ATCC # tlh tdh trh orf8
E. coli 25922 - - - -
G. hollisae 33564 - + - -
K. pneumoniae 33495 - - - -
P. aeruginosa 33495 - - - -
S. aureus 10145 - - - -
S. sonnei 25925 - - - -
S. typhimurium 9290 - - - -
V. aestuarians 35048 - - - -
V. alginolyticus 17749 - - - -
V. algosus 14390 - - - -
V. campbellii 25920 - - - -
V. cholerae 39050 - - - -
V. cinncinatiensis 35912 - - - -
V. furnissii 33813 - - - -
V. marinagilis 14398 - - - -
V. marinofulvus 14395 - - - -
V. marinovulgaris 14394 - - - -
V. metschnikovii 700040 - - - -
V. mimicus 33653 - - - -
V. natriegens 14048 - - - -
V. nereis 25917 - - - -
V. nigripulchritudo 27043 - - - -
V. ponticus 14391 - - - -
V. proteolyticus 15338 - - - -
V. spledidus 33789 - - - -
V. tubiashii 19106 - - - -
Threshold Cutoff
True Vp Positive tdh
G. hollisae tdh Amplification
Proposal No. 15-110

11
Table 1. Exclusivity Data (continued).
Organism ATCC # tlh tdh trh orf8
V. vulnificus 06-2410 (CDC) - - - -
V. vulnificus 06-2450 (CDC) - - - -
V. vulnificus 07-2405 (CDC) - - - -
V. vulnificus 08-2468 (CDC) - - - -
V. vulnificus 08-2470 (CDC) - - - -
V. vulnificus 08-2472 (CDC) - - - -
V. vulnificus 08-2485 (CDC) - - - -
V. vulnificus 1831-81 (CDC) - - - -
V. vulnificus 2009V-1002 (CDC) - - - -
V. vulnificus 2009V-1055 (CDC) - - - -
V. vulnificus 2010V-1021 (CDC) - - - -
V. vulnificus 2011V-1065 (CDC) - - - -
V. vulnificus 2011V-1162 (CDC) - - - -
V. vulnificus 2012V-1089 (CDC) - - - -
V. vulnificus 2013V-1091 (CDC) - - - -
V. vulnificus 209V-1035 (CDC) - - - -
V. vulnificus 2409-05 (CDC) - - - -
V. vulnificus 2431-01 (CDC) - - - -
V. vulnificus 2431-04 (CDC) - - - -
V. vulnificus 2473-85 (CDC) - - - -
V. vulnificus 2492-88 (CDC) - - - -
V. vulnificus 2809-78 (CDC) - - - -
V. vulnificus 430-79 (CDC) - - - -
V. vulnificus 774-83 (CDC) - - - -
V. vulnificus AM38622 (CDC) - - - -
V. vulnificus AM38623 (CDC) - - - -
V. vulnificus AM38625 (CDC) - - - -
V. vulnificus 27562 - - - -
V. vulnificus 29307 - - - -
A. trota 2013V-1197 (CDC) - - - -
A. punctata N/A (CDC) - - - -
A. veronii N/A (CDC) - - - -
Total Strains 59
Proposal No. 15-110
12
Accuracy/Trueness
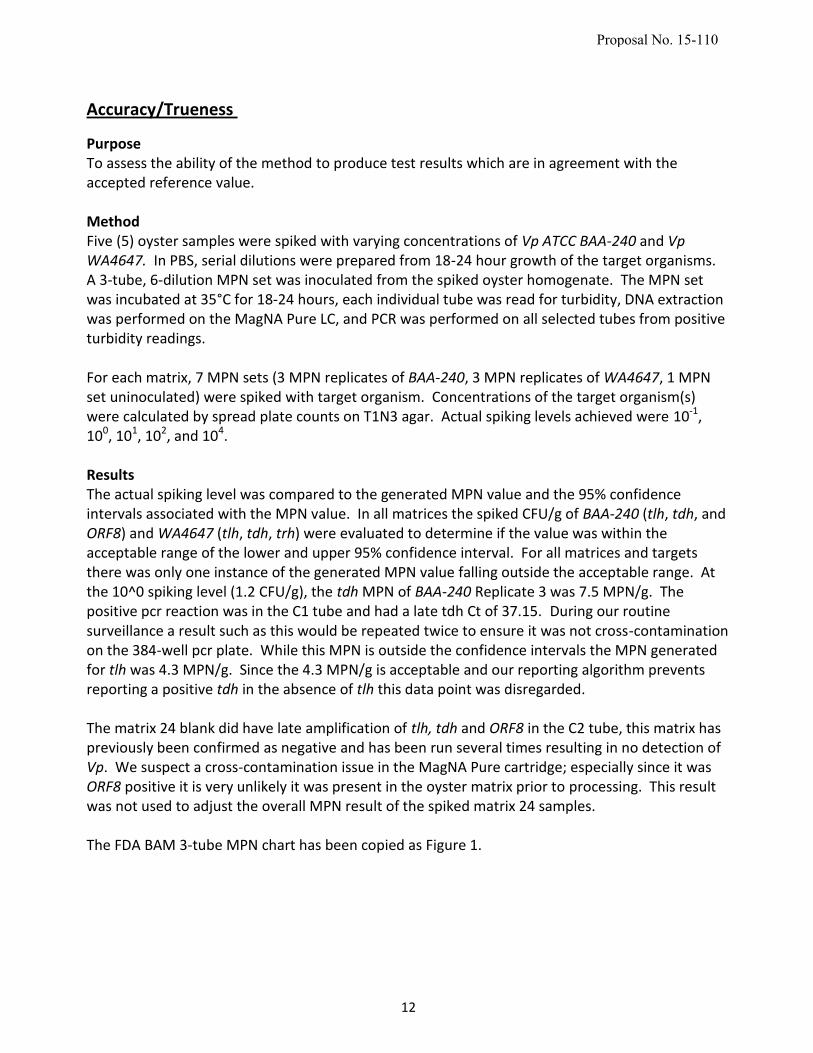
Purpose To assess the ability of the method to produce test results which are in agreement with the accepted reference value. Method Five (5) oyster samples were spiked with varying concentrations of Vp ATCC BAA-240 and Vp WA4647. In PBS, serial dilutions were prepared from 18-24 hour growth of the target organisms. A 3-tube, 6-dilution MPN set was inoculated from the spiked oyster homogenate. The MPN set was incubated at 35°C for 18-24 hours, each individual tube was read for turbidity, DNA extraction was performed on the MagNA Pure LC, and PCR was performed on all selected tubes from positive turbidity readings. For each matrix, 7 MPN sets (3 MPN replicates of BAA-240, 3 MPN replicates of WA4647, 1 MPN set uninoculated) were spiked with target organism. Concentrations of the target organism(s) were calculated by spread plate counts on T1N3 agar. Actual spiking levels achieved were 10-1, 100, 101, 102, and 104. Results The actual spiking level was compared to the generated MPN value and the 95% confidence intervals associated with the MPN value. In all matrices the spiked CFU/g of BAA-240 (tlh, tdh, and ORF8) and WA4647 (tlh, tdh, trh) were evaluated to determine if the value was within the acceptable range of the lower and upper 95% confidence interval. For all matrices and targets there was only one instance of the generated MPN value falling outside the acceptable range. At the 10^0 spiking level (1.2 CFU/g), the tdh MPN of BAA-240 Replicate 3 was 7.5 MPN/g. The positive pcr reaction was in the C1 tube and had a late tdh Ct of 37.15. During our routine surveillance a result such as this would be repeated twice to ensure it was not cross-contamination on the 384-well pcr plate. While this MPN is outside the confidence intervals the MPN generated for tlh was 4.3 MPN/g. Since the 4.3 MPN/g is acceptable and our reporting algorithm prevents reporting a positive tdh in the absence of tlh this data point was disregarded. The matrix 24 blank did have late amplification of tlh, tdh and ORF8 in the C2 tube, this matrix has previously been confirmed as negative and has been run several times resulting in no detection of Vp. We suspect a cross-contamination issue in the MagNA Pure cartridge; especially since it was ORF8 positive it is very unlikely it was present in the oyster matrix prior to processing. This result was not used to adjust the overall MPN result of the spiked matrix 24 samples. The FDA BAM 3-tube MPN chart has been copied as Figure 1.
Proposal No. 15-110

13
Table 1. Tables display spiking level and calculated MPN along with the allowable range for associated MPN values. For each matrix 3 replicated were performed per target (R1, R2, and R3). (A) Matrix 6 – ATCC BAA-240, Matrix 7 – WA4647 (B) Matrix 8 – ATCC BAA-240 & WA4647 (C) Matrix 13 - ATCC BAA-240 & WA4647 (D) Matrix 22 - ATCC BAA-240 & WA4647 (E) Matrix 24 - ATCC BAA-240 & WA4647.
A
MPN/g
Allowable Range
Spiking Level
Organism Actual CFU/g
Target R1 R2 R3
BAM MPN/g
Lower CI
Upper CI
10^-1
ATCC BAA-240
0.17
tlh 0.36 0.92 0.36
0.36 0.017 1.8
tdh 0.36 0.92 0.36
0.92 0.14 3.8
orf8 0.36 0.92 0.36
WA4647 0.63
tlh 0.36 0.92 0.92
tdh 0.36 0.92 0.92
trh 0.36 0.92 0.92
B
MPN/g
Allowable Range
Spiking Level
Organism Actual CFU/g
Target R1 R2 R3
BAM MPN/g
Lower CI
Upper CI
10^0
ATCC BAA-240
1.2
tlh 4.3 3.8 4.3
2.3 0.46 9.4
tdh 4.3 3.8 7.5*
3.8 0.87 11
orf8 2.3 3.8 4.3
4.3 0.9 18
WA4647 6.3
tlh 9.3 23 21
7.5 1.7 20
tdh 9.3 23 21
21 4 43
trh 2.3 3.8 4.3
23 4.6 94
*late Ct C
MPN/g
Allowable Range
Spiking Level
Organism Actual CFU/g
Target R1 R2 R3
BAM MPN/g
Lower CI
Upper CI
10^1
ATCC BAA-240
14
tlh 43 43 43
43 9 180
tdh 43 43 43
75 17 200
orf8 43 43 43
93 18 420
WA4647 84
tlh 75 93 120
120 37 420
tdh 75 150 120
150 37 420
trh 75 93 120
Proposal No. 15-110

14
Table 1. Continued
D
MPN/g
Allowable Range
Spiking Level
Organism Actual CFU/g
Target R1 R2 R3
BAM MPN/g
Lower CI
Upper CI
10^2
ATCC BAA-240
460
tlh 430 240 930
240 42 1000
tdh 430 240 2400
430 90 1800
orf8 430 240 930
930 180 4200
WA4647 630
tlh 430 930 430
2400 420 10000
tdh 430 930 430
trh 430 930 430
E
MPN/g
Allowable Range
Spiking Level
Organism Actual CFU/g
Target R1 R2 R3
BAM MPN/g
Lower CI
Upper CI
10^4
ATCC BAA-240
58,000
tlh 46,000 46,000 46,000
24,000 4,200 100,000
tdh 46,000 46,000 46,000
46,000 9,000 200,000
orf8 46,000 46,000 46,000
WA4647 58,000
tlh 24,000 24,000 46,000
tdh 24,000 24,000 46,000
trh 24,000 24,000 46,000
Figure 1. FDA BAM 3-tube MPN chart.
Proposal No. 15-110

15
Precision/Recovery
Purpose To assess the closeness of agreement between independent rest results obtained under stipulated conditions and the percentage of an analyte recovered following sample analysis.
Method The data generated in the accuracy/trueness phase was used to evaluate precision/recovery. The variation in the total number of tubes tested is determined by the turbidity in the MPN series and can vary between replicates without affecting overall results. Results The precision of the assay is difficult to demonstrate due to the nature of enumerating through MPN dilution sets. However, by showing the total number of positive tubes/target the precision of the assay is demonstrated between all targets tested at a specific spiking level. Table 1. MPN results for all matrices along with the total number of positive tubes in the MPN dilution series/total number of tubes tested (determined by turbidity). (A) Matrix 6 – ATCC BAA-240, Matrix 7 – WA4647 (B) Matrix 8 – ATCC BAA-240 & WA4647 (C) Matrix 13 - ATCC BAA-240 & WA4647 (D) Matrix 22 - ATCC BAA-240 & WA4647 (E) Matrix 24 - ATCC BAA-240 & WA4647.
A
Data
Spiking Level Organism
Actual CFU/g
Target R1 R2 R3
M#6&7 MPN/g tubes MPN/g tubes MPN/g tubes
10^-1
ATCC BAA-240
0.17
tlh 0.36 1/12 0.92 2/12 0.36 1/12
tdh 0.36 1/12 0.92 2/12 0.36 1/12
orf8 0.36 1/12 0.92 2/12 0.36 1/12
WA4647 0.63
tlh 0.36 1/12 0.92 2/15 0.92 2/12
tdh 0.36 1/12 0.92 2/15 0.92 2/12
trh 0.36 1/12 0.92 2/15 0.92 2/12
B
Data
Spiking Level Organism
Actual CFU/g
Target R1 R2 R3
M#8 MPN/g tubes MPN/g tubes MPN/g tubes
10^0
ATCC BAA-240
1.2
tlh 4.3 4/12 3.8 4/15 4.3 4/12
tdh 4.3 4/12 3.8 4/15 7.5* 5/12
orf8 2.3 3/12 3.8 4/15 4.3 4/12
WA4647 6.3
tlh 9.3 5/12 23 6/12 21 7/12
tdh 9.3 5/12 23 6/12 21 7/12
trh 2.3 5/12 3.8 6/12 4.3 7/12
*late Ct – see Accuracy/Trueness data for explanation.
Proposal No. 15-110

16
Table 1. Continued
C
Data
Spiking Level Organism
Actual CFU/g
Target R1 R2 R3
M#13 MPN/g tubes MPN/g tubes MPN/g tubes
10^1
ATCC BAA-240
14
tlh 43 7/12 43 7/12 43 7/12
tdh 43 7/12 43 7/12 43 7/12
orf8 43 7/12 43 7/12 43 7/12
WA4647 84
tlh 75 8/12 93 8/12 120 9/15
tdh 75 8/12 150 9/12 120 9/15
trh 75 8/12 93 8/12 120 9/15
D
Data
Spiking Level Organism
Actual CFU/g
Target R1 R2 R3
M#22 MPN/g tubes MPN/g tubes MPN/g tubes
10^2
ATCC BAA-240
460
tlh 430 10/15 240 9/12 930 11/15
tdh 430 10/15 240 9/12 2400 12/15
orf8 430 10/15 240 9/12 930 11/15
WA4647 630
tlh 430 10/15 930 11/15 430 10/15
tdh 430 10/15 930 11/15 430 10/15
trh 430 10/15 930 11/15 430 10/15
E
Data
Spiking Level Organism
Actual CFU/g
Target R1 R2 R3
M#24 MPN/g tubes MPN/g tubes MPN/g tubes
10^4
ATCC BAA-240
58000
tlh 46000 16/18 46000 16/18 46000 16/18
tdh 46000 16/18 46000 16/18 46000 16/18
orf8 46000 16/18 46000 16/18 46000 16/18
WA4647 58000
tlh 24000 15/18 24000 15/18 46000 16/18
tdh 24000 15/18 24000 15/18 46000 16/18
trh 24000 15/18 24000 15/18 46000 16/18
Proposal No. 15-110

17
Specificity/Competitor Strain
Purpose To assess the ability of the method to measure only what it is intended to measure. Method Two (2) oyster samples, both from Matrix #13, were spiked with 101 CFU/g of Vp ATCC BAA-240 and Vp WA4647. The target organisms were prepared in PBS serial dilutions from 18-24 hour growth. Along with the target organisms the matrices were also spiked with V. alginolyticus at one log higher (102). A 3-tube, 6-dilution MPN set was inoculated from the spiked oyster homogenate. The MPN set was incubated at 35°C for 18-24 hours, each individual tube was read for turbidity, DNA extraction was performed on the MagNA Pure LC, and PCR was performed on all selected tubes from turbidity readings. Concentrations of the target organism(s) were calculated by spread plate counts on T1N3 agar. Results There was no issue detecting the target organism in the presence of V. alginolyticus. All MPN values generated were within the acceptable ranges. Table 1. Vp WA4647 spiked at 84 cfu/g (2520 cells); Competitor V. alginolyticus spiked at 380 cfu/g (11400 cells).
tlh MPN/g Lower
CI Upper
CI tdh MPN/g Lower
CI Upper
CI trh MPN/g Lower
CI Upper
CI
R1 3-2-0 x10 93 18 420 3-2-0 x10 93 18 420 3-2-0 x10 93 18 420
R2 3-2-0 x10 93 18 420 3-2-1* x10 150 37 420 3-2-0 x10 93 18 420
*Late Ct Table 2. Vp ATCC BAA-240 spiked at 14 cfu/g (420 cells); Competitor V. alginolyticus spiked at 130 cfu/g (3900 cells)
*The extra positive tube in the tdh MPN level for Vp WA4647 R2 resulted from a very late tdh only amplification (Ct = 39.87). Usually, when this situation occurs it is due to cross-contamination on the 384-well PCR plate and the extract will be re-run twice to ensure proper reporting.
tlh MPN/g Lower
CI Upper
CI tdh MPN/g Lower
CI Upper
CI orf8 MPN/g Lower
CI Upper
CI
R1 3-0-0 x10 23 4.6 94 3-0-0 x10 23 4.6 94 3-0-0 x10 23 4.6 94
R2 3-1-0 x10 43 9 180 3-1-0 x10 43 9 180 3-1-0 x10 43 9 180
Proposal No. 15-110
18
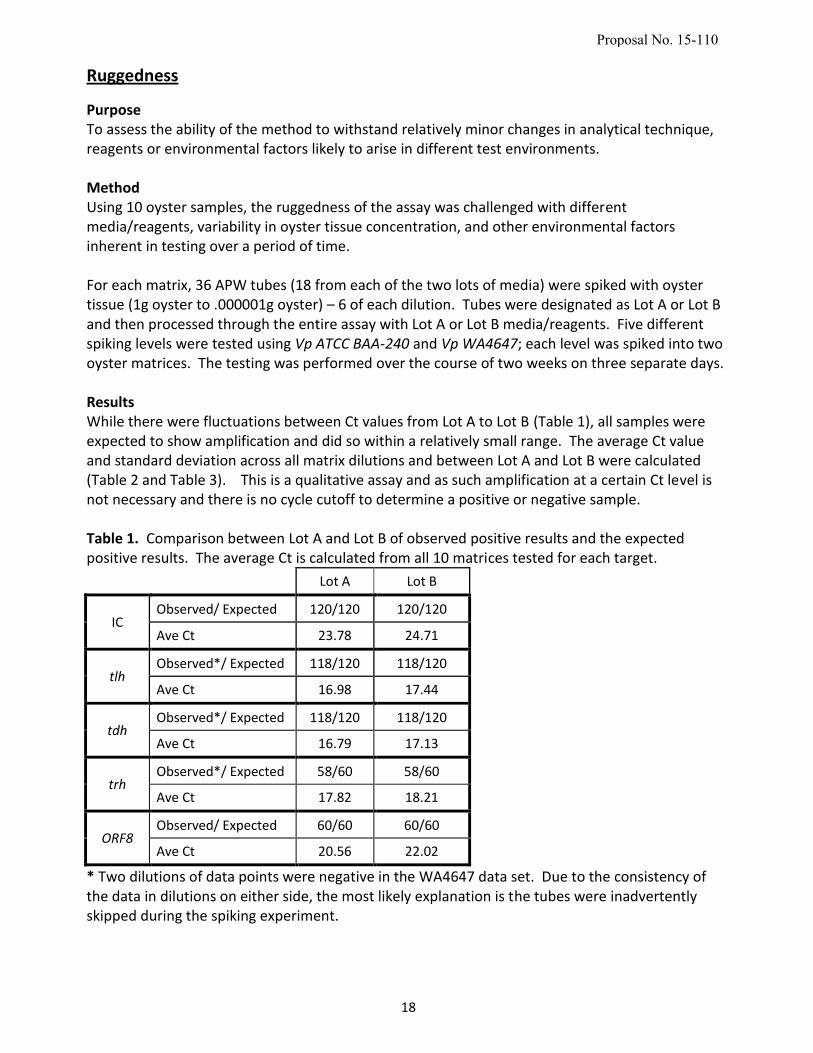
Ruggedness
Purpose To assess the ability of the method to withstand relatively minor changes in analytical technique, reagents or environmental factors likely to arise in different test environments. Method Using 10 oyster samples, the ruggedness of the assay was challenged with different media/reagents, variability in oyster tissue concentration, and other environmental factors inherent in testing over a period of time. For each matrix, 36 APW tubes (18 from each of the two lots of media) were spiked with oyster tissue (1g oyster to .000001g oyster) – 6 of each dilution. Tubes were designated as Lot A or Lot B and then processed through the entire assay with Lot A or Lot B media/reagents. Five different spiking levels were tested using Vp ATCC BAA-240 and Vp WA4647; each level was spiked into two oyster matrices. The testing was performed over the course of two weeks on three separate days. Results While there were fluctuations between Ct values from Lot A to Lot B (Table 1), all samples were expected to show amplification and did so within a relatively small range. The average Ct value and standard deviation across all matrix dilutions and between Lot A and Lot B were calculated (Table 2 and Table 3). This is a qualitative assay and as such amplification at a certain Ct level is not necessary and there is no cycle cutoff to determine a positive or negative sample. Table 1. Comparison between Lot A and Lot B of observed positive results and the expected positive results. The average Ct is calculated from all 10 matrices tested for each target.
Lot A Lot B
IC Observed/ Expected 120/120 120/120
Ave Ct 23.78 24.71
tlh Observed*/ Expected 118/120 118/120
Ave Ct 16.98 17.44
tdh Observed*/ Expected 118/120 118/120
Ave Ct 16.79 17.13
trh Observed*/ Expected 58/60 58/60
Ave Ct 17.82 18.21
ORF8 Observed/ Expected 60/60 60/60
Ave Ct 20.56 22.02
* Two dilutions of data points were negative in the WA4647 data set. Due to the consistency of the data in dilutions on either side, the most likely explanation is the tubes were inadvertently skipped during the spiking experiment.
Proposal No. 15-110

19
Table 2. Low and High Ct values across all matrices and oyster concentrations.
IC Low
IC High
tlh Low
tlh High
tdh Low
tdh High
trh Low
trh High
ORF8 Low
ORF8 High
ATCC BAA-240
Lot A 21.16 25.07 16.23 17.94 15.29 17.31 n/a n/a 19.06 21.34
Lot B 19.05 26.12 16.00 20.48 15.38 19.54 n/a n/a 19.74 24.41
WA4647 Lot A 20.73 24.96 15.68 19.97 15.73 20.40 16.35 21.27 n/a n/a
Lot B 19.35 27.89 15.85 18.67 15.97 19.02 16.74 20.52 n/a n/a
Table 3. Average Ct and Standard Deviation across all oyster concentrations and reagent/media lots for all samples spiked with ATCC BAA-240.
ATCC BAA-240
Matrix Samples
Spiking Level
(cfu/ml)
IC Avg Ct
IC StDev
tlh Avg Ct
tlh StDev
tdh Avg Ct
tdh StDev
ORF8 Avg Ct
ORF8 StDev
trh
2,5 6.50E+00 24.45 1.50 17.45 0.54 16.83 0.50 21.09 0.74 n/a
6,8 6.50E+01 24.47 1.67 17.32 0.44 16.71 0.40 20.96 0.66 n/a
13,15 4.40E+02 23.70 1.31 17.17 0.37 16.37 0.33 20.85 0.48 n/a
17,22 1.15E+04 24.23 1.49 18.00 0.89 17.30 0.80 21.80 1.19 n/a
24,27 1.15E+06 24.21 1.07 18.00 1.48 17.30 1.35 21.75 1.77 n/a
Table 4. Average Ct and Standard Deviation across all oyster concentrations and reagent/media lots for all samples spiked with WA4647
WA4647
Matrix Samples
Spiking Level
(cfu/ml)
IC Avg Ct
IC StDev
tlh Avg Ct
tlh StDev
tdh Avg Ct
tdh StDev
trh Avg Ct
trh StDev
ORF8
2,5 3.90E+00 24.60 1.94 17.07 0.91 17.12 1.00 18.13 0.99 n/a
6,8 3.90E+01 23.67 1.29 16.83 0.75 16.98 0.78 17.95 0.87 n/a
13,15 9.05E+02 23.97 1.72 16.67 0.55 16.88 0.60 17.87 0.74 n/a
17,22 9.90E+04 24.54 1.33 17.04 1.14 17.32 1.21 18.35 1.28 n/a
24,27 9.90E+06 24.61 1.46 16.60 0.56 16.84 0.60 17.81 0.79 n/a
Proposal No. 15-110

20
Screenshots from 2014 Vibrio Season
Run from July 17, 2014
Sample Numbers: S14-095, S14-096, S14-097, S14-098, S14-099, S14-100
Figure 1. Screenshot showing all targets amplified over 45 cycles. Targets color-coded with
legend at bottom of screenshot. For each multiplex 109 wells (including QC) were included.
Samples ranged from 12 to 18 wells (per multiplex).
Proposal No. 15-110
21
Figure 2. Internal control (IC) amplification plot. All wells in this run generated a positive
result; however in the presence of a positive marker the IC may be negative. Most Ct values
of our internal control range from 24 to 28, in this run a .00001g series MPN dilution tube
generated an earlier Ct than usual. Since all quantitation is done with the MPN values
generated from positive and negative tubes, PCR is presence/absence only so close scrutiny
of Ct values is not necessary.
Proposal No. 15-110

22
Figure 3. Thermolabile Hemolysin (tlh) amplification plot. Threshold set at approximately
20,000 ΔRn. One reaction with a significantly later Ct value is from a .01g dilution tube. No
cutoffs have been assigned for this assay (other than tdh), this late amplification curve is
considered positive.
Proposal No. 15-110
23
Figure 4. Positive QC for Multiplex 1. Shows amplification for IC (red), tlh (green), and vvha
(purple).
Proposal No. 15-110

24
Figure 5. Thermostabile direct hemolysin (tdh) logarithmic amplification plot.
Proposal No. 15-110
25
Figure 6. tdh linear amplification plot. Red arrow points to a reaction that was ruled
negative due to 104,000 ΔRn cutoff.
Proposal No. 15-110
26
Figure 7. TDH-related hemolysin (trh) amplification plot. For a tube to be positive for trh, tlh
must also been detected.
Proposal No. 15-110

27
Figure 8. Positive QC for Multiplex 2. Shows amplification for tdh (yellow), trh (orange),
ORF8 (blue).
Proposal No. 15-110
28
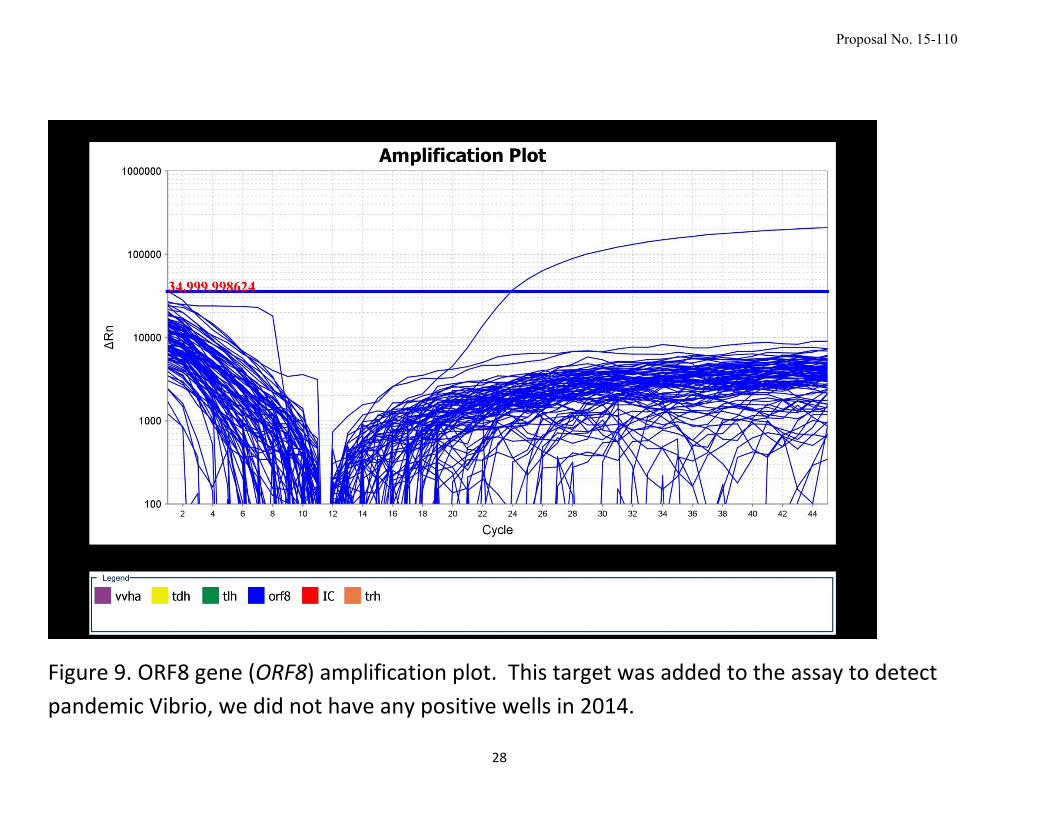
Figure 9. ORF8 gene (ORF8) amplification plot. This target was added to the assay to detect
pandemic Vibrio, we did not have any positive wells in 2014.
Proposal No. 15-110
29
State of Washington Department of Health
Public Health Laboratories 1610 N.E. 150th Street
Shoreline, Washington 98155 Phone (206) 418-5400 FAX (206) 418-5445
Procedure: Vibrio parahaemolyticus enumeration and detection through MPN and real-time PCR StarLims StarDoc ID #: _________ StarLims Version #: Approved By: Section Lead: ______________________________ ________________ _______ Name Signature Date Supervisor: ________________________________ ________________ _______ Name Signature Date Office Director: _____________________________ ________________ _______ Name Signature Date Laboratory Director: _________________________ ________________ _______ (if necessary)* Name Signature Date Supersedes Procedure of: __________________ (Date) * The Laboratory Director will sign all procedures that are new or where there has been major changes in the procedure.
Proposal No. 15-110

30
Principle
The purpose of this test is to rapidly quantify Vibrio parahaemolyticus (Vp) from oysters using a high throughput MPN based real-time PCR protocol. Culture based assays for the enumeration of Vp require a minimum of four days and require the Kanagawa test (media based) to detect pathogenicity. This assay was designed to provide quantitative results for total Vibrio parahaemolyticus (Vp tlh+), known pathogenic markers of Vibrio parahaemolyticus (Vp tdh+ and Vp trh+), as well as some strains of potential pandemic Vibrio (Vp ORF8+). Additionally, the assay utilizes an exogenous internal control (WA IC) and an investigational marker (vvhA) for Vibrio vulnificus (Vv). This test utilizes Taqman® probe real-time polymerase chain reactions to amplify 4 target genes from the Vibrio parahaemolyticus (Vp) genome as well as 1 target from the Vibrio vulnificus (Vv) genome. Vp 1) The thermolabile hemolysin, tlh gene 2) The thermostable direct hemolysin, tdh gene 3) The thermostable direct related hemolysin, trh gene 4) The filamentous phage (f237) ORF8, gene Vv 1) The cytolysin-hemolysin, vvhA gene Pre-Analytic
1. Test Ordering Process 1.1 Test Ordering Process Flow Chart-N/A
2. Specimen Collection
2.1 Specimen Collection Process Flow Chart-N/A 2.2 Specimen Collection Procedures-N/A 2.3 Safety Considerations-N/A
3. Specimen Transport
3.1 Samples should be shipped in waterproof, puncture resistant containers. Samples should not come into direct contact with ice.
4. Specimen Receiving and Processing 4.1 Specimen Receiving and Processing Flow Chart-N/A 4.2 Specimen Receiving and Processing Procedures-N/A
5. Specimen
5.1 Criteria For Rejection of Sample 5.1.1 Samples received over 10°C are considered acceptable only under the
following conditions: 5.1.1.1 The sample is shipped properly (adequate ice/cold packs) and was at an
elevated temperature at collection and has had a short transit time (collected and received within 12 hours).
Proposal No. 15-110

31
5.1.2 Sample processing at the lab must be initiated no more than 24 hours after collection. Samples received more than 24 hours after collection are considered unsatisfactory.
6. Other 6.1 Problems or Pitfalls-N/A 6.2 Computer Activities-N/A
Analytic
1. Reagents and Media 1.1 Materials
1.1.1 Phosphate Buffer Saline 1.1.2 Alkaline Peptone Water 1.1.3 Isopropanol, 70% 1.1.4 RNAse AWAY® 1.1.5 DNA Extraction Reagents – MagNA Pure LC 1.1.6 MagNAPure LC DNA Isolation Kit III (Bacteria, Fungi), (Roche, Cat. #
3264785) 1.1.7 PCR Reagents
1.1.7.1 Master Mix: Bioline SensiFAST™ Probe Hi-ROX Kit (BIO-82020) 1.1.7.2 Sterile Millipore water or other PCR grade water 1.1.7.3 TE buffer 1:10 1.1.7.4 Primers (See appendix A for sequences) 1.1.7.5 Probes (See appendix A for sequences)
1.2 Preparation 1.2.1 Media
1.2.1.1 Ingredients 1.2.1.1.1 Stock Buffer Solution
1.2.1.1.1.1 Potassium di-hydrogen Phosphate (KH2PO4) (J. T. Baker Cat. No. 3246-01 or equivalent)
1.2.1.1.1.2 Distilled Water 1.2.1.1.2 Phosphate Buffer Saline
1.2.1.1.2.1 Sodium Chloride (NaCl) (J.T. Baker Cat. No. 3264-05 or equivalent)
1.2.1.1.2.2 Stock Buffer Solution 1.2.1.1.2.3 Distilled Water
1.2.1.1.3 Alkaline Peptone Water 1.2.1.1.3.1 Peptone (BD Bacto Peptone Ref. No 211677) 1.2.1.1.3.2 Sodium Chloride (NaCl) (J.T. Baker Cat. No. 3264-05 or
equivalent) 1.2.1.1.3.3 Distilled Water
1.2.1.2 Formulation and Prepartion 1.2.1.2.1 Stock Buffer Soulution
1.2.1.2.1.1 Mix 17.0 grams of KH2PO4 with 250mL of DI water. Adjust pH to 7.2 using 1N NaOH. Using distilled water and volumetric flask, bring
volume to 500mL. Autoclave 15 minutes at 121° C. Store in
refrigerator. 1.2.1.2.2 Phosphate Buffer Saline (PBS)
Proposal No. 15-110

32
1.2.1.2.2.1 Mix 8.5 grams NaCl with 1.25mL of Stock Buffer Solution. Dilute to 1 liter with distilled water. Adjust pH to 7.4. Autoclave for 15
minutes @ 121° C. Final pH should be 7.2-7.5.
1.2.1.2.3 Alkaline Peptone Water (APW) 1.2.1.2.3.1 Mix 10 grams of Peptone and 10 grams of NaCl in 1 liter of
distilled water. Adjust pH to 8.5 +/- .02. Autoclave 10 minutes at 121° C.
1.2.2 Reagents 1.2.2.1 Record the receipt and preparation of all reagents in the PCR reagent log
book. All reagents must be labeled with a unique reagent number. The reagent number is sequentially recorded in the PCR reagent log where you can find, prep date, concentration, date received, date made, date opened, expiration date etc. The intent of the PCR reagent log book is to allow for complete reagent traceability. Therefore, the reagent numbers assigned to each item used must appear on the master mix prep sheet. Additionally the unique mastermix prep number assigned to each batch of mastermix must appear on the data sheet for all samples for which it was used. All sheets must be retained to allow traceback.
1.2.2.2 Use either filtered or sterilized MQ water from the Millipore filtration system or use commercially available PCR grade water. It is advisable to aliquot the water into smaller portions to minimize the potential for large scale contamination.
1.2.2.3 Prepare TE buffer by adding 10mL 1M Tris-HCl (pH 8.0) + 2mL 0.5M EDTA (pH 8.0). Dilute to a final volume of 1000mL MQ water. Autoclave. Store at room temperature.
1.2.2.4 Prepare supermixes containing primers and probes according to the worksheet. All sequences can be seen in appendix. Primers are diluted to 100µM stock concentrations with TE Buffer and stored at -20°C until use for supermix preparation.
1.2.2.5 Prepare exogenous control by adding 100µL TE Buffer to tube. Stock concentration will vary depending on volume synthesized. Create working concentration by diluting stock 1:10,000 in TE buffer. Freeze working concentration in 10µL aliquots (-20°C), before use add 990µL molecular grade water.
1.3 Performance Parameters-N/A 1.4 Storage Requirements
1.4.1 Container 1.4.1.1 Molecular grade water and TE Buffer can be stored in 50mL conical tubes 1.4.1.2 Primers, probes, and supermixes can be stored in 1.7mL Eppendorf
tubes. Supermixes are to be stored in low light transmitting tubes. 1.4.2 Temperature
1.4.2.1 Store primers and probes at -20°C 1.4.3 Stability
1.4.3.1 Reagents free from contamination are good for 1 year unless otherwise stated by manufacturer. Stocks of primers and probes are good for 5 years in freezer (-20°C). Working concentrations of primers and probes are good for 6 months in freezer (-20°C) Thawed working concentrations (Supermix) of primers and probes are good for 2 weeks refrigerated (2-8°C).
Proposal No. 15-110

33
1.4.4 Labeling 1.4.4.1 Labels should include: reagent name, date received, date prepared or
reconstituted (if necessary), expiration date, and storage temperature 2. Equipment
2.1 Type of Equipment 2.1.1 Thermometer 0°C-10°C 2.1.2 Sink 2.1.3 Blender with sterile blender jars. 2.1.4 Timer 2.1.5 Vortexer 2.1.6 Bulb pipetter 2.1.7 Incubator (35°C±0.5) 2.1.8 Dry bath, 70°C 2.1.9 Refrigerator, 2-4°C
2.1.10 Freezer, -20 to -80°C (-80°C preferred)
2.1.11 Microcentrifuge 2.1.12 Autoclavable waste container 2.1.13 Biological safety cabinets (BSC) or Air Clean PCR stations 2.1.14 Rainin pipettes
2.1.14.1 P-2 2.1.14.2 P-10 2.1.14.3 P-20 2.1.14.4 P-200 2.1.14.5 P-1000 2.1.14.6 Multi-channel (8) 2µL-25µL
2.1.15 Applied Biosystems® ViiA™ 7 Real Time PCR station 2.1.16 Roche MagNaPure LC DNA purification system 2.1.17 Ice bucket/refrigerated block 2.1.18 Vortexer 2.1.19 Refrigerator, 4°C 2.1.20 Freezer, -20 to -80°C 2.1.21 Autoclavable waste container 2.1.22 Microcentrifuge 2.1.23 PCR plate centrifuge. 2.1.24 384-well microtiter-plate stand
2.2 Preparation-N/A 2.3 Performance Parameters
2.3.1 Equipment should perform within the manufacturer’s specifications 2.3.2 Preventative maintenance is performed at least yearly or as needed 2.3.3 Refrigerators, incubators, and freezers are monitored daily for correct
temperatures. 2.3.4 Maintenance and decontamination duties are performed on a regular basis to
keep equipment in good working order and to reduce the chances of PCR contamination.
3. Supplies
3.1 Sterile scrub brushes 3.2 Sterile oyster knives
Proposal No. 15-110

34
3.3 Clean specimen trays 3.4 Paper towels 3.5 Sterile wide mouth containers (1 liter capacity) 3.6 Oyster shucking block 3.7 Chain-mail glove 3.8 Dishwashing gloves 3.9 Glass or serological pipette tips
3.9.1 25mL 3.9.2 10mL 3.9.3 5mL 3.9.4 1mL (0.1mL hashes)
3.10 Rainin filtered pipette tips 3.10.1 1000µL tips 3.10.2 200µL tips 3.10.3 10µL tips
3.11 Microcentrifuge tubes (1.7mL) 3.12 Reagent Tubs – Large 3.13 Reagent Tubs - Medium - 20mL 3.14 Reagent Tub Lids – Large 3.15 Reagent Tub Lids - S/M 3.16 MPLC Rxn Tips – Large 3.17 MPLC Rxn Tips – Small 3.18 MPLC Rxn Tips - L Refill 3.19 MPLC Rxn Tips - S Refill 3.20 MPLC Processing Cartridge 3.21 MPLC Sample Cartridge 3.22 Tip Stands 3.23 Waste Bags 3.24 Cartridge seals 3.25 Gloves, nitrile 3.26 384 well PCR plates 3.27 Optical covers 3.28 Cartridge seals 3.29 Sterile disposable reagent reservoirs (small volume 1-5mL)
4. Specimen 4.1 Crassostrea gigas (Pacific oyster)
5. Special Safety Precautions 5.1 Vibrio species are pathogenic and should be handled following PHL safety
guidelines. 5.2 Dry baths can reach temperatures of 130° C; do not touch heated blocks. Tightly
sealed tubes may burst if heated beyond safe levels 5.3 UV light can seriously burn skin and eyes. Keep safety shield lowered when UV
light is on. Always keep skin covered by lab coat and gloves 6. Quality Control
6.1 Materials 6.1.1 Pre-extracted Vibrio parahaemolyticus (ATCC BAA-240, WA4647) and Vibrio
vulnificus (ATCC 27562) DNA is blended and aliquoted in 10µL aliquots and frozen at -20°C
Proposal No. 15-110

35
6.1.2 Molecular grade water 6.1.3 Exogenous internal control plasmid containing a target fragment
6.2 Instructions 6.2.1 An extraction control is included in every extraction run. To prepare the
extraction control material, enrich V. parahaemolyticus (ATCC 49398, tlh+, tdh-, trh-, ORF8-) overnight in APW. The material is lysed (MagNAPure protocol) and aliquoted into 1.7mL microcentrifuge tubes. Store the positive control lysate at -20°C to -80°C until needed.
6.3 Frequency 6.3.1 An NTC, exogenous internal control and positive control are included with
every run 6.4 Acceptable Limits
6.4.1 A successful run should meet the following conditions: 6.4.1.1 No amplification should be present in any of the negative controls.
Creeping curves without a logarithmic increase are not considered true amplification. If amplification is present in a negative control, determine the source of contamination, thoroughly clean BSC and pipettes, and discard contaminated reagents and disposables.
6.4.1.2 The positive control should show clear amplification. If NO amplification is present in the positive control for one or both of the sets, determine the problem and re-run the sample (see troubleshooting).
6.4.1.3 Wells negative for all targets should show amplification for the exogenous control (IC). The IC may be negative in positive samples.
6.5 Corrective Action 6.5.1 Runs for which the NTC is positive or the positive control and/or internal
control is negative should be repeated 6.5.2 The Lead Microbiologist should be notified if any run fails QC
6.6 Recording QC Data 6.6.1 Record results for each well and record a + or – on the Vp worksheet
7. Calibration 7.1 Standard Prep
7.1.1 List of Standards Used 7.1.2 Directions for Preparation 7.1.3 Special Instructions 7.1.4 Degree of Accuracy 7.1.5 Storage Requirements 7.1.6 Container 7.1.7 Temperature 7.1.8 Stability 7.1.9 Labeling
7.2 Calibration Procedure
Testing Procedure
8. Quantitative Testing Procedure 8.1 Accessioning, Sample Preparation and Centrifugation
8.1.1 Samples are processed in accordance with recommended procedures described by the American Public Health Association (4). Oyster samples are removed from the shipping container and the sample submission form is located.
Proposal No. 15-110

36
A laboratory worksheet is generated for each sample. Both the sample submission form and the lab worksheet are stamped in with the appropriate lab number. One oyster from each bag is opened to take tissue temperature. The temperature is recorded on the sample submission form. The bag of oysters is labeled with the sample number and placed into a 2-4°C refrigerator until they are ready to be processed.
8.2 Detailed Stepwise Procedure 8.2.1 The intent of the assay is to determine the concentration of Vp in the oyster
tissue and liquor. Any material on the outside of the oyster that gets introduced into the interior of the animal during shucking can alter the concentration. 8.2.1.1 Clean the sink before beginning to scrub the oyster sample. The sink
must be clean at this stage but sterility is not required. 8.2.1.2 Before beginning the scrubbing process, wash gloves with soap and
water. Using sterile scrub brushes, each oyster is cleaned under cold running water. All barnacles, mud, vegetation and debris should be removed. Pay close attention to the hinge and shell seam. A sterile brush should only be used for one sample. Do not re-use brushes when scrubbing multiple samples.
Any oyster that does not tightly close during handling is likely dead and should be discarded.
In addition any oyster whose shell is broken to expose tissue should be discarded.
8.2.1.3 After cleaning each oyster place the animal upside down on a clean, labeled, paper towel lined tray. Laying the oysters upside down will prevent the liquor (fluid inside a closed oyster) from draining out of the oysters while waiting to be shucked. Clean trays must be used for each sample.
8.2.1.4 Once cleaned, return the oysters to the refrigerator to dry or towel dry them for immediate shucking.
8.2.2 In order to accurately quantify Vp in oyster tissue it is very important to avoid introduction of bacteria (Vp or other) into the oyster tissue. 8.2.2.1 The sink must be sterile before shucking can begin. Wash the sink with
water or soap and water. Completely dry the sink. Wipe the sink down with 70% isopropanol and allow it to air dry.
8.2.2.2 Place a sterile pre-weighed (remove rubberband prior to weighing) tissue collection container on the sink counter.
8.2.2.3 Wipe a shucking block down with 70% isopropanol and place on the sink counter to air dry.
8.2.2.4 Place the oyster sample to be shucked on the sink counter. 8.2.2.5 Put on clean nitrile gloves. Over one of the gloves put on a chain-mail
glove. The chain-mail glove should be on the hand that will not be holding the knife. Put another nitrile glove on over the chain-mail glove. Cover both hands in 70% isopropanol and allow them to air dry.
8.2.2.6 Grab and hold each oyster with the chain-mail hand and use the other hand and a sterile oyster knife to shuck each oyster.
8.2.2.7 Use the sterilized shucking block while shucking to minimize knife accidents and to protect the counter surface.
8.2.2.8 Collect all tissue and liquor (fluid) in the sterile pre-weighed container.
Proposal No. 15-110

37
8.2.2.9 A fresh knife, shucking container and gloves must be used for each specimen.
8.2.2.10 The shucking block and counter must be washed and sterilized between specimens.
8.2.3 Enumeration in this assay is achieved by conducting an MPN (most probable number) analysis. 8.2.3.1 Weigh the container and shellfish tissue. Subtract the container weight
from the total weight to determine the amount of oyster tissue and liquor. Record the weight of tissue on the sample worksheet.
8.2.3.2 Transfer the oyster tissue and liquor to a sterile blender jar. 8.2.3.3 Add an equal weight of PBS to the sample container (the PBS can be
used to rinse any residual tissue from the container). Transfer the PBS to the blender jar. Record the weight of PBS used on the sample worksheet.
8.2.3.4 Blend the shellfish sample with PBS (now a 1:2 dilution) at high speed for 90 seconds.
8.2.3.5 The resulting homogenate should be relatively smooth. If the blender isn’t generating a smooth homogenate, it is advisable to service the blender (sharpen/replace blades).
8.2.3.6 From this homogenized sample, set up a 3-tube most probable number (MPN) serial dilution series. Use PBS for making dilutions and alkaline peptone water (APW) as the enrichment broth in each of the MPN tubes.
8.2.3.7 Incubate at 35°C± for 18 to 24 hours. Write sample number, date, and time placed in incubator on tube A1.
8.2.3.8 Following the 18-24 hour incubation step, each APW tube must be checked for growth. Use the following criteria to select tubes for further testing.
8.2.3.9 Examine all tubes for turbidity. Examine each tube with a light source shining through the tube.
8.2.3.10 Record all positive and negative results on the lab worksheet.
Proposal No. 15-110
38
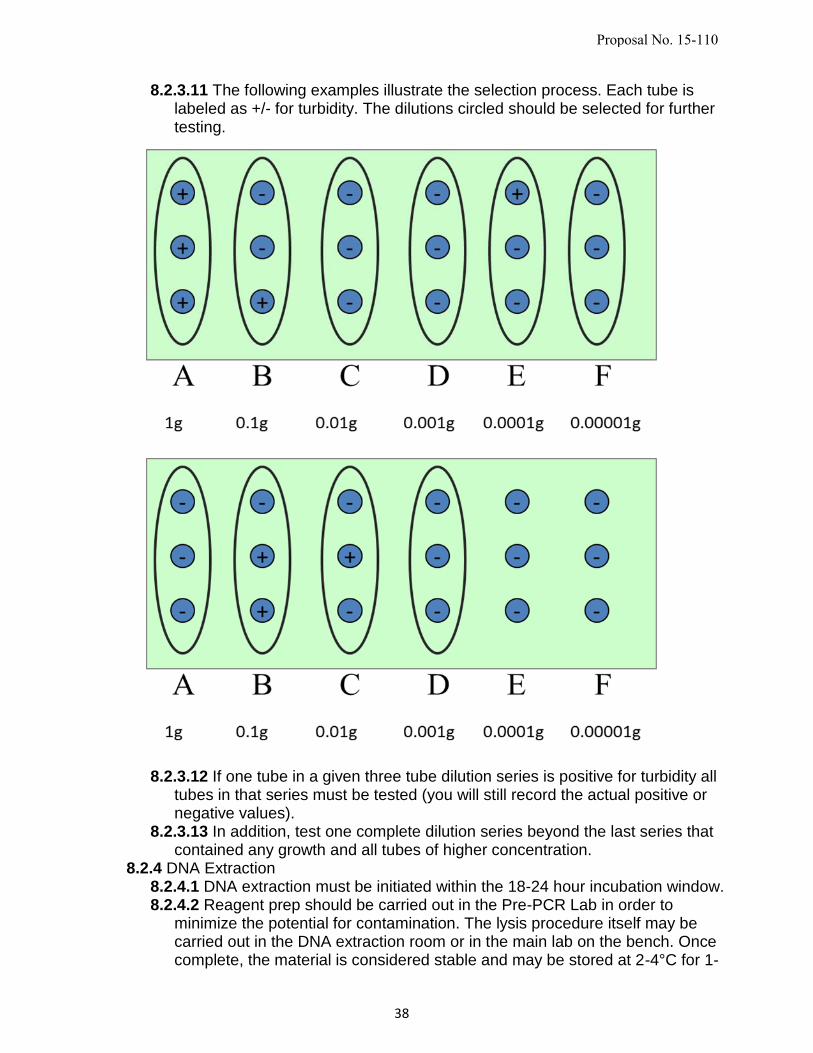
8.2.3.11 The following examples illustrate the selection process. Each tube is labeled as +/- for turbidity. The dilutions circled should be selected for further testing.
8.2.3.12 If one tube in a given three tube dilution series is positive for turbidity all tubes in that series must be tested (you will still record the actual positive or negative values).
8.2.3.13 In addition, test one complete dilution series beyond the last series that contained any growth and all tubes of higher concentration.
8.2.4 DNA Extraction 8.2.4.1 DNA extraction must be initiated within the 18-24 hour incubation window. 8.2.4.2 Reagent prep should be carried out in the Pre-PCR Lab in order to
minimize the potential for contamination. The lysis procedure itself may be carried out in the DNA extraction room or in the main lab on the bench. Once complete, the material is considered stable and may be stored at 2-4°C for 1-
Proposal No. 15-110
39
2 days or frozen at -20 to -80°C for extended periods. NOTE: Multiple freeze thaw cycles should be avoided due to potential DNA degredation.
8.2.4.3 Each tube that is selected for additional testing will require one 1.7mL microcentrifuge tube that was pre-loaded with lysis buffer and proteinase K (proK). (130µL lysis buffer + 20µL proK provided in MagNA Pure kit)
8.2.4.4 Label each tube with the sample number and tube ID. 8.2.4.5 Vortex each APW tube that is to be extracted briefly. 8.2.4.6 Pipette 1mL from each APW tube to its labeled 1.7mL tube. 8.2.4.7 Briefly vortex each 1.7mL tube. 8.2.4.8 Place the 1.7mL tubes in the 65°C dry bath for 10 minutes. 8.2.4.9 The lysed tubes are now ready for DNA extraction. NOTE: Due to the
high number of DNA extractions that are required as part of this assay, the Roche MagNA Pure was chosen for initial validation.
8.2.4.10 Lysed material from each 1.7mL tube should be manipulated in either the DNA extraction room or the template addition lab.
8.2.4.11 At this point due to the high number of lysates it is necessary to create a document to track the location of each lysate. This document is referred to as the “MagNA Pure Plate Map”.
8.2.4.12 After the MagNA Pure Plate Map is created, load the MagNA Pure cartridge accordingly. Loading should take place in a BSC or an AirClean hood. 200µL of each lysate should be added to the plate. Include 200 ul of pre-lysed Vp culture and 200µL of sterile PCR grade water. These will act as controls for the assay.
8.2.4.13 Once loaded, seal the MagNA Pure cartridge with an adhesive cartridge seal.
8.2.4.14 Label the plate with the sample number, date, initials and the label “Pre-Ext”. The specimen can now be loaded onto the MagNA Pure.
8.2.4.15 Turn on both the computer and the MagNA Pure. 8.2.4.16 Ensure that the correct protocol is selected “DNA III Bacteria”. 8.2.4.17 Enter in your sample order. Be sure that the correct cartridge wells are
highlighted on the screen. Incorrect set up here will lead to a failed extraction. 8.2.4.18 Sample volume should be entered as 200µL. 8.2.4.19 Elution volume should be entered as 100µL. 8.2.4.20 Click the “Stage Set-up” button. 8.2.4.21 Begin adding in the appropriate plastics. Click the items on the screen
as you add them to the MagNA Pure. Make sure that the discard bag is not too full before you begin your extraction.
8.2.4.22 Once all plastics are added and the discard bag is replaced remove the reagent tray from the machine.
8.2.4.23 Add the amount requested of each color coded reagent to the appropriate size of tub and apply a lid (with holes for tip access). Using the wrong tub will likely lead to a failed extraction.
8.2.4.24 Before adding the Magnetic Glass Particles (MGPs), vortex them for 15-20 seconds to completely suspend them. Once the particles are completely re-suspended in solution, rapidly deliver the appropriate volume to the correct tub and cover. It is important to get the extraction started soon after the beads are pipetted as they will rapidly settle out of suspension.
Proposal No. 15-110
40
8.2.4.25 Once the reagent tray is completely loaded, place the tray in the machine.
8.2.4.26 Remove the cartridge seal from the lysate cartridge and add it to the machine. Discard the seal into an autoclavable container.
8.2.4.27 Ensure that all plastics, reagents and sample cartridges are in place and accounted for on the computer screen.
8.2.4.28 Close the door and press the start extraction button. 8.2.4.29 Note the time that the run will be completed. The final extracted
template DNA will be refrigerated on-board the MagNA Pure until it is removed. It is however not advisable to leave the extract uncovered for any length of time.
8.2.4.30 Once completed, open the door, remove the extracted DNA, immediately seal the cartridge with a new cartridge seal, and refrigerate at 2-4°C until ready for PCR (if PCR is to be completed in 1-2 days). If PCR will not be complete in the next two days freeze the DNA at -20 to -80°C.
8.2.4.31 Remove all soiled plastics, replace used tips and run the decontamination protocol from the MagNA Pure main screen.
8.2.5 PCR Mastermix Preparation 8.2.5.1 Mastermix preparation is performed in the Pre-PCR Lab biological safety
cabinet or Airclean hood. This includes primer and probe manipulations and mastermix loading into the PCR plate. Thorough decontamination before and after use of the room is advisable. NOTE: A person who has previously in the same day worked in the Template addition lab should not re-enter the Pre-PCR lab.
8.2.5.2 Turn on the ABI® ViiA™7 machine and the computer. 8.2.5.3 Prepare a PCR platemap. Always include a positive and a negative
control for each MagNA Pure plate that was extracted.
Negative control: No DNA, milli-Q water (from MagNA Pure cartridge)
Positive control: tlh+ V. parahaemolyticus ATCC 49398 (from MagNA Pure cartridge)
8.2.5.4 Prepare the mastermix according to the mastermix prep sheet (Appendix C). Determine how many reactions you will need and calculate how much of each component you must use. It is advisable to prepare several reactions more than are needed to account for pipetting variability.
8.2.5.5 Once prepared, briefly vortex to completely mix the components. 8.2.5.6 Add the mastermix to a sterile disposable reagent reservoir. 8.2.5.7 Using a pipetter (multichannel advisable), add 18µL of mastermix to each
appropriate well (384 well plate) according to the PCR platemap. 8.2.5.8 Once the plate is loaded with mastermix, place the plate in a biological
transport container (sealed box) and take the plate into the Template addition lab. It is important to quickly add the template, seal the plate and initiate PCR. Therefore make sure that the extracted DNA is ready before setting up your PCR reactions.
8.2.5.9 Add the extracted DNA template to the appropriate wells according to your PCR platemap. Use 2µL of DNA for a total reaction volume of 20µL.
8.2.5.10 Once all wells are loaded including the positive and negative controls, seal the plate with an optical seal. Avoid touching either side of the seal as the adhesive side will come into contact with your reactions (poses a
Proposal No. 15-110
41
contamination risk) and the outside must be clear of smudges to allow accurate readings. Apply the seal using the plastic applicator supplied with the instrument. Take care to completely seal each well. Any unsealed well will rapidly evaporate during PCR and lead to inaccurate results.
8.2.5.11 Once the plate is sealed, centrifuge the plate briefly to remove bubbles from the wells and ensure that the template is in contact with the reaction mix.
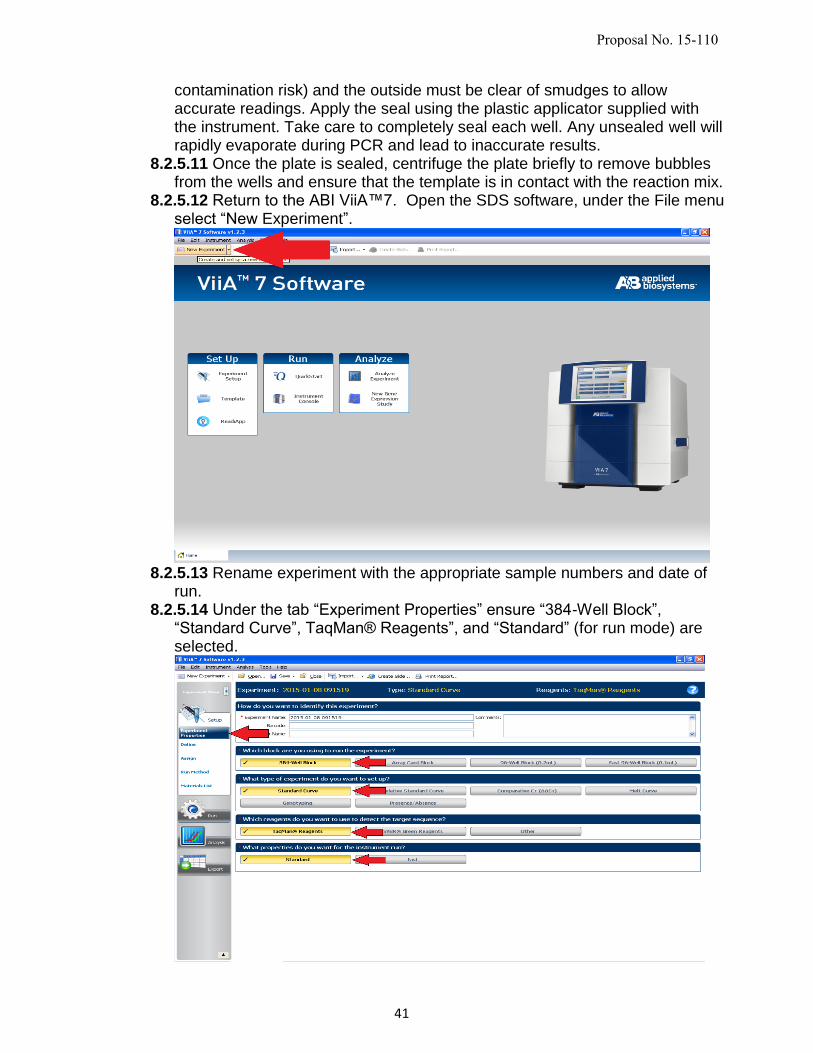
8.2.5.12 Return to the ABI ViiA™7. Open the SDS software, under the File menu select “New Experiment”.
8.2.5.13 Rename experiment with the appropriate sample numbers and date of
run. 8.2.5.14 Under the tab “Experiment Properties” ensure “384-Well Block”,
“Standard Curve”, TaqMan® Reagents”, and “Standard” (for run mode) are selected.
Proposal No. 15-110

42
8.2.5.15 The “Define” tab is used to select the targets of detection. The targets are saved to the library. Import targets from library. Select the tlh, tdh, trh, vvha, ORF8, and IC targets.
Proposal No. 15-110

43
8.2.5.16 At the bottom of the screen, select “NONE” from the drop down menu regarding “Passive Reference”.
8.2.5.17 Select the “Assign” tab and assign the appropriate wells with the corresponding targets of interest. Be sure to double check the map and 384-well plate are in agreement.
Proposal No. 15-110

44
8.2.5.18 Under “Run Method” delete the initial warm-up step.
After doing so the parameters are the following:
95° C for 5 minutes
45 cycles of
o 95° C for 15 seconds
o 59° C for 60 seconds
8.2.5.19 Turn on the machine user interface but touching the touchscreen. To
open loading tray, touch the eject button. 8.2.5.20 Load the plate and close tray. 8.2.5.21 From the PC, click the “Run” tab and find the green “START RUN”
button. Select the appropriate machine from the drop down menu and click
Proposal No. 15-110

45
the “START RUN” button.
8.2.5.22 Save run file using sample numbers and date.
8.3 Measurements from Instruments 8.3.1 Once run is complete, remove plate from instrument and discard in appropriate
waste receptacle. 8.3.2 Select “Analysis Settings” on the Amplification Plot screen. 8.3.3 Change all thresholds and baseline settings to “manual” and set all thresholds
to 20,000 and leave baseline settings at 3 to 15. 8.3.4 Apply analysis settings and exit to Amplification Plot screen. 8.3.5 Select all wells in the plate by clicking in the upper left box of the plate layout. 8.3.6 View each target individually and make necessary changes to the threshold
and baseline. The threshold should be set above background levels. It may be necessary to change baseline settings to lower background levels.
8.3.7 Acceptable threshold settings range from 10,000 to 50,000, if setting the threshold outside these values please consult with the lead or supervisor.
8.3.8 If baseline changes are necessary - view individual wells in the Multicomponent Plot screen. Change baseline settings as needed to exclude early background noise.
Proposal No. 15-110

46
8.3.9 Once threshold and baseline are set at appropriate levels, record results from each well for every target. Targets within the amplification plot may have high background in the early stages of the run (i.e. <10 cycles). Disregard background that crosses the threshold before cycle 10. Change the Plot color to “Target” to help read results.
Plot Color = Target
Positive = amplification
above threshold
Negative = No amplification
Exclude early
background
noise when
setting baseline
Proposal No. 15-110

47
8.3.10 When reading tdh amplification results a ΔRn of greater than 104,000 (read in Linear setting) is necessary for a positive result. This cutoff will exclude any G. hollisae tdh amplification.
Post Analytic
1. Interpretation & Reporting of Results 1.1 Procedure for Abnormal Results
1.1.1 Abnormal MPN Index 1.1.1.1 If abnormal results appear to be caused by cross contamination (i.e. late
CT value) rerun real-time PCR in duplicate of suspected contaminated wells 1.1.1.2 If duplicate results are in agreement, report these results. If the
duplicates differ, report the results in agreement with ORIGINAL rtPCR run. 1.1.2 Positive pathogenic markers (tdh, trh, ORF8) in absence of Vibrio
parahaemolyticus marker (tlh) 1.1.2.1 Current findings do not support pathogenic markers being present without
Vp being present. Real-time PCR reactions resulting in this situation should be re-run upon Lead Microbiologist discretion.
1.1.2.2 The presence of the trh gene in the absence of the tlh gene has been documented. This is due to the Vibrio parahaemolyticus trh gene having 98% homology with the trh gene of Vibrio alginolyticusi. Any trh positive wells must be tlh positive as well.
1.2 Reporting Format 1.2.1 Real-time PCR results should be reported in MPN per gram according to FDA
BAM 3 tube MPN chart 1.2.1.1 Sample Submission Form
True Vp Positive tdh
G. hollisae tdh Amplification
Threshold Cutoff
Proposal No. 15-110

48
1.3 Prioritizing Results-N/A 1.4 Entering Laboratory Results in Reporting System
1.4.1 Office of Shellfish and Water Protection database 1.4.1.1 Access to the database must be authorized. Lead Microbiologist will
facilitate the authorization process. 1.4.1.2 After entering web address, find column “Shellfish and Wastewater” and
click “Shellfish Sample System” (red arrow)
1.4.1.3 Along the top, hover mouse over “Vibrio” (red arrow)
Proposal No. 15-110

49
1.4.1.4 Click “Input Vibrio Data” (red arrow)
1.4.1.5 The sample number will auto-populate. Enter all information and data
provided from Vibrio Sample Submission form. Enter final results if available.
1.5 Notification of Test Results
1.5.1 Fax 1.5.1.1 Test results are faxed to the Office of Shellfish and Water Protection after
Lead Microbiologist approval and signature. 1.5.1.2 Fax cover sheet and Vibrio sample submission form(s) to X2257.
Completely fill out cover sheet and note which sample numbers are contained in fax (i.e. Vibrio S14-001 through S14-003).
1.5.2 Phone 1.5.2.1 For STAT results (per request of OSWP), the Lead Microbiologist will
contact the appropriate personnel at OSWP 1.6 Archiving Results & Retention
1.6.1 Filing Results 1.6.1.1 Results are to be filed in filing cabinet located in Food and Shellfish
Bacteriology Laboratory. 1.6.1.2 File approved samples that have NOT been entered into the Office of
Shellfish and Water Protection (OSWP) database in the folder titled “Results NOT Entered in Database”
1.6.1.3 File approved samples that have been entered into the OSWP database into the folder titled “Entered in Database-Need Lead Approval”. The lead microbiologist will then file completed samples into appropriate folder.
Proposal No. 15-110

50
1.6.2 Retention 1.6.2.1 Sample results and all paperwork pertaining to samples will be kept in
Food and Shellfish Bacteriology Laboratory file cabinet for a minimum of seven (7) years.
1.6.2.2 OSWP database is maintained by OSWP 2. Calculations
2.1 Instructions 2.1.1 To calculate the concentration we must first determine the MPN index for all
targets (tlh, tdh, trh, ORF8, and vvhA). 2.1.2 The MPN index is a 3 digit number where each digit represents the number of
positive tubes in a given dilution 2.1.3 The first dilution set used in the MPN index is always the most dilute set of
three tubes that are all positive for a given target. The next two digits represent the number of positive tubes in the next two dilution series. 2.1.3.1 Examples
2.1.3.1.1 The circled columns represent the number of positive (by PCR) tubes in each dilution set. The MPN index for TLH in the example below is 3-1-0. The first number is selected by finding the most dilute set of tubes that are all positive (red arrow). The next two numbers in the index are the numbers of positive tubes in the next two dilution sets (blue arrows).
2.1.3.1.2 The following sample has an MPN index of 3-1-1. The first number is selected by finding the most dilute set of tubes that are all positive (red arrow). Typically, the next two numbers in the index are the numbers of positive tubes in the next two dilution sets (blue arrows). However, when there is a positive tube that exists beyond the selected dilution sets (black
Proposal No. 15-110
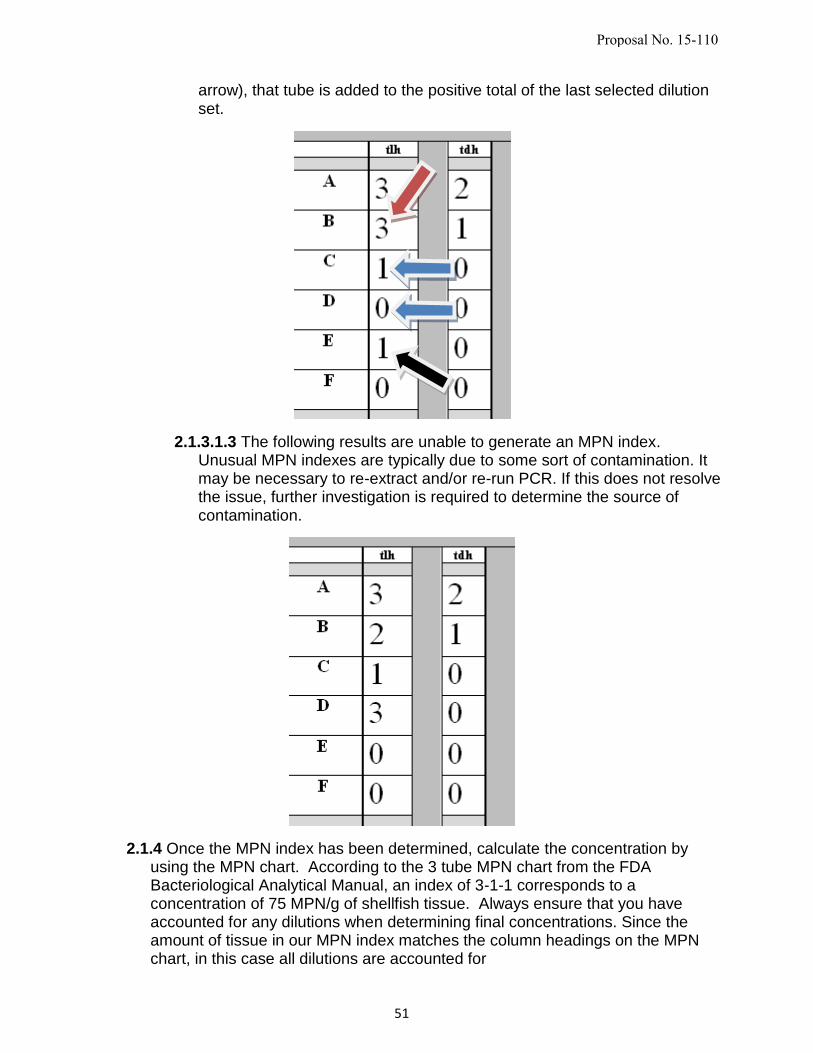
51
arrow), that tube is added to the positive total of the last selected dilution set.
2.1.3.1.3 The following results are unable to generate an MPN index. Unusual MPN indexes are typically due to some sort of contamination. It may be necessary to re-extract and/or re-run PCR. If this does not resolve the issue, further investigation is required to determine the source of contamination.
2.1.4 Once the MPN index has been determined, calculate the concentration by using the MPN chart. According to the 3 tube MPN chart from the FDA Bacteriological Analytical Manual, an index of 3-1-1 corresponds to a concentration of 75 MPN/g of shellfish tissue. Always ensure that you have accounted for any dilutions when determining final concentrations. Since the amount of tissue in our MPN index matches the column headings on the MPN chart, in this case all dilutions are accounted for
Proposal No. 15-110
52
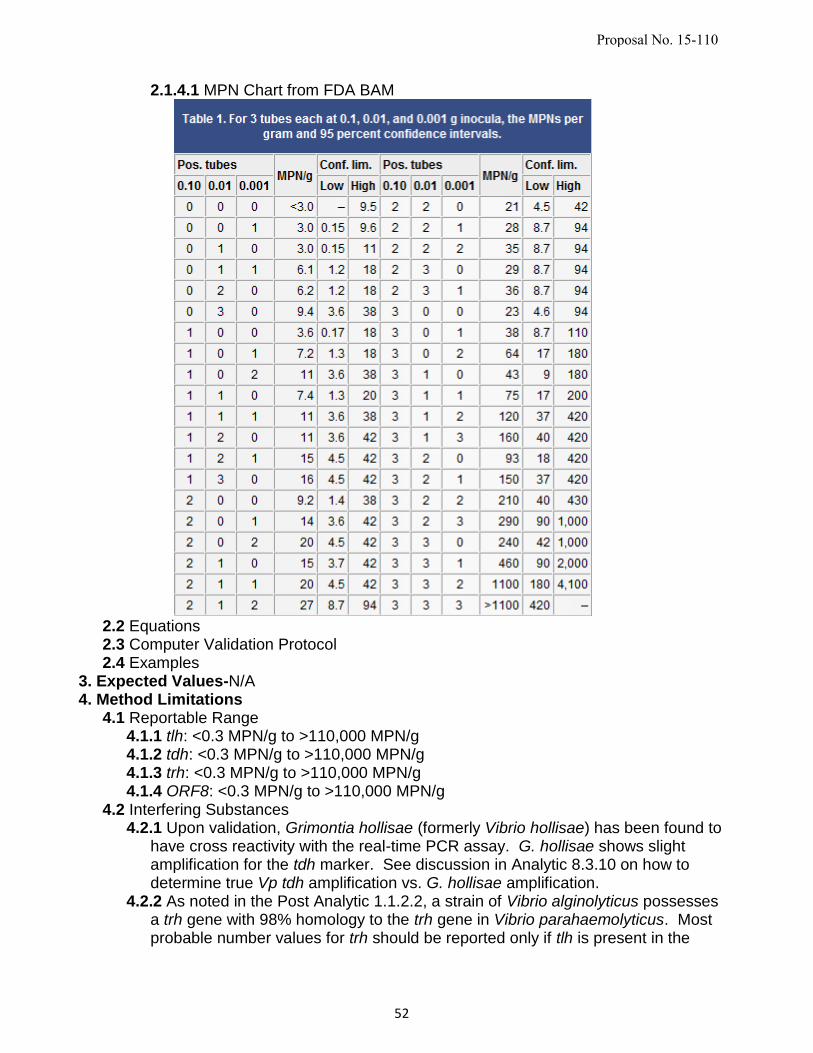
2.1.4.1 MPN Chart from FDA BAM
2.2 Equations 2.3 Computer Validation Protocol 2.4 Examples
3. Expected Values-N/A 4. Method Limitations
4.1 Reportable Range 4.1.1 tlh: <0.3 MPN/g to >110,000 MPN/g 4.1.2 tdh: <0.3 MPN/g to >110,000 MPN/g 4.1.3 trh: <0.3 MPN/g to >110,000 MPN/g 4.1.4 ORF8: <0.3 MPN/g to >110,000 MPN/g
4.2 Interfering Substances 4.2.1 Upon validation, Grimontia hollisae (formerly Vibrio hollisae) has been found to
have cross reactivity with the real-time PCR assay. G. hollisae shows slight amplification for the tdh marker. See discussion in Analytic 8.3.10 on how to determine true Vp tdh amplification vs. G. hollisae amplification.
4.2.2 As noted in the Post Analytic 1.1.2.2, a strain of Vibrio alginolyticus possesses a trh gene with 98% homology to the trh gene in Vibrio parahaemolyticus. Most probable number values for trh should be reported only if tlh is present in the
Proposal No. 15-110

53
corresponding tube. Tubes only positive for trh should not be accounted for when generating the MPN value.
5. Procedure Notes 5.1 Reason for Special Precaution 5.2 Possible Sources of Errors 5.3 Helpful Hints 5.4 Situations That May Influence Test 5.5 Applications 5.6 Turn Around Time
5.6.1 Samples results from samples that meet all criteria of acceptable submission should be reported to the Office of Shellfish and Water Protection within 3 days
5.7 Alternative Back up Procedures 5.8 5.9 Definitions
6. References 6.1 Manufacturer Product Literature 6.2 Textbooks 6.3 Standards Publications 6.4 Written Personal Communications 6.5 Research
7. Supplemental Materials 7.1 Manufacturer Product Instructions 7.2 Flow Diagrams 7.3 Method Evaluation Assessment Sheet 7.4 Proficiency Provider
i González-Escalona, Narjol, George M. Blackstone, and Angelo DePaola.
"Characterization of a Vibrio alginolyticus strain, isolated from Alaskan oysters, carrying a
hemolysin gene similar to the thermostable direct hemolysin-related hemolysin gene (trh) of
Vibrio parahaemolyticus." Applied and environmental microbiology 72.12 (2006): 7925-
7929.
Proposal No. 15-110