Embed Size (px)
Citation preview

Morphological, Biochemical and Molecular Characterization Of Gibberellic Acid- Producing
Bacteria, Isolated from Saccharum sp. and Eleusine sp. and Their Effect On The Growth Of Corn and Lettuce
Vanessa Cris D. Blancaflor1, Jocelyn T. Zarate2 and Celia B. Dela Viña31, 3 Institute of Biological Science, CAS, University of the Philippines Los Banos (UPLB) and
2 National Institute of Molecular Biology and Biotechnology (BIOTECH), UPLB, College, Laguna, Philippines

Gibberellic Acid (GA)• Break seed dormancy• Enhance stem and root elongation • Delays senescence• Produced as secondary metabolite by
bacteria that functions as signaling factor to the host plant
Introduction
136 known chemical structuresGA1, GA2 and GA4 for shoot elongation GA3 removed inhibition of sugarcane growth due to salt stress

Objectives• Characterize GA secreting bacteria from sugarcane and grass roots• Quantify GA production• Identify high GA producing strains through 16S rDNA sequencing• Determine effects of bacterial isolates on plant development

MethodolologyIsolation of Endophytic plant growth
promoting Bacteria
Qualitative and Quantitative Analysis
Biochemical Partial Characterization
16S rDNA isolation and sequencing
in vivo Assay in corn and lettuce as host plants

Isolation of endophyticPGPB
Extraction from root tips of sugarcane and
grass
Serial Dilution
Spread Plating on Congo red-Nitrogen Free medium and
Azotobacter medium

Qualitative and quantitative analysis of Gibberellic acid
GIBBERELLIC ACID PRODUCTION ASSAY (Graham and Thomas, 1961)
Centrifugation:6000rpm 12
minutes
Addition of 2, 4-DNP to supernatant
Boiling to 100°C
Addition of Alcoholic
KOH
GIBBERELLIC ACID EXTRACTION
Centrifuge:10,000rpm,
10mins
Acidification to pH2 of
supernatant
Extraction with Ethyl
Acetate
Redissolve GA residue in
0.05% Tween80

Phosphomolybdic Acid Reagent (Graham and Henderson, 1961)
Addition of 15ml
Phosphomolydic acid reagent to GA extract
Incubate in boiling
water for one hour
Addition of dH2O up to
25ml
Measure absorbance at A780nm
Qualitative and Quantitative Analysis of Gibberellic Acid

Gram Staining Method
Crystal violet (1min)
Gram-iodine (1min)
95% alcohol (30secs)
0.25% safranin(30secs)
Partial Characterization of Bacterial Isolates

Biochemical Tests• Test for Oxygen Requirement• Catalase Reaction• Utilization of Citrate• Starch Hydrolysis Test• Tween80 Hydrolysis• Gelatin Liquefaction test• Acid Production from Carbohydrates

Genomic DNA Extraction• (CTAB Method)
Gene Amplification• FC/RC: 30 cycles • FC27 (5’-AGAGTTTGATCCTGGCTCAG-3’)• RC1492 (5’-TACGGCTACCTTGTTACGACTT-3’) • Annealing Temp: 55°C
16S rDNA Sequencing• Basic Local Assignment Tool (BLAST)
Molecular Identification of Bacterial Isolates
In Vivo Assay

RESULTS AND DISCUSSION

Sample MediaNo. of
IsolatesIsolate codes
(VCB)
SugarcaneCRNF 7 1-5sc, 16-17sc
ATB 4 12-15sa
Grass CRNF 8 6-8gc, 18-22gc
ATB 3 9-11gaLegend: (CRNF) Congo-red Nitrogen-free medium, (ATB) Azotobacter medium
Table 1. Number of bacterial isolatesobtained from CRNF and ATB media andtheir assigned codes.
Isolation of Plant Growth Promoting Bacteria
Fig. 1. Representative solution colorfrom result of the Gibberellic Acid Assay

79.1136
51.3864
34.1136
50.022756.1591
73.8864
0
10
20
30
40
50
60
70
80
90
VCB6gc VCB7gc VCB11ga VCB12sa VCB16sc VCB17sc
GA
Conc
entr
atio
n (µ
g/m
L)
Bacterial Isolates
Fig. 3. Concentrations of GA produced by bacterial isolates
Standard Curve of Gibberellic Acid
Quantification of GA produced

BacterialIsolate
Colony Morphology
Colony size Gram Reaction
Cell Morphology
Cell size
VCB6gc Cloudy white, curled, flat 1-1.5mm - rod 1-1.5µm
VCB7gc Cloudy white, entire, convex 1-1.5mm - rod 1-1.5µm
VCB11ga Yellow, entire, convex 1-1.5mm - rod 3-5µm
VCB12sa Cloudy white,curled, raised 1-1.5mm + cocci 1-2µm
VCB16sc Yellow, entire, convex 1.5-2mm + cocci 1-2µm
VCB17sc Cloudy white, entire, convex 1.5-2mm + cocci 1-1.5µm
Partial Characterization of Bacterial Isolates

Table 3. Summary of Biochemical Tests.Isolate codes
Oxygen Req.
Catalase Reaction
GelatinLiq.
Utilizationof Citrate
Starch Hydrolysis
Tween 80 Hydrolysis
VCB6gc Aerobic + + + - +VCB7gc Aerobic + - - - +VCB11ga Aerobic + + + + +
VCB12sa Facultative Anaerobe + - - - +
VCB16sc Aerobic + - - - -
VCb17sc Facultative Anaerobe + - + - +
Biochemical Characterization

Table 4. Acid and gasproduction ofisolated bacteria fromcarbohydrates.
Legend: Acid Production/ Gas Production
SugarsBacterial Isolates
VCB6gc
VCB7gc
VCB11ga
VCB12sa
VCB16sc
VCB17sc
Dulcitol -/- -/- -/- -/- -/- +/-Glucose +/- +/- +/- +/- +/- +/-Lactose -/- -/- -/- +/- -/- +/+Maltose -/- -/- -/- +/- -/- +/-Mannitol -/- -/- -/- -/- -/- +/+
Mannose -/- -/- -/- +/- -/- +/-Sorbitol -/- -/- -/- -/- -/- +/+Sucrose -/- -/- -/- +/- -/- +/+
Acid Production from Carbohydrates
Biochemical Characterization

Bacterial Isolates
DescriptionLength
(bp)Score (bits)
E valueIdentities
%VCB6gc Pseudomonas hibiscicola strain
ATCC 198671191 1827 0.0 97%
VCB7gc Paenibacillus lautus strain NBRC 15380
1181 730 0.0 80%
VCB11ga Stenotrophomonas pavanii strain LMG 25348
1166 372 2e-102 69%
VCB12sa Micrococcus yunnanensis strain YIM 65004
1015 901 0.0 83%
VCB16sa Staphylococcus hominis sbs. novobiosepticus strain GTC 1228
1180 1918 0.0 98%
VCB17sa Staphylococcus aureus (identified through biochemical characteristics)
Molecular Characterization with 16s DNA sequencing

Isolates Description Related Literature ReviewVCB6gc Pseudomonas hibiscicola
strain ATCC 19867
Type strains of P. hibiscola belong to S. maltophilia, a Gram neg; catalase +; use in biotechnological applications; may cause nosocomial infection: http://www.bacterio.net/stenotrophomonas.html
VCB7gc Paenibacillus lautus strain NBRC 15380
PGPB with P removal and N2 fixation properties; biocatalyst for functional health food (World J of Microbiol and Biotech, 2008; (http://gcm.wfcc.info/speciesPage.jsp?strain_name=Paenibacillus%20lautus
VCB11ga Stenotrophomonas pavaniistrain LMG 25348
Endophytic N2 Fixer from Brazilian sugarcane variety used in Organic farming (Ramost et al Int J Sys Evol Microbiol 2011 61(4):926-31)
VCB12sa Micrococcus yunnanensisstrain YIM 65004
Catabolically versatile; produce restriction enzymes and vitamins; isolated from Polyspora axillary roots; (https://en.wikipedia.org/wiki/Micrococcus)
VCB16sa Staphylococcus hominissbs. novobiosepticus strain
GTC 1228
Coagulase negative, found in the skin, blood etc, antibiotic resistant; biofilm former; (http://journals.plos.org/plosone/article?id=10.1371/journal.pone.0061161)
Molecular Characterization with 16s DNA sequencing

Effect of Bacterial Isolates with on the Growth of Corn (Zea mays L.)
In Vivo Assay
- Control + Control VCB 6 VCB 7 VCB 11 VCB 12 VCB 16 VCB 17 Mixed Inoc

Effect of Bacterial Isolates with Rec. Rate (RR) of Chem Fertilizer (100-40-40 kg NPK/ha) on the Growth of Corn
In Vivo Assay
- Control + Control VCB 6 VCB 7 VCB 11 VCB 12 VCB 16 VCB 17 Mixed Inoc

Fig. 14. Representative root samples of corn (Zea mays L.) grown for two months under screen house condition as affected by bacterial inoculation and with no chemical fertilizer (top) and with Rec. Rate of chemical (RR): T1(-control), T2(+control), T3 (VCB6), T4(VCB7), T5(VCB11), T6(VCB12), T7(VCB16), T8(VCB17), and T9(Mixed inoculants).
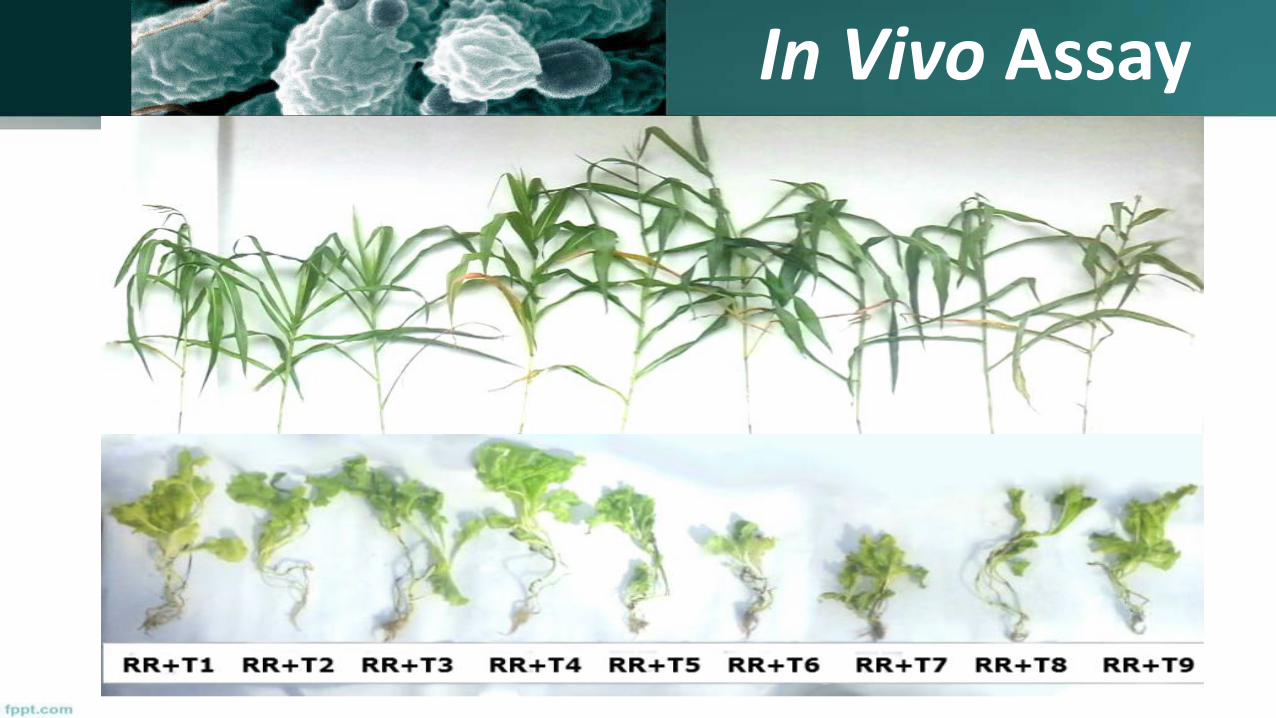
In Vivo Assay
-Control +Control VCB6 VCB 7 VCB 11 VCB 12 VCB 16 VCB 17 Mix

Fig. 15. Representative plant samples of lettuce (L. sativa) grown for two months under screen house condition with zero(up) and full(down)recommended rates of chemical fertilizer (RR) and microbial inoculation: T1(-control), T2(+control), T3 (VCB6), T4(VCB7), T5(VCB11), T6(VCB12), T7(VCB16), T8(VCB17), and T9(Mixed inoculants).
In Vivo Assay
-Control +Control VCB6 VCB 7 VCB 11 VCB 12 VCB 16 VCB 17 Mix

Summary• Endophytic bacteria from sugarcane and grass roots were isolated
with capacity to produce GA (6/22) • GA concentration ranged from 34.11µg ml-1-79.11µg ml-1 highest in
strain VCB6gc; lowest in VCB11ga• Biochemical characterization was enlightening, but tedious work• Molecular characterization gave insight in ID of isolates • GA production is also done by commensal or pathogenic strains as
well as plant growth promoting bacteria• GA producing isolates enhanced corn stem length and roots• GA production has positive combination with chemical fertilizer

• Use of beneficial microorganisms with PGPB properties (ie GAproduction) should be encouraged for better plant growth
• More in vivo trials should be done on other crops to show positiveeffect of GA producing isolates
• Microbial isolates need further characterization throughpolyphasic analysis since percent identities were <97% suggestingthat they could be possible novel strains or species.
Conclusion

Thank you for your kind attention!
Acknowledgement:PCAARRD funding agencyBIOTECHIBS, CAS
Students and staff at MykoPlus Laboratory