Embed Size (px)
Citation preview
June 2015 SD
N/15/11
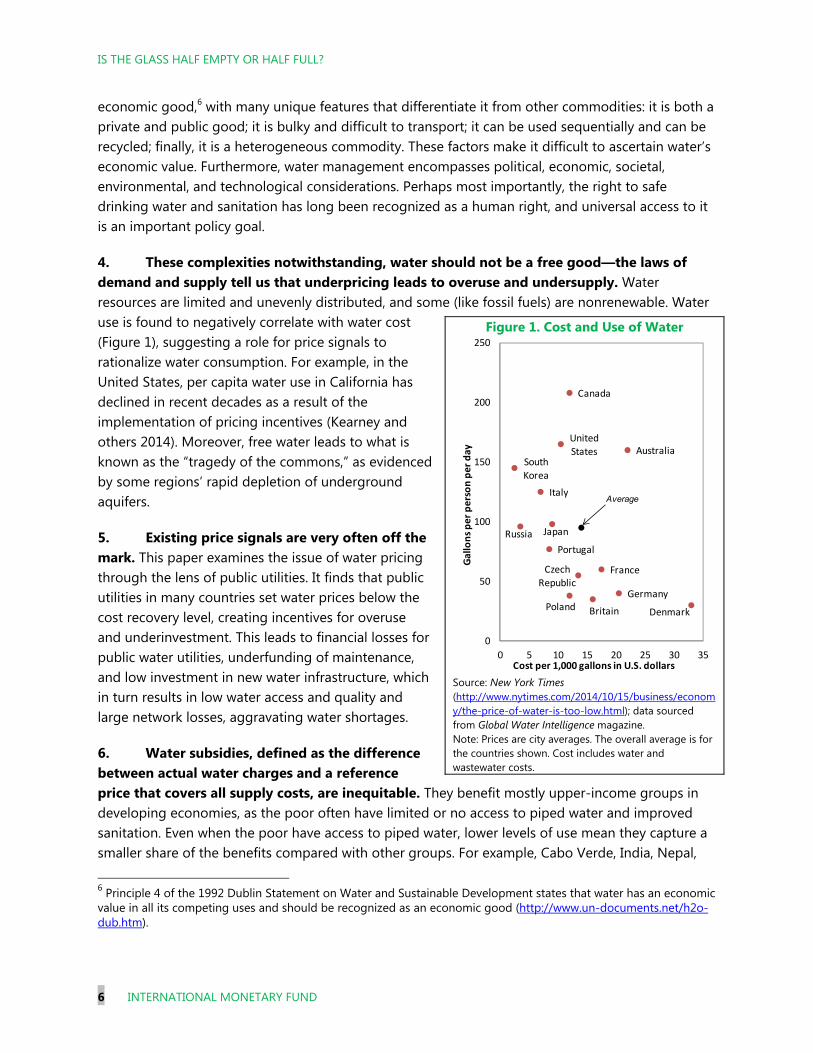
IMF STAFF DISCUSSION NOTE
Is the Glass Half Empty or Half Full? Issues in Managing Water
Challenges and Policy Instruments
Kalpana Kochhar, Catherine Pattillo,
Yan Sun, Nujin Suphaphiphat, Andrew Swiston,
Robert Tchaidze, Benedict Clements,
Stefania Fabrizio, Valentina Flamini,
Laure Redifer, Harald Finger, and an IMF Staff
Team
2 INTERNATIONAL MONETARY FUND
INTERNATIONAL MONETARY FUND
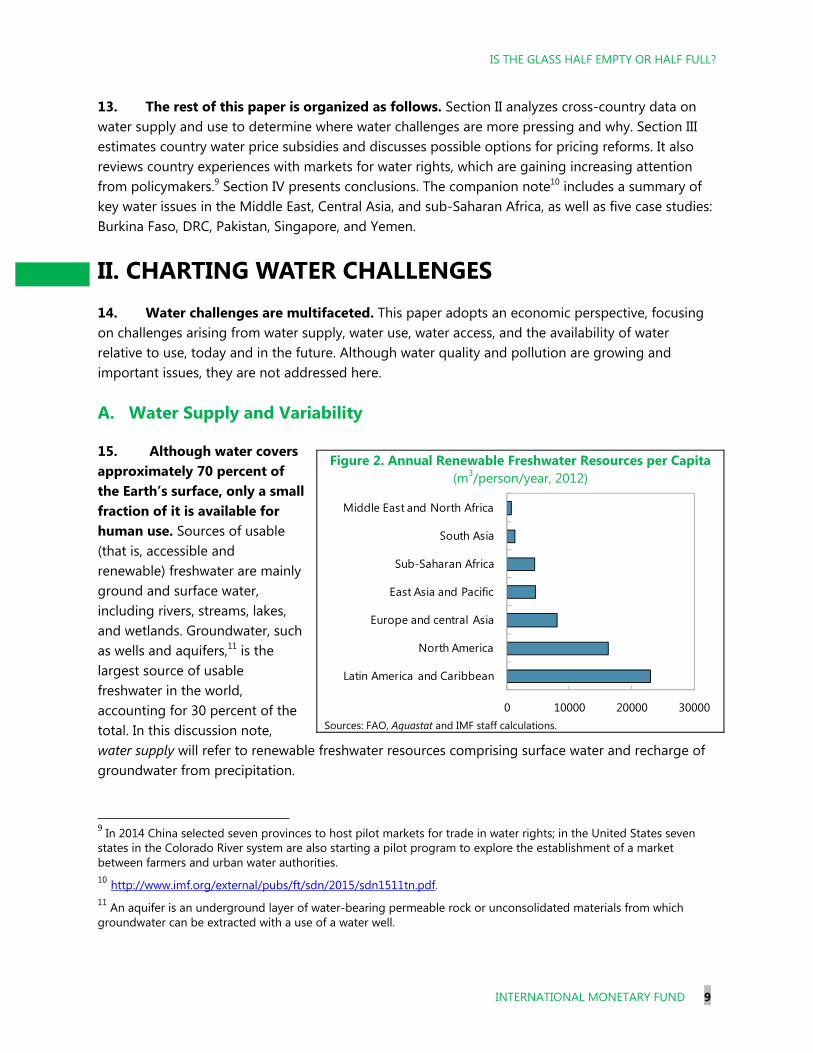
Strategy, Policy, and Review Department, African Department, Fiscal Affairs Department,
Middle East and Central Asia Department
Is the Glass Half Empty or Half Full? Issues in Managing Water Challenges and Policy Instruments1
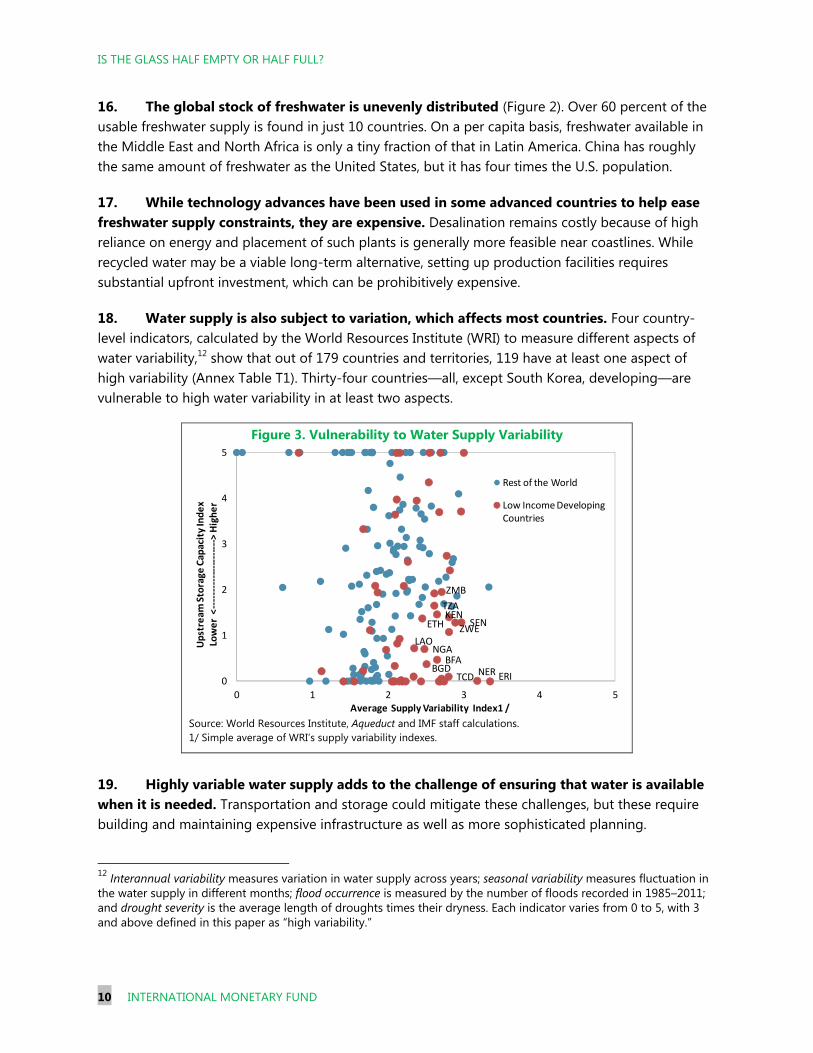
Prepared by Kalpana Kochhar, Catherine Pattillo, Yan Sun, Nujin Suphaphiphat, Andrew Swiston, Robert Tchaidze,
Benedict Clements, Stefania Fabrizio, Valentina Flamini, Laure Redifer, Harald Finger, and an IMF Staff Team2
Authorized for distribution by Siddharth Tiwari
June 2015
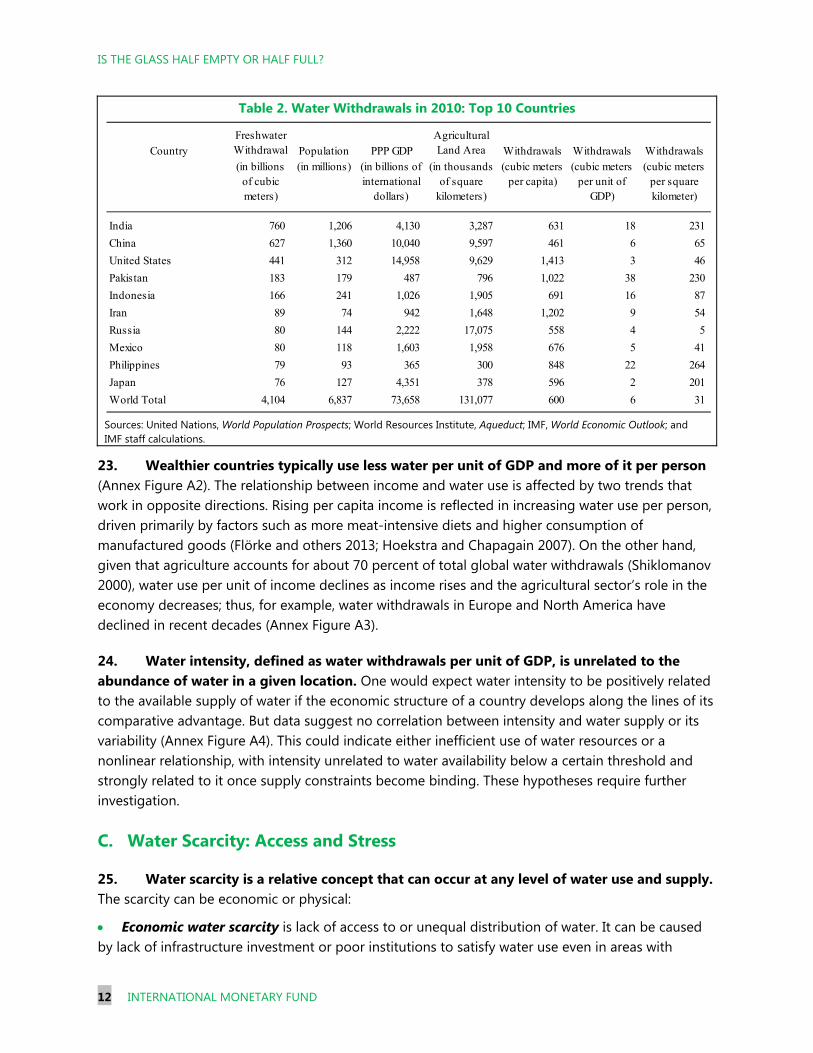
DISCLAIMER: This Staff Discussion Note represents the views of the authors and does not necessarily represent IMF views or IMF policy. The views expressed herein should be attributed to the authors and not to the IMF, its Executive Board, or its management. Staff Discussion Notes are published to elicit comments and to further debate.
JEL Classification Numbers: H23, L95, Q25
Keywords: Water, subsidies, externalities, public utilities
Authors’ E-mail Addresses:
[email protected]; [email protected]; [email protected];
[email protected]; [email protected]; [email protected];
1 This paper has benefited from helpful suggestions by Tien Shiao, Paul Reig, and Tianyi Luo of the World Resources Institute, and Julia Bucknall, Richard Damania, and Diego Juan Rodriguez of the World Bank. Christiana Weekes provided excellent production assistance.
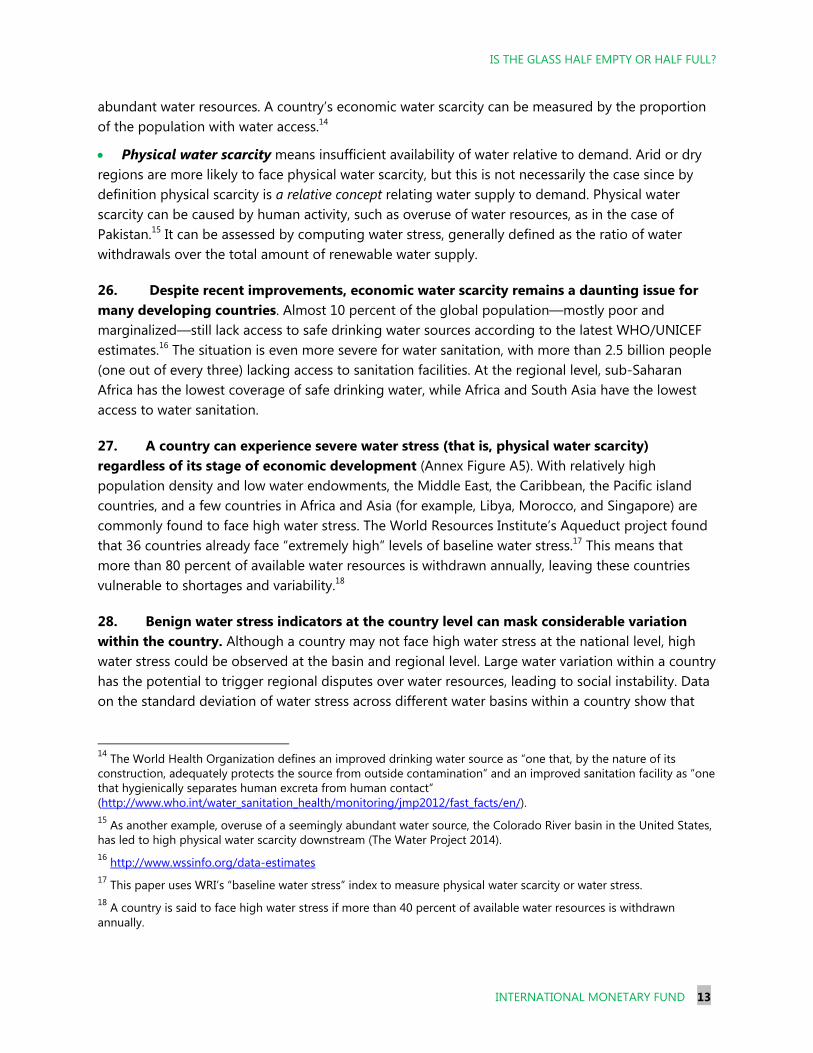
2 The IMF team includes Ian Parry, Louis Sears, and Frank Wallace.
IS THE GLASS HALF EMPTY OR HALF FULL?
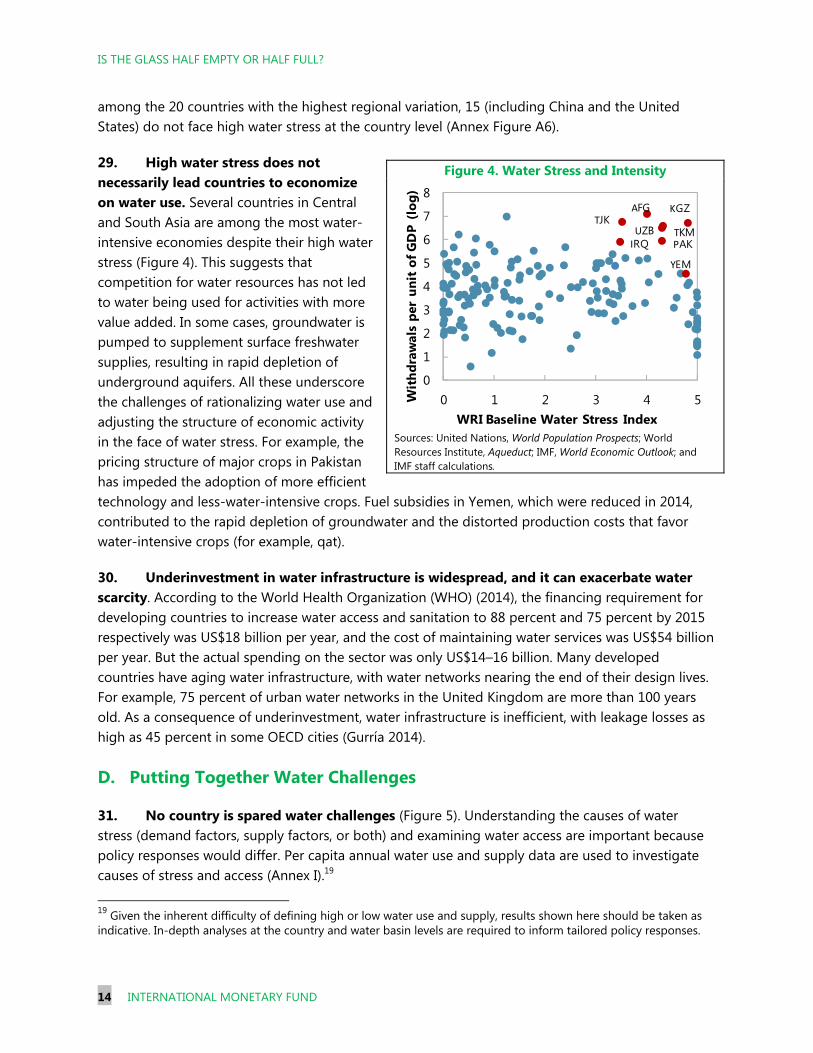
INTERNATIONAL MONETARY FUND 3
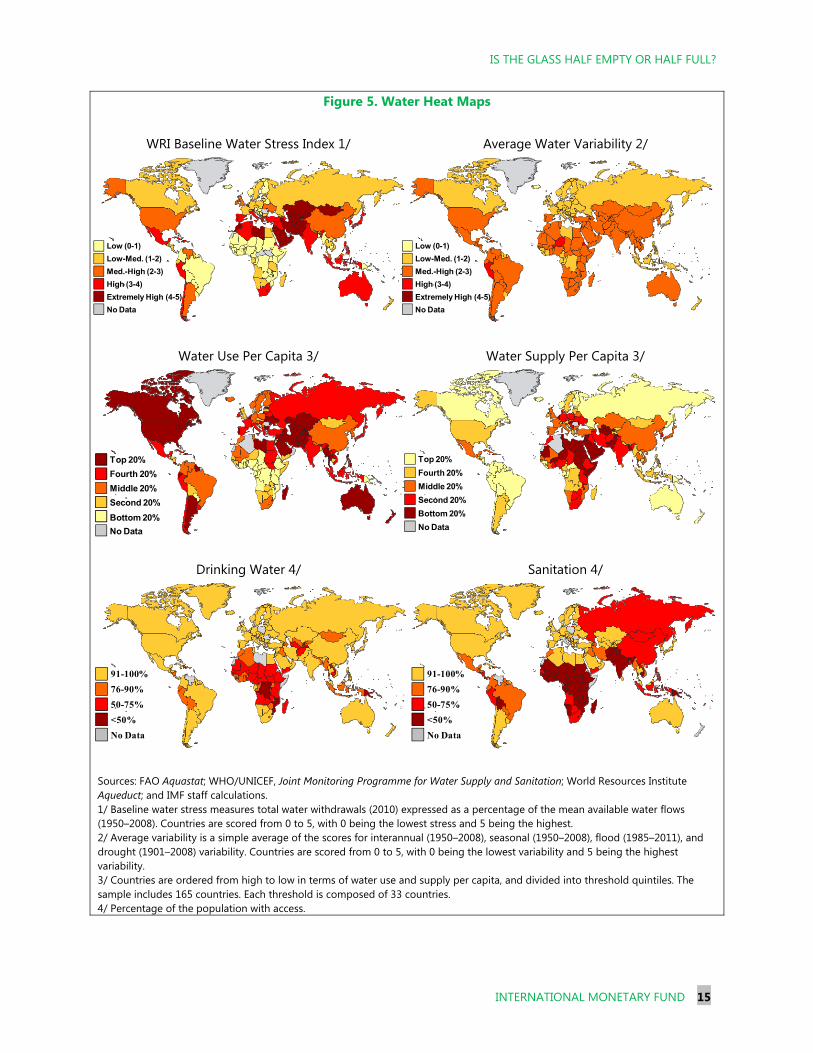
CONTENTS
EXECUTIVE SUMMARY ___________________________________________________________________________ 4
I. WHY CARE ABOUT WATER? ___________________________________________________________________ 5
II. CHARTING WATER CHALLENGES _____________________________________________________________ 9
III. GETTING INCENTIVES RIGHT _______________________________________________________________ 18
IV. CONCLUDING REMARKS ___________________________________________________________________ 27
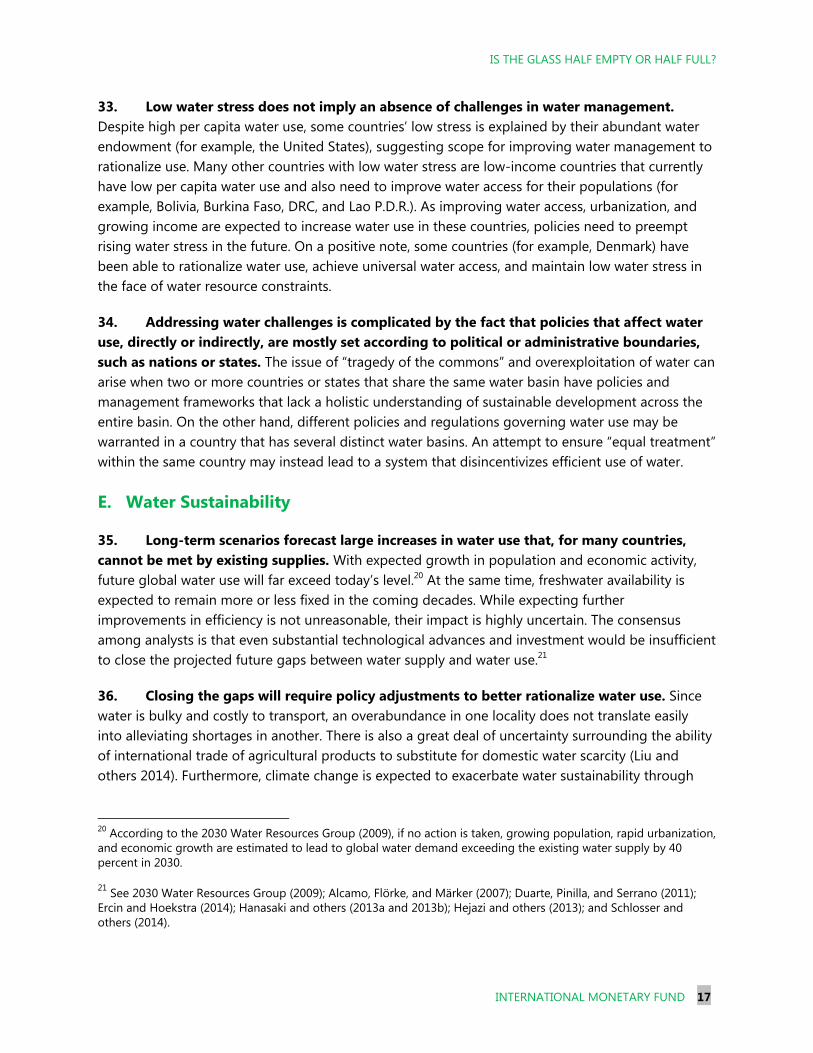
ANNEX I. DATA AND DEFINITIONS ____________________________________________________________ 28
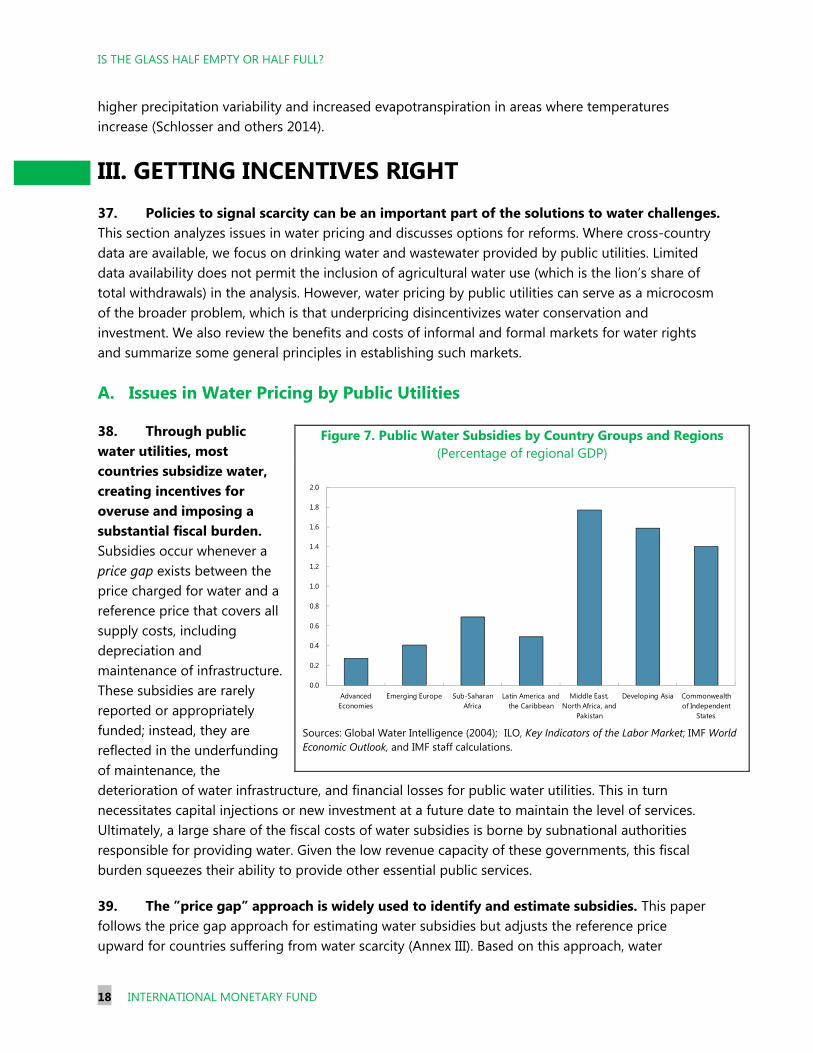
ANNEX II. FIGURES AND TABLES ______________________________________________________________ 30
ANNEX III. METHODOLOGY FOR ESTIMATING WATER SUBSIDIES __________________________ 39 FIGURES 1. Cost and Use of Water___________________________________________________________________________ 6 2. Annual Renewable Freshwater Resources per Capita ____________________________________________ 9 3. Resilience to Water Supply Variability _________________________________________________________ 10 4. Water Stress and Intensity _____________________________________________________________________ 14 5. Water Heat Maps ______________________________________________________________________________ 15 6. Water Stress and Underlying Factors __________________________________________________________ 16 7. Water Subsidies by Country Groups and Regions _____________________________________________ 18 8. Distribution of Water Price Subsidies by Income Group _______________________________________ 19 9. Costs Related to Depletion Externality in Selected Economies ________________________________ 20 10. Ratio of Non-Revenue Water Losses of Public Water Utilities ________________________________ 21 11. Household Expenditure on Water by Income Group _________________________________________ 21 12. Water Withdrawal for Agricultural Use and Diesel Retail Price _______________________________ 24 TABLES 1. World Population, GDP, and Water Withdrawals ______________________________________________ 11 2. Water Withdrawals in 2010: Top Ten Countries _______________________________________________ 12 References _______________________________________________________________________________________ 42
IS THE GLASS HALF EMPTY OR HALF FULL?
4 INTERNATIONAL MONETARY FUND
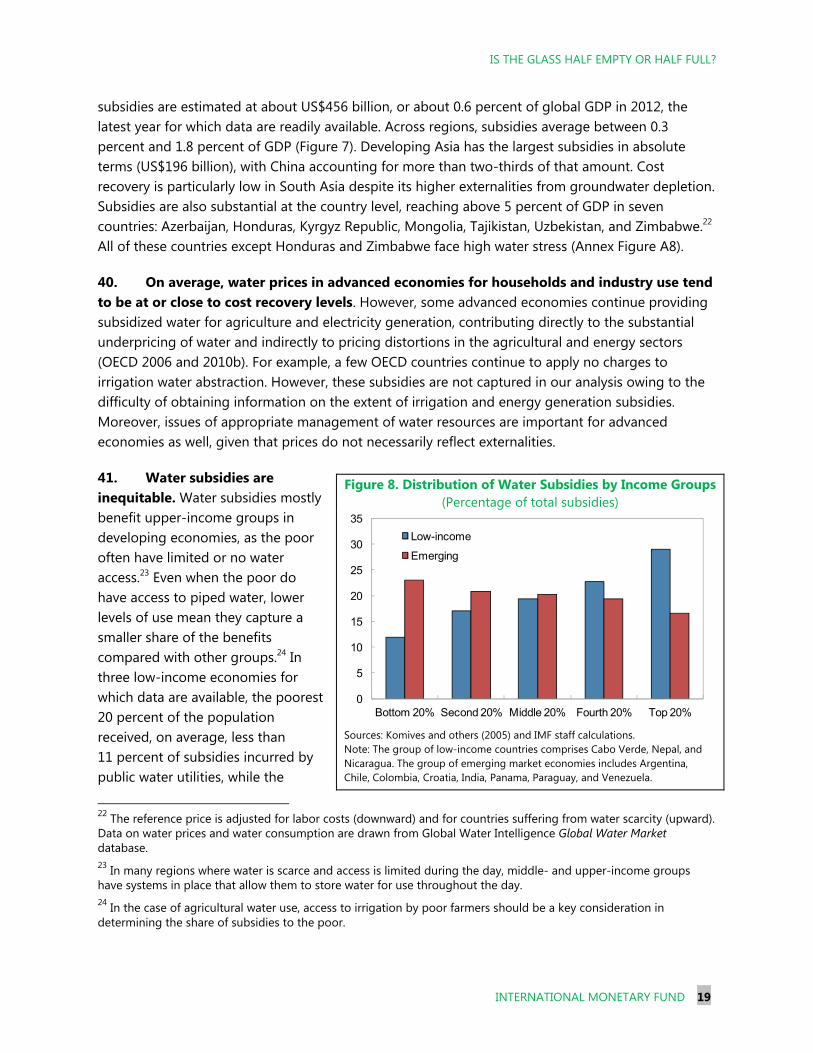
EXECUTIVE SUMMARY Water challenges are a growing global concern that could hinder countries’ economic prospects. Rising water stress, large supply variability, lack of access to safe drinking water and sanitation, and water pollution are already afflicting many parts of the world. Emerging market and developing countries generally face greater challenges because of their larger populations, lower income levels, inadequate infrastructure, and less developed policy and institutional capacity. But advanced countries are not spared either. Looking ahead, water use is expected to continue to rise with population and income growth, but freshwater resources cannot easily be increased. Climate change is likely to exacerbate water demand-supply imbalances.
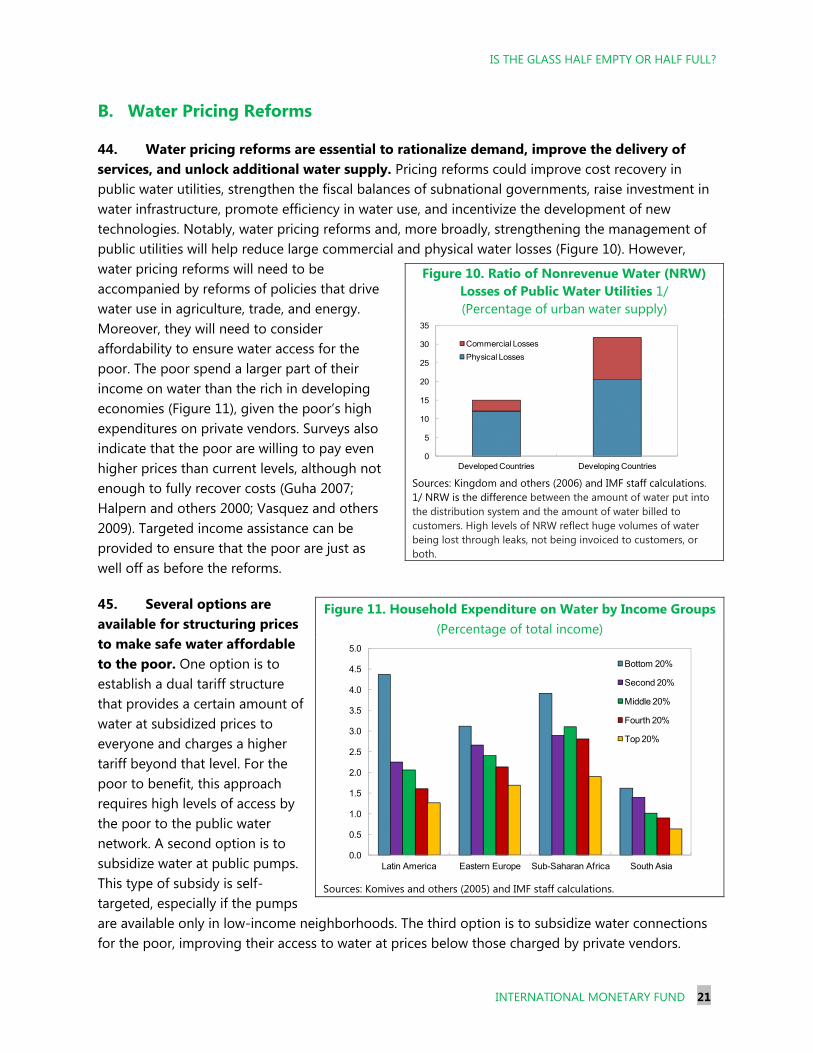
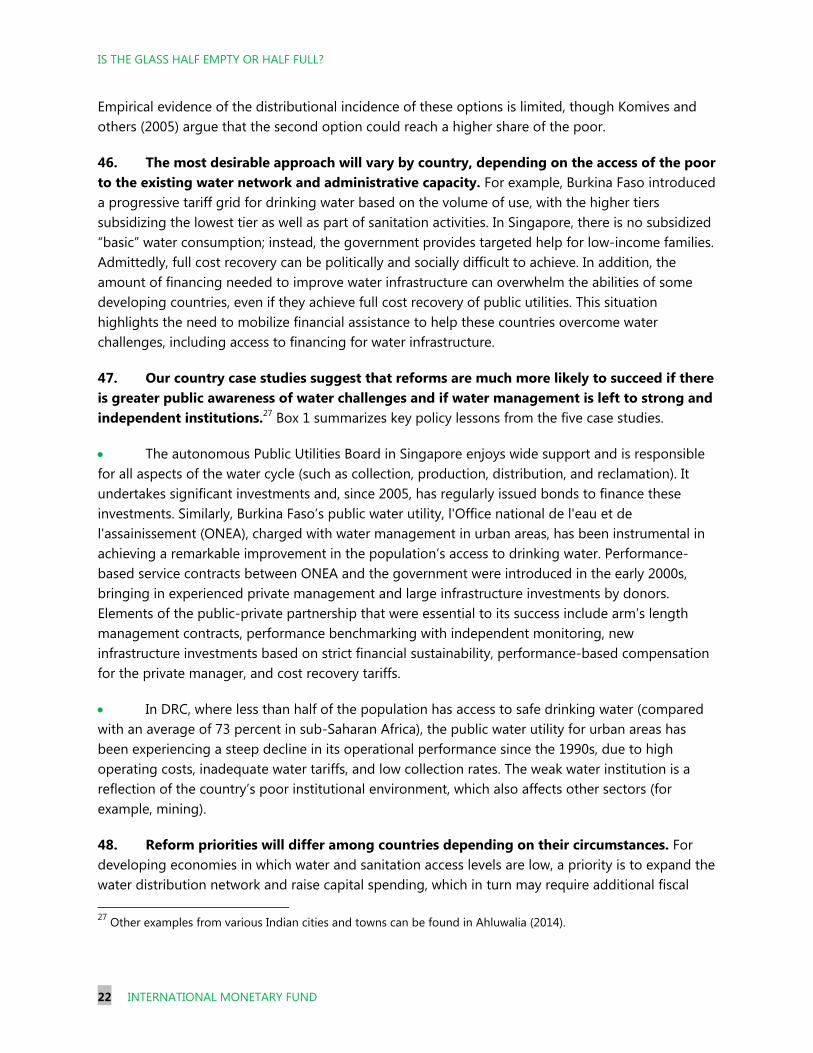
Building on extensive literature, this paper examines the role of economic policy instruments and institutions in managing water challenges. It provides three key policy-relevant findings, drawing on cross-country analysis and case studies. Notably, some naturally water-deficient countries have been able to overcome water challenges, thanks to sound policies and institutions.
Getting incentives right, notably by reforming water pricing, can help rationalize water use, promote needed investment, and protect the poor. Water subsidies provided through public utilities are estimated at about $456 billion or 0.6 percent of global GDP in 2012. They are also inequitable, disproportionately benefiting upper-income groups.
The most desirable approach to reform water pricing will vary by country, depending on access of the poor to the existing water network and administrative capacity. Effective and autonomous institutions in charge of water management can also provide credibility and synergize popular support for reforms. In developing countries, reforms should strengthen the finances of public water utilities to promote investment and expand access to water and sanitation for the poor. Ensuring adequate maintenance spending is a priority for all countries. Under the right circumstances, establishing markets for water rights can help allocate limited water to highest-valued uses.
Achieving sound water management requires an integrated and holistic approach going beyond the water sector itself. Water pricing reforms should be complemented by policies that rationalize water use in areas such as agriculture, trade, and energy, while redirecting achieved gains toward protecting the poor. For example, excessive pumping of groundwater can be discouraged by improving regulations and replacing energy subsidies with targeted social assistance.
The IMF can—and should—play a helpful role in ensuring that macroeconomic policies are conducive to sound water management. Since water challenges increasingly affect economic stability and growth, public finances, and poor and vulnerable social groups, they are of immediate importance to the membership. Key roles for the IMF in line with its mandate and expertise would include: (i) assessing the impact of water challenges on growth and macro-stability in collaboration with institutions that specialize in water; (ii) supporting policies to replace perverse subsidies with targeted social assistance under the right circumstances; and (iii) ensuring fiscal sustainability to support water infrastructure investment and financing.
IS THE GLASS HALF EMPTY OR HALF FULL?
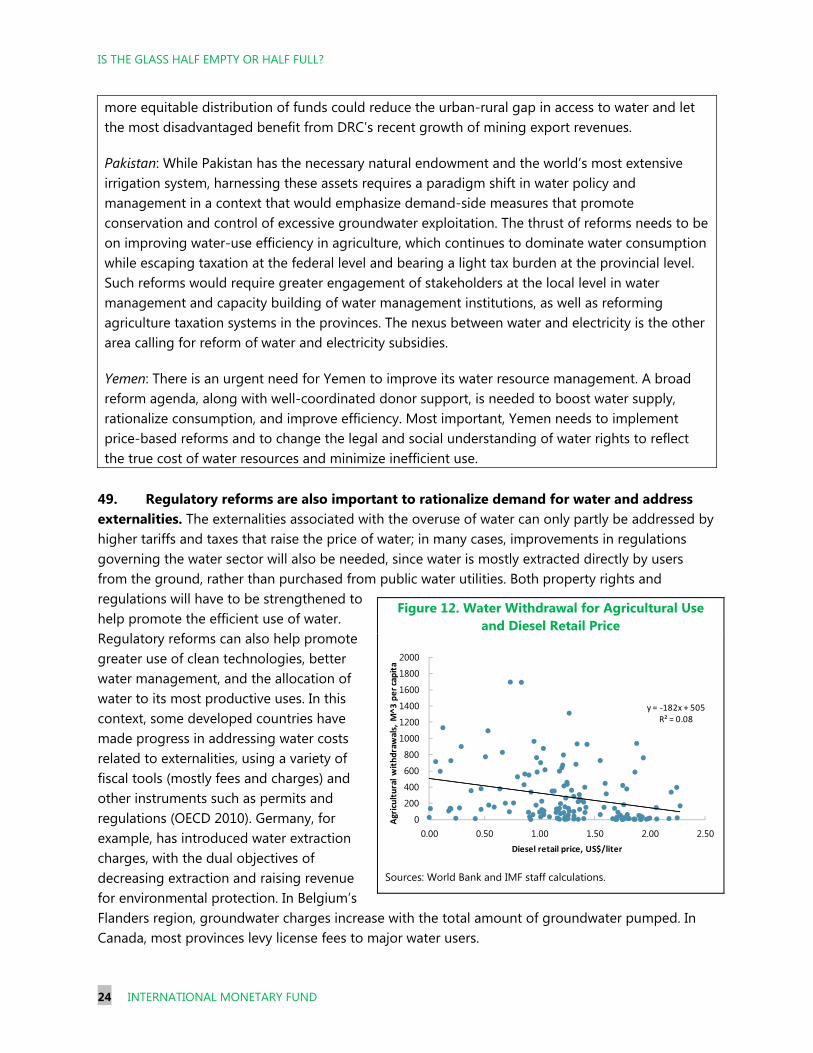
INTERNATIONAL MONETARY FUND 5
I. WHY CARE ABOUT WATER? 1. Water resources, which are essential for human development and environmental sustainability, are coming under intense pressure.3 Rising water demand as a result of urbanization and growth in income and population puts increasing strain on the availability, sustainability, and quality of water. At the same time, millions of people still lack access to safe drinking water and sanitation (water access). The water demand-supply imbalance and its consequences, which could be further exacerbated by climate change, are already evident in some regions. For example, Yemen—among the world’s most water-deficient countries—has been in a near-crisis situation for a decade, with growing local conflicts over water rights. And some parts of the United States use as much as 80 percent of their available freshwater resources, meaning that even relatively minor droughts can trigger water shortages. Policies are usually inadequate to address growing water challenges, a situation that contributes to inefficient water use and inadequate investment in water infrastructure. Looking ahead, without an improvement in water demand management, even substantial technological advances and investment are unlikely to close the growing water demand-supply gaps.
2. Failure to manage rising water challenges can impede a country’s economic prospects. Water challenges affect economic growth and stability in numerous ways, although the literature on the aggregate growth impact from such challenges is rather scant (reflecting, among other things, significant data gaps). Because water is a key input in agriculture, energy, and industry, water shortages and variability can lead to food insecurity, raise production costs,4 and constrain productivity growth. In some countries in which agriculture is a key source of growth and employment (for example, Burkina Faso, Morocco, and Mozambique), data show a high correlation between GDP growth and average rainfall, with activities affected greatly by droughts and floods.5 In addition, lack of water access inhibits development through various channels, including disease, poor health, and low participation of women in education and income-generating activities (women and girls usually are in charge of fetching water in developing countries). Moreover, water quality degradation would lead to reduced activity in sectors that depend on environmental quality (for example, tourism).
3. Managing water resources is a complex policy issue, often complicated by insufficient data and sensitivities related to national sovereignty and social norms. Water is a special
3 The World Economic Forum’s Global Risks 2015 Report (WEF 2015) lists water crises as the top global risk in terms of impact and eighth in terms of likelihood. 4 As examples at the business level, power plants have cut generation or scrapped plans for expansion in the face of water shortages, and companies have incurred additional costs to build their own desalination or treatment capacity to ensure sufficient water supply. 5 A World Bank study suggested that GDP growth in Mozambique was reduced by about 1.1 percentage points annually during 1981–2004 due to the impact of water-related shocks (World Bank 2007a).
IS THE GLASS HALF EMPTY OR HALF FULL?
6 INTERNATIONAL MONETARY FUND
economic good,6 with many unique features that differentiate it from other commodities: it is both a private and public good; it is bulky and difficult to transport; it can be used sequentially and can be recycled; finally, it is a heterogeneous commodity. These factors make it difficult to ascertain water’s economic value. Furthermore, water management encompasses political, economic, societal, environmental, and technological considerations. Perhaps most importantly, the right to safe drinking water and sanitation has long been recognized as a human right, and universal access to it is an important policy goal.
4. These complexities notwithstanding, water should not be a free good—the laws of demand and supply tell us that underpricing leads to overuse and undersupply. Water resources are limited and unevenly distributed, and some (like fossil fuels) are nonrenewable. Water use is found to negatively correlate with water cost (Figure 1), suggesting a role for price signals to rationalize water consumption. For example, in the United States, per capita water use in California has declined in recent decades as a result of the implementation of pricing incentives (Kearney and others 2014). Moreover, free water leads to what is known as the “tragedy of the commons,” as evidenced by some regions’ rapid depletion of underground aquifers.
5. Existing price signals are very often off the mark. This paper examines the issue of water pricing through the lens of public utilities. It finds that public utilities in many countries set water prices below the cost recovery level, creating incentives for overuse and underinvestment. This leads to financial losses for public water utilities, underfunding of maintenance, and low investment in new water infrastructure, which in turn results in low water access and quality and large network losses, aggravating water shortages.
6. Water subsidies, defined as the difference between actual water charges and a reference price that covers all supply costs, are inequitable. They benefit mostly upper-income groups in developing economies, as the poor often have limited or no access to piped water and improved sanitation. Even when the poor have access to piped water, lower levels of use mean they capture a smaller share of the benefits compared with other groups. For example, Cabo Verde, India, Nepal,
6 Principle 4 of the 1992 Dublin Statement on Water and Sustainable Development states that water has an economic value in all its competing uses and should be recognized as an economic good (http://www.un-documents.net/h2o-dub.htm).
Figure 1. Cost and Use of Water
Source: New York Times (http://www.nytimes.com/2014/10/15/business/economy/the-price-of-water-is-too-low.html); data sourced from Global Water Intelligence magazine. Note: Prices are city averages. The overall average is for the countries shown. Cost includes water and wastewater costs.
Denmark
Germany
BritainPoland
FranceCzech
Republic
Portugal
JapanRussia
Italy
AustraliaUnited
StatesSouth
Korea
Canada
0
50
100
150
200
250
0 5 10 15 20 25 30 35
Ga
llon
s p
er
pe
rso
n p
er
day
Cost per 1,000 gallons in U.S. dollars
Average
IS THE GLASS HALF EMPTY OR HALF FULL?
INTERNATIONAL MONETARY FUND 7
and Nicaragua provide the richest households with $3 worth of subsidized water, on average, for every $1 worth provided to the poorest households.
7. Getting the price right for water can be an important policy element for managing this essential natural resource and protecting access for the poor. The increasing competition for water resources calls for policy instruments to signal scarcity and create incentives for using water in an efficient, equitable, and sustainable manner. Furthermore, better pricing—especially when it allows for full cost recovery and a normal profit—would help ensure adequate maintenance, attract investment, and promote technological innovation, which in turn will contribute to sustaining or unlocking future water supply and increasing resilience to water supply variability. At the same time, water pricing reforms should be carefully designed to provide affordable water access for the poor through, for example, a progressive tiered tariff structure (see paragraph 44). Importantly, there need not be a conflict between proper water pricing and protecting the poor, not least because only small amounts of water are required to satisfy basic needs for safe drinking water and sanitation. Water pricing reforms should also be complemented by reforms of policies that drive the lion’s share of water use, notably agricultural and energy policies.
8. Experiences in some countries with naturally limited water resources have shown that sound water management can be achieved and water challenges are not insurmountable. Examples include low-income countries such as Burkina Faso and densely populated ones such as Singapore, both of which have no natural freshwater resources other than rainfall. In response to early recognition of the various constraints that limited water resources can impose on their economies, both countries have adopted water pricing policies that allow for full or near-full cost recovery and invest aggressively in water infrastructure. One notable innovation in Burkina Faso is the Bagre “growth pole,” in which a huge manmade reservoir supports diverse activities, such as fishing and irrigation for crops. In addition to rigorous water demand management, Singapore has adopted the “Four Taps” strategy—water imports, local catchment water, recycled water, and desalination—to secure its water supply.
9. Lack of proper management exacerbates water challenges, even in countries with abundant water endowment. A case in point is Pakistan, where, despite an abundance of water a few decades ago, lagging policies have raised the prospect of water scarcity that could threaten all aspects of the economy. The bulk of Pakistan’s farmland is irrigated through a canal system, but canal water is vastly underpriced, recovering only one-quarter of annual operating and maintenance costs. Meanwhile, agriculture, which consumes almost all annual available surface water, is largely untaxed. The combination of these policies leads to overuse of water. In the Democratic Republic of the Congo (DRC), a country with an extensive system of rivers and lakes, years of poor management, conflicting water sector regulations, and low cost recovery have created a situation in which consumption of drinking water is far below the regional average and only a fraction of agricultural land is irrigated. Meanwhile, the Colorado River Basin in the western United States, which supplies water to 40 million people and irrigates 4 million acres of farmland, is losing water at dramatic rates. Most of the losses are groundwater, the use of which has not been properly regulated.
IS THE GLASS HALF EMPTY OR HALF FULL?
8 INTERNATIONAL MONETARY FUND
10. Building on extensive literature on water management, this paper aims to help raise awareness of growing water problems and the need for concerted efforts. The efforts of development organizations (such as the World Bank and the United Nations), specialized institutions (such as the World Resources Institute), local communities, and national authorities have resulted in a wealth of knowledge and experience in how to manage water resources. However, the facts that water is an essential, finite, and mostly renewable natural resource and that its future supply needs to be preserved have not always been properly factored into macroeconomic policymaking. This paper complements other work by summarizing growing water challenges, highlighting their macro-criticality, and examining the role of economic (especially fiscal) instruments and institutions in rationalizing water use and promoting investment. The post-2015 sustainable development goals emphasize economic, environmental, and social sustainability for all. The policies implemented to achieve these goals must be coherent and mutually reinforcing. As water issues become an important policy challenge that affects economic stability, public finances, and growth in many countries, the IMF has a role to play in line with its mandate and expertise.
11. The IMF can play a helpful role in supporting institutions that specialize in water issues by ensuring that macroeconomic policies are conducive to sound water management. Assessing the impact of water challenges on growth and macro-stability can go a long way in garnering needed political and social support for reforms. Under the right circumstances, supporting policies to replace perverse energy and water subsidies with targeted social assistance will help countries achieve more efficient water use. Finally, ensuring fiscal sustainability to support water infrastructure financing and investment can help developing countries improve water access. This can also help sustain or increase future water supply, and strengthen resilience to supply variability.
12. Several caveats are warranted. The analysis underlying this paper was conducted at the country level and is thus constrained by the availability of comparable data across countries. Because water issues tend to be location-specific even within a country, policy responses must be tailored accordingly. Moreover, since water is essential for economic activities, policies that affect non-water sectors such as agriculture, energy, industry, and trade can have a large impact on water use and supply. Finally, there is an important international dimension to water management, not only reflecting the fact that some water basins cut across several countries7 but also the need for policy cooperation among countries to help overcome obstacles to reform.8 These important policy issues are beyond the scope of this paper.
7 Actual or potential cross-border issues can come into play where water resources are shared among countries. Existing or planned dams for flood control, electricity generation, and irrigation often involve technical, economic, and political aspects. Promoting more efficient water use can alleviate potential conflicts. A consensus among all stakeholders is key to settling issues in the long term. 8 Because water is bulky, large-scale cross-border water trading does not exist. To some extent, international trade of agricultural products can be seen as an indirect trade of water (“virtual water”) to substitute for domestic water scarcity. For example, a country that adopts policies promoting less-water-intensive crops needs to ensure that its demand for water-intensive agricultural products can be reliably met with imports.
IS THE GLASS HALF EMPTY OR HALF FULL?
INTERNATIONAL MONETARY FUND 9
13. The rest of this paper is organized as follows. Section II analyzes cross-country data on water supply and use to determine where water challenges are more pressing and why. Section III estimates country water price subsidies and discusses possible options for pricing reforms. It also reviews country experiences with markets for water rights, which are gaining increasing attention from policymakers.9 Section IV presents conclusions. The companion note10 includes a summary of key water issues in the Middle East, Central Asia, and sub-Saharan Africa, as well as five case studies: Burkina Faso, DRC, Pakistan, Singapore, and Yemen.
II. CHARTING WATER CHALLENGES 14. Water challenges are multifaceted. This paper adopts an economic perspective, focusing on challenges arising from water supply, water use, water access, and the availability of water relative to use, today and in the future. Although water quality and pollution are growing and important issues, they are not addressed here.
A. Water Supply and Variability
15. Although water covers approximately 70 percent of the Earth’s surface, only a small fraction of it is available for human use. Sources of usable (that is, accessible and renewable) freshwater are mainly ground and surface water, including rivers, streams, lakes, and wetlands. Groundwater, such as wells and aquifers,11 is the largest source of usable freshwater in the world, accounting for 30 percent of the total. In this discussion note, water supply will refer to renewable freshwater resources comprising surface water and recharge of groundwater from precipitation.
9 In 2014 China selected seven provinces to host pilot markets for trade in water rights; in the United States seven states in the Colorado River system are also starting a pilot program to explore the establishment of a market between farmers and urban water authorities. 10 http://www.imf.org/external/pubs/ft/sdn/2015/sdn1511tn.pdf. 11 An aquifer is an underground layer of water-bearing permeable rock or unconsolidated materials from which groundwater can be extracted with a use of a water well.
Figure 2. Annual Renewable Freshwater Resources per Capita (m3/person/year, 2012)
Sources: FAO, Aquastat and IMF staff calculations.
0 10000 20000 30000
Latin America and Caribbean
North America
Europe and central Asia
East Asia and Pacific
Sub-Saharan Africa
South Asia
Middle East and North Africa
IS THE GLASS HALF EMPTY OR HALF FULL?
10 INTERNATIONAL MONETARY FUND
16. The global stock of freshwater is unevenly distributed (Figure 2). Over 60 percent of the usable freshwater supply is found in just 10 countries. On a per capita basis, freshwater available in the Middle East and North Africa is only a tiny fraction of that in Latin America. China has roughly the same amount of freshwater as the United States, but it has four times the U.S. population.
17. While technology advances have been used in some advanced countries to help ease freshwater supply constraints, they are expensive. Desalination remains costly because of high reliance on energy and placement of such plants is generally more feasible near coastlines. While recycled water may be a viable long-term alternative, setting up production facilities requires substantial upfront investment, which can be prohibitively expensive.
18. Water supply is also subject to variation, which affects most countries. Four country-level indicators, calculated by the World Resources Institute (WRI) to measure different aspects of water variability,12 show that out of 179 countries and territories, 119 have at least one aspect of high variability (Annex Table T1). Thirty-four countries—all, except South Korea, developing—are vulnerable to high water variability in at least two aspects.
Figure 3. Vulnerability to Water Supply Variability
Source: World Resources Institute, Aqueduct and IMF staff calculations. 1/ Simple average of WRI’s supply variability indexes.
19. Highly variable water supply adds to the challenge of ensuring that water is available when it is needed. Transportation and storage could mitigate these challenges, but these require building and maintaining expensive infrastructure as well as more sophisticated planning.
12 Interannual variability measures variation in water supply across years; seasonal variability measures fluctuation in the water supply in different months; flood occurrence is measured by the number of floods recorded in 1985–2011; and drought severity is the average length of droughts times their dryness. Each indicator varies from 0 to 5, with 3 and above defined in this paper as “high variability.”
BGDBFA
TCD ERI
ETHKEN
LAONGA
NER
SEN
TZA
ZMB
ZWE
0
1
2
3
4
5
0 1 2 3 4 5
Up
stre
am S
tora
ge C
apac
ity
Ind
ex
Low
er
<--
----
----
----
----
--->
Hig
he
r
Average Supply Variability Index1 /
Rest of the World
Low Income Developing Countries
IS THE GLASS HALF EMPTY OR HALF FULL?
INTERNATIONAL MONETARY FUND 11
Unfortunately, many countries that face high water variability do not invest enough in increasing water supply resilience and have low storage capacity; this is particularly true for low-income countries such as Eritrea and Niger (Figure 3).
B. Water Use and Intensity
20. Water use is complex to measure, as water is not a homogenous good and is subject to sequential uses. Withdrawals of water—total water diverted for human use—are widely used to proxy the reliance of human activity on water.13 It is the broadest measure that encompasses domestic, agricultural, and industrial use of water. But water withdrawals do not properly capture the intensity of recycling or the impact on water quality.
21. Global water withdrawals have increased exponentially as a result of rising population and economic growth. Estimates dating back to the year 1700 suggest that global water withdrawals have risen by a factor of 40 (Shiklomanov 2000), far exceeding the 11-fold increase in population over the same period (Table 1). The other primary factor—increasing economic activity and income—is evidenced by a more than hundred-fold increase in global GDP.
Table 1. World: Population, GDP, and Water Withdrawals
Sources: Maddison (2010), Shiklomanov (2000), and IMF staff calculations.
22. A country’s water withdrawals tend to be highly correlated with the size of its population, economy, and agricultural land (Annex Figure A1). The 10 countries withdrawing the most water include seven out of 10 of the most populous in the world, six of the world’s 10 largest economies, and five of the 10 countries with the most land cultivated for agriculture (Table 2). Withdrawals in India, China, and the United States dwarf those of all other countries, given their combination of large populations, economic size, and agricultural sectors.
13 Data on and estimates of water withdrawals are available for a wide range of countries and time periods. This paper uses estimates from Gassert and others (2013).
Year Population GDP Withdrawals(in millions of
people) (in billions of international
dollars, base 1990) (in billions of cubic meters)
1700 604 371 1001820 1,042 694 2371900 1,564 1,972 5791950 2,526 5,336 1,3822010 6,916 53,394 4,104
IS THE GLASS HALF EMPTY OR HALF FULL?
12 INTERNATIONAL MONETARY FUND
23. Wealthier countries typically use less water per unit of GDP and more of it per person (Annex Figure A2). The relationship between income and water use is affected by two trends that work in opposite directions. Rising per capita income is reflected in increasing water use per person, driven primarily by factors such as more meat-intensive diets and higher consumption of manufactured goods (Flörke and others 2013; Hoekstra and Chapagain 2007). On the other hand, given that agriculture accounts for about 70 percent of total global water withdrawals (Shiklomanov 2000), water use per unit of income declines as income rises and the agricultural sector’s role in the economy decreases; thus, for example, water withdrawals in Europe and North America have declined in recent decades (Annex Figure A3).
24. Water intensity, defined as water withdrawals per unit of GDP, is unrelated to the abundance of water in a given location. One would expect water intensity to be positively related to the available supply of water if the economic structure of a country develops along the lines of its comparative advantage. But data suggest no correlation between intensity and water supply or its variability (Annex Figure A4). This could indicate either inefficient use of water resources or a nonlinear relationship, with intensity unrelated to water availability below a certain threshold and strongly related to it once supply constraints become binding. These hypotheses require further investigation.
C. Water Scarcity: Access and Stress
25. Water scarcity is a relative concept that can occur at any level of water use and supply. The scarcity can be economic or physical:
Economic water scarcity is lack of access to or unequal distribution of water. It can be caused by lack of infrastructure investment or poor institutions to satisfy water use even in areas with
Table 2. Water Withdrawals in 2010: Top 10 Countries
Sources: United Nations, World Population Prospects; World Resources Institute, Aqueduct; IMF, World Economic Outlook; and IMF staff calculations.
CountryFreshwater Withdrawal Population PPP GDP
Agricultural Land Area Withdrawals Withdrawals Withdrawals
(in billions of cubic meters)
(in millions) (in billions of international
dollars)
(in thousands of square
kilometers)
(cubic meters per capita)
(cubic meters per unit of
GDP)
(cubic meters per square kilometer)
India 760 1,206 4,130 3,287 631 18 231
China 627 1,360 10,040 9,597 461 6 65
United States 441 312 14,958 9,629 1,413 3 46
Pakistan 183 179 487 796 1,022 38 230
Indonesia 166 241 1,026 1,905 691 16 87
Iran 89 74 942 1,648 1,202 9 54
Russia 80 144 2,222 17,075 558 4 5
Mexico 80 118 1,603 1,958 676 5 41
Philippines 79 93 365 300 848 22 264
Japan 76 127 4,351 378 596 2 201
World Total 4,104 6,837 73,658 131,077 600 6 31
IS THE GLASS HALF EMPTY OR HALF FULL?
INTERNATIONAL MONETARY FUND 13
abundant water resources. A country’s economic water scarcity can be measured by the proportion of the population with water access.14
Physical water scarcity means insufficient availability of water relative to demand. Arid or dry regions are more likely to face physical water scarcity, but this is not necessarily the case since by definition physical scarcity is a relative concept relating water supply to demand. Physical water scarcity can be caused by human activity, such as overuse of water resources, as in the case of Pakistan.15 It can be assessed by computing water stress, generally defined as the ratio of water withdrawals over the total amount of renewable water supply.
26. Despite recent improvements, economic water scarcity remains a daunting issue for many developing countries. Almost 10 percent of the global population—mostly poor and marginalized—still lack access to safe drinking water sources according to the latest WHO/UNICEF estimates.16 The situation is even more severe for water sanitation, with more than 2.5 billion people (one out of every three) lacking access to sanitation facilities. At the regional level, sub-Saharan Africa has the lowest coverage of safe drinking water, while Africa and South Asia have the lowest access to water sanitation.
27. A country can experience severe water stress (that is, physical water scarcity) regardless of its stage of economic development (Annex Figure A5). With relatively high population density and low water endowments, the Middle East, the Caribbean, the Pacific island countries, and a few countries in Africa and Asia (for example, Libya, Morocco, and Singapore) are commonly found to face high water stress. The World Resources Institute’s Aqueduct project found that 36 countries already face “extremely high” levels of baseline water stress.17 This means that more than 80 percent of available water resources is withdrawn annually, leaving these countries vulnerable to shortages and variability.18
28. Benign water stress indicators at the country level can mask considerable variation within the country. Although a country may not face high water stress at the national level, high water stress could be observed at the basin and regional level. Large water variation within a country has the potential to trigger regional disputes over water resources, leading to social instability. Data on the standard deviation of water stress across different water basins within a country show that
14 The World Health Organization defines an improved drinking water source as “one that, by the nature of its construction, adequately protects the source from outside contamination” and an improved sanitation facility as “one that hygienically separates human excreta from human contact” (http://www.who.int/water_sanitation_health/monitoring/jmp2012/fast_facts/en/). 15 As another example, overuse of a seemingly abundant water source, the Colorado River basin in the United States, has led to high physical water scarcity downstream (The Water Project 2014). 16 http://www.wssinfo.org/data-estimates 17 This paper uses WRI’s “baseline water stress” index to measure physical water scarcity or water stress. 18 A country is said to face high water stress if more than 40 percent of available water resources is withdrawn annually.
IS THE GLASS HALF EMPTY OR HALF FULL?
14 INTERNATIONAL MONETARY FUND
among the 20 countries with the highest regional variation, 15 (including China and the United States) do not face high water stress at the country level (Annex Figure A6).
29. High water stress does not necessarily lead countries to economize on water use. Several countries in Central and South Asia are among the most water-intensive economies despite their high water stress (Figure 4). This suggests that competition for water resources has not led to water being used for activities with more value added. In some cases, groundwater is pumped to supplement surface freshwater supplies, resulting in rapid depletion of underground aquifers. All these underscore the challenges of rationalizing water use and adjusting the structure of economic activity in the face of water stress. For example, the pricing structure of major crops in Pakistan has impeded the adoption of more efficient technology and less-water-intensive crops. Fuel subsidies in Yemen, which were reduced in 2014, contributed to the rapid depletion of groundwater and the distorted production costs that favor water-intensive crops (for example, qat).
30. Underinvestment in water infrastructure is widespread, and it can exacerbate water scarcity. According to the World Health Organization (WHO) (2014), the financing requirement for developing countries to increase water access and sanitation to 88 percent and 75 percent by 2015 respectively was US$18 billion per year, and the cost of maintaining water services was US$54 billion per year. But the actual spending on the sector was only US$14–16 billion. Many developed countries have aging water infrastructure, with water networks nearing the end of their design lives. For example, 75 percent of urban water networks in the United Kingdom are more than 100 years old. As a consequence of underinvestment, water infrastructure is inefficient, with leakage losses as high as 45 percent in some OECD cities (Gurría 2014).
D. Putting Together Water Challenges
31. No country is spared water challenges (Figure 5). Understanding the causes of water stress (demand factors, supply factors, or both) and examining water access are important because policy responses would differ. Per capita annual water use and supply data are used to investigate causes of stress and access (Annex I).19
19 Given the inherent difficulty of defining high or low water use and supply, results shown here should be taken as indicative. In-depth analyses at the country and water basin levels are required to inform tailored policy responses.
Figure 4. Water Stress and Intensity
Sources: United Nations, World Population Prospects; World Resources Institute, Aqueduct; IMF, World Economic Outlook; and IMF staff calculations.
AFG
IRQ
KGZ
PAK
TJKUZB TKM
YEM
0
1
2
3
4
5
6
7
8
0 1 2 3 4 5WRI Baseline Water Stress Index
Wit
hdra
wal
s pe
r un
it o
f GD
P (l
og)
IS THE GLASS HALF EMPTY OR HALF FULL?
INTERNATIONAL MONETARY FUND 15
Figure 5. Water Heat Maps
WRI Baseline Water Stress Index 1/ Average Water Variability 2/
Water Use Per Capita 3/ Water Supply Per Capita 3/
Drinking Water 4/ Sanitation 4/
Sources: FAO Aquastat; WHO/UNICEF, Joint Monitoring Programme for Water Supply and Sanitation; World Resources Institute Aqueduct; and IMF staff calculations. 1/ Baseline water stress measures total water withdrawals (2010) expressed as a percentage of the mean available water flows (1950–2008). Countries are scored from 0 to 5, with 0 being the lowest stress and 5 being the highest. 2/ Average variability is a simple average of the scores for interannual (1950–2008), seasonal (1950–2008), flood (1985–2011), and drought (1901–2008) variability. Countries are scored from 0 to 5, with 0 being the lowest variability and 5 being the highest variability. 3/ Countries are ordered from high to low in terms of water use and supply per capita, and divided into threshold quintiles. The sample includes 165 countries. Each threshold is composed of 33 countries. 4/ Percentage of the population with access.
Low (0-1)
Low-Med. (1-2)
Med.-High (2-3)
High (3-4)
Extremely High (4-5)
No Data
Low (0-1)
Low-Med. (1-2)
Med.-High (2-3)
High (3-4)
Extremely High (4-5)
No Data
Top 20%
Fourth 20%
Middle 20%
Second 20%
Bottom 20%
No Data
Top 20%
Fourth 20%
Middle 20%
Second 20%
Bottom 20%
No Data
91-100%
76-90%
<50%
No Data
50-75%
91-100%
76-90%
<50%
No Data
50-75%
IS THE GLASS HALF EMPTY OR HALF FULL?
16 INTERNATIONAL MONETARY FUND
32. Countries facing high water stress need to rationalize water use and/or identify other water resources (Figure 6). High water stress can be attributed to extensive water use (for example, Australia, Mexico, Tajikistan, and Timor-Leste), water resource constraints (for example, India, Singapore, and Yemen), or both (for example, Azerbaijan, Pakistan, Saudi Arabia, and Uzbekistan). Given the difficulty and cost of developing alternative sources of water supply for many countries, the focus should be on policies to better rationalize water use. Some of the countries with high water stress also face economic water scarcity (Annex Figure A7 and Annex Table T2), suggesting that the effect of demand factors may increase as these countries try to improve water access for their populations.
Figure 6. Water Stress and Underlying Factors 1/
Sources: FAO Aquastat; WHO/UNICEF, Joint Monitoring Programme for Water Supply and Sanitation; World Resources Institute Aqueduct; and IMF staff calculations. 1/ UN-Water (2006) defines the threshold for renewable water availability at 1,700 m3/person/year. The threshold for per capita water use is derived at 680 m3/person/year, using the threshold for high water stress (40 percent). (H) and (L) in country examples stand for high and low access to water and sanitation.
MEX (H)
High Water Stress Area
Low Water Stress Area Low
Dem
and
Hig
h D
eman
d
Low Supply High SupplyS=1700D=680
Due to both supply and demand factors
Due to both supply and demand factors
Due to very low demand
Due to excessive demand
Due to scarce supply
Due to abundant supply
Afghanistan (L) Azerbaijan (H)Pakistan (L) Saudi Arabia (H) Turkmenistan (L) Uzbekistan (H)
Australia (H) Mexico (H)Philippines (L) Swaziland (L) Tajikistan (L) Timor-Leste (L)
Burkina Faso (L) Denmark (H)
Bolivia (L) Lao P.D.R (L)DRC (L) Norway (H)
U.S. (H)
India (L) Singapore (H)Yemen (L)
IS THE GLASS HALF EMPTY OR HALF FULL?
INTERNATIONAL MONETARY FUND 17
33. Low water stress does not imply an absence of challenges in water management. Despite high per capita water use, some countries’ low stress is explained by their abundant water endowment (for example, the United States), suggesting scope for improving water management to rationalize use. Many other countries with low water stress are low-income countries that currently have low per capita water use and also need to improve water access for their populations (for example, Bolivia, Burkina Faso, DRC, and Lao P.D.R.). As improving water access, urbanization, and growing income are expected to increase water use in these countries, policies need to preempt rising water stress in the future. On a positive note, some countries (for example, Denmark) have been able to rationalize water use, achieve universal water access, and maintain low water stress in the face of water resource constraints.
34. Addressing water challenges is complicated by the fact that policies that affect water use, directly or indirectly, are mostly set according to political or administrative boundaries, such as nations or states. The issue of “tragedy of the commons” and overexploitation of water can arise when two or more countries or states that share the same water basin have policies and management frameworks that lack a holistic understanding of sustainable development across the entire basin. On the other hand, different policies and regulations governing water use may be warranted in a country that has several distinct water basins. An attempt to ensure “equal treatment” within the same country may instead lead to a system that disincentivizes efficient use of water.
E. Water Sustainability
35. Long-term scenarios forecast large increases in water use that, for many countries, cannot be met by existing supplies. With expected growth in population and economic activity, future global water use will far exceed today’s level.20 At the same time, freshwater availability is expected to remain more or less fixed in the coming decades. While expecting further improvements in efficiency is not unreasonable, their impact is highly uncertain. The consensus among analysts is that even substantial technological advances and investment would be insufficient to close the projected future gaps between water supply and water use.21
36. Closing the gaps will require policy adjustments to better rationalize water use. Since water is bulky and costly to transport, an overabundance in one locality does not translate easily into alleviating shortages in another. There is also a great deal of uncertainty surrounding the ability of international trade of agricultural products to substitute for domestic water scarcity (Liu and others 2014). Furthermore, climate change is expected to exacerbate water sustainability through
20 According to the 2030 Water Resources Group (2009), if no action is taken, growing population, rapid urbanization, and economic growth are estimated to lead to global water demand exceeding the existing water supply by 40 percent in 2030.
21 See 2030 Water Resources Group (2009); Alcamo, Flörke, and Märker (2007); Duarte, Pinilla, and Serrano (2011); Ercin and Hoekstra (2014); Hanasaki and others (2013a and 2013b); Hejazi and others (2013); and Schlosser and others (2014).
IS THE GLASS HALF EMPTY OR HALF FULL?
18 INTERNATIONAL MONETARY FUND
higher precipitation variability and increased evapotranspiration in areas where temperatures increase (Schlosser and others 2014).
III. GETTING INCENTIVES RIGHT 37. Policies to signal scarcity can be an important part of the solutions to water challenges. This section analyzes issues in water pricing and discusses options for reforms. Where cross-country data are available, we focus on drinking water and wastewater provided by public utilities. Limited data availability does not permit the inclusion of agricultural water use (which is the lion’s share of total withdrawals) in the analysis. However, water pricing by public utilities can serve as a microcosm of the broader problem, which is that underpricing disincentivizes water conservation and investment. We also review the benefits and costs of informal and formal markets for water rights and summarize some general principles in establishing such markets.
A. Issues in Water Pricing by Public Utilities
38. Through public water utilities, most countries subsidize water, creating incentives for overuse and imposing a substantial fiscal burden. Subsidies occur whenever a price gap exists between the price charged for water and a reference price that covers all supply costs, including depreciation and maintenance of infrastructure. These subsidies are rarely reported or appropriately funded; instead, they are reflected in the underfunding of maintenance, the deterioration of water infrastructure, and financial losses for public water utilities. This in turn necessitates capital injections or new investment at a future date to maintain the level of services. Ultimately, a large share of the fiscal costs of water subsidies is borne by subnational authorities responsible for providing water. Given the low revenue capacity of these governments, this fiscal burden squeezes their ability to provide other essential public services.
39. The ”price gap” approach is widely used to identify and estimate subsidies. This paper follows the price gap approach for estimating water subsidies but adjusts the reference price upward for countries suffering from water scarcity (Annex III). Based on this approach, water
Figure 7. Public Water Subsidies by Country Groups and Regions (Percentage of regional GDP)
Sources: Global Water Intelligence (2004); ILO, Key Indicators of the Labor Market; IMF World Economic Outlook, and IMF staff calculations.
0.0
0.2
0.4
0.6
0.8
1.0
1.2
1.4
1.6
1.8
2.0
Advanced Economies
Emerging Europe Sub-Saharan Africa
Latin America and the Caribbean
Middle East, North Africa, and
Pakistan
Developing Asia Commonwealth of Independent
States
IS THE GLASS HALF EMPTY OR HALF FULL?
INTERNATIONAL MONETARY FUND 19
subsidies are estimated at about US$456 billion, or about 0.6 percent of global GDP in 2012, the latest year for which data are readily available. Across regions, subsidies average between 0.3 percent and 1.8 percent of GDP (Figure 7). Developing Asia has the largest subsidies in absolute terms (US$196 billion), with China accounting for more than two-thirds of that amount. Cost recovery is particularly low in South Asia despite its higher externalities from groundwater depletion. Subsidies are also substantial at the country level, reaching above 5 percent of GDP in seven countries: Azerbaijan, Honduras, Kyrgyz Republic, Mongolia, Tajikistan, Uzbekistan, and Zimbabwe.22 All of these countries except Honduras and Zimbabwe face high water stress (Annex Figure A8).
40. On average, water prices in advanced economies for households and industry use tend to be at or close to cost recovery levels. However, some advanced economies continue providing subsidized water for agriculture and electricity generation, contributing directly to the substantial underpricing of water and indirectly to pricing distortions in the agricultural and energy sectors (OECD 2006 and 2010b). For example, a few OECD countries continue to apply no charges to irrigation water abstraction. However, these subsidies are not captured in our analysis owing to the difficulty of obtaining information on the extent of irrigation and energy generation subsidies. Moreover, issues of appropriate management of water resources are important for advanced economies as well, given that prices do not necessarily reflect externalities.
41. Water subsidies are inequitable. Water subsidies mostly benefit upper-income groups in developing economies, as the poor often have limited or no water access.23 Even when the poor do have access to piped water, lower levels of use mean they capture a smaller share of the benefits compared with other groups.24 In three low-income economies for which data are available, the poorest 20 percent of the population received, on average, less than 11 percent of subsidies incurred by public water utilities, while the
22 The reference price is adjusted for labor costs (downward) and for countries suffering from water scarcity (upward). Data on water prices and water consumption are drawn from Global Water Intelligence Global Water Market database. 23 In many regions where water is scarce and access is limited during the day, middle- and upper-income groups have systems in place that allow them to store water for use throughout the day. 24 In the case of agricultural water use, access to irrigation by poor farmers should be a key consideration in determining the share of subsidies to the poor.
Figure 8. Distribution of Water Subsidies by Income Groups (Percentage of total subsidies)
Sources: Komives and others (2005) and IMF staff calculations. Note: The group of low-income countries comprises Cabo Verde, Nepal, and Nicaragua. The group of emerging market economies includes Argentina, Chile, Colombia, Croatia, India, Panama, Paraguay, and Venezuela.
0
5
10
15
20
25
30
35
Bottom 20% Second 20% Middle 20% Fourth 20% Top 20%
Low-income
Emerging
IS THE GLASS HALF EMPTY OR HALF FULL?
20 INTERNATIONAL MONETARY FUND
richest 20 percent received over 30 percent of the benefits (Figure 8). Subsidies are less inequitable in emerging market economies, where the poorest received, on average, 22 percent of the subsidies. However, these numbers mask important differences across economies: for example, the poorest receive about 11 percent of subsidies in India and 36 percent in Chile.
42. Prices rarely reflect the externalities associated with water use. These externalities include those linked to the extraction of nonrenewable sources of groundwater25 and the impact of renewable and nonrenewable water use (particularly in agriculture and industry) on water pollution, vulnerable watersheds and deltas, and so on.26 In principle, addressing the depletion externality requires that a scarcity value be reflected in extraction charges that rise over time. These charges should increase (at the rate of interest under some simplifying assumptions) as water resources are exhausted, similarly to what is laid out in the standard Hotelling model for nonrenewable resources (Tietenberg and Lewis 2014).
43. Due to the lack of data, very few empirical studies measure these externalities. To begin with, the practical design of prices to correct for externalities is complex, mainly reflecting the fact that the size of the externality is highly sensitive to local conditions, such as how rapidly the water table is declining. Based on an analysis for the U.S. state of Kansas, Pfeiffer and Lin (2012) suggest that externalities are modest, causing water use to exceed efficient levels by only 2½ percent. But externalities can be much larger in developing economies where water scarcity is more severe and prices charged for its use are significantly lower or nonexistent, compounding the problem of overconsumption. For example, Reddy (2005) finds externalities of about US$120–US$200 per rural household in a study covering the Indian state of Andhra Pradesh, with the precise value depending on the degree of water scarcity. A highly crude extrapolation of this result to the entire country would estimate externalities of around 1½ percent of GDP in India. An even simpler extrapolation to other economies (Figure 9) suggests that the annualized depletion externality is generally less costly than for India, partly because agriculture is less dependent on irrigation in most other economies. 25 Extraction of groundwater can be excessive because users are not charged for lowering the water table, which can raise pumping costs for other users. 26 Water pollution can be severe, especially in developing economies, and can impose costly damages. For example, it is estimated that in China the annualized damage due to water pollution is about 2 percent of GDP (World Bank 2007).
Figure 9. Costs Related to Depletion Externality in Selected Economies
Sources: Reddy (2005), World Bank, and IMF staff calculations.
0.0
0.2
0.4
0.6
0.8
1.0
1.2
1.4
1.6
Au
stralia
Ken
ya
Po
land
Germ
any
Can
ada
Sou
th A
frica
Ru
ssia
Brazil
Co
sta Rica
Malaw
i
Mexico
Ethio
pia
Tun
isia
Japan
Ukrain
e
Mau
ritius
Ph
ilipp
ines
Ecuad
or
Ko
rea
Ind
ia
Pe
rce
nt
of G
DP
IS THE GLASS HALF EMPTY OR HALF FULL?
INTERNATIONAL MONETARY FUND 21
B. Water Pricing Reforms
44. Water pricing reforms are essential to rationalize demand, improve the delivery of services, and unlock additional water supply. Pricing reforms could improve cost recovery in public water utilities, strengthen the fiscal balances of subnational governments, raise investment in water infrastructure, promote efficiency in water use, and incentivize the development of new technologies. Notably, water pricing reforms and, more broadly, strengthening the management of public utilities will help reduce large commercial and physical water losses (Figure 10). However, water pricing reforms will need to be accompanied by reforms of policies that drive water use in agriculture, trade, and energy. Moreover, they will need to consider affordability to ensure water access for the poor. The poor spend a larger part of their income on water than the rich in developing economies (Figure 11), given the poor’s high expenditures on private vendors. Surveys also indicate that the poor are willing to pay even higher prices than current levels, although not enough to fully recover costs (Guha 2007; Halpern and others 2000; Vasquez and others 2009). Targeted income assistance can be provided to ensure that the poor are just as well off as before the reforms.
45. Several options are available for structuring prices to make safe water affordable to the poor. One option is to establish a dual tariff structure that provides a certain amount of water at subsidized prices to everyone and charges a higher tariff beyond that level. For the poor to benefit, this approach requires high levels of access by the poor to the public water network. A second option is to subsidize water at public pumps. This type of subsidy is self-targeted, especially if the pumps are available only in low-income neighborhoods. The third option is to subsidize water connections for the poor, improving their access to water at prices below those charged by private vendors.
Figure 10. Ratio of Nonrevenue Water (NRW) Losses of Public Water Utilities 1/ (Percentage of urban water supply)
Sources: Kingdom and others (2006) and IMF staff calculations. 1/ NRW is the difference between the amount of water put into the distribution system and the amount of water billed to customers. High levels of NRW reflect huge volumes of water being lost through leaks, not being invoiced to customers, or both.
Figure 11. Household Expenditure on Water by Income Groups (Percentage of total income)
Sources: Komives and others (2005) and IMF staff calculations.
0.0
0.5
1.0
1.5
2.0
2.5
3.0
3.5
4.0
4.5
5.0
Latin America Eastern Europe Sub-Saharan Africa South Asia
Bottom 20%
Second 20%
Middle 20%
Fourth 20%
Top 20%
0
5
10
15
20
25
30
35
Developed Countries Developing Countries
Commercial Losses
Physical Losses
IS THE GLASS HALF EMPTY OR HALF FULL?
22 INTERNATIONAL MONETARY FUND
Empirical evidence of the distributional incidence of these options is limited, though Komives and others (2005) argue that the second option could reach a higher share of the poor.
46. The most desirable approach will vary by country, depending on the access of the poor to the existing water network and administrative capacity. For example, Burkina Faso introduced a progressive tariff grid for drinking water based on the volume of use, with the higher tiers subsidizing the lowest tier as well as part of sanitation activities. In Singapore, there is no subsidized “basic” water consumption; instead, the government provides targeted help for low-income families. Admittedly, full cost recovery can be politically and socially difficult to achieve. In addition, the amount of financing needed to improve water infrastructure can overwhelm the abilities of some developing countries, even if they achieve full cost recovery of public utilities. This situation highlights the need to mobilize financial assistance to help these countries overcome water challenges, including access to financing for water infrastructure.
47. Our country case studies suggest that reforms are much more likely to succeed if there is greater public awareness of water challenges and if water management is left to strong and independent institutions.27 Box 1 summarizes key policy lessons from the five case studies.
The autonomous Public Utilities Board in Singapore enjoys wide support and is responsible for all aspects of the water cycle (such as collection, production, distribution, and reclamation). It undertakes significant investments and, since 2005, has regularly issued bonds to finance these investments. Similarly, Burkina Faso’s public water utility, l'Office national de l'eau et de l'assainissement (ONEA), charged with water management in urban areas, has been instrumental in achieving a remarkable improvement in the population’s access to drinking water. Performance-based service contracts between ONEA and the government were introduced in the early 2000s, bringing in experienced private management and large infrastructure investments by donors. Elements of the public-private partnership that were essential to its success include arm’s length management contracts, performance benchmarking with independent monitoring, new infrastructure investments based on strict financial sustainability, performance-based compensation for the private manager, and cost recovery tariffs.
In DRC, where less than half of the population has access to safe drinking water (compared with an average of 73 percent in sub-Saharan Africa), the public water utility for urban areas has been experiencing a steep decline in its operational performance since the 1990s, due to high operating costs, inadequate water tariffs, and low collection rates. The weak water institution is a reflection of the country’s poor institutional environment, which also affects other sectors (for example, mining).
48. Reform priorities will differ among countries depending on their circumstances. For developing economies in which water and sanitation access levels are low, a priority is to expand the water distribution network and raise capital spending, which in turn may require additional fiscal 27 Other examples from various Indian cities and towns can be found in Ahluwalia (2014).
IS THE GLASS HALF EMPTY OR HALF FULL?
INTERNATIONAL MONETARY FUND 23
resources. At the same time, it is important that resources mobilized by pricing reforms are in fact used for investment and maintenance spending to boost access to water and sanitation. Many countries—developing or not—whose populations enjoy good access to water and sanitation need to increase capital spending to repair aging infrastructure and sustain future water supply. Ensuring adequate maintenance spending is a priority in all countries.
Box 1. Country Case Studies: Key Policy Lessons Five case studies in the companion note examine the experiences of Burkina Faso, Democratic Republic of the Congo (DRC), Pakistan, Singapore, and Yemen in dealing with various water challenges. Burkina Faso and Singapore are success cases in which sound water management has eased problems arising from natural water scarcity. Yemen (one of the world’s most water-deficient countries), Pakistan (which has one of the world’s largest glaciers), and DRC (covered by an extensive system of lakes and rivers) are facing water scarcity that to a large extent reflects years of poor management. The following are some policy lessons from these case studies.
Burkina Faso: Restricted access/high costs for water can bring about homegrown solutions to improve efficiency and reduce per capita use. Resilience to variability of water supply can be improved through aggressive government investment strategies, while public water utilities can achieve cost recovery for drinking water access, provided they focus on independent management, cost recovery, financially sustainable investment, quality of service, and social objectives. Burkina Faso still faces major water challenges—a large infrastructure gap, low access to sanitation, and still-high vulnerability to water shocks—likely to be aggravated further by high population growth, contamination, urbanization, climate change, and structural transformation, and these call for even more aggressive policies.
Singapore: High-level political support for farsighted policy objectives and strong institutions, including an autonomous institution in charge of water management, is among the key factors that enabled Singapore to put in place a comprehensive water strategy. The Singaporean approach is not limited to diversification of water supply sources. It also relies on (i) rigorous water demand management that recovers costs to the fullest extent possible while protecting the poor through targeted social assistance, (ii) continued investment in new technologies, and (iii) involvement of the broad society in water conservation. The rapid improvement in living standards and industrialization of the economy with a significantly reduced role of the agricultural sector may have helped secure broad support for the government’s water strategy.
DRC: The water situation in DRC mirrors the weaknesses of other sectors (mining, oil extraction), where delays in the passage of crucial legislation and limited capacities of state institutions such as ministries and administrative bodies are impeding full exploitation of an otherwise abundantly available and diversified natural resource. More broadly, problems with water also reflect across-the-board governance challenges after three decades of internal conflict. The current cross-subsidized system is not working properly, given the very low collection rate. While investment in the water and sanitation infrastructure is a potential channel for enhancing the inclusiveness of growth, there are large regional differences in the allocation of investment. The institutional environment is crucial for adequate management and expansion of the water infrastructure, and a
IS THE GLASS HALF EMPTY OR HALF FULL?
24 INTERNATIONAL MONETARY FUND
y = -182x + 505R² = 0.08
0
200
400
600
800
1000
1200
1400
1600
1800
2000
0.00 0.50 1.00 1.50 2.00 2.50
Agr
icu
ltu
ral
wit
hd
raw
als,
M^
3 p
er
cap
ita
Diesel retail price, US$/liter
more equitable distribution of funds could reduce the urban-rural gap in access to water and let the most disadvantaged benefit from DRC’s recent growth of mining export revenues.
Pakistan: While Pakistan has the necessary natural endowment and the world’s most extensive irrigation system, harnessing these assets requires a paradigm shift in water policy and management in a context that would emphasize demand-side measures that promote conservation and control of excessive groundwater exploitation. The thrust of reforms needs to be on improving water-use efficiency in agriculture, which continues to dominate water consumption while escaping taxation at the federal level and bearing a light tax burden at the provincial level. Such reforms would require greater engagement of stakeholders at the local level in water management and capacity building of water management institutions, as well as reforming agriculture taxation systems in the provinces. The nexus between water and electricity is the other area calling for reform of water and electricity subsidies.
Yemen: There is an urgent need for Yemen to improve its water resource management. A broad reform agenda, along with well-coordinated donor support, is needed to boost water supply, rationalize consumption, and improve efficiency. Most important, Yemen needs to implement price-based reforms and to change the legal and social understanding of water rights to reflect the true cost of water resources and minimize inefficient use.
49. Regulatory reforms are also important to rationalize demand for water and address externalities. The externalities associated with the overuse of water can only partly be addressed by higher tariffs and taxes that raise the price of water; in many cases, improvements in regulations governing the water sector will also be needed, since water is mostly extracted directly by users from the ground, rather than purchased from public water utilities. Both property rights and regulations will have to be strengthened to help promote the efficient use of water. Regulatory reforms can also help promote greater use of clean technologies, better water management, and the allocation of water to its most productive uses. In this context, some developed countries have made progress in addressing water costs related to externalities, using a variety of fiscal tools (mostly fees and charges) and other instruments such as permits and regulations (OECD 2010). Germany, for example, has introduced water extraction charges, with the dual objectives of decreasing extraction and raising revenue for environmental protection. In Belgium’s Flanders region, groundwater charges increase with the total amount of groundwater pumped. In Canada, most provinces levy license fees to major water users.
Figure 12. Water Withdrawal for Agricultural Use and Diesel Retail Price
Sources: World Bank and IMF staff calculations.
IS THE GLASS HALF EMPTY OR HALF FULL?
INTERNATIONAL MONETARY FUND 25
50. Achieving greater efficiency in water consumption will require reforms of other policies that drive water use, directly or indirectly. Agriculture uses about 70 percent of all water withdrawn from the ecosystem (FAO 2014). In many countries, the inefficient use of water in agriculture stems from an array of nonwater policies that restrict economic diversification, reducing opportunities for employment outside agriculture and discouraging farmers from diversifying into higher-value crops. These policies include trade restrictions, as well as rigidities in land, real estate, and financial markets (World Bank 2007b). Other policies that encourage wasteful use of water in agriculture are price supports and subsidized credit. Subsidized energy prices also create disincentives for efficient use of water in agriculture, as they reduce the price of pumping groundwater. For example, data suggest that countries with low prices for diesel fuel tend to have greater withdrawal of water for agricultural use (Figure 12).28
C. Markets for Water Rights
51. To the extent that water pricing mechanisms do not exist or inaccurately reflect the economic value of water, allocation of water resources across sectors is likely inefficient. In theory, the development of markets (that is, permitting voluntary, mutually beneficial trades) could result in water moving to its highest-valued uses (Olmstead 2010).29 Such water markets exist both formally and informally. Some countries (for example, Australia, Chile, and Mexico) and the western United States have established formal mechanisms of water trading (that is, in accordance with a set of rules and regulations approved by governments at national or subnational levels). Informal water markets are common in South Asia and also existed in Mexico before a formal mechanism was introduced.
52. Formal water markets can bring sizable net benefits. Key benefits stem from redirecting water toward more productive uses and from reducing price differentials. For example, in Australia, the establishment of markets for water rights has led to a shift toward higher value-added agricultural production and adoption of more efficient irrigation technologies (Bjornlund and McKay 2002). In the United States, multifold differences in prices paid for water by different agents in neighboring areas indicate potential gains from water trading. For example, Brewer and others (2008) found that some farmers in Arizona paidUS$27 per acre-foot while nearby urban customers paid from US$479 to US$3,267 per acre-foot. Prompted by the drought in 2014, seven states in the Colorado River system are starting a pilot program to explore a market between farmers and urban water authorities to help maintain water volumes in Lake Powell and Lake Mead.
53. Formal markets for water rights are still rare. Factors holding back development of these markets include legal complexities (pertaining to definition of water rights, mechanisms of their
28 Regression analysis conducted by staff suggests that, after controlling for GDP per capita, a 1 percent increase in the price of diesel would reduce water withdrawal per capita by 0.7 percent. 29 Water marketing is not the only way water can be reallocated across sectors to address inefficiencies in the current allocation of supplies. Other potential allocation mechanisms include administrative transfers and redesign of large-scale water projects to favor different groups of users.
IS THE GLASS HALF EMPTY OR HALF FULL?
26 INTERNATIONAL MONETARY FUND
distribution among agents, and establishment of means of monitoring and enforcing contracts), shortage of necessary infrastructure (when distances between potential counterparts are large), and search costs (ability to identify buyers and sellers, especially in areas that are not highly populated). A proper setup requires strong legal, institutional, and accountability frameworks—areas in which many countries may be lagging (World Bank 2007). If they fail to meet these conditions, markets for water rights may do more harm than good, exacerbating water challenges.
54. Informal markets for water rights may result in distortions. For example, in South Asia, farmers who are wealthier and can afford large groundwater wells with pumps sell water to smaller farmers who cannot afford such infrastructure at a high “monopoly” price with payment taking the form of cash, labor, or share farming (Bjornlund and McKay 2002). This lucrative opportunity to sell pumped water with low costs (due to energy subsidies) leads to lower agricultural production, widening of income gaps, and faster depletion of underground aquifers. Although informal markets are, technically speaking, not legal and their functioning may be imperfect, governments tend to turn a blind eye, hoping that these arrangements will solve the problems of water allocation among competing users.
55. Successful establishment of markets for water rights needs to follow some general principles. Building institutions for trading water rights and meeting these principles can be a challenging process even in advanced economies, not to mention developing countries, where institutional and policy frameworks tend to be weaker.30
Water rights need to be defined in a clear, socially accepted, environmentally sustainable, and enforceable manner. This can be difficult because water is a common pool resource—excluding users is costly and consumption is rivalrous, not only at a given point in time but also across generations). One also needs to be mindful of the way the land rights are defined, especially for plots adjacent to water basins.
Introduction of formal systems should deal with preexisting practices. In the absence of well-specified arrangements, water extractors tend to see their current allocations, often reflecting historical practices, as established rights.
Establishment of a water rights market requires a sufficiently large number of potential buyers and sellers in proximity to each other. These buyers and sellers also need to be in an area with a relatively stable water supply, transparent and accepted measurement systems, administrative systems that register and enforce deliveries, well-maintained delivery infrastructure, and judicial systems capable of resolving conflicts and enforcing environmental legislation.
30 The World Bank (2007) finds that if water rights are not clearly defined and withdrawals are not regulated, water trading can lead to overexploitation, as seen in Yemen.
IS THE GLASS HALF EMPTY OR HALF FULL?
INTERNATIONAL MONETARY FUND 27
Water markets need to be sufficiently flexible. This reflects the need to accommodate changes stemming from both the demand (for example, new crops that require significantly more or less water, emergence of new or exit of existing agents) and supply (for example, drought) sides.
56. There are limits to what markets for water rights can do. Water markets are unlikely to eliminate, or sometimes even significantly reduce, price differentials because water is a multidimensional (legally and hydrologically) commodity. There may also be market imperfections driven by local factors. Water markets are likely linked to specific water basins and thus limited by existing infrastructure. Such markets tend to have a small number of potential traders of disparate size, and information flows and links could be insufficient.
IV. CONCLUDING REMARKS 57. Given water’s vital role in sustaining life and the rising demand for its use, sound water management is necessary to rationalize use and ensure availability, in particular access by the poor and vulnerable. Water’s unique features and the social, environmental, and political aspects surrounding it have often led it to be managed as if there were no limits to its supply. However, many parts of the world are already experiencing shortages, and the pressures are only expected to rise in the coming decades. In some locations, a low endowment contributes to these shortages, but mismanagement of water—especially the price set on its use—is usually a driving factor, both directly (by maintaining water prices below cost recovery) and indirectly (for example, by subsidizing industries that rely on water, such as agriculture and energy). By contrast, as this paper and the accompanying background note show, some countries have successfully managed these challenges by adopting appropriate pricing mechanisms, strengthening water management institutions, and investing in infrastructure, maintenance, and new water-saving technologies. But even countries that are not facing immediately pressing water challenges should take action or risk doing too little, too late. By focusing mainly on the underpricing of water by public utilities, the analysis in this paper likely only touches the tip of the iceberg. Nevertheless, it flags the issue of how economic policies can help address water challenges and support environmental and social sustainability.
58. The IMF can—and should—play a helpful role in ensuring that countries’ macroeconomic policies are conducive to sound water management. Since water challenges affect economic growth, public finances, and poor and vulnerable social groups, they are of immediate importance to the membership. In collaboration with other institutions such as the World Bank, the IMF can help most directly by assessing the impact of water challenges on growth and macro-stability. In addition, the IMF can encourage macroeconomic policies to “get the incentives right”; for example, replacing perverse energy and water subsidies with targeted social support under the right circumstances. Finally, by designing macroeconomic policies that create fiscal space or catalyze financing, the IMF can help countries increase water-related investment to improve water access and strengthen resilience to supply variability. It can also advise countries on strengthening their public investment management systems, which will contribute to adequate maintenance spending and better prioritization of public investment.
IS THE GLASS HALF EMPTY OR HALF FULL?
28 INTERNATIONAL MONETARY FUND
ANNEX I. DATA AND DEFINITIONS 1. Water withdrawals. A drop of water, once withdrawn from its natural source, ends up in one of three states: “consumed”—either embodied in a product or returned to the atmosphere through evapotranspiration; “recycled”—employed for additional human use; or “discharged”—allowed to run off, whether into the ground or a body of water. An ideal measure of water use would directly account for the number of times a drop of water is recycled before discharge, but such a measure does not exist. The measure of water withdrawals includes all the three categories.
2. Data sources. Data on water supply and withdrawals are from the Food and Agriculture Organization’s Aquastat31 and WRI’s Aqueduct database respectively. Building on the databases that are often at the water basin level, the WRI’s Aqueduct database32 also provides comparable water risk indicators at the country level.
3. Water intensity. Defined as water withdrawals per unit of GDP, water intensity could serve as a proxy for the efficiency of water use. It allows for identifying potential water issues if analyzed together with other water indicators. For example, high water intensity and water shortages together may be indicative of the need to raise the efficiency of water use and increase recycling efforts (see paragraph 28). However, water intensity provides little information about the efficiency of use without looking at the underlying explanatory factors, as it does not take into account recycling and sequential water use.
4. High water stress. A country is said to have “high water stress” if WRI (2013) classifies it as either “extremely high water stress” or “high water stress”. That is, its rate of water withdrawals to supply is equal to or more than 40 percent or the WRI’s water stress indicator is equal to or higher than 3. Otherwise, a country is said to have “low stress.”
5. Low water access. For evaluating water access we use the latest WHO/UNICEF estimates. A country is considered to have “low water access” if less than 75 percent of the population has access to either safe drinking water or improved water sanitation. A country is said to have “high access” if the proportion is higher than or equal to 75 percent for both drinking water and sanitation.
6. High water supply. According to UN Water (the UN inter-agency coordination mechanism on all water-related issues), when annual per capita renewable freshwater availability is less than 1,700 cubic meters, countries begin to experience periodic or regular water stress.33 Thus, a country is defined to have “high water supply” if its per capita water supply exceeds the UN threshold for
31 http://www.fao.org/nr/aquastat. Water supply is “internal renewable water resources,” defined as long-term average annual flow of rivers and recharge of aquifers generated from endogenous precipitation. 32 http://www.wri.org/our-work/project/aqueduct 33 When renewable freshwater availability is below 1,000 cubic meters/person/year, water scarcity begins to hamper economic development and human health and well-being.
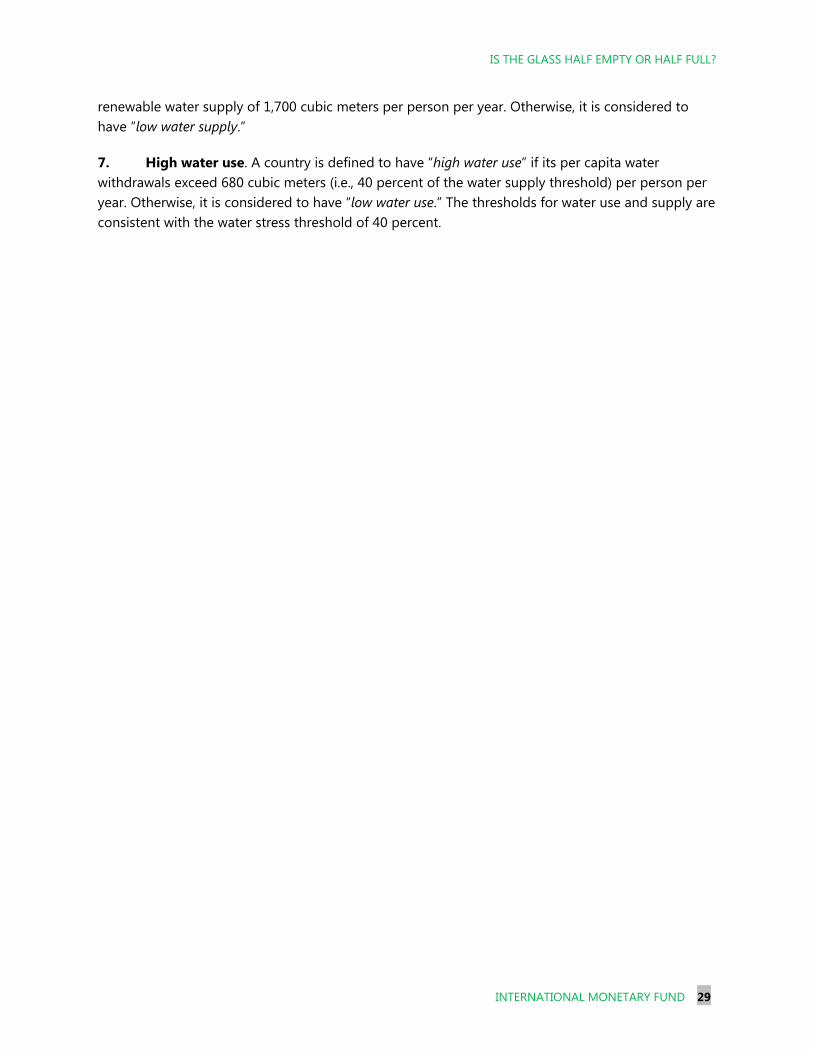
IS THE GLASS HALF EMPTY OR HALF FULL?
INTERNATIONAL MONETARY FUND 29
renewable water supply of 1,700 cubic meters per person per year. Otherwise, it is considered to have “low water supply.”
7. High water use. A country is defined to have “high water use” if its per capita water withdrawals exceed 680 cubic meters (i.e., 40 percent of the water supply threshold) per person per year. Otherwise, it is considered to have “low water use.” The thresholds for water use and supply are consistent with the water stress threshold of 40 percent.
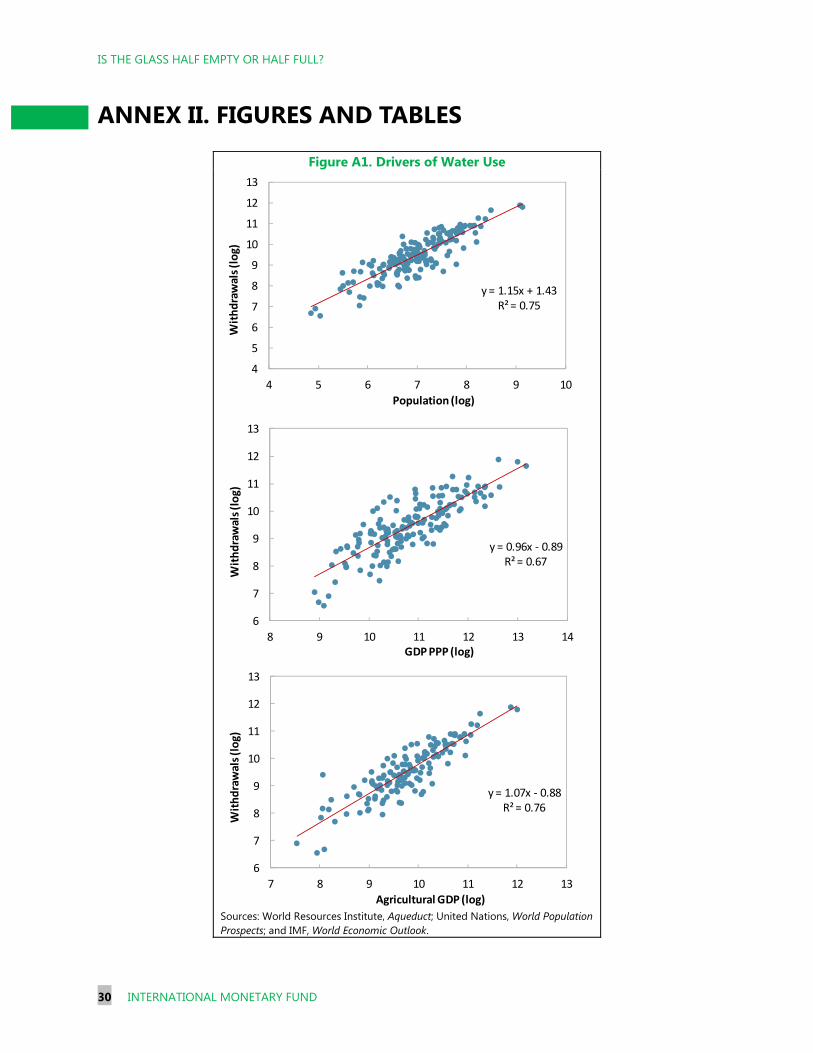
IS THE GLASS HALF EMPTY OR HALF FULL?
30 INTERNATIONAL MONETARY FUND
ANNEX II. FIGURES AND TABLES
Figure A1. Drivers of Water Use
Sources: World Resources Institute, Aqueduct; United Nations, World Population Prospects; and IMF, World Economic Outlook.
y = 1.15x + 1.43R² = 0.75
4
5
6
7
8
9
10
11
12
13
4 5 6 7 8 9 10
Wit
hd
raw
als
(lo
g)
Population (log)
y = 1.07x - 0.88R² = 0.76
6
7
8
9
10
11
12
13
7 8 9 10 11 12 13
Wit
hd
raw
als
(lo
g)
Agricultural GDP (log)
y = 0.96x - 0.89R² = 0.67
6
7
8
9
10
11
12
13
8 9 10 11 12 13 14
Wit
hd
raw
als
(lo
g)
GDP PPP (log)
IS THE GLASS HALF EMPTY OR HALF FULL?
INTERNATIONAL MONETARY FUND 31
Figure A2. Water Use per Unit of GDP and per Capita
Sources: World Resources Institute, Aqueduct; World Bank, World Development Indicators; and United Nations, World Population Prospects.
Figure A3. Water Use in Relation to Income and Other Factors
Sources: Shiklomanov (2000); U.S. Geological Survey (2011); World Resources Institute, Aqueduct; Haver Analytics; and United Nations, World Population Prospects.
y = -0.60x + 9.04R² = 0.34
0
1
2
3
4
5
6
7
8
6 8 10 12
Wit
hd
raw
als
per
un
it o
f GD
P (l
og
)
GDP PPP per capita (log)
y = 0.40x + 2.13R² = 0.19
2
3
4
5
6
7
8
9
6 7 8 9 10 11 12
Wit
hd
raw
als
per
cap
ita
(lo
g)
GDP PPP per capita (log)
0
200
400
600
800
1000
1200
1400
1900 1910 1920 1930 1940 1950 1960 1970 1980 1990 2000 2010
World Europe
North America Africa
Asia South America
Water Withdrawals by Region(Index, 1900=100)
0
100
200
300
400
500
600
700
1950 1955 1960 1965 1970 1975 1980 1985 1990 1995 2000 2005
Total freshwater withdrawalPopulationReal GDPIndustrial productionReal farm output
U.S. Water Usage and Underlying Determinants(index 1950=100)
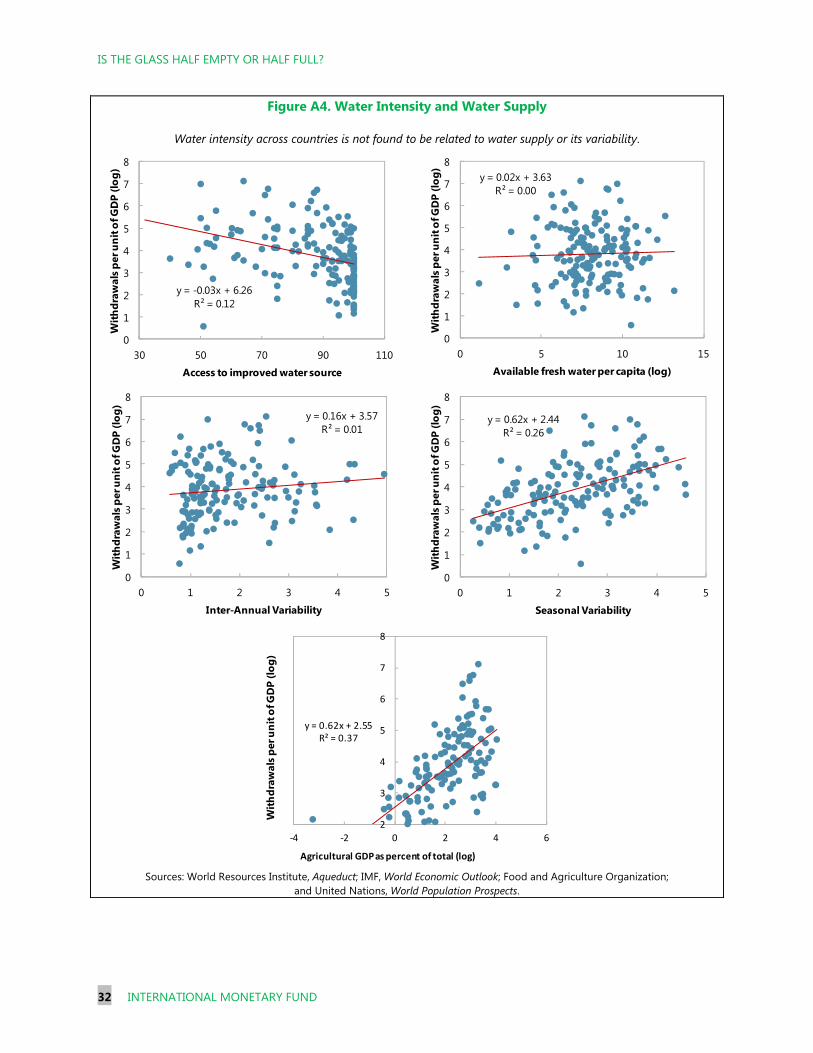
IS THE GLASS HALF EMPTY OR HALF FULL?
32 INTERNATIONAL MONETARY FUND
Figure A4. Water Intensity and Water Supply
Water intensity across countries is not found to be related to water supply or its variability.
Sources: World Resources Institute, Aqueduct; IMF, World Economic Outlook; Food and Agriculture Organization; and United Nations, World Population Prospects.
y = 0.16x + 3.57R² = 0.01
0
1
2
3
4
5
6
7
8
0 1 2 3 4 5
With
draw
als p
er u
nit o
f GD
P (lo
g)
Inter-Annual Variability
y = 0.62x + 2.44R² = 0.26
0
1
2
3
4
5
6
7
8
0 1 2 3 4 5
With
draw
als p
er u
nit o
f GD
P (lo
g)
Seasonal Variability
y = 0.02x + 3.63R² = 0.00
0
1
2
3
4
5
6
7
8
0 5 10 15
With
draw
als p
er u
nit o
f GD
P (lo
g)
Available fresh water per capita (log)
y = -0.03x + 6.26R² = 0.12
0
1
2
3
4
5
6
7
8
30 50 70 90 110
With
draw
als p
er u
nit o
f GD
P (lo
g)
Access to improved water source
y = 0.62x + 2.55R² = 0.37
2
3
4
5
6
7
8
-4 -2 0 2 4 6
Agricultural GDP as percent of total (log)
With
draw
alsp
er u
nit o
fGD
P (lo
g)
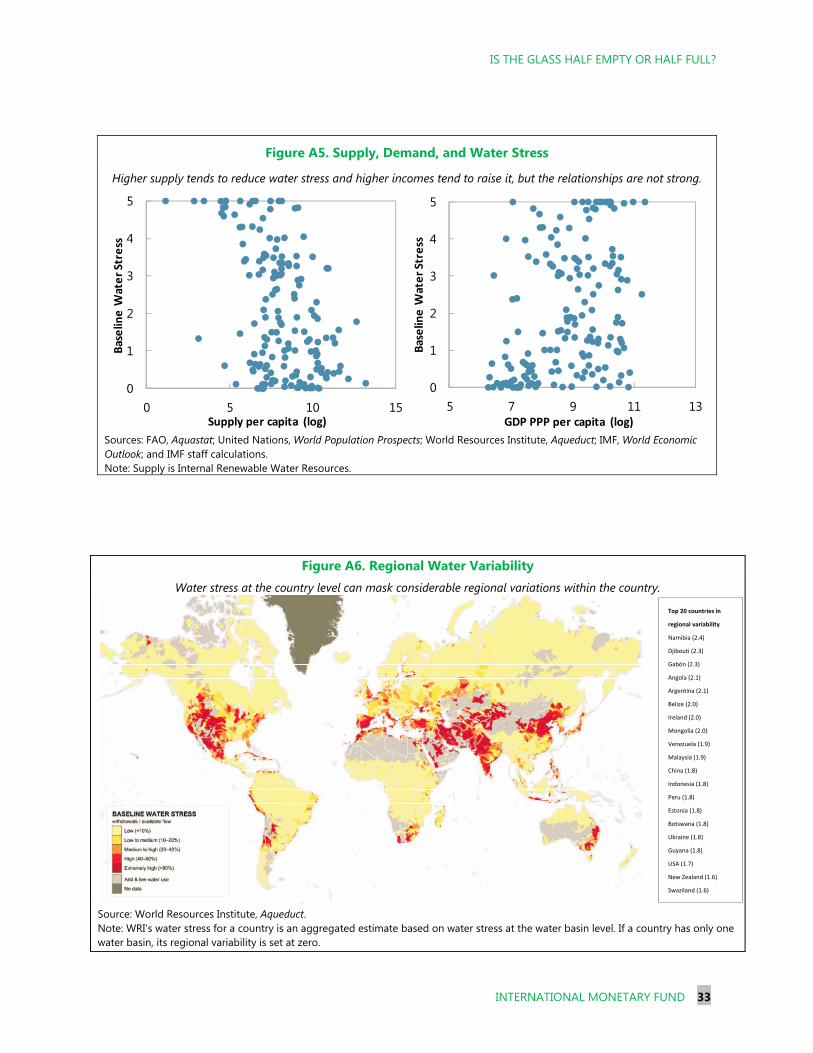
IS THE GLASS HALF EMPTY OR HALF FULL?
INTERNATIONAL MONETARY FUND 33
Figure A5. Supply, Demand, and Water Stress
Higher supply tends to reduce water stress and higher incomes tend to raise it, but the relationships are not strong.
Sources: FAO, Aquastat; United Nations, World Population Prospects; World Resources Institute, Aqueduct; IMF, World Economic Outlook; and IMF staff calculations. Note: Supply is Internal Renewable Water Resources.
Figure A6. Regional Water VariabilityWater stress at the country level can mask considerable regional variations within the country.
Source: World Resources Institute, Aqueduct. Note: WRI’s water stress for a country is an aggregated estimate based on water stress at the water basin level. If a country has only one water basin, its regional variability is set at zero.
0
1
2
3
4
5
0 5 10 15
Bas
elin
e W
ate
r St
ress
Supply per capita (log)
0
1
2
3
4
5
5 7 9 11 13B
ase
line
Wat
er
Stre
ssGDP PPP per capita (log)
Top 20 countries in
regional variability
Namibia (2.4)
Djibouti (2.3)
Gabón (2.3)
Angola (2.1)
Argentina (2.1)
Belize (2.0)
Ireland (2.0)
Mongolia (2.0)
Venezuela (1.9)
Malaysia (1.9)
China (1.8)
Indonesia (1.8)
Peru (1.8)
Estonia (1.8)
Botswana (1.8)
Ukraine (1.8)
Guyana (1.8)
USA (1.7)
New Zealand (1.6)
Swaziland (1.6)
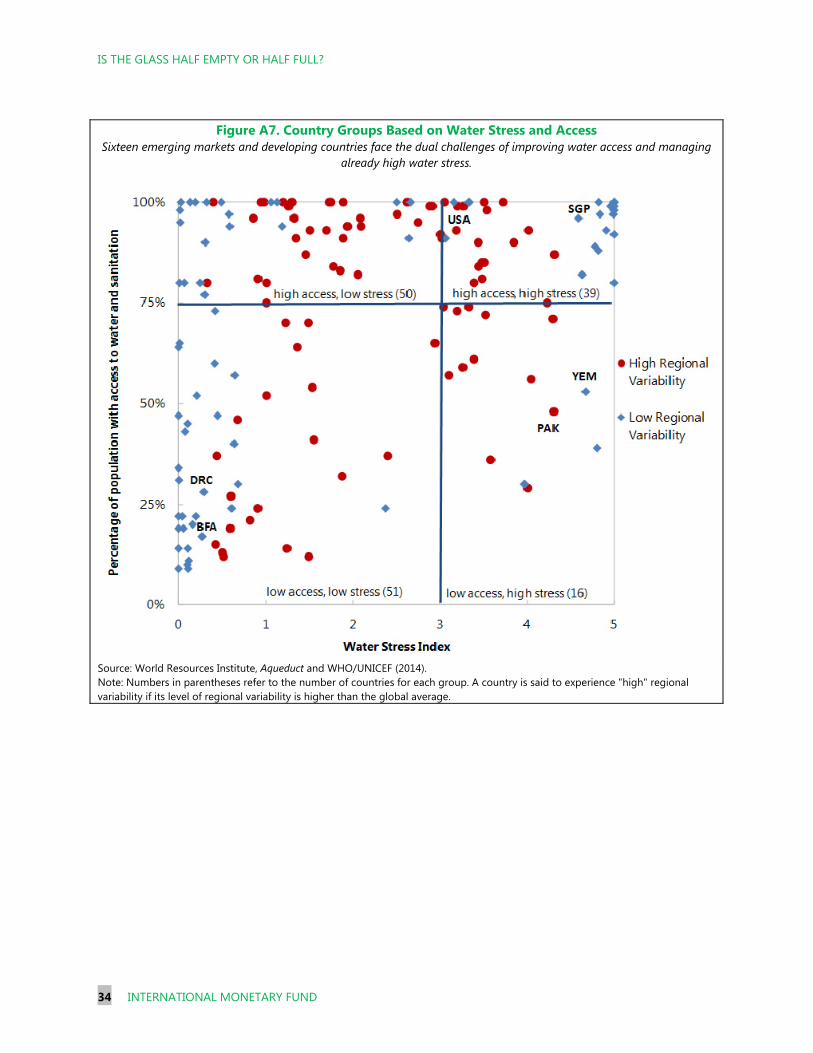
IS THE GLASS HALF EMPTY OR HALF FULL?
34 INTERNATIONAL MONETARY FUND
Figure A7. Country Groups Based on Water Stress and Access
Sixteen emerging markets and developing countries face the dual challenges of improving water access and managing already high water stress.
Source: World Resources Institute, Aqueduct and WHO/UNICEF (2014). Note: Numbers in parentheses refer to the number of countries for each group. A country is said to experience "high" regional variability if its level of regional variability is higher than the global average.
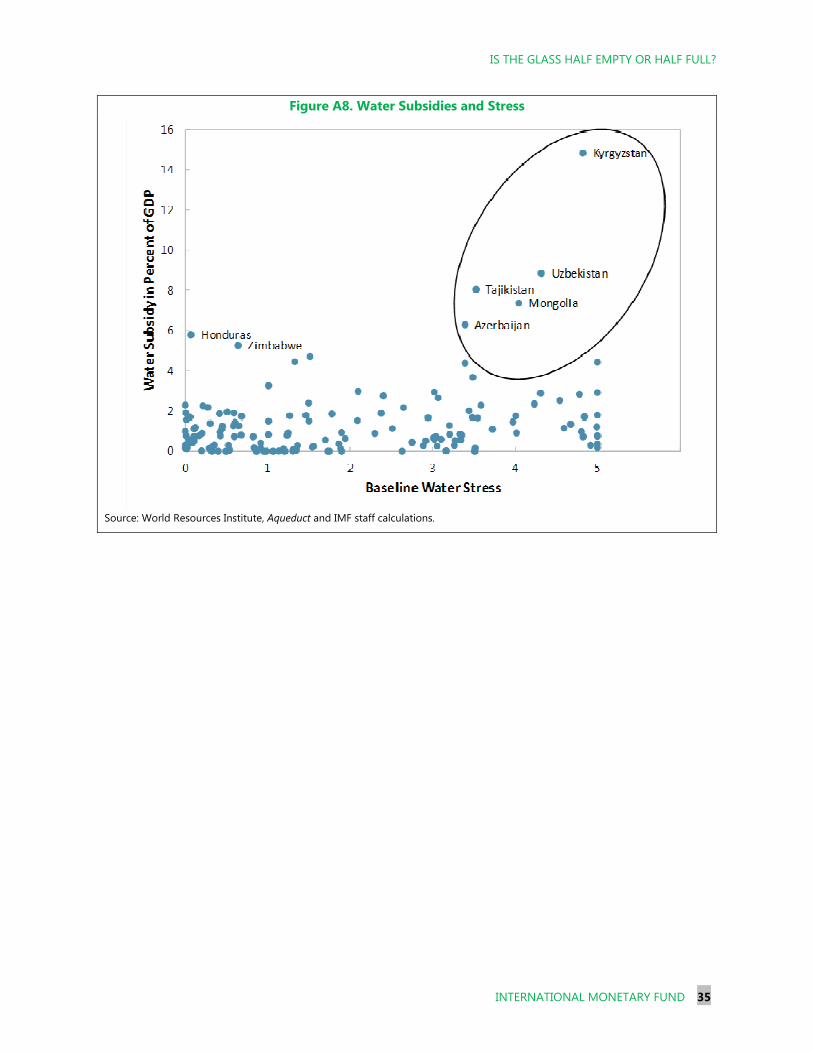
IS THE GLASS HALF EMPTY OR HALF FULL?
INTERNATIONAL MONETARY FUND 35
Figure A8. Water Subsidies and Stress
Source: World Resources Institute, Aqueduct and IMF staff calculations.
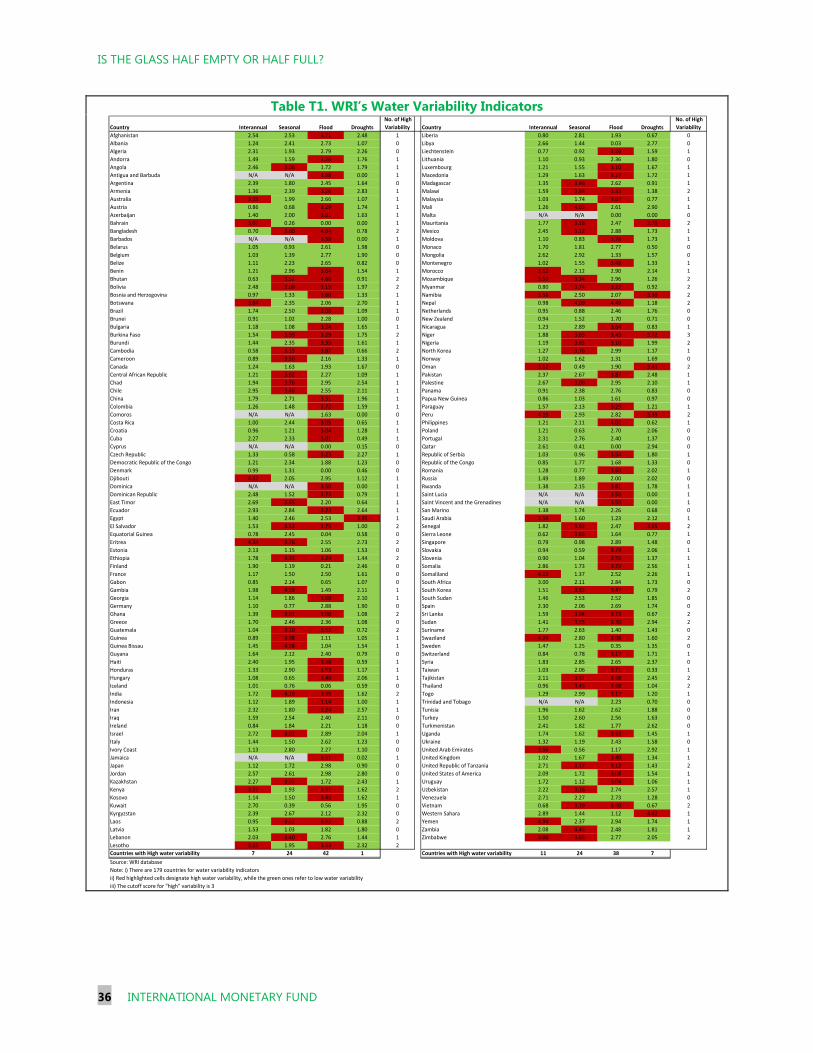
IS THE GLASS HALF EMPTY OR HALF FULL?
36 INTERNATIONAL MONETARY FUND
Table T1. WRI’s Water Variability Indicators
Country Interannual Seasonal Flood Droughts
No. of High
Variability Country Interannual Seasonal Flood Droughts
No. of High
Variability
Afghanistan 2.54 2.53 3.71 2.48 1 Liberia 0.80 2.81 1.93 0.67 0
Albania 1.24 2.41 2.73 1.07 0 Libya 2.66 1.44 0.03 2.77 0
Algeria 2.31 1.93 2.79 2.26 0 Liechtenstein 0.77 0.92 3.26 1.59 1
Andorra 1.49 1.59 3.26 1.76 1 Lithuania 1.10 0.93 2.36 1.80 0
Angola 2.46 3.06 1.72 1.79 1 Luxembourg 1.21 1.55 3.10 1.67 1
Antigua and Barbuda N/A N/A 3.58 0.00 1 Macedonia 1.29 1.63 3.27 1.72 1
Argentina 2.39 1.80 2.45 1.64 0 Madagascar 1.35 3.46 2.62 0.91 1
Armenia 1.36 2.39 3.26 2.83 1 Malawi 1.59 3.84 3.33 1.38 2
Australia 3.25 1.99 2.66 1.07 1 Malaysia 1.03 1.74 3.07 0.77 1
Austria 0.86 0.68 3.29 1.74 1 Mali 1.26 4.03 2.61 2.90 1
Azerbaijan 1.40 2.00 3.01 1.63 1 Malta N/A N/A 0.00 0.00 0
Bahrain 3.07 0.26 0.00 0.00 1 Mauritania 1.77 3.18 2.47 3.79 2
Bangladesh 0.70 3.60 4.94 0.78 2 Mexico 2.45 3.12 2.88 1.73 1
Barbados N/A N/A 3.58 0.00 1 Moldova 1.10 0.83 3.78 1.73 1
Belarus 1.05 0.93 2.61 1.98 0 Monaco 1.70 1.81 2.77 0.50 0
Belgium 1.03 1.39 2.77 1.90 0 Mongolia 2.62 2.92 1.33 1.57 0
Belize 1.11 2.23 2.65 0.82 0 Montenegro 1.02 1.55 3.49 1.33 1
Benin 1.21 2.96 3.64 1.54 1 Morocco 3.12 2.12 2.90 2.14 1
Bhutan 0.63 3.52 4.66 0.91 2 Mozambique 3.52 3.34 2.96 1.26 2
Bolivia 2.48 3.09 3.15 1.97 2 Myanmar 0.80 3.74 3.22 0.92 2
Bosnia and Herzegovina 0.97 1.33 3.60 1.33 1 Namibia 3.58 2.50 2.07 3.30 2
Botswana 3.84 2.35 2.06 2.70 1 Nepal 0.98 4.09 4.49 1.18 2
Brazil 1.74 2.50 3.08 1.09 1 Netherlands 0.95 0.88 2.46 1.76 0
Brunei 0.91 1.02 2.28 1.00 0 New Zealand 0.94 1.52 1.70 0.71 0
Bulgaria 1.18 1.08 3.24 1.65 1 Nicaragua 1.23 2.89 3.64 0.83 1
Burkina Faso 1.54 3.99 3.29 1.75 2 Niger 1.88 3.65 3.45 3.72 3
Burundi 1.44 2.35 3.35 1.61 1 Nigeria 1.19 3.63 3.10 1.99 2
Cambodia 0.58 3.15 3.87 0.66 2 North Korea 1.27 3.76 2.99 1.17 1
Cameroon 0.89 3.50 2.16 1.33 1 Norway 1.02 1.62 1.31 1.69 0
Canada 1.24 1.63 1.93 1.67 0 Oman 3.12 0.49 1.90 3.41 2
Central African Republic 1.21 3.62 2.27 1.09 1 Pakistan 2.37 2.67 3.87 2.48 1
Chad 1.94 3.76 2.95 2.54 1 Palestine 2.67 3.06 2.95 2.10 1
Chile 2.95 3.46 2.55 2.11 1 Panama 0.91 2.38 2.76 0.83 0
China 1.79 2.71 3.51 1.96 1 Papua New Guinea 0.86 1.03 1.61 0.97 0
Colombia 1.26 1.48 3.72 1.59 1 Paraguay 1.57 2.13 3.29 1.21 1
Comoros N/A N/A 1.63 0.00 0 Peru 4.19 2.93 2.82 3.39 2
Costa Rica 1.00 2.44 3.05 0.65 1 Philippines 1.21 2.11 4.02 0.62 1
Croatia 0.96 1.21 3.04 1.28 1 Poland 1.21 0.63 2.70 2.06 0
Cuba 2.27 2.33 3.01 0.49 1 Portugal 2.31 2.76 2.40 1.37 0
Cyprus N/A N/A 0.00 0.15 0 Qatar 2.61 0.41 0.00 2.94 0
Czech Republic 1.33 0.58 3.23 2.27 1 Republic of Serbia 1.03 0.96 3.54 1.80 1
Democratic Republic of the Congo 1.21 2.34 1.88 1.23 0 Republic of the Congo 0.85 1.77 1.68 1.33 0
Denmark 0.99 1.31 0.00 0.46 0 Romania 1.28 0.77 3.68 2.02 1
Djibouti 4.32 2.05 2.95 1.12 1 Russia 1.49 1.89 2.00 2.02 0
Dominica N/A N/A 3.58 0.00 1 Rwanda 1.38 2.15 3.61 1.78 1
Dominican Republic 2.48 1.52 3.73 0.79 1 Saint Lucia N/A N/A 3.58 0.00 1
East Timor 2.69 3.65 2.20 0.64 1 Saint Vincent and the Grenadines N/A N/A 3.58 0.00 1
Ecuador 2.93 2.84 3.23 2.64 1 San Marino 1.38 1.74 2.26 0.68 0
Egypt 1.40 2.46 2.53 3.35 1 Saudi Arabia 3.54 1.60 1.23 2.12 1
El Salvador 1.53 3.53 3.75 1.00 2 Senegal 1.82 3.92 2.47 3.65 2
Equatorial Guinea 0.78 2.45 0.04 0.58 0 Sierra Leone 0.62 3.65 1.64 0.77 1
Eritrea 4.34 3.76 2.55 2.73 2 Singapore 0.79 0.98 2.89 1.48 0
Estonia 2.13 1.15 1.06 1.53 0 Slovakia 0.94 0.59 3.79 2.06 1
Ethiopia 1.78 3.33 3.24 1.44 2 Slovenia 0.90 1.04 3.55 1.37 1
Finland 1.90 1.19 0.21 2.46 0 Somalia 2.86 1.73 3.79 2.56 1
France 1.17 1.50 2.50 1.61 0 Somaliland 4.13 1.37 2.52 2.26 1
Gabon 0.85 2.14 0.65 1.07 0 South Africa 3.00 2.11 2.84 1.73 0
Gambia 1.98 4.59 1.49 2.11 1 South Korea 1.51 3.32 3.47 0.79 2
Georgia 1.14 1.86 3.60 2.10 1 South Sudan 1.46 2.53 2.52 1.85 0
Germany 1.10 0.77 2.88 1.90 0 Spain 2.30 2.06 2.69 1.74 0
Ghana 1.39 3.01 3.00 1.08 2 Sri Lanka 1.59 3.04 3.73 0.67 2
Greece 1.70 2.46 2.36 1.08 0 Sudan 1.41 3.55 3.30 2.94 2
Guatemala 1.04 3.10 3.52 0.72 2 Suriname 1.77 2.63 1.40 1.43 0
Guinea 0.89 3.98 1.11 1.05 1 Swaziland 4.24 2.80 3.08 1.60 2
Guinea Bissau 1.45 4.58 1.04 1.54 1 Sweden 1.47 1.25 0.35 1.35 0
Guyana 1.64 2.12 2.40 0.79 0 Switzerland 0.84 0.78 3.17 1.71 1
Haiti 2.40 1.95 3.88 0.59 1 Syria 1.83 2.85 2.65 2.37 0
Honduras 1.33 2.90 3.63 1.17 1 Taiwan 1.03 2.06 3.71 0.33 1
Hungary 1.08 0.65 3.48 2.06 1 Tajikistan 2.11 3.61 3.68 2.45 2
Iceland 1.01 0.76 0.06 0.59 0 Thailand 0.96 3.45 3.68 1.04 2
India 1.72 4.19 3.85 1.62 2 Togo 1.29 2.99 3.12 1.20 1
Indonesia 1.12 1.89 3.14 1.00 1 Trinidad and Tobago N/A N/A 2.23 0.70 0
Iran 2.32 1.80 3.24 2.57 1 Tunisia 1.96 1.62 2.62 1.88 0
Iraq 1.59 2.54 2.40 2.11 0 Turkey 1.50 2.60 2.56 1.63 0
Ireland 0.84 1.84 2.21 1.18 0 Turkmenistan 2.41 1.82 1.77 2.62 0
Israel 2.72 3.02 2.89 2.04 1 Uganda 1.74 1.62 3.63 1.45 1
Italy 1.44 1.50 2.62 1.23 0 Ukraine 1.32 1.19 2.43 1.58 0
Ivory Coast 1.13 2.80 2.27 1.10 0 United Arab Emirates 3.56 0.56 1.17 2.92 1
Jamaica N/A N/A 3.51 0.02 1 United Kingdom 1.02 1.67 3.40 1.34 1
Japan 1.12 1.72 2.98 0.90 0 United Republic of Tanzania 2.71 3.17 3.12 1.43 2
Jordan 2.57 2.61 2.98 2.80 0 United States of America 2.09 1.72 3.08 1.54 1
Kazakhstan 2.27 3.05 1.72 2.43 1 Uruguay 1.72 1.12 3.04 1.06 1
Kenya 3.21 1.93 3.81 1.62 2 Uzbekistan 2.22 3.16 2.74 2.57 1
Kosovo 1.14 1.50 3.45 1.62 1 Venezuela 2.71 2.27 2.73 1.28 0
Kuwait 2.70 0.39 0.56 1.95 0 Vietnam 0.68 3.19 3.80 0.67 2
Kyrgyzstan 2.39 2.67 2.12 2.32 0 Western Sahara 2.89 1.44 1.12 4.42 1
Laos 0.95 3.62 3.92 0.88 2 Yemen 4.94 2.37 2.94 1.74 1
Latvia 1.53 1.03 1.82 1.80 0 Zambia 2.08 4.45 2.48 1.81 1
Lebanon 2.03 3.40 2.76 1.44 1 Zimbabwe 3.06 3.65 2.77 2.05 2
Lesotho 3.15 1.95 3.33 2.32 2
Countries with High water variability 7 24 42 1 Countries with High water variability 11 24 38 7
Source: WRI database
Note: i) There are 179 countries for water variability indicators
ii) Red highlighted cells designate high water variability, while the green ones refer to low water variability
iii) The cutoff score for "high" variability is 3
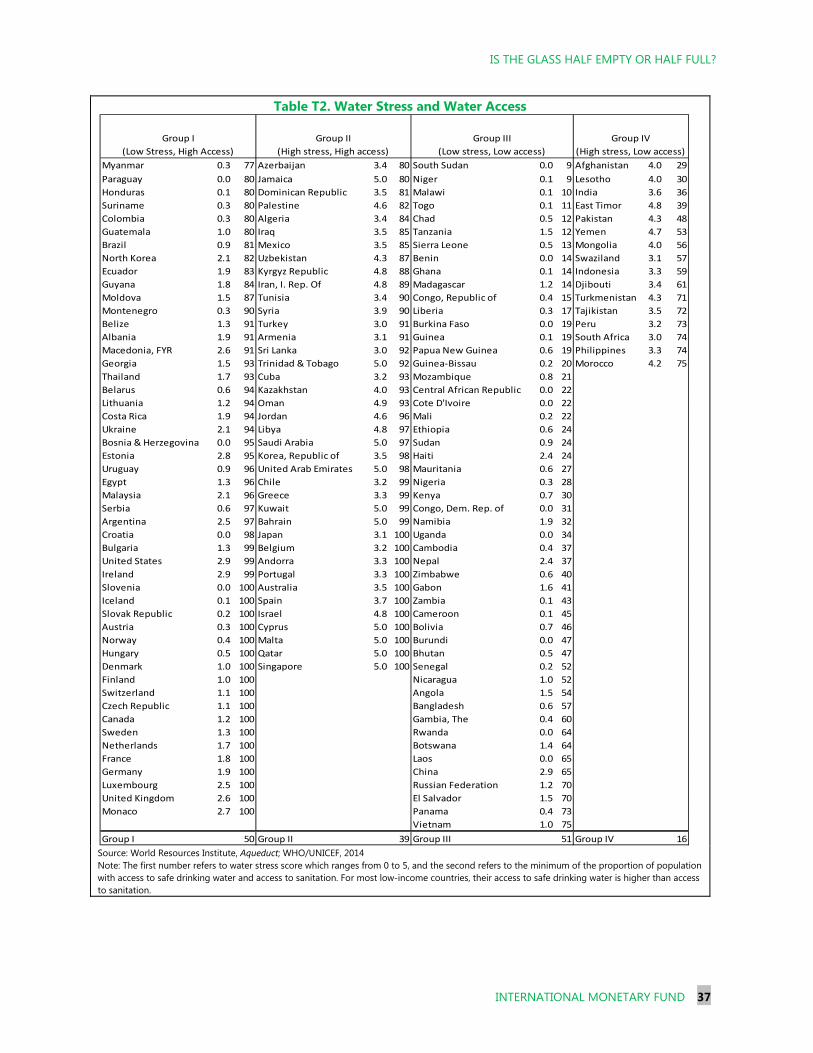
IS THE GLASS HALF EMPTY OR HALF FULL?
INTERNATIONAL MONETARY FUND 37
Table T2. Water Stress and Water Access
Source: World Resources Institute, Aqueduct; WHO/UNICEF, 2014 Note: The first number refers to water stress score which ranges from 0 to 5, and the second refers to the minimum of the proportion of population with access to safe drinking water and access to sanitation. For most low-income countries, their access to safe drinking water is higher than access to sanitation.
Myanmar 0.3 77 Azerbaijan 3.4 80 South Sudan 0.0 9 Afghanistan 4.0 29
Paraguay 0.0 80 Jamaica 5.0 80 Niger 0.1 9 Lesotho 4.0 30
Honduras 0.1 80 Dominican Republic 3.5 81 Malawi 0.1 10 India 3.6 36
Suriname 0.3 80 Palestine 4.6 82 Togo 0.1 11 East Timor 4.8 39
Colombia 0.3 80 Algeria 3.4 84 Chad 0.5 12 Pakistan 4.3 48
Guatemala 1.0 80 Iraq 3.5 85 Tanzania 1.5 12 Yemen 4.7 53
Brazil 0.9 81 Mexico 3.5 85 Sierra Leone 0.5 13 Mongolia 4.0 56
North Korea 2.1 82 Uzbekistan 4.3 87 Benin 0.0 14 Swaziland 3.1 57
Ecuador 1.9 83 Kyrgyz Republic 4.8 88 Ghana 0.1 14 Indonesia 3.3 59
Guyana 1.8 84 Iran, I. Rep. Of 4.8 89 Madagascar 1.2 14 Djibouti 3.4 61
Moldova 1.5 87 Tunisia 3.4 90 Congo, Republic of 0.4 15 Turkmenistan 4.3 71
Montenegro 0.3 90 Syria 3.9 90 Liberia 0.3 17 Tajikistan 3.5 72
Belize 1.3 91 Turkey 3.0 91 Burkina Faso 0.0 19 Peru 3.2 73
Albania 1.9 91 Armenia 3.1 91 Guinea 0.1 19 South Africa 3.0 74
Macedonia, FYR 2.6 91 Sri Lanka 3.0 92 Papua New Guinea 0.6 19 Philippines 3.3 74
Georgia 1.5 93 Trinidad & Tobago 5.0 92 Guinea-Bissau 0.2 20 Morocco 4.2 75
Thailand 1.7 93 Cuba 3.2 93 Mozambique 0.8 21
Belarus 0.6 94 Kazakhstan 4.0 93 Central African Republic 0.0 22
Lithuania 1.2 94 Oman 4.9 93 Cote D'Ivoire 0.0 22
Costa Rica 1.9 94 Jordan 4.6 96 Mali 0.2 22
Ukraine 2.1 94 Libya 4.8 97 Ethiopia 0.6 24
Bosnia & Herzegovina 0.0 95 Saudi Arabia 5.0 97 Sudan 0.9 24
Estonia 2.8 95 Korea, Republic of 3.5 98 Haiti 2.4 24
Uruguay 0.9 96 United Arab Emirates 5.0 98 Mauritania 0.6 27
Egypt 1.3 96 Chile 3.2 99 Nigeria 0.3 28
Malaysia 2.1 96 Greece 3.3 99 Kenya 0.7 30
Serbia 0.6 97 Kuwait 5.0 99 Congo, Dem. Rep. of 0.0 31
Argentina 2.5 97 Bahrain 5.0 99 Namibia 1.9 32
Croatia 0.0 98 Japan 3.1 100 Uganda 0.0 34
Bulgaria 1.3 99 Belgium 3.2 100 Cambodia 0.4 37
United States 2.9 99 Andorra 3.3 100 Nepal 2.4 37
Ireland 2.9 99 Portugal 3.3 100 Zimbabwe 0.6 40
Slovenia 0.0 100 Australia 3.5 100 Gabon 1.6 41
Iceland 0.1 100 Spain 3.7 100 Zambia 0.1 43
Slovak Republic 0.2 100 Israel 4.8 100 Cameroon 0.1 45
Austria 0.3 100 Cyprus 5.0 100 Bolivia 0.7 46
Norway 0.4 100 Malta 5.0 100 Burundi 0.0 47
Hungary 0.5 100 Qatar 5.0 100 Bhutan 0.5 47
Denmark 1.0 100 Singapore 5.0 100 Senegal 0.2 52
Finland 1.0 100 Nicaragua 1.0 52
Switzerland 1.1 100 Angola 1.5 54
Czech Republic 1.1 100 Bangladesh 0.6 57
Canada 1.2 100 Gambia, The 0.4 60
Sweden 1.3 100 Rwanda 0.0 64
Netherlands 1.7 100 Botswana 1.4 64
France 1.8 100 Laos 0.0 65
Germany 1.9 100 China 2.9 65
Luxembourg 2.5 100 Russian Federation 1.2 70
United Kingdom 2.6 100 El Salvador 1.5 70
Monaco 2.7 100 Panama 0.4 73
Vietnam 1.0 75
Group I 50 Group II 39 Group III 51 Group IV 16
Group I
(Low Stress, High Access)
Group II
(High stress, High access)
Group III
(Low stress, Low access)
Group IV
(High stress, Low access)
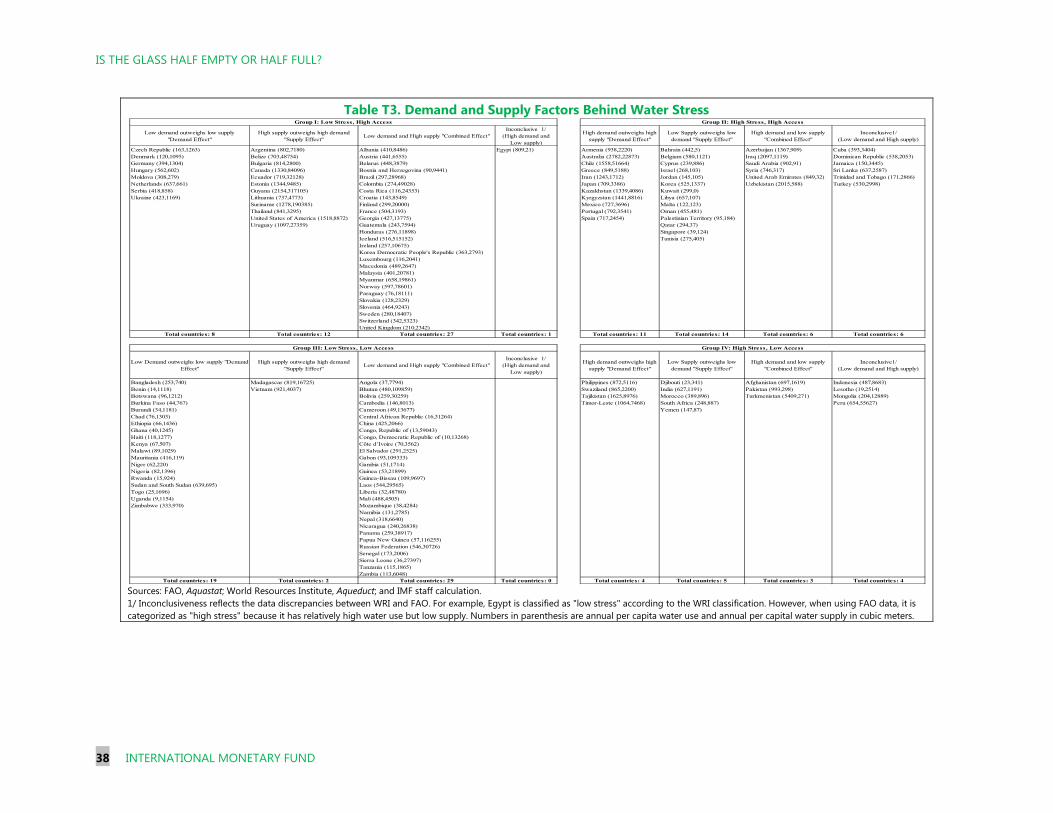
IS THE GLASS HALF EMPTY OR HALF FULL?
38 INTERNATIONAL MONETARY FUND
Table T3. Demand and Supply Factors Behind Water Stress
Sources: FAO, Aquastat; World Resources Institute, Aqueduct; and IMF staff calculation. 1/ Inconclusiveness reflects the data discrepancies between WRI and FAO. For example, Egypt is classified as "low stress" according to the WRI classification. However, when using FAO data, it is categorized as "high stress" because it has relatively high water use but low supply. Numbers in parenthesis are annual per capita water use and annual per capital water supply in cubic meters.
Low demand outweighs low supply "Demand Effect"
High supply outweighs high demand "Supply Effect"
Low demand and High supply "Combined Effect"Inconclusive 1/
(High demand and Low supply)
High demand outweighs high supply "Demand Effect"
Low Supply outweighs low demand "Supply Effect"
High demand and low supply "Combined Effect"
Inconclusive1/ (Low demand and High supply)
Czech Republic (163,1263) Argentina (802,7180) Albania (410,8486) Egypt (809,21) Armenia (938,2220) Bahrain (442,5) Azerbaijan (1367,909) Cuba (393,3404)Denmark (120,1095) Belize (703,48754) Austria (441,6555) Australia (2782,22873) Belgium (580,1121) Iraq (2097,1119) Dominican Republic (538,2053)Germany (394,1304) Bulgaria (814,2800) Belarus (448,3879) Chile (1558,51664) Cyprus (239,886) Saudi Arabia (902,91) Jamaica (150,3445)Hungary (562,602) Canada (1330,84096) Bosnia and Herzegovina (90,9441) Greece (849,5188) Israel (268,103) Syria (746,317) Sri Lanka (637,2587)Moldova (308,279) Ecuador (719,32128) Brazil (297,28968) Iran (1243,1712) Jordan (145,105) United Arab Emirates (849,32) Trinidad and Tobago (171,2866)Netherlands (637,661) Estonia (1344,9485) Colombia (274,49028) Japan (709,3386) Korea (525,1337) Uzbekistan (2015,588) Turkey (530,2998)Serbia (418,858) Guyana (2154,317105) Costa Rica (116,24353) Kazakhstan (1339,4086) Kuwait (299,0)Ukraine (423,1169) Lithuania (737,4773) Croatia (143,8549) Kyrgyzstan (1441,8816) Libya (657,107)
Suriname (1278,190385) Finland (299,20000) Mexico (727,3696) Malta (122,123)Thailand (841,3295) France (504,3193) Portugal (792,3541) Oman (455,481)United States of America (1518,8872) Georgia (427,13775) Spain (717,2454) Palestinian Territory (95,184)Uruguay (1097,27359) Guatemala (243,7594) Qatar (294,37)
Honduras (276,11898) Singapore (39,124)Iceland (516,515152) Tunisia (275,405)Ireland (257,10675)Korea Democratic People's Republic (363,2793)Luxembourg (116,2041)Macedonia (489,2647)Malaysia (401,20781)Myanmar (658,19861)Norway (597,78601)Paraguay (76,18111)Slovakia (128,2329)Slovenia (464,9243)Sweden (280,18407)Switzerland (342,5323)United Kingdom (210,2342)
Total countries: 8 Total countries: 12 Total countries: 27 Total countries: 1 Total countries: 11 Total countries: 14 Total countries: 6 Total countries: 6
Low Demand outweighs low supply "Demand Effect"
High supply outweighs high demand "Supply Effect"
Low demand and High supply "Combined Effect"Inconclusive 1/
(High demand and Low supply)
High demand outweighs high supply "Demand Effect"
Low Supply outweighs low demand "Supply Effect"
High demand and low supply "Combined Effect"
Inconclusive1/ (Low demand and High supply)
Bangladesh (253,740) Madagascar (819,16725) Angola (37,7794) Philippines (872,5116) Djibouti (23,341) Afghanistan (697,1619) Indonesia (487,8683)Benin (14,1118) Vietnam (921,4037) Bhutan (480,109859) Swaziland (865,2200) India (627,1191) Pakistan (993,298) Lesotho (19,2514)Botswana (96,1212) Bolivia (259,30259) Tajikistan (1625,8976) Morocco (389,896) Turkmenistan (5409,271) Mongolia (204,12889)Burkina Faso (44,767) Cambodia (146,8013) Timor-Leste (1064,7468) South Africa (248,887) Peru (654,55627)Burundi (34,1181) Cameroon (49,13677) Yemen (147,87)Chad (76,1303) Central African Republic (16,31264)Ethiopia (66,1436) China (425,2066)Ghana (40,1245) Congo, Republic of (13,59043)Haiti (118,1277) Congo, Democratic Republic of (10,13268)Kenya (67,507) Côte d’Ivoire (70,3562)Malawi (89,1029) El Salvador (291,2525)Mauritania (416,119) Gabon (93,109333)Niger (62,220) Gambia (51,1714)Nigeria (82,1396) Guinea (53,21899)Rwanda (15,924) Guinea-Bissau (109,9697)Sudan and South Sudan (639,695) Laos (544,29565)Togo (25,1696) Liberia (32,48780)Uganda (9,1154) Mali (488,4505)Zimbabwe (333,970) Mozambique (38,4284)
Namibia (131,2785)Nepal (318,6640)Nicaragua (240,26838)Panama (259,38917)Papua New Guinea (57,116255)Russian Federation (546,30726)Senegal (173,2006)Sierra Leone (36,27397)Tanzania (115,1865)Zambia (113,6048)
Total countries: 19 Total countries: 2 Total countries: 29 Total countries: 0 Total countries: 4 Total countries: 5 Total countries: 3 Total countries: 4
Group I: Low Stress, High Access Group II: High Stress, High Access
Group III: Low Stress, Low Access Group IV: High Stress, Low Access
IS THE GLASS HALF EMPTY OR HALF FULL?
INTERNATIONAL MONETARY FUND 39
ANNEX III. METHODOLOGY FOR ESTIMATING WATER SUBSIDIES 1. The methodology used here is broadly similar to the price gap calculation the IMF has used to estimate energy subsidies.34
2. Subsidies. Cost-recovery pricing of water requires that the revenues a utility company receives from consumers cover the costs of operations, maintenance, and capital spending necessary to maintain efficient operations. If revenues are lower than this cost, then utilities make an explicit loss on operations, or they do not maintain their existing capital stock, leading to inefficient operations in the future. In order for the utilities to stay in operation then, they must receive support from the government to make up for this difference between the costs and the actual revenues. This is what is called a subsidy in this paper. Subsidies are calculated as:
(1)
This can also be expressed using a per-unit calculation which is then scaled up with national water supply:
(1b) ∗ ∗ This calculation is done for both drinking water and wastewater supplied by utilities.
3. Costs. Since data on actual costs for utilities are not widely available, they are estimated using a reference cost-recovery price, and scaled up by the level of utility water supplies for the country.
(2) ∗
This price is taken from work done by the Global Water Intelligence in 2004 (GWI 2004). According to the GWI $1 US was the price per m3 in 2004 necessary to recover the costs of operations, maintenance and capital in most high-income cities. This cost is assumed to be the same for drinking water and wastewater. Costs in developing countries would be lower due to lower costs of labor. In order to produce a reference price for this paper, the price used in the GWI’s report is adjusted to account for three factors: (i) general price inflation that occurred between 2004 and 2012; (ii) lower labor costs in developing countries; and (iii) varying levels of water scarcity:
(3) $1 ∗ ∗ ∗
34 See Clements and others (2013).
IS THE GLASS HALF EMPTY OR HALF FULL?
40 INTERNATIONAL MONETARY FUND
The inflation adjustment for all countries was calculated as the ratio of GDP deflator in the USA in 2012 to GDP deflator in the USA in 2004. This raised the reference price about 18 percent to $1.18.
The adjustment for labor costs was applied only to the portion of costs that labor accounts for. According to the 2014 GWI Water Market report (GWI 2014), labor costs accounted for about 24 percent of water operating costs. We also assume a similar ratio for non-operating labor costs. Thus, 24 percent of the reference price is adjusted for differences in the level of wages. Data on wages are taken from the ILO’s Key Indicators of the Labor Market database, and are converted into US dollars using market annual-average exchange rates from the WEO database.
The water scarcity adjustment takes into account that the economic value and reference price for water should be higher where water is scarce. To undertake this adjustment, we use estimates of water scarcity published by Gassert and others (2013) of the World Resources Institute (WRI), which assigns a score to each country based on the level of current water extraction and remaining water supply. High stress countries have higher scores, since they extract or consume more water than required to maintain supplies stable over time. The WRI study considers scores below two to be low to medium levels of stress. In this light, the stress adjustment is calculated as the ratio of the country’s stress score to two. The cost recover price is then scaled up by this factor.
As an example, using equation (3) and these adjustments, the reference price for a developing economy with a high stress score of 5, can be calculated as:
(4) $1.18 ∗ ∗ 0.8 ∗ 0.24 0.76 $2.81
4. Revenues. Data on utility revenues are also estimated for this paper. While the GWI did estimate total national utility revenues in 2008 (GWI 2008), this calculation has not been updated since then by the GWI or other organizations. However, data on utility drinking water and wastewater tariffs in 2012 are available for a large sample of over 80 countries in 2012 from the GWI. Using this and data on water supply, a series can be constructed to estimate utility revenues at a national level according to the following equation:
(5) ∗ ∗ 100%
where non-revenue water represents the share of water on which utilities do not receive revenue, either because of distribution losses, theft, or inadequate collection of revenue. These data are taken from GWI (2014).
In practice, tariffs are frequently differentiated according to household consumption level, through block tariffing. However, since consumption data is not available at a household level, an average tariff is used. This tariff is taken as the average cost for a household consuming 15 m3 per month. Data on tariffs are taken at a utility level from GWI (2014), and correspond to 2012. A national tariff is calculated as the population-weighted average of these observations using UN urban population data.
IS THE GLASS HALF EMPTY OR HALF FULL?
INTERNATIONAL MONETARY FUND 41
Since some countries have data on total national revenues in 2007 reported in the GWI 2008 report, but do not have data on prices in 2012, we perform the subsidy calculation using 2007 data, and assume that subsidies represent the same share of nominal GDP in 2012. For costs we calculate the reference price using the GDP deflator in 2007 rather than 2012 for the adjustment.
5. Water supply. For the purpose of these calculations, water supply data are taken from the GWI 2008 report, the last year that it is available. It is then scaled up to 2012 by assuming a growth rate equal to that of real GDP.
IS THE GLASS HALF EMPTY OR HALF FULL?
42 INTERNATIONAL MONETARY FUND
References
2030 Water Resources Group. 2009. “Charting Our Water Future: Economic Frameworks to Inform Decision-Making.” McKinsey & Company.
Ahluwalia, I. J. 2014. Transforming Our Cities: Postcards of Change. HarperCollins Publishers India.
Alcamo, J., M. Flörke, and M. Märker. 2007. “Future Long-Term Changes in Global Water Resources Driven by Socio-Economic and Climatic Changes.” Hydrological Sciences Journal 52: 247–75.
Bjornlund, H., and J. McKay. 2002. “Aspects of Water Markets for Developing Countries: Experiences from Australia, Chile, and the US.” Environment and Development Economics 7: 769–95.
Brewer, J., R. Glennon, A. K., and G. D. Libecap. 2008. “Water Markets in the West: Prices, Trading, and Contractual Forms.” Economic Inquiry 46: 91–112.
Cole, M. 2004. “Economic Growth and Water Use.” Applied Economics Letters 11: 1–4.
Duarte, R., V. Pinilla, and A. Serrano. 2014. “Looking Backward to Look Forward: Water Use and Economic Growth from a Long-Term Perspective.” Applied Economics, 46 (2)
Ercin, A., and A. Hoekstra. 2014. “Water Footprint Scenarios for 2050: A Global Analysis.” Environment International 64: 71–82.
Flörke, M., E. Kynast, I. Bärlund, S. Eisner, F. Wimmer, and J. Alcamo. 2013. “Domestic and Industrial Water Uses of the Past 60 Years as a Mirror of Socio-Economic Development: A Global Simulation Study.” Global Environmental Change 23: 144–56.
Gassert, F., M. Landis, M. Luck, P. Reig, and T. Shiao. 2013. “Aqueduct Global Maps 2.0.” Working Paper, World Resources Institute, Washington.
Global Water Intelligence. 2004. “Tariffs: Half Way There.” Oxford, United Kingdom.
Guha, S. 2007. “Valuation of Clean Water Supply by Willingness-to-Pay Method in a Developing Nation: A Case Study in Calcutta, India.” Journal of Young Investigators.
Gurría, A. 2014. “Financing Infrastructure for a Water Secure World.” Remarks at the High-Level Panel on Infrastructure Financing for a Water Secure World, 26 November 2014, Paris, France http://www.oecd.org/environment/financing-infrastructure-for-a-water-secure-world.htm
Halpern, J., I. Walker, F. Ordoñez, and P. Serrano . 2000. ”Pricing, Subsidies and the Poor: Demand for Improved Water Services in Central America.” Working Paper No. 2468, World Bank, Washington.
IS THE GLASS HALF EMPTY OR HALF FULL?
INTERNATIONAL MONETARY FUND 43
Hanasaki, N., S. Fujimori, T. Yamamoto, S. Yoshikawa, Y. Masaki, Y. Hijioka, M. Kainuma, Y. Kanamori, T. Masui, K. Takahashi, and S. Kanae. 2013a. “A Global Water Scarcity Assessment under Shared Socio-Economic Pathways—Part 1: Water Use.” Hydrology and Earth System Sciences 17: 2375–91.
———. 2013b. “A Global Water Scarcity Assessment under Shared Socio-Economic Pathways—Part 2: Water Availability and Scarcity.” Hydrology and Earth System Sciences 17: 2393–2413.
Hejazi, M., J. Edmonds, V. Chaturvedi, E. Davies, and J. Eom. 2013. “Scenarios of Global Municipal Water-Use Demand Projections over the 21st Century.” Hydrological Sciences Journal 58: 519–38.
Hoekstra, A.M., and A. Chapagain. 2007. “Water Footprints of Nations: Water Use by People as a Function of Their Consumption Pattern.” Water Resources Management 21: 35–48.
Kearney, M., B. Harris, B. Hershbein, E. Jacome, and G. Nantz. 2014. “In Times of Drought: Nine Economic Facts about Water in the United States.” Policy Memo, The Hamilton Project, Washington.
Kingdom, B., R. Liemberger, and P. Marin. 2006. “The Challenge of Reducing Non-Revenue Water (NRW) in Developing Countries.” Water Supply and Sanitation Sector Board Discussion Paper 8, World Bank, Washington.
Komives, K., V. Foster, J. Halpern, and Q. Wodon, 2005. “Water, Electricity, and the Poor: Who Benefits from Utility Subsidies?” World Bank, Washington.
Liu, J., T. Hertel, F. Taheripour, T. Zhu, and C. Ringler. 2014. “International Trade Buffers the Impact of Future Irrigation Shortfalls.” Global Environmental Change 29: 22–31.
Maddison, A. 2010. “Historical Statistics of the World Economy: 1-2008 AD.” http://www.ggdc.net/maddison/oriindex.htm
Organisation for European Co-operation and Development (OECD). 2006. “Subsidy Reform and Sustainable Development: Economic Environmental and Social Aspects.” OECD Publishing.
———. 2010. “Pricing Water Resources and Water and Sanitation Services.” OECD Publishing.
———. 2010. “Sustainable Management of Water Resources in Agriculture.” OECD Publishing.
Olmsted, S. 2010. “The Economics of Managing Scarce Water Resources.” Review of Environmental Economics and Policy 4(2): 179–98.
Olmstead, S. M. 2010. “The Economics of Managing Scarce Water Resources.” Review of Environmental Economics and Policy 4(2, Summer): 179–98.
IS THE GLASS HALF EMPTY OR HALF FULL?
44 INTERNATIONAL MONETARY FUND
Reddy, V.R. 2005. “Costs of Resource Depletion Externalities: A Study of Groundwater Overexploitation in Andhra Pradesh, India.” Environment and Development Economics 10: 533–56.
Schlosser, C., K. Strzepek, X. Gao, C. Fant, E. Blanc, S. Paltsev, H. Jacoby, J. Reilly, and A. Gueneau. 2014. “The Future of Global Water Stress: An integrated Assessment.” Earth’s Future 2: 341–61.
Shiklomanov, I. 2000. “Appraisal and Assessment of World Water Resources.” Water International 25: 11–32.
The Water Project. 2014. “Water Scarcity & the Importance of Water.” http://thewaterproject.org/water_scarcity
Tietenberg, T., and L. Lewis. 2014. Environmental and Natural Resource Economics. Boston, Massachusetts: Pearson Addison Wesley.
UN-Water. 2006. “Coping with Water Scarcity: A Strategic Issue and Priority for System-Wide Action.” Geneva, Switzerland.
Vasquez, W. F., P. Mozumder, J. Hernandez-Arce, and R. P. Berrens. 2009. ”Willingness to Pay for Safe Drinking Water: Evidence from Parral, Mexico.” Journal of Environmental Management 90(11): 3391-3400.
Wada, Y., L. P. H. van Beek, C. M. van Kempen, J. W. T. M. Reckman, S. Vasak, and M. F. P. Bierkens,. 2010. “Global Depletion of Groundwater Resources.” Geophysical Research Letters 37 (20, October).
World Bank. 2007a. Mozambique Country Water Resources Assistance Strategy: Making Water Work for Sustainable Growth and Poverty Reduction. Strategy Paper, Washington.
———. 2007b. Making the Most of Scarcity. Accountability for Better Water Management Results in the Middle East and North Africa. MENA Development Report, Washington.
World Economic Forum. 2015. Global Risk Report. Geneva, Switzerland.
World Health Organization (WHO). 2010. “Constraints to Scaling up the Health Millennium Development Goals: Costing and Financial Gap Analysis.” WHO Press, Geneva, Switzerland.
WHO and UNICEF. 2014. Progress on Drinking Water and Sanitation: 2014 Update WHO Press, Geneva, Switzerland.