Embed Size (px)
Citation preview

1
2004 Half Year Results Wednesday, 26 May 2004
2004 Half Year Results Wednesday, 26 May 2004
2
Andrew Lindberg
Managing Director, AWB Limited
3
Content
• Result highlights
• Financial performance (CFO)
• Business operations
• Landmark integration
• Strategy
• Outlook
4
• Net profit after tax of $54.1 million, up 81%
• Total operating revenue of $2.9 billion, up 186%
• Earnings per share of 16.3 cents, up 49%
• Interim dividend of 14 cents per share
• Australian wheat production rebounded to 25.2 million tonnes
• Loan book peaked at $1.6 billion in February 2004
• Gross Pool Value currently estimated at $4.7 billion, ($1.3 billion in 2002-03)
Result highlights
5
Paul Ingleby
Chief Financial Officer
6
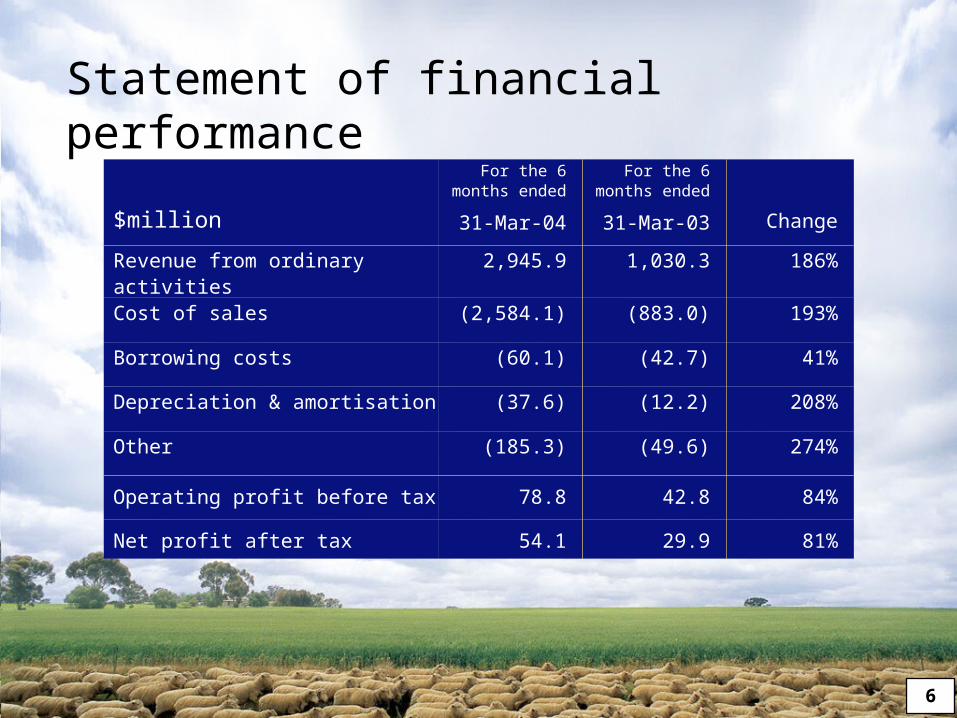
$million
For the 6 months ended
31-Mar-04
For the 6 months ended
31-Mar-03 Change
Revenue from ordinary activities 2,945.9 1,030.3 186%
Cost of sales (2,584.1) (883.0) 193%
Borrowing costs (60.1) (42.7) 41%
Depreciation & amortisation (37.6) (12.2) 208%
Other (185.3) (49.6) 274%
Operating profit before tax 78.8 42.8 84%
Net profit after tax 54.1 29.9 81%
Statement of financial performance
7
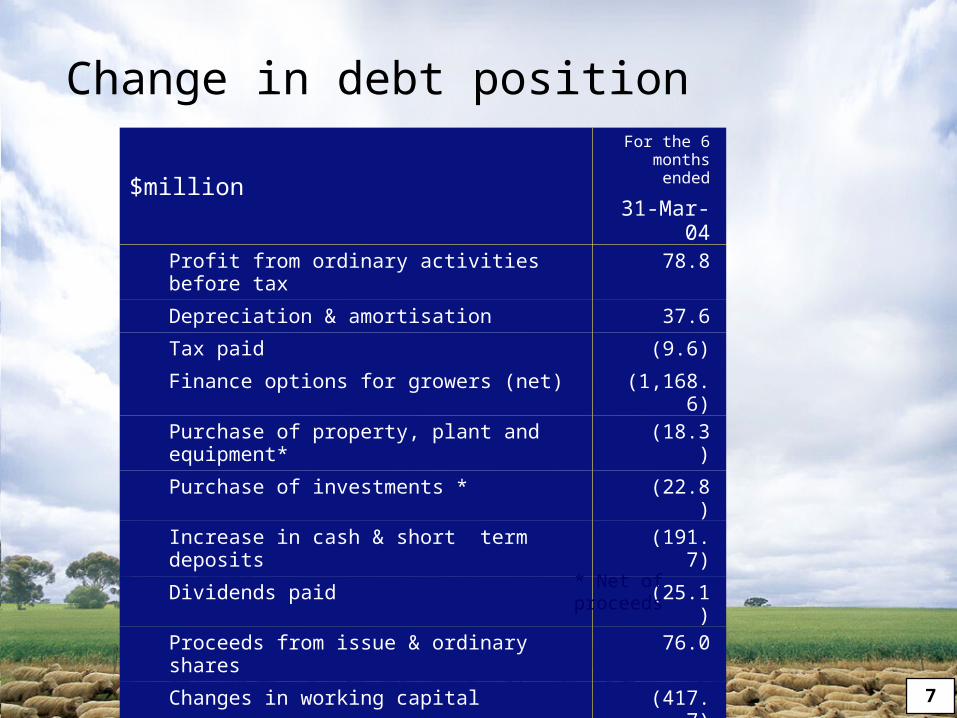
$million
For the 6 months ended
31-Mar-04
Profit from ordinary activities before tax 78.8
Depreciation & amortisation 37.6
Tax paid (9.6)
Finance options for growers (net) (1,168.6)
Purchase of property, plant and equipment* (18.3)
Purchase of investments * (22.8)
Increase in cash & short term deposits (191.7)
Dividends paid (25.1)
Proceeds from issue & ordinary shares 76.0
Changes in working capital (417.7)
Change in debt – (increase) / decrease (1,661.3)
* Net of proceeds
Change in debt position
8
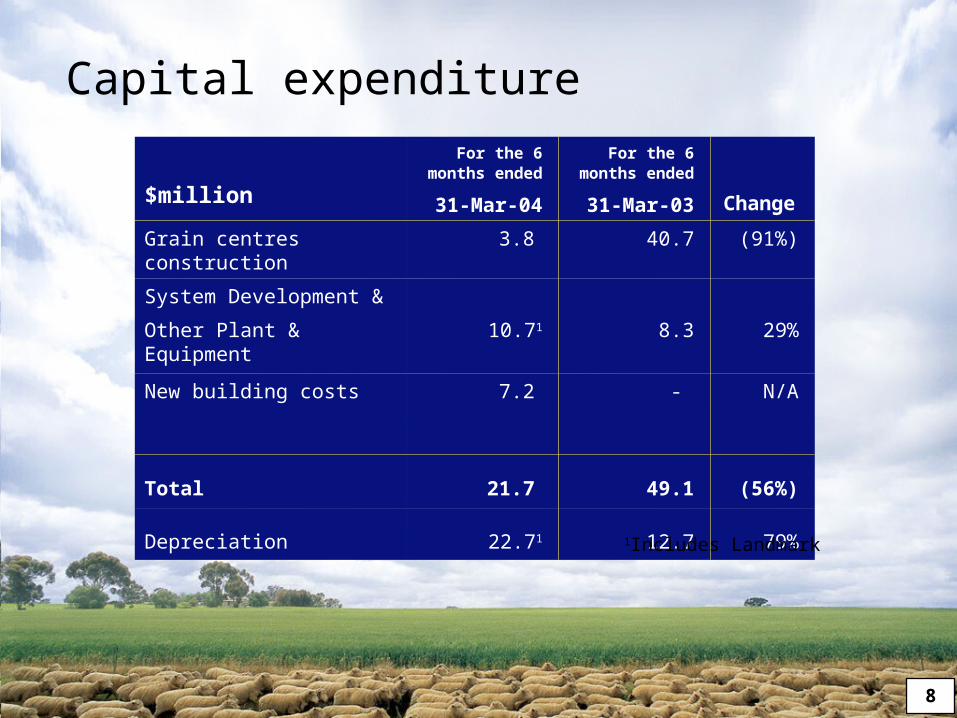
$million
For the 6 months ended
31-Mar-04
For the 6 months ended
31-Mar-03 Change
Grain centres construction 3.8 40.7 (91%)
System Development &
Other Plant & Equipment 10.71 8.3 29%
New building costs
7.2 - N/A
Total 21.7 49.1 (56%)
Depreciation 22.71 12.7 79%
1Includes Landmark
Capital expenditure

9
$million As at 31-Mar-04
As at 30-Sep-03
Assets
Cash 28.8 54.8
Receivables 2,523.4 1,012.6
Intangibles 576.9 583.6
Investments 16.2 12.9
Inventories 332.9 185.4
Property, plant & equipment 296.9 300.4
Other 520.0 266.2
4,295.1 2,415.9
Liabilities
Payables 444.2 336.0
Interest bearing liabilities 2,740.0 1,062.9
Provisions 49.0 52.4
Other 28.2 32.6
3,261.4 1,483.9
Net Assets 1,033.7 932.0
Statement of financial position
10
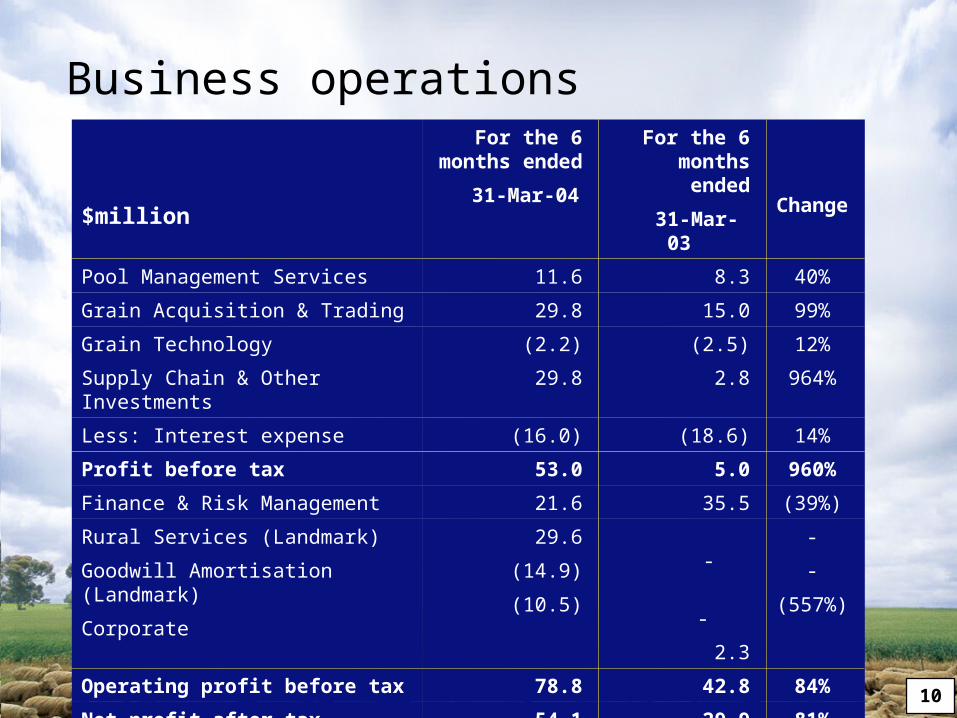
$million
For the 6 months ended
31-Mar-04
For the 6 months ended
31-Mar-03 Change
Pool Management Services 11.6 8.3 40%
Grain Acquisition & Trading 29.8 15.0 99%
Grain Technology (2.2) (2.5) 12%
Supply Chain & Other Investments 29.8 2.8 964%
Less: Interest expense (16.0) (18.6) 14%
Profit before tax 53.0 5.0 960%
Finance & Risk Management 21.6 35.5 (39%)
Rural Services (Landmark)
Goodwill Amortisation (Landmark)
Corporate
29.6
(14.9)
(10.5)
-
-
2.3
-
-
(557%)
Operating profit before tax 78.8 42.8 84%
Net profit after tax 54.1 29.9 81%
Business operations
11
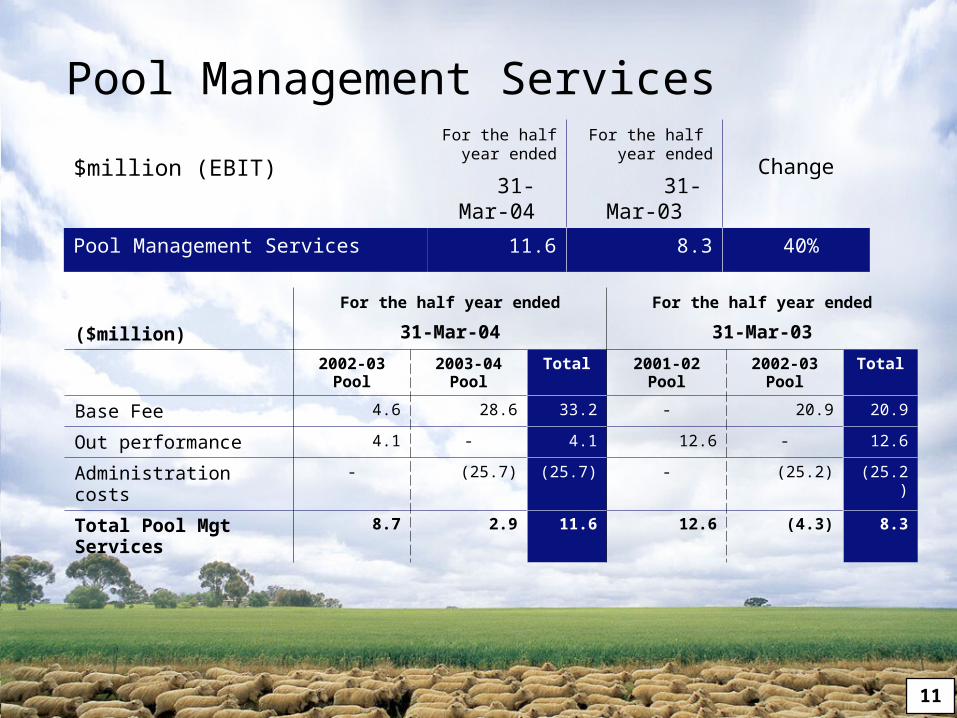
$million (EBIT)
For the half year ended
31-Mar-04
For the half year ended
31-Mar-03Change
Pool Management Services 11.6 8.3 40%
($million)
For the half year ended
31-Mar-04
For the half year ended
31-Mar-03
2002-03 Pool
2003-04 Pool
Total 2001-02 Pool 2002-03 Pool
Total
Base Fee 4.6 28.6 33.2 - 20.9 20.9
Out performance 4.1 - 4.1 12.6 - 12.6
Administration costs - (25.7) (25.7) - (25.2) (25.2)
Total Pool Mgt Services
8.7 2.9 11.6 12.6 (4.3) 8.3
Pool Management Services
12
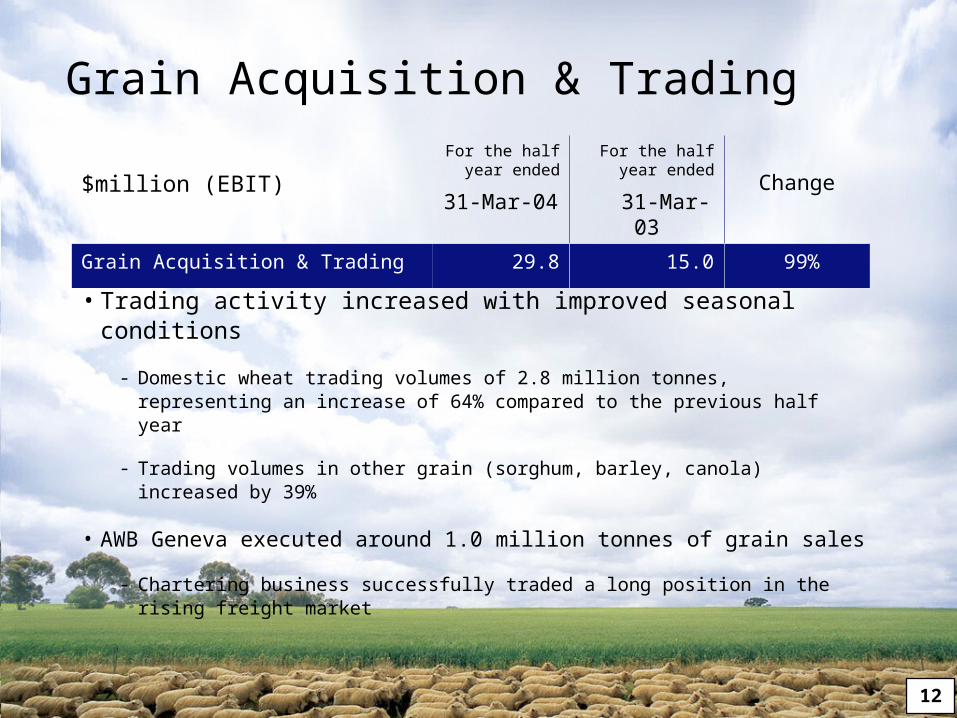
$million (EBIT)
For the half year ended
31-Mar-04
For the half year ended
31-Mar-03Change
Grain Acquisition & Trading 29.8 15.0 99%
• Trading activity increased with improved seasonal conditions
- Domestic wheat trading volumes of 2.8 million tonnes, representing an increase of 64% compared to the previous half year
- Trading volumes in other grain (sorghum, barley, canola) increased by 39%
• AWB Geneva executed around 1.0 million tonnes of grain sales
- Chartering business successfully traded a long position in the rising freight market
Grain Acquisition & Trading
13
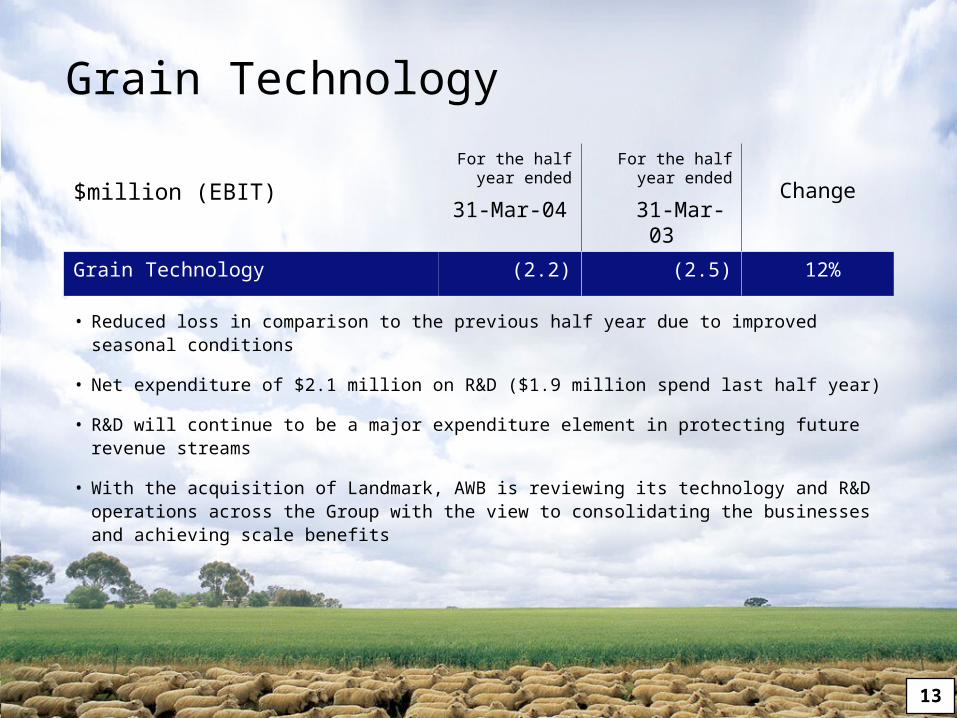
$million (EBIT)
For the half year ended
31-Mar-04
For the half year ended
31-Mar-03Change
Grain Technology (2.2) (2.5) 12%
Grain Technology
• Reduced loss in comparison to the previous half year due to improved seasonal conditions
• Net expenditure of $2.1 million on R&D ($1.9 million spend last half year)
• R&D will continue to be a major expenditure element in protecting future revenue streams
• With the acquisition of Landmark, AWB is reviewing its technology and R&D operations across the Group with the view to consolidating the businesses and achieving scale benefits
14
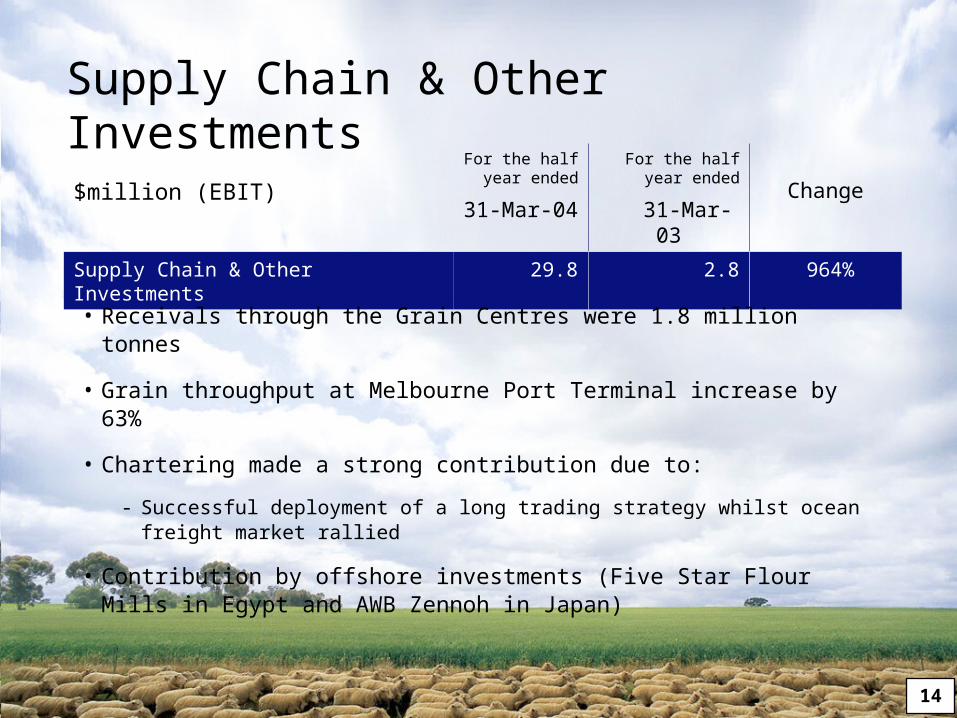
$million (EBIT)
For the half year ended
31-Mar-04
For the half year ended
31-Mar-03Change
Supply Chain & Other Investments 29.8 2.8 964%
• Receivals through the Grain Centres were 1.8 million tonnes
• Grain throughput at Melbourne Port Terminal increase by 63%
• Chartering made a strong contribution due to:
- Successful deployment of a long trading strategy whilst ocean freight market rallied
• Contribution by offshore investments (Five Star Flour Mills in Egypt and AWB Zennoh in Japan)
Supply Chain & Other Investments

15
$million (PBT)
For the half year ended
31-Mar-04
For the half year ended
31-Mar-03Change
Finance & Risk Management 21.6 35.5 (39%)
• Impacted by reduced contribution from Group funding due to surplus capital utilised for the acquisition of Landmark
• Contribution by Financial Services increased 50% to an EBIT of $14.8 million mainly due to seasonal conditions
• The level of underwriting revenue and take up of products increased significantly
Finance & Risk Management
16
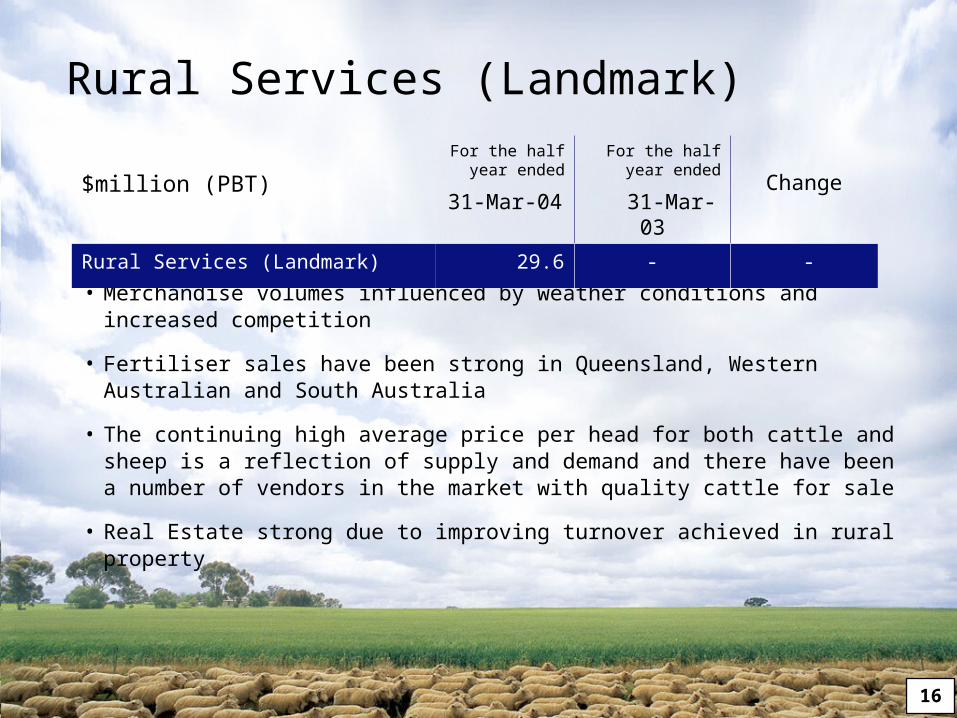
• Merchandise volumes influenced by weather conditions and increased competition
• Fertiliser sales have been strong in Queensland, Western Australian and South Australia
• The continuing high average price per head for both cattle and sheep is a reflection of supply and demand and there have been a number of vendors in the market with quality cattle for sale
• Real Estate strong due to improving turnover achieved in rural property
$million (PBT)
For the half year ended
31-Mar-04
For the half year ended
31-Mar-03Change
Rural Services (Landmark) 29.6 - -
Rural Services (Landmark)
17
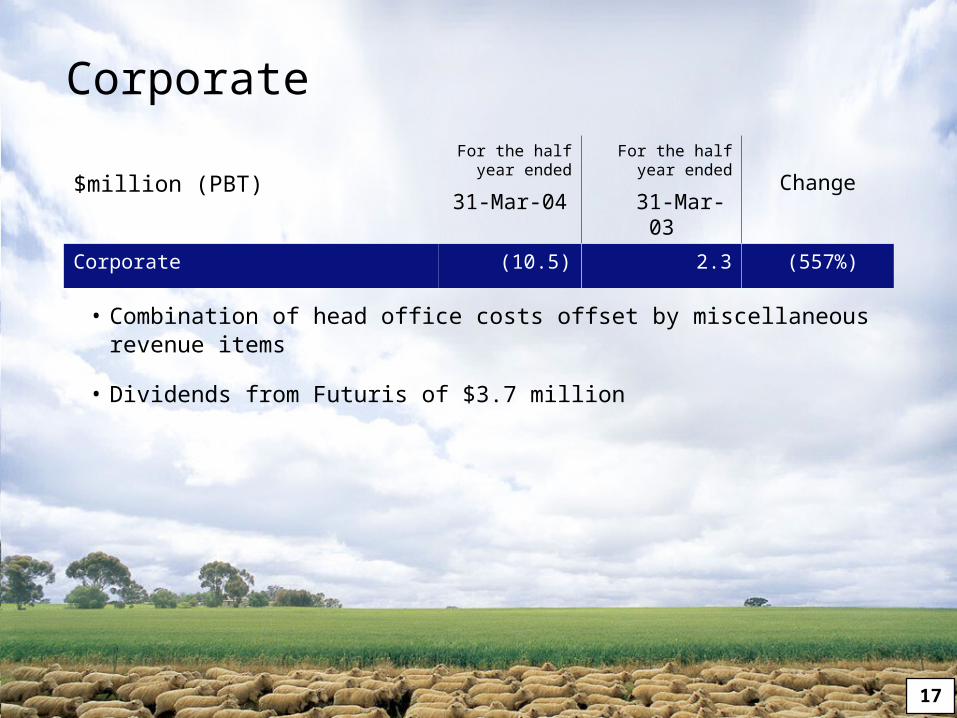
• Combination of head office costs offset by miscellaneous revenue items
• Dividends from Futuris of $3.7 million
$million (PBT)
For the half year ended
31-Mar-04
For the half year ended
31-Mar-03Change
Corporate (10.5) 2.3 (557%)
Corporate
18
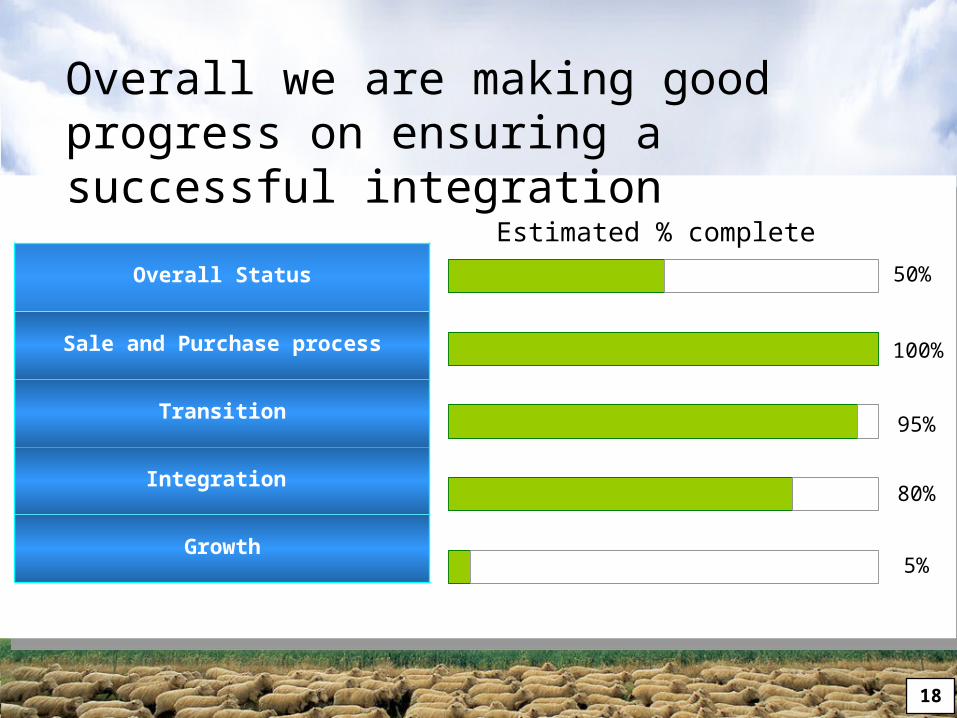
Overall Status
Sale and Purchase process
Transition
Integration
Growth
Overall we are making good progress on ensuring a successful integration
Estimated % complete
50%
100%
95%
80%
5%
19
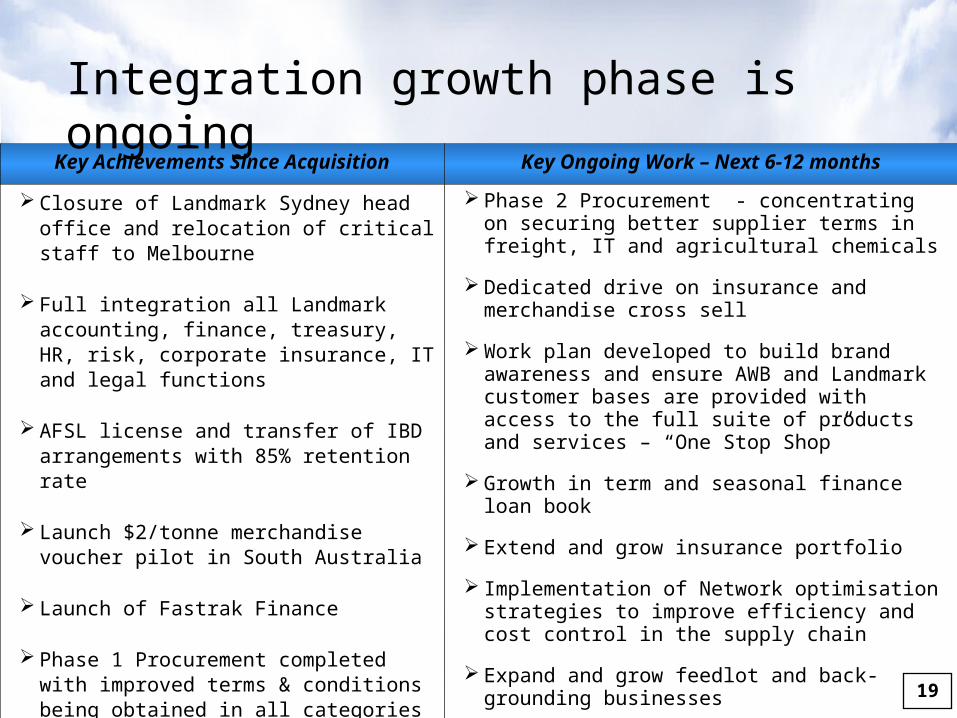
Key Achievements Since Acquisition
Closure of Landmark Sydney head office and relocation of critical staff to Melbourne
Full integration all Landmark accounting, finance, treasury, HR, risk, corporate insurance, IT and legal functions
AFSL license and transfer of IBD arrangements with 85% retention rate
Launch $2/tonne merchandise voucher pilot in South Australia
Launch of Fastrak Finance
Phase 1 Procurement completed with improved terms & conditions being obtained in all categories
Consolidation of 8 network offices.
Integration growth phase is ongoing
Key Ongoing Work – Next 6-12 months
Phase 2 Procurement - concentrating on securing better supplier terms in freight, IT and agricultural chemicals
Dedicated drive on insurance and merchandise cross sell
Work plan developed to build brand awareness and ensure AWB and Landmark customer bases are provided with access to the full suite of products and services – “One Stop Shop”
Growth in term and seasonal finance loan book
Extend and grow insurance portfolio
Implementation of Network optimisation strategies to improve efficiency and cost control in the supply chain
Expand and grow feedlot and back-grounding businesses
BUILD THE INTEGRATED BUSINESS MODEL 19
20
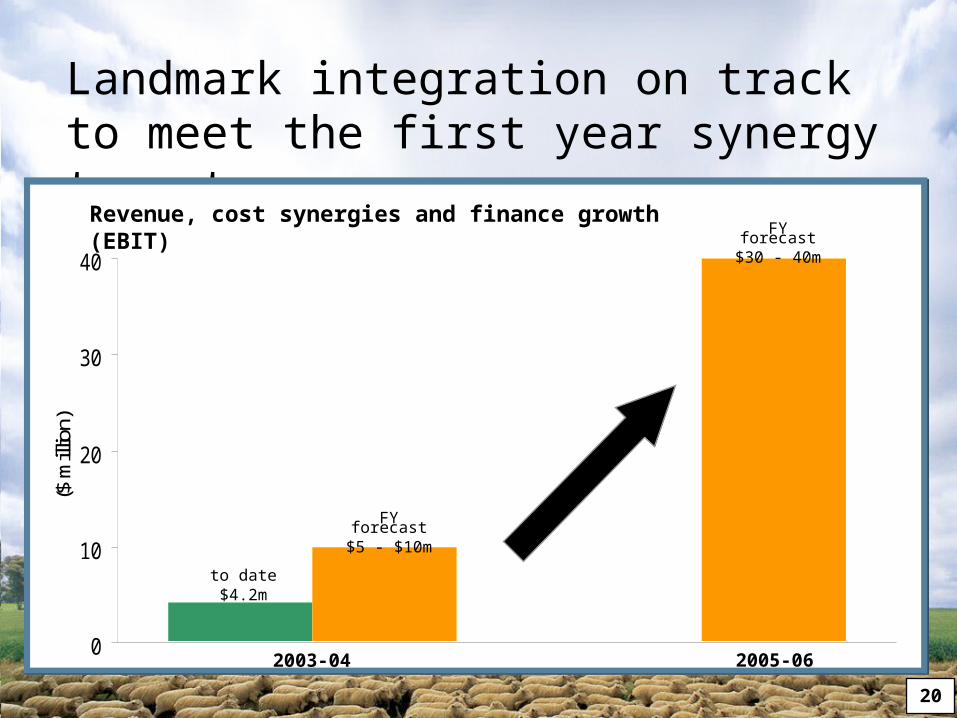
Landmark integration on track to meet the first year synergy targets
0
10
20
30
40
($ m
illio
n)
0
10
20
30
40
($ m
illio
n)
Revenue, cost synergies and finance growth (EBIT)
to date$4.2m
FY forecast$5 - $10m
FY forecast$30 - 40m
2003-04 2005-06
21
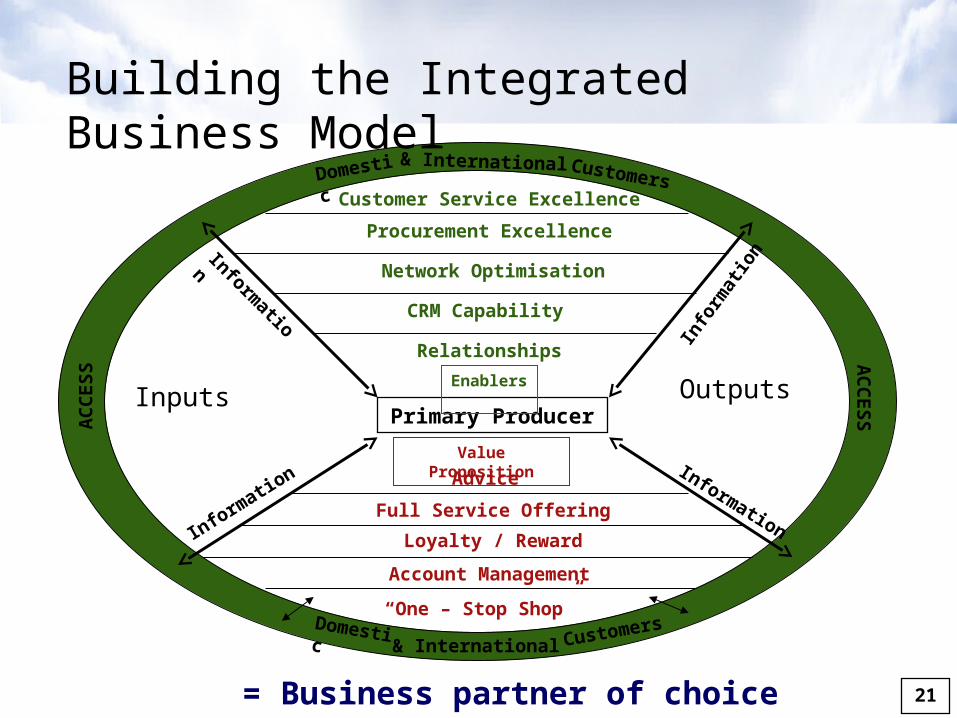
Primary Producer
Enablers
Value Proposition
Inputs Outputs
& InternationalDomestic Customers
Advice
Full Service Offering
Loyalty / Reward
Account Management
“One – Stop Shop”
Relationships
CRM Capability
Network Optimisation
Procurement Excellence
Customer Service ExcellenceDomestic & International Customers
Information
InformationInform
ation
Info
rmat
ion
AC
CE
SSA
CC
ES
S
= Business partner of choice
Building the Integrated Business Model
21
22
Iraq • Successful in the first Iraqi Grains Board tender – 50% of tender, ie, 100,000 tonnes
• 560,000 tonnes for period
China – 1 million tonne contract signed in December 2003 • First significant sale since 1996
• Strong position to meet Chinese quality and shipping requirements
Egypt – heads of agreement signed• Will build on the successful trade relationship with Egypt for over 50 years
• Establishes a framework to pursue the opportunity for a long- term supply contract of wheat
• Positioned to export in excess of 2.3 million tonnes to Egypt
Opportunities – global wheat market

23
VISION: To be Australia’s leading Agribusiness
Corporate strategy
Australia’s leading Agribusiness
Primary producer Business partner of choice End use customer
Our vision
delivered by..
Comprehensive product / service offering
managedthrough an...
Grain Marketing
andHandling
CharteringRisk
Manage-ment
FinancialServices
InsuranceMerchan-
diseAgronomy Wool Real EstateLivestock
IntegratedValue Chain
to ensure thatAWB is the…
BusinessPartnerof choice
Seedsand R&D
Farminputs
DomesticSupplyChain
Acquisitionand
TradingFreight
OffshoreSupplyChain
End usedemand
Millingand
Processing
23
24
Outlook
• 2003-04 NPAT forecast $110-$120 million(pre goodwill amortisation including one off costs)
• Wheat production forecast between 21 – 24 million tonnes for 2004-05
• Focus remains on AWB’s core wheat business
• Integrate and expand the Landmark business to deliver the integrated business model

25
QUESTIONS
26
For more information contact:
Delphine Cassidy
Head of Investor Relations
Ph: +61 3 9209 2404
Email: [email protected]
www.awb.com.au