Embed Size (px)
Citation preview
l i i dTassal Group Limited
Results for the half year ended 31 December 2010
17 February 2011
Mark Ryan, Managing Director and CEOAndrew Creswell, Chief Financial Officer,
AgendaAgenda
Overview1 Overview
Financial performance2
Operational review3
Strategy & outlook
Boa d st ategic e ie
4
Board strategic review
Summary
5
6 Summary
2

Overview1 Overview1
3
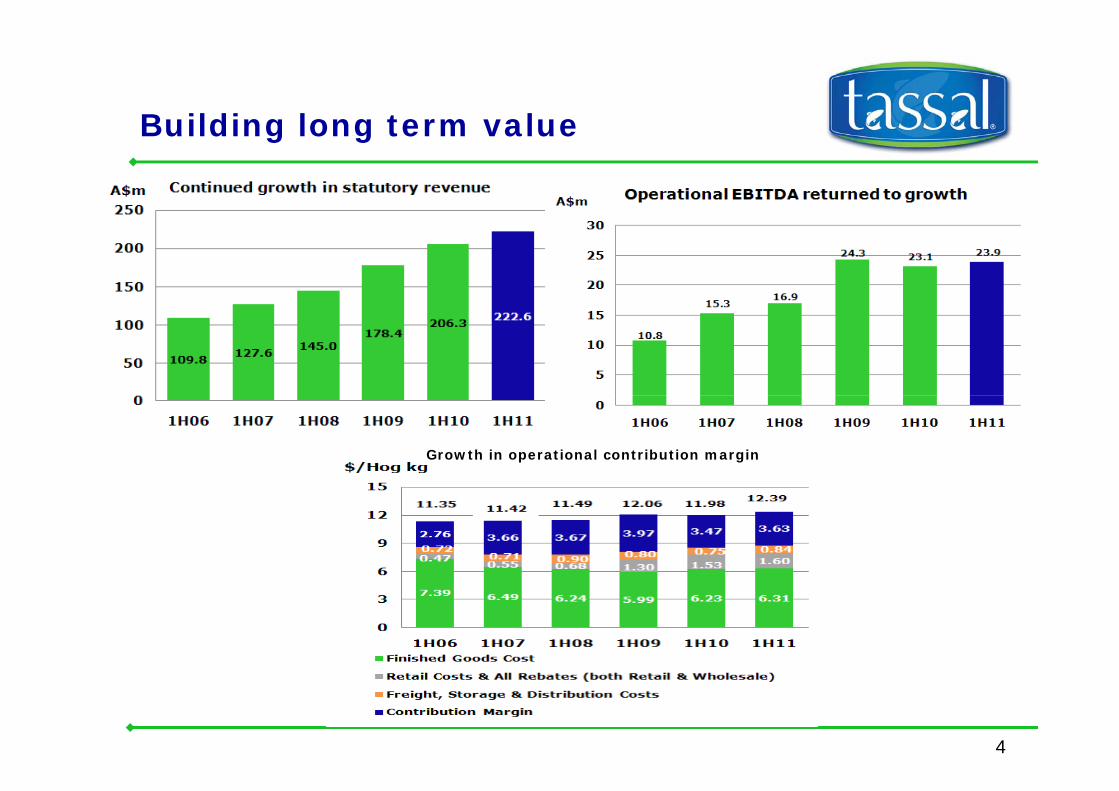
Building long term valueBuilding long term value
Growth in operational contribution margin
4
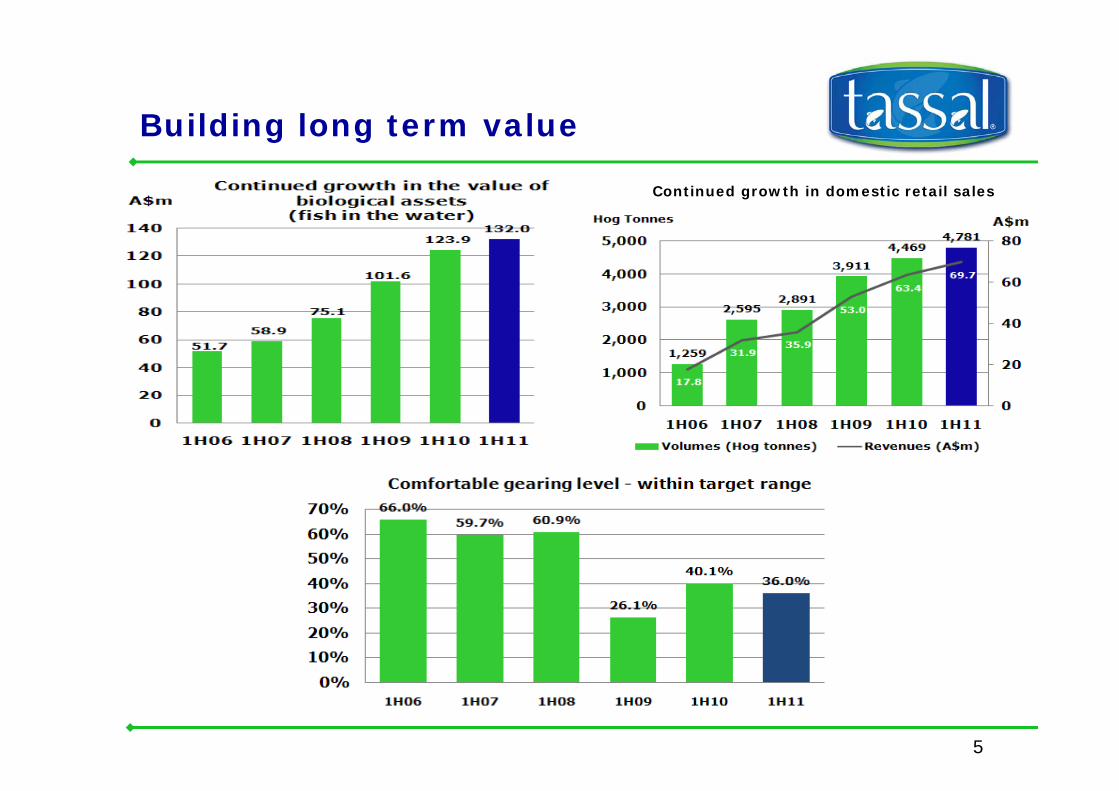
Building long term valueBuilding long term value
Continued growth in domestic retail sales
5
Building long term valueBuilding long term value
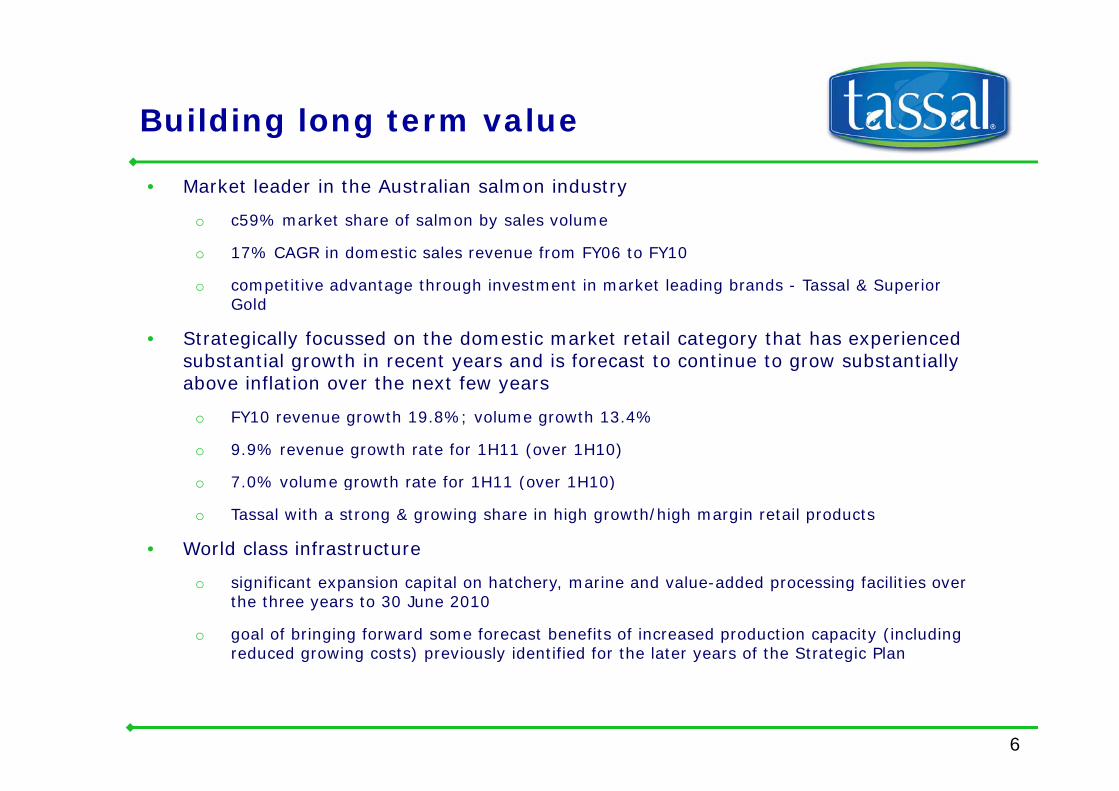
• Market leader in the Australian salmon industry
59% k t h f l b l lo c59% market share of salmon by sales volume
o 17% CAGR in domestic sales revenue from FY06 to FY10
o competitive advantage through investment in market leading brands - Tassal & Superior GoldGold
• Strategically focussed on the domestic market retail category that has experienced substantial growth in recent years and is forecast to continue to grow substantially above inflation over the next few years
o FY10 revenue growth 19.8%; volume growth 13.4%
o 9.9% revenue growth rate for 1H11 (over 1H10)
o 7.0% volume growth rate for 1H11 (over 1H10)o 7.0% volume growth rate for 1H11 (over 1H10)
o Tassal with a strong & growing share in high growth/high margin retail products
• World class infrastructure
o significant expansion capital on hatchery, marine and value-added processing facilities over the three years to 30 June 2010
o goal of bringing forward some forecast benefits of increased production capacity (including reduced growing costs) previously identified for the later years of the Strategic Plan
6
Building long term valueBuilding long term value
• Sound foundations to deliver on Strategic Plan
o fast growing segment – particularly high margin retail segment
o strong & growing brand share
o exciting pipeline of new products to capitalise on high market growth
o efficient operational infrastructure to deliver low cost, high quality products to Tassal’s growing markets
7
Financial performancep
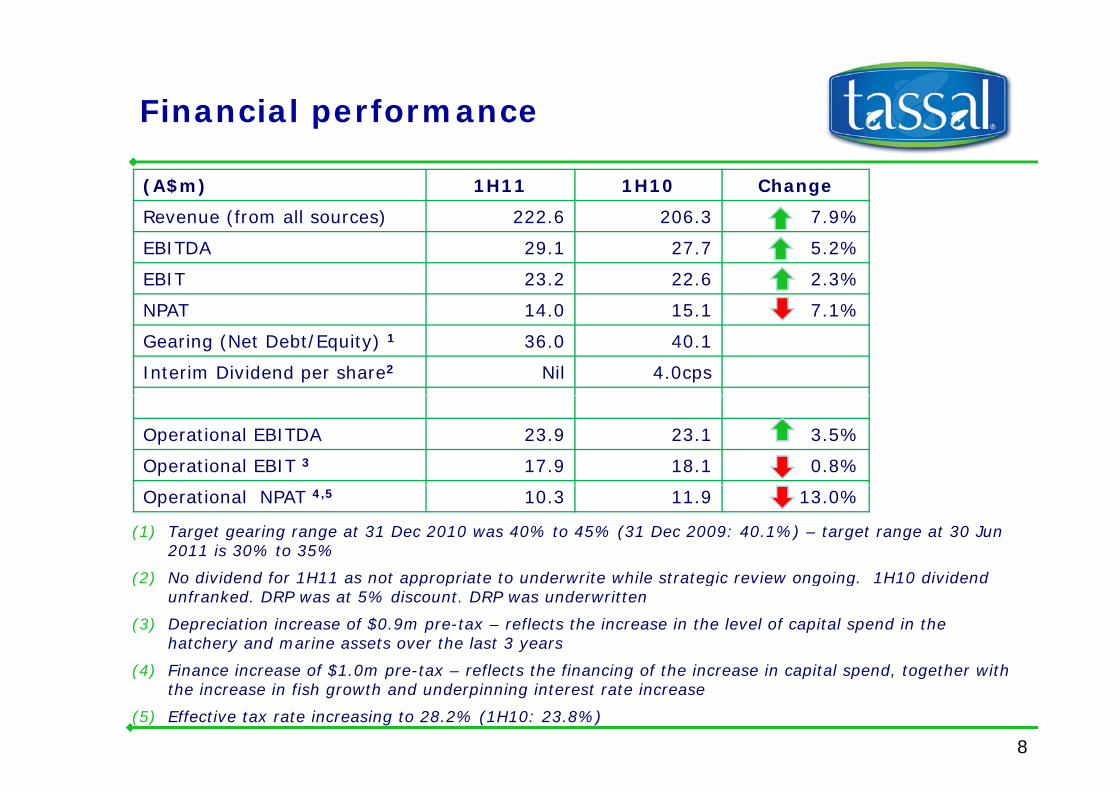
(A$m) 1H11 1H10 Change
Revenue (from all sources) 222 6 206 3 7 9%Revenue (from all sources) 222.6 206.3 7.9%
EBITDA 29.1 27.7 5.2%
EBIT 23.2 22.6 2.3%
NPAT 14 0 15 1 7 1%NPAT 14.0 15.1 7.1%
Gearing (Net Debt/Equity) 1 36.0 40.1
Interim Dividend per share2 Nil 4.0cps
Operational EBITDA 23.9 23.1 3.5%
Operational EBIT 3 17.9 18.1 0.8%
(1) Target gearing range at 31 Dec 2010 was 40% to 45% (31 Dec 2009: 40.1%) – target range at 30 Jun 2011 is 30% to 35%
(2) No dividend for 1H11 as not appropriate to underwrite while strategic review ongoing 1H10 dividend
Operational NPAT 4,5 10.3 11.9 13.0%
(2) No dividend for 1H11 as not appropriate to underwrite while strategic review ongoing. 1H10 dividend unfranked. DRP was at 5% discount. DRP was underwritten
(3) Depreciation increase of $0.9m pre-tax – reflects the increase in the level of capital spend in the hatchery and marine assets over the last 3 years
(4) Fi i f $1 0 t fl t th fi i f th i i it l d t th ith
8
(4) Finance increase of $1.0m pre-tax – reflects the financing of the increase in capital spend, together with the increase in fish growth and underpinning interest rate increase
(5) Effective tax rate increasing to 28.2% (1H10: 23.8%)
Executive summary: financial fperformance
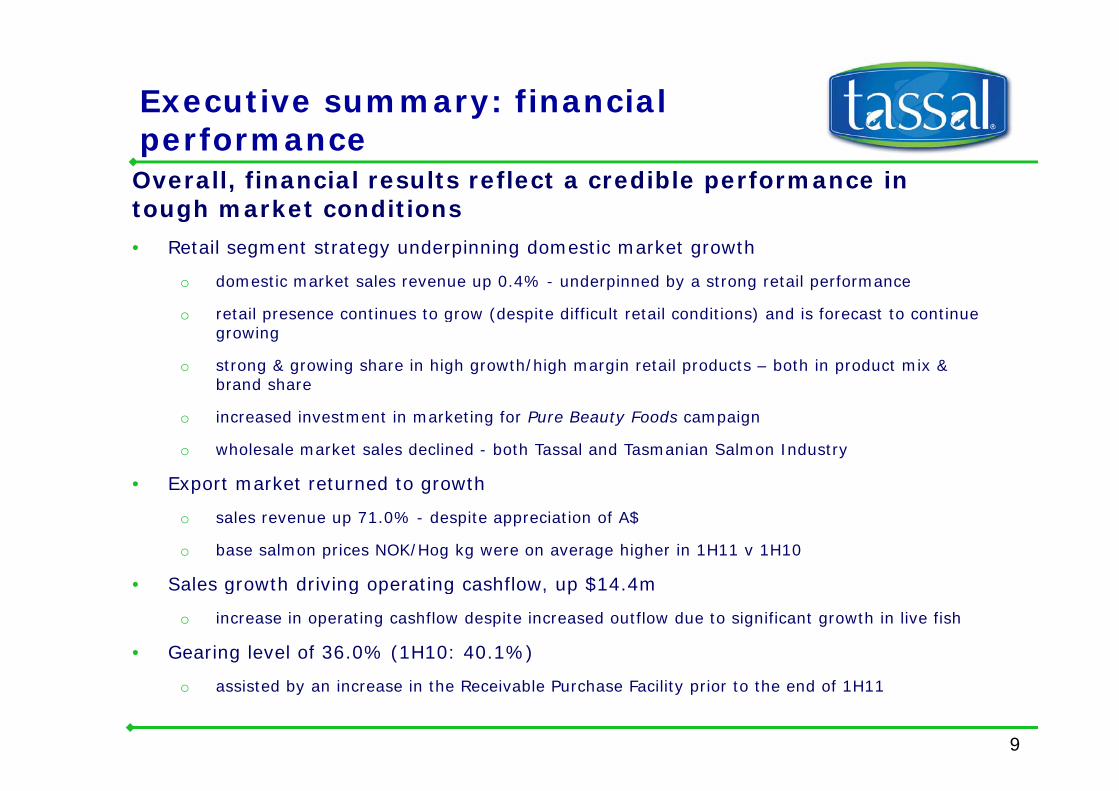
Overall, financial results reflect a credible performance in tough market conditionstough market conditions
• Retail segment strategy underpinning domestic market growth
o domestic market sales revenue up 0.4% - underpinned by a strong retail performance
o retail presence continues to grow (despite difficult retail conditions) and is forecast to continue growing
o strong & growing share in high growth/high margin retail products – both in product mix & brand share
o increased investment in marketing for Pure Beauty Foods campaign
o wholesale market sales declined - both Tassal and Tasmanian Salmon Industry
• Export market returned to growth• Export market returned to growth
o sales revenue up 71.0% - despite appreciation of A$
o base salmon prices NOK/Hog kg were on average higher in 1H11 v 1H10
• Sales growth driving operating cashflow, up $14.4m
o increase in operating cashflow despite increased outflow due to significant growth in live fish
• Gearing level of 36.0% (1H10: 40.1%)
9
o assisted by an increase in the Receivable Purchase Facility prior to the end of 1H11
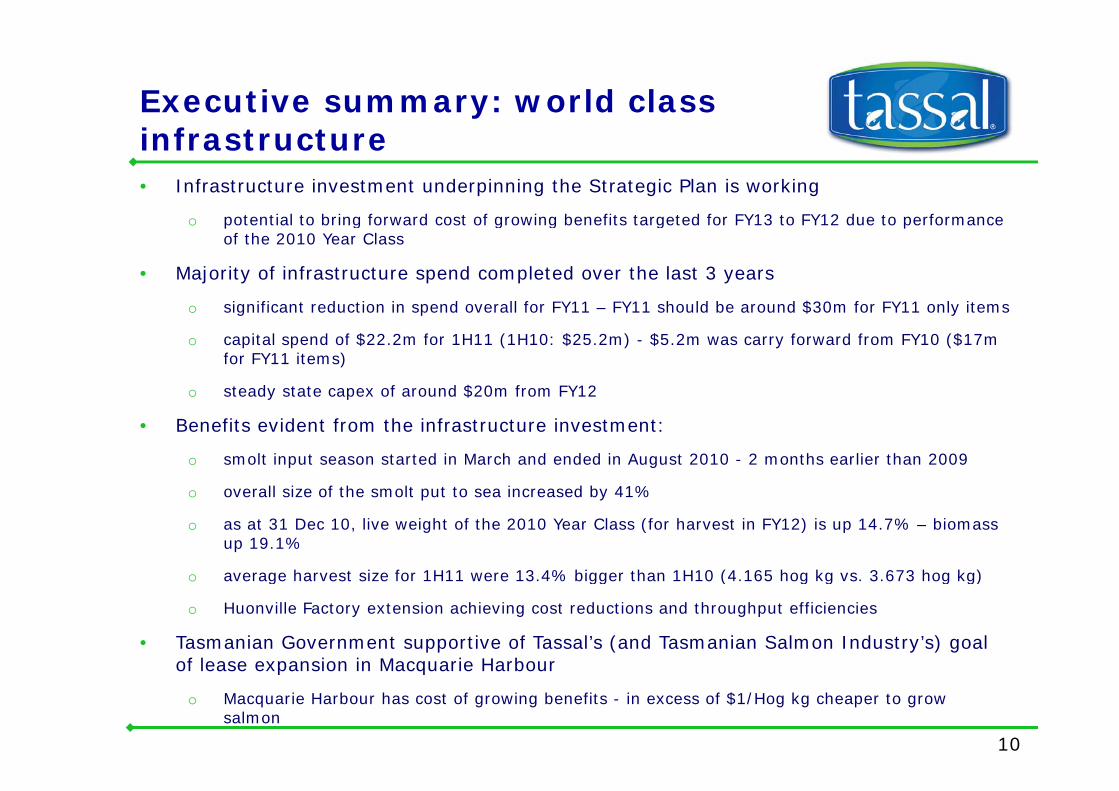
Executive summary: world class i finfrastructure• Infrastructure investment underpinning the Strategic Plan is working
t ti l t b i f d t f i b fit t t d f FY13 t FY12 d t f o potential to bring forward cost of growing benefits targeted for FY13 to FY12 due to performance of the 2010 Year Class
• Majority of infrastructure spend completed over the last 3 years
o significant reduction in spend overall for FY11 FY11 should be around $30m for FY11 only itemso significant reduction in spend overall for FY11 – FY11 should be around $30m for FY11 only items
o capital spend of $22.2m for 1H11 (1H10: $25.2m) - $5.2m was carry forward from FY10 ($17m for FY11 items)
o steady state capex of around $20m from FY12 o steady state capex of around $20m from FY12
• Benefits evident from the infrastructure investment:
o smolt input season started in March and ended in August 2010 - 2 months earlier than 2009
ll f h l d b %o overall size of the smolt put to sea increased by 41%
o as at 31 Dec 10, live weight of the 2010 Year Class (for harvest in FY12) is up 14.7% – biomass up 19.1%
o average harvest size for 1H11 were 13 4% bigger than 1H10 (4 165 hog kg vs 3 673 hog kg)o average harvest size for 1H11 were 13.4% bigger than 1H10 (4.165 hog kg vs. 3.673 hog kg)
o Huonville Factory extension achieving cost reductions and throughput efficiencies
• Tasmanian Government supportive of Tassal’s (and Tasmanian Salmon Industry’s) goal of lease expansion in Macquarie Harbour
10
of lease expansion in Macquarie Harbour
o Macquarie Harbour has cost of growing benefits - in excess of $1/Hog kg cheaper to grow salmon
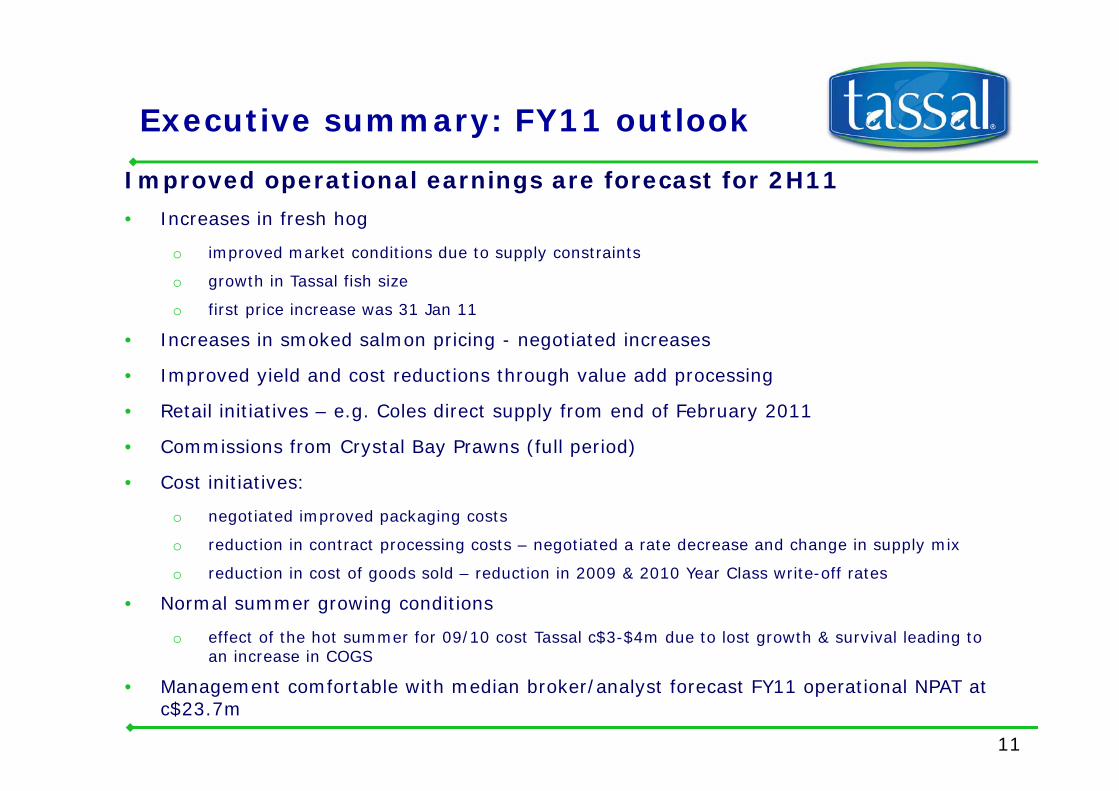
Executive summary: FY11 outlookExecutive summary: FY11 outlook
Improved operational earnings are forecast for 2H11
Increases in fresh hog • Increases in fresh hog
o improved market conditions due to supply constraints
o growth in Tassal fish size
fi t i i 31 J 11 o first price increase was 31 Jan 11
• Increases in smoked salmon pricing - negotiated increases
• Improved yield and cost reductions through value add processing
• Retail initiatives – e.g. Coles direct supply from end of February 2011
• Commissions from Crystal Bay Prawns (full period)
• Cost initiatives:Cost initiatives:
o negotiated improved packaging costs
o reduction in contract processing costs – negotiated a rate decrease and change in supply mix
o reduction in cost of goods sold – reduction in 2009 & 2010 Year Class write-off rateso reduction in cost of goods sold reduction in 2009 & 2010 Year Class write off rates
• Normal summer growing conditions
o effect of the hot summer for 09/10 cost Tassal c$3-$4m due to lost growth & survival leading to an increase in COGS
11
• Management comfortable with median broker/analyst forecast FY11 operational NPAT at c$23.7m
Financial performance2 Financial performance2
12
Statutory results Statutory results
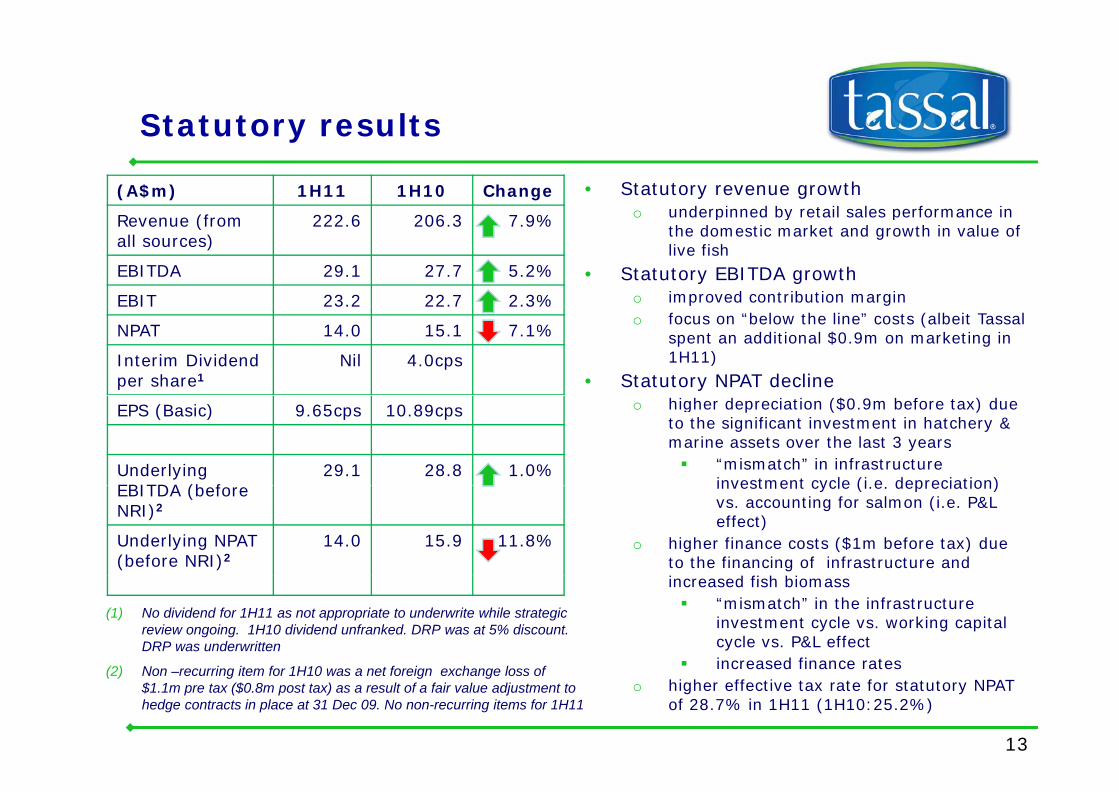
• Statutory revenue growth o underpinned by retail sales performance in
(A$m) 1H11 1H10 Change
R (f 222 6 206 3 7 9% o underpinned by retail sales performance in the domestic market and growth in value of live fish
• Statutory EBITDA growtho improved contribution margin
Revenue (from all sources)
222.6 206.3 7.9%
EBITDA 29.1 27.7 5.2%
EBIT 23.2 22.7 2.3%o focus on “below the line” costs (albeit Tassal
spent an additional $0.9m on marketing in 1H11)
• Statutory NPAT decline
EBIT 23.2 22.7 2.3%
NPAT 14.0 15.1 7.1%
Interim Dividend per share1
Nil 4.0cps
o higher depreciation ($0.9m before tax) due to the significant investment in hatchery & marine assets over the last 3 years
“mismatch” in infrastructure investment cycle (i e depreciation)
EPS (Basic) 9.65cps 10.89cps
Underlying EBITDA (b f
29.1 28.8 1.0%investment cycle (i.e. depreciation) vs. accounting for salmon (i.e. P&L effect)
o higher finance costs ($1m before tax) due to the financing of infrastructure and
d f h b
EBITDA (before NRI)2
Underlying NPAT (before NRI)2
14.0 15.9 11.8%
increased fish biomass “mismatch” in the infrastructure investment cycle vs. working capital cycle vs. P&L effectincreased finance rates
(1) No dividend for 1H11 as not appropriate to underwrite while strategic review ongoing. 1H10 dividend unfranked. DRP was at 5% discount. DRP was underwritten
increased finance rateso higher effective tax rate for statutory NPAT
of 28.7% in 1H11 (1H10:25.2%)
13
(2) Non –recurring item for 1H10 was a net foreign exchange loss of $1.1m pre tax ($0.8m post tax) as a result of a fair value adjustment to hedge contracts in place at 31 Dec 09. No non-recurring items for 1H11
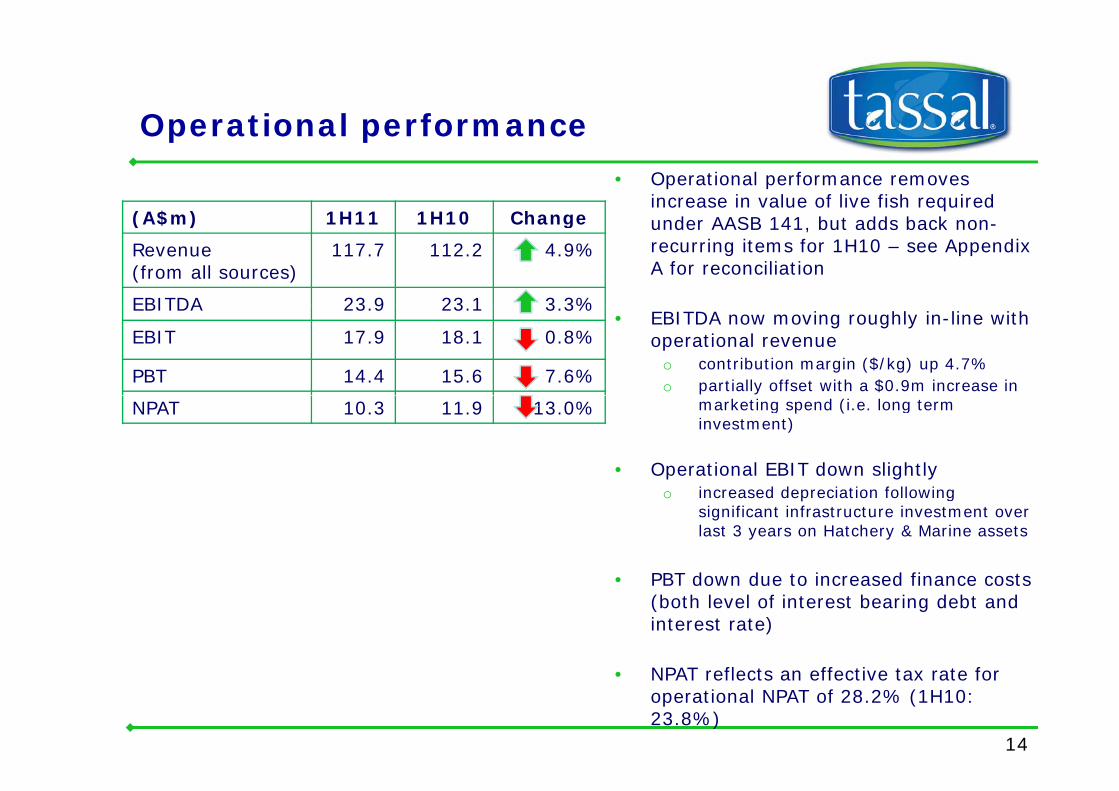
Operational performanceOperational performance
(A$m) 1H11 1H10 Change
• Operational performance removes increase in value of live fish required
d b dd b k(A$m) 1H11 1H10 Change
Revenue (from all sources)
117.7 112.2 4.9%
EBITDA 23 9 23 1 3 3%
under AASB 141, but adds back non-recurring items for 1H10 – see Appendix A for reconciliation
EBITDA 23.9 23.1 3.3%
EBIT 17.9 18.1 0.8%
PBT 14.4 15.6 7.6%
• EBITDA now moving roughly in-line with operational revenue
o contribution margin ($/kg) up 4.7%o partially offset with a $0.9m increase in
NPAT 10.3 11.9 13.0% marketing spend (i.e. long term investment)
• Operational EBIT down slightlyo increased depreciation following
significant infrastructure investment over last 3 years on Hatchery & Marine assets
PBT d d t i d fi t • PBT down due to increased finance costs (both level of interest bearing debt and interest rate)
14
• NPAT reflects an effective tax rate for operational NPAT of 28.2% (1H10: 23.8%)
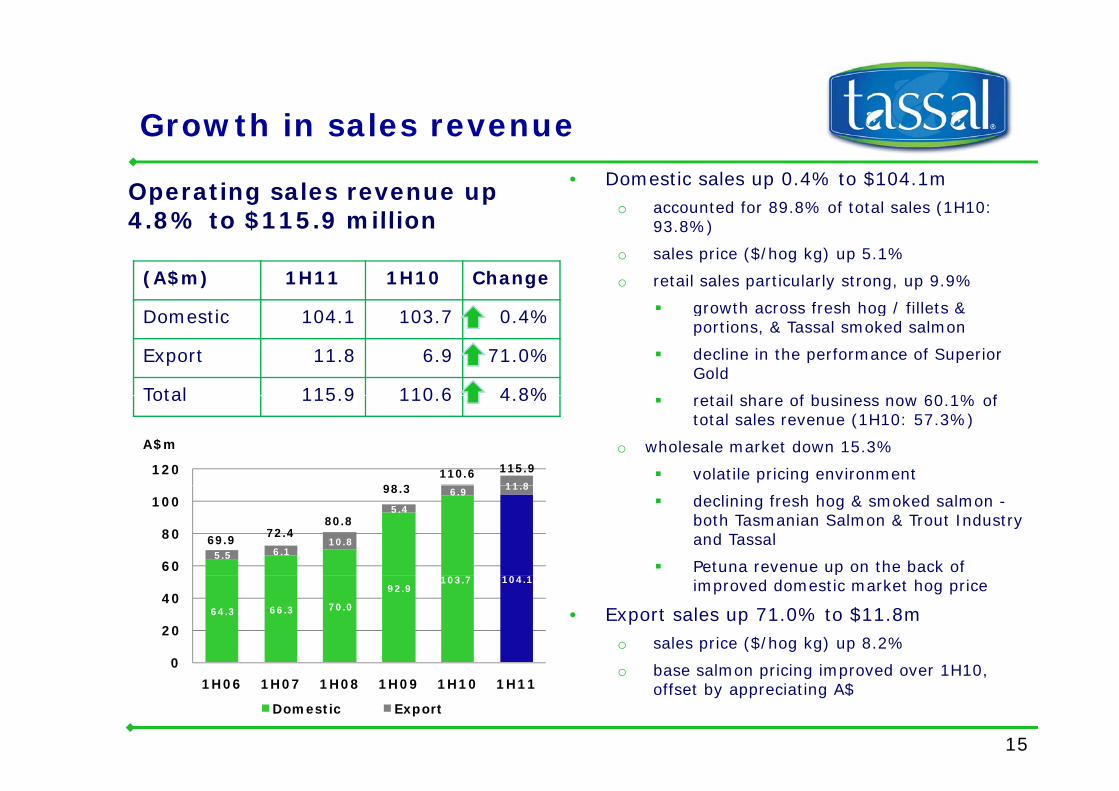
Growth in sales revenueGrowth in sales revenue
Operating sales revenue up 4 8% to $115 9 million
• Domestic sales up 0.4% to $104.1mo accounted for 89.8% of total sales (1H10:
(A$m) 1H11 1H10 Change
4.8% to $115.9 million(
93.8%)
o sales price ($/hog kg) up 5.1%
o retail sales particularly strong, up 9.9%
growth across fresh hog / fillets & Domestic 104.1 103.7 0.4%
Export 11.8 6.9 71.0%
Total 115 9 110 6 4 8%
growth across fresh hog / fillets & portions, & Tassal smoked salmon
decline in the performance of Superior Gold
t il h f b i 60 1% f Total 115.9 110.6 4.8% retail share of business now 60.1% of total sales revenue (1H10: 57.3%)
o wholesale market down 15.3%
volatile pricing environment11 8
120
A$m
98 3110.6 115.9
declining fresh hog & smoked salmon -both Tasmanian Salmon & Trout Industry and Tassal
Petuna revenue up on the back of 5.5 6.1
10.8
5.4
6.9 11.8
60
80
100
69.972.4
80.8
98.3
pimproved domestic market hog price
• Export sales up 71.0% to $11.8m o sales price ($/hog kg) up 8.2%
b l i i i d 1H10
64.3 66.3 70.0
92.9 103.7 104.1
0
20
40
15
o base salmon pricing improved over 1H10, offset by appreciating A$
0
1H06 1H07 1H08 1H09 1H10 1H11
Domestic Export
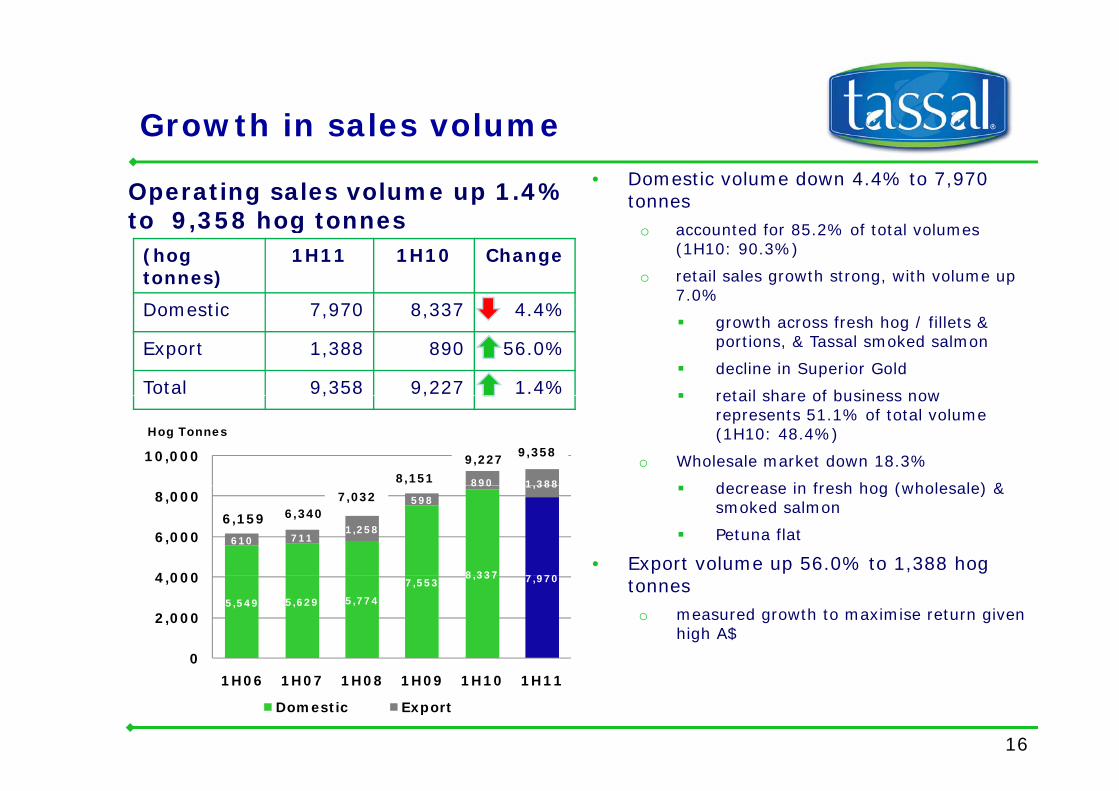
Growth in sales volumeGrowth in sales volume
Operating sales volume up 1.4% to 9 358 hog tonnes
• Domestic volume down 4.4% to 7,970 tonnes
(hog tonnes)
1H11 1H10 Change
Domestic 7 970 8 337 4 4%
to 9,358 hog tonnes o accounted for 85.2% of total volumes (1H10: 90.3%)
o retail sales growth strong, with volume up 7.0%
Domestic 7,970 8,337 4.4%
Export 1,388 890 56.0%
Total 9,358 9,227 1.4%
growth across fresh hog / fillets & portions, & Tassal smoked salmon
decline in Superior Gold
retail share of business now , , retail share of business now represents 51.1% of total volume (1H10: 48.4%)
o Wholesale market down 18.3%
decrease in fresh hog (wholesale) & 890 1 388
10,000
Hog Tonnes
8,151
9,2279,358
decrease in fresh hog (wholesale) & smoked salmon
Petuna flat
• Export volume up 56.0% to 1,388 hog 8 337 7 970
610 7111,258
598
890 1,388
4 000
6,000
8,0006,340
7,032
6,159
tonneso measured growth to maximise return given
high A$
5,549 5,629 5,774
7,5538,337 7,970
0
2,000
4,000
16
1H06 1H07 1H08 1H09 1H10 1H11
Domestic Export
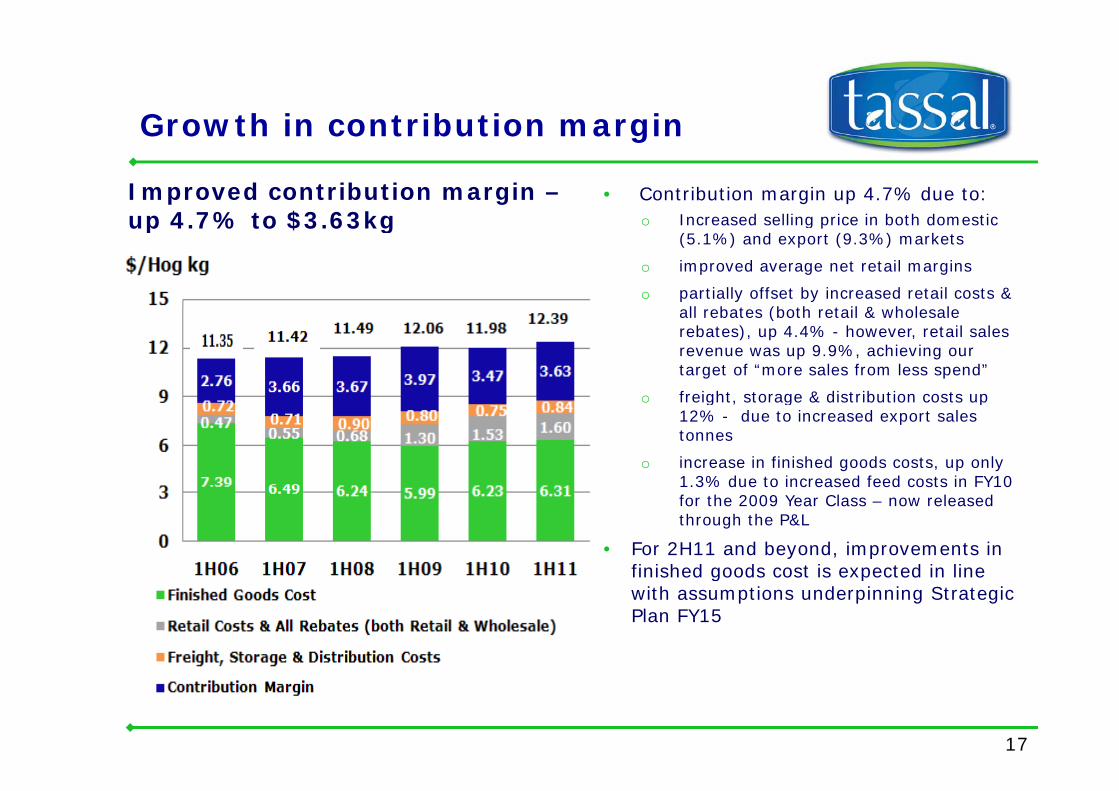
Growth in contribution marginGrowth in contribution margin
Improved contribution margin –up 4 7% to $3 63kg
• Contribution margin up 4.7% due to:I d lli i i b th d ti up 4.7% to $3.63kg o Increased selling price in both domestic (5.1%) and export (9.3%) markets
o improved average net retail margins
o partially offset by increased retail costs & ll b (b h l h l lall rebates (both retail & wholesale
rebates), up 4.4% - however, retail sales revenue was up 9.9%, achieving our target of “more sales from less spend”
o freight storage & distribution costs up o freight, storage & distribution costs up 12% - due to increased export sales tonnes
o increase in finished goods costs, up only 1.3% due to increased feed costs in FY10 1.3% due to increased feed costs in FY10 for the 2009 Year Class – now released through the P&L
• For 2H11 and beyond, improvements in finished goods cost is expected in line finished goods cost is expected in line with assumptions underpinning Strategic Plan FY15
17
Funding Growthg
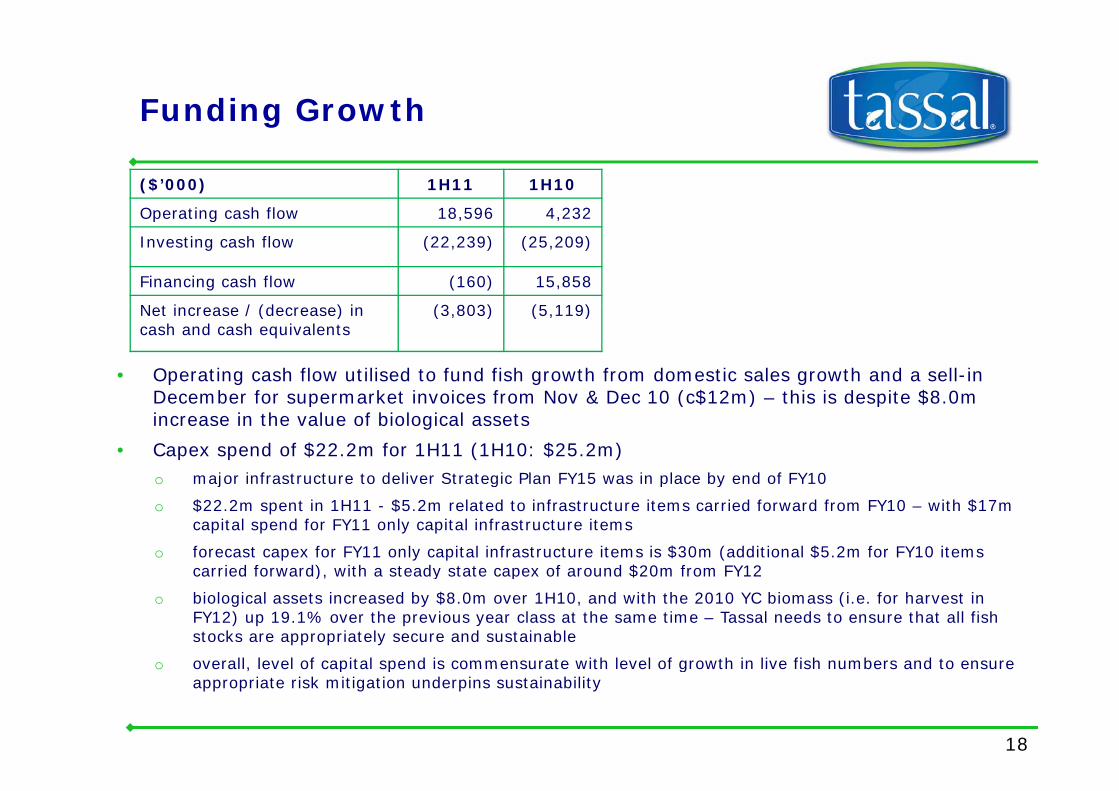
($’000) 1H11 1H10
Operating cash flow 18 596 4 232Operating cash flow 18,596 4,232
Investing cash flow (22,239) (25,209)
Financing cash flow (160) 15,858
N t i / (d ) i (3 803) (5 119)
• Operating cash flow utilised to fund fish growth from domestic sales growth and a sell-in December for supermarket invoices from Nov & Dec 10 (c$12m) this is despite $8 0m
Net increase / (decrease) in cash and cash equivalents
(3,803) (5,119)
December for supermarket invoices from Nov & Dec 10 (c$12m) – this is despite $8.0m increase in the value of biological assets
• Capex spend of $22.2m for 1H11 (1H10: $25.2m) o major infrastructure to deliver Strategic Plan FY15 was in place by end of FY10j g p y
o $22.2m spent in 1H11 - $5.2m related to infrastructure items carried forward from FY10 – with $17m capital spend for FY11 only capital infrastructure items
o forecast capex for FY11 only capital infrastructure items is $30m (additional $5.2m for FY10 items carried forward), with a steady state capex of around $20m from FY12carried forward), with a steady state capex of around $20m from FY12
o biological assets increased by $8.0m over 1H10, and with the 2010 YC biomass (i.e. for harvest in FY12) up 19.1% over the previous year class at the same time – Tassal needs to ensure that all fish stocks are appropriately secure and sustainable
o overall level of capital spend is commensurate with level of growth in live fish numbers and to ensure
18
o overall, level of capital spend is commensurate with level of growth in live fish numbers and to ensure appropriate risk mitigation underpins sustainability
Strong balance sheet
Dec-10 Dec-09 Dec-10 Dec-09
Strong balance sheet
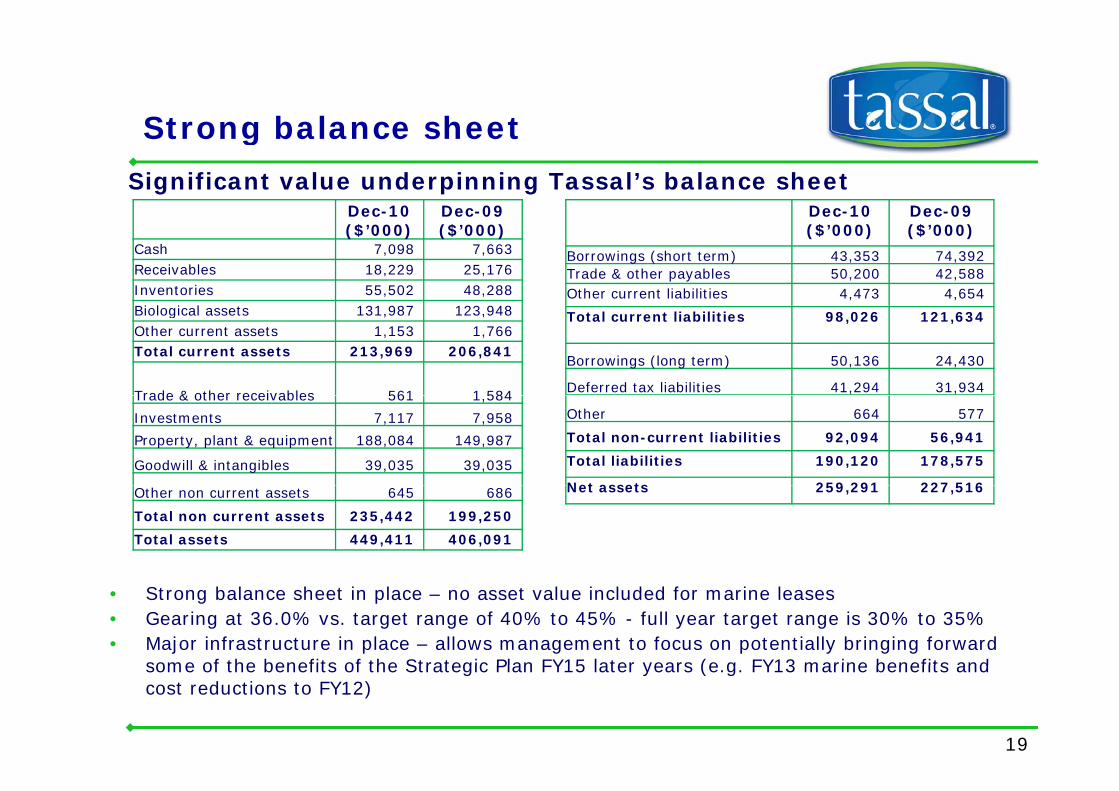
Significant value underpinning Tassal’s balance sheetDec 10($’000)
Dec 09($’000)
Cash 7,098 7,663Receivables 18,229 25,176Inventories 55,502 48,288Bi l i l t 131 987 123 948
Dec 10($’000)
Dec 09($’000)
Borrowings (short term) 43,353 74,392Trade & other payables 50,200 42,588Other current liabilities 4,473 4,654
Biological assets 131,987 123,948Other current assets 1,153 1,766Total current assets 213,969 206,841
Trade & other receivables 561 1 584
Total current liabilities 98,026 121,634
Borrowings (long term) 50,136 24,430
Deferred tax liabilities 41,294 31,934Trade & other receivables 561 1,584
Investments 7,117 7,958
Property, plant & equipment 188,084 149,987
Goodwill & intangibles 39,035 39,035
Other 664 577
Total non-current liabilities 92,094 56,941
Total liabilities 190,120 178,575
Net assets 259 291 227 516Other non current assets 645 686
Total non current assets 235,442 199,250
Total assets 449,411 406,091
Net assets 259,291 227,516
• Strong balance sheet in place – no asset value included for marine leases• Gearing at 36.0% vs. target range of 40% to 45% - full year target range is 30% to 35%• Major infrastructure in place – allows management to focus on potentially bringing forward
some of the benefits of the Strategic Plan FY15 later years (e g FY13 marine benefits and some of the benefits of the Strategic Plan FY15 later years (e.g. FY13 marine benefits and cost reductions to FY12)
19
Operational review3 Operational review3
20
Compelling industry dynamicsp g y y
• Domestic salmon market growth leading into FY11 was compelling
Tassal’s retail focus driving increased salmon consumption • Domestic salmon market growth leading into FY11 was compelling
o FY10 growth for Tassal saw volume up 10.6% & revenue up 13.4%
o growth largely driven by the trend towards healthier and versatile eating
o Tassal was driving overall market growth via focus on its retail strategy
• Strong retail growth expected to continue in FY11
o Tassal retail volumes up 7 0% with sales revenue up 9 9% (1H11 v 1H10)o Tassal retail volumes up 7.0%, with sales revenue up 9.9% (1H11 v 1H10)
o expect strong retail growth to continue in 2H11 on the back of Coles direct supply for fresh products, a solid promotional plan & new product developments
Extent of decline in the wholesale market over 1H11 has been surprising• Extent of decline in the wholesale market over 1H11 has been surprising
o decline has been industry wide
o based on the harvest size and volume profile for 2H11, Tassal expects a recovery of the f f th h l l h k t f l & d l i i performance of the wholesale hog market – from a volume, revenue & underlying price
perspective
• Export market prices will be supported by continued global supply/demand imbalance, with risk on currency
21
, y
Focus on achieving premium returnsFocus on achieving premium returns
• Tassal is focussed on achieving premium returns from its sales and marketing initiatives via:
o better matching of domestic demand with overall fish supply, and
o maximising contribution margin
Sales environment is fluid:• Sales environment is fluid:
o difficult growing conditions over the previous summer (09/10) led to a revised equilibrium between supply and demand in 2H10 and carrying forward into FY11 – no export sales planned for FY11
o significant biomass growth after April 10 – desire not to push retail beyond strategic plan due to o significant biomass growth after April 10 – desire not to push retail beyond strategic plan due to underlying cost of additional retail promotions to consume surplus biomass
o surplus biomass sold to export markets to manage retail sector growth
• Retail business focussed and structured to ensure Tassal continues to maximise retail Retail business focussed and structured to ensure Tassal continues to maximise retail contribution margin
o retail base sales continue to grow – therefore, no need to do excessive promotions
• Wholesale core business maintained, rather than grownWholesale core business maintained, rather than grown
o decrease in overall wholesale market (negative growth)
o aggressive activity of both domestic and New Zealand competitors
22
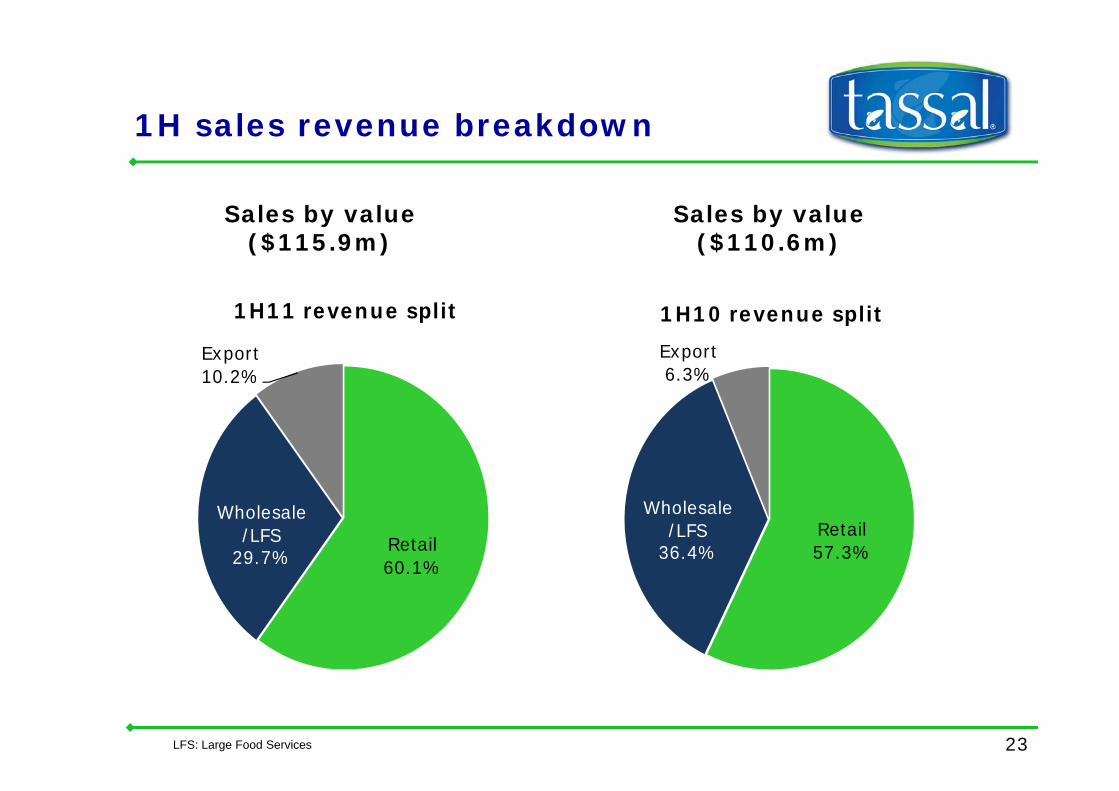
1H sales revenue breakdown 1H sales revenue breakdown
Sales by value Sales by value
1H11 e e e lit
Sales by value($115.9m)
Sales by value($110.6m)
1H10 li
Export10.2%
1H11 revenue split
Export6.3%
1H10 revenue split
Retail60.1%
Wholesale/LFS
29.7%
Retail57.3%
Wholesale/LFS
36.4%
23LFS: Large Food Services
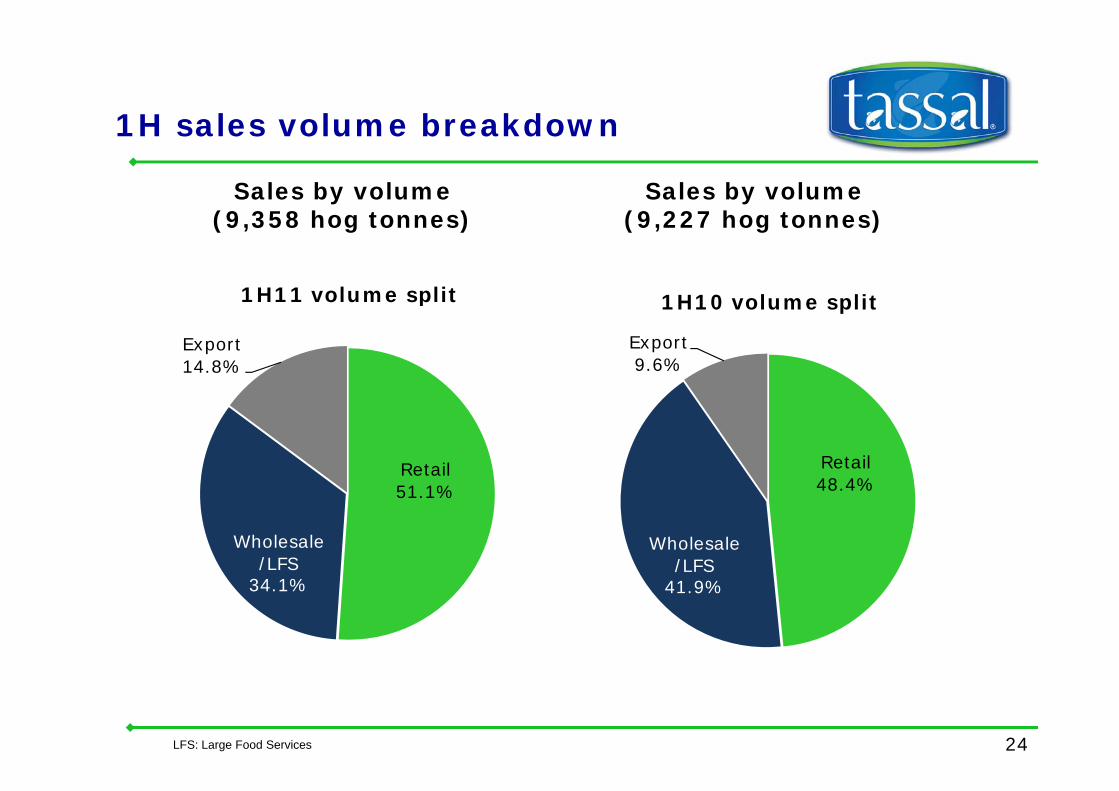
1H sales volume breakdown
Sales by volume(9 358 hog tonnes)
Sales by volume(9 227 hog tonnes)
1H sales volume breakdown
(9,358 hog tonnes) (9,227 hog tonnes)
1H11 volume split 1H10 volume split
Export14.8%
p
Export9.6%
1H10 volume split
Retail51 1%
Retail48 4%51.1%
Wholesale/LFS
48.4%
Wholesale/LFS
34.1% 41.9%
LFS: Large Food Services 24
Focus on global cost competitivenessFocus on global cost competitiveness
• Tassal is focussed on being globally cost competitive in aquaculture production and processing p g
• Significant capital infrastructure
o depreciation increased due to level of investment undertaken
inte est e pense inc eased gi en highe debt and finance costso interest expense increased given higher debt and finance costs
o tax rate increase due to the cessation of the Investment Allowance
• Feed costs are >50% of salmon production costs
o warm summer in 09/10 increased production costs of live fish
o whilst base price of feed increased during FY10, Tassal was able to absorb some of this through scale benefits in labour & overheads
o due to a lower base feed cost during 1H11 and growth in excess of plan, the cost of production of live fish decreased in 1H11 from what Tassal had planned
• Tassal remains focussed on continuing diet and raw material substitution within feed
f h f f d ld b f b d• Due to fish performance, significant processing cost and yield benefits are being captured
25
Tassal’s marketing strategy driving retail sales growthretail sales growth
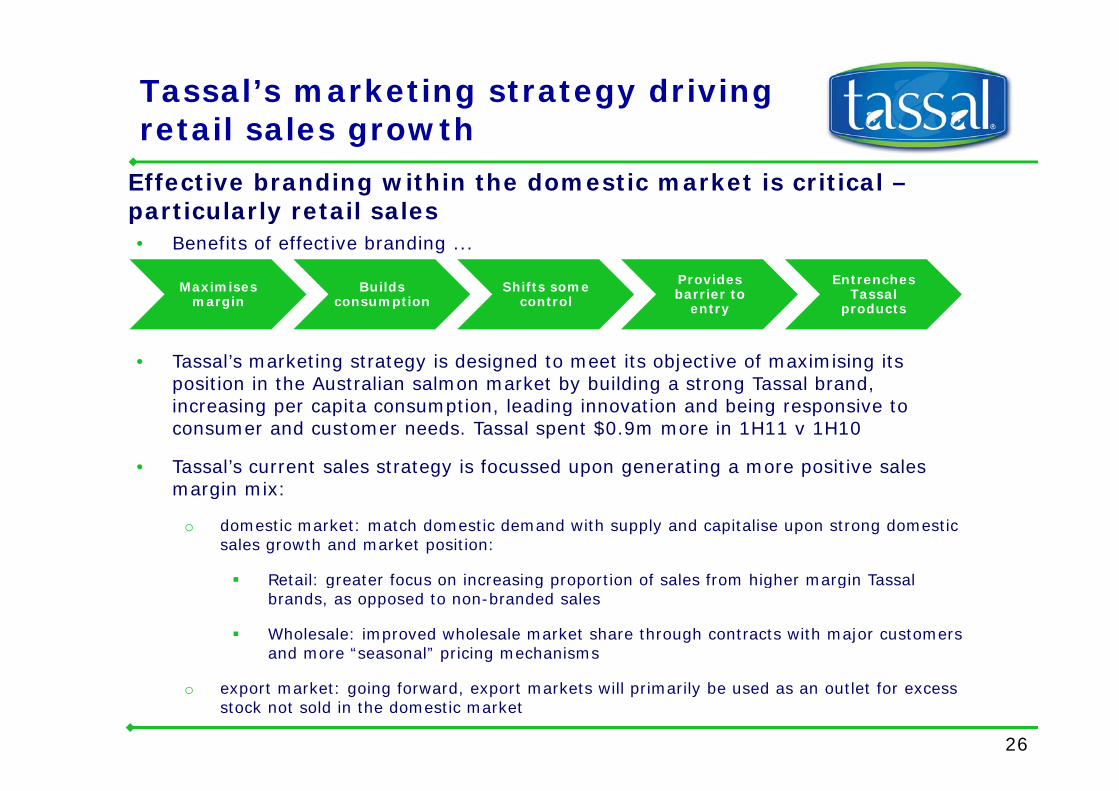
Effective branding within the domestic market is critical –particularly retail sales• Benefits of effective branding ...
particularly retail sales
Maximises margin
Builds consumption
Shifts some control
Provides barrier to
ent
Entrenches Tassal
p od cts
• Tassal’s marketing strategy is designed to meet its objective of maximising its position in the Australian salmon market by building a strong Tassal brand,
margin consumption control entry products
increasing per capita consumption, leading innovation and being responsive to consumer and customer needs. Tassal spent $0.9m more in 1H11 v 1H10
• Tassal’s current sales strategy is focussed upon generating a more positive sales margin mix:margin mix:
o domestic market: match domestic demand with supply and capitalise upon strong domestic sales growth and market position:
R t il t f i i ti f l f hi h i T l Retail: greater focus on increasing proportion of sales from higher margin Tassal brands, as opposed to non-branded sales
Wholesale: improved wholesale market share through contracts with major customers and more “seasonal” pricing mechanisms
26
o export market: going forward, export markets will primarily be used as an outlet for excess stock not sold in the domestic market
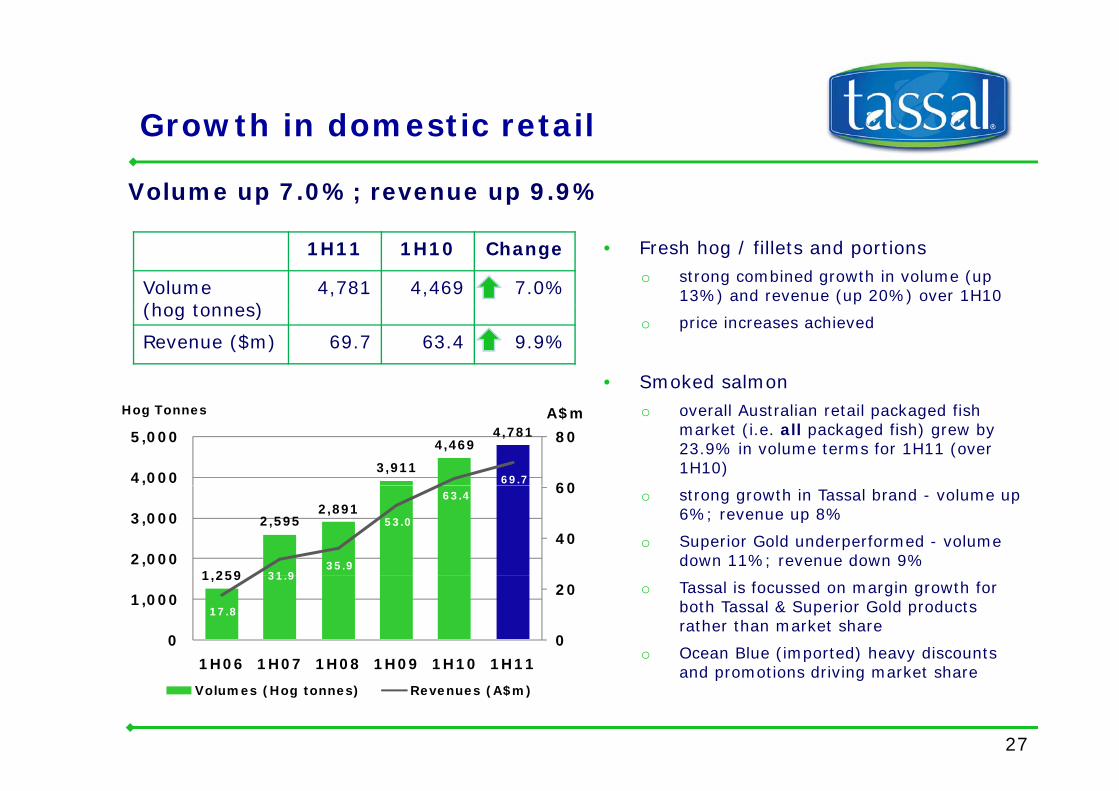
Growth in domestic retailGrowth in domestic retail
Volume up 7.0%; revenue up 9.9%
1H11 1H10 Change
Volume (h t )
4,781 4,469 7.0%
• Fresh hog / fillets and portions o strong combined growth in volume (up
13%) and revenue (up 20%) over 1H10 (hog tonnes)
Revenue ($m) 69.7 63.4 9.9%o price increases achieved
• Smoked salmono overall Australian retail packaged fish
market (i.e. all packaged fish) grew by 23.9% in volume terms for 1H11 (over 1H10)3,911
4,4694,781
69.7 60
80
4,000
5,000
Hog Tonnes A$m
o strong growth in Tassal brand - volume up 6%; revenue up 8%
o Superior Gold underperformed - volume down 11%; revenue down 9%
1 259
2,5952,891
31 9 35.9
53.0
63.4
40
60
2,000
3,000
,
o Tassal is focussed on margin growth for both Tassal & Superior Gold products rather than market share
o Ocean Blue (imported) heavy discounts
1,259
17.8
31.9
0
20
0
1,000
1H06 1H07 1H08 1H09 1H10 1H11
27
and promotions driving market share1H06 1H07 1H08 1H09 1H10 1H11
Volumes (Hog tonnes) Revenues (A$m)
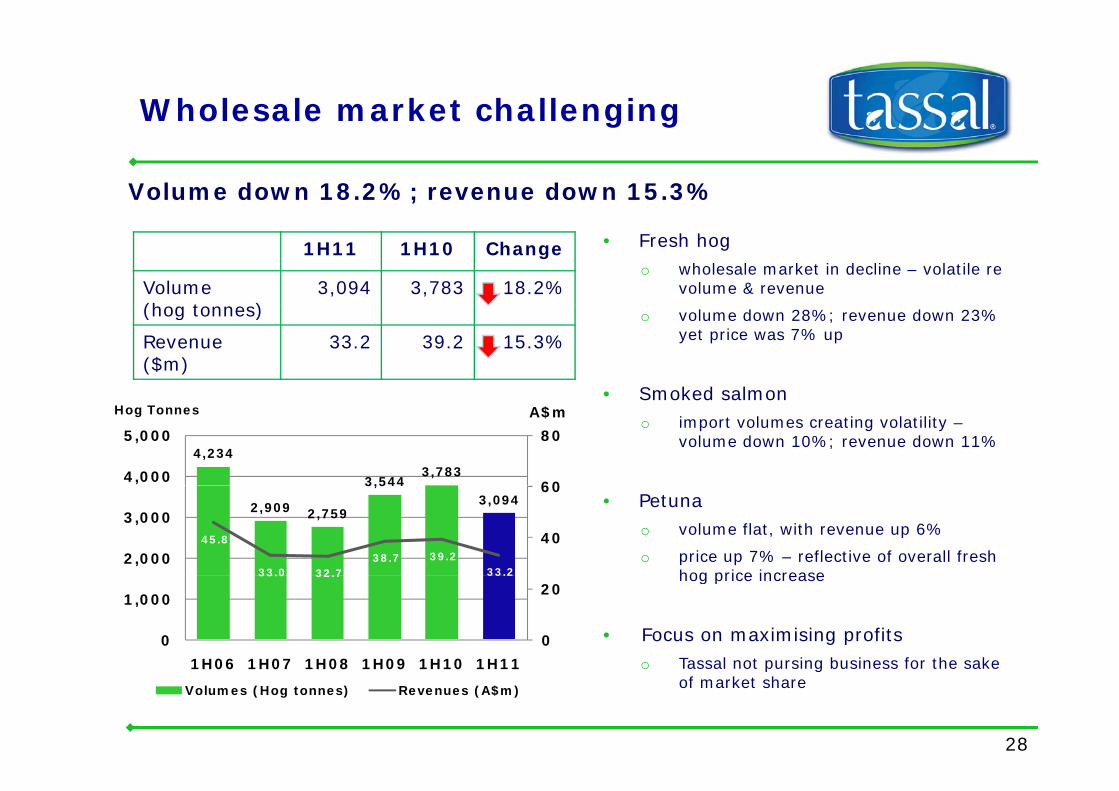
Wholesale market challengingg g
Volume down 18.2%; revenue down 15.3%
1H11 1H10 Change
Volume (h t )
3,094 3,783 18.2%
• Fresh hogo wholesale market in decline – volatile re
volume & revenue(hog tonnes)
Revenue ($m)
33.2 39.2 15.3%o volume down 28%; revenue down 23%
yet price was 7% up
• Smoked salmon• Smoked salmono import volumes creating volatility –
volume down 10%; revenue down 11%4,234
3,5443,783
60
80
4,000
5,000
Hog Tonnes A$m
• Petunao volume flat, with revenue up 6%
o price up 7% – reflective of overall fresh hog price increase
2,909 2,759
3,5443,094
45.8
33.0 32.7 38.7 39.2
33.2
40
60
2,000
3,000
hog price increase
• Focus on maximising profitso Tassal not pursing business for the sake
33.0 32.7 33.2
0
20
0
1,000
1H06 1H07 1H08 1H09 1H10 1H11
28
o Tassal not pursing business for the sake of market share
1H06 1H07 1H08 1H09 1H10 1H11
Volumes (Hog tonnes) Revenues (A$m)
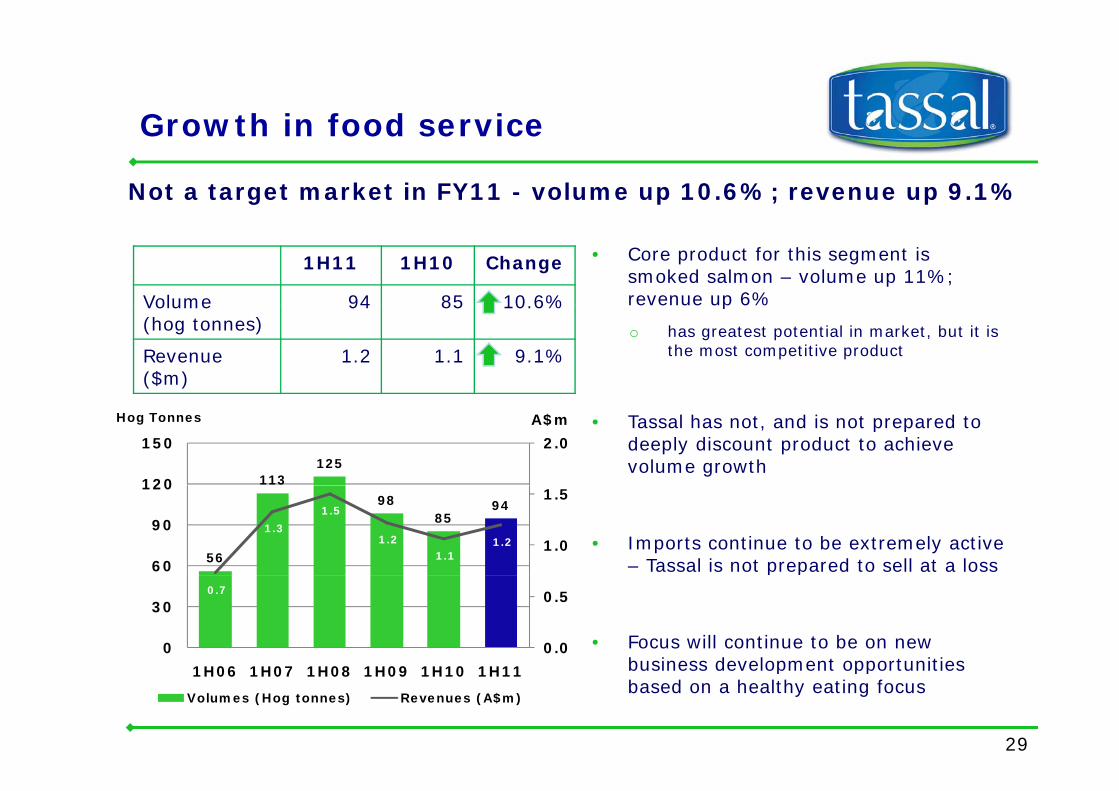
Growth in food serviceGrowth in food service
Not a target market in FY11 - volume up 10.6%; revenue up 9.1%
1H11 1H10 Change
Volume 94 85 10.6%
• Core product for this segment is smoked salmon – volume up 11%; revenue up 6%Volume
(hog tonnes)94 85 10.6%
Revenue ($m)
1.2 1.1 9.1%
p
o has greatest potential in market, but it is the most competitive product
• Tassal has not, and is not prepared to deeply discount product to achieve volume growth
113125
2.0
120
150
Hog Tonnes A$m
• Imports continue to be extremely active – Tassal is not prepared to sell at a loss56
9885
94
1.3
1.5
1.2 1.1
1.2 1.0
1.5
60
90
120
p p
• Focus will continue to be on new business development opportunities
0.7
0.0
0.5
0
30
29
business development opportunities based on a healthy eating focus
1H06 1H07 1H08 1H09 1H10 1H11
Volumes (Hog tonnes) Revenues (A$m)
Exceptional growth in export salesExceptional growth in export sales
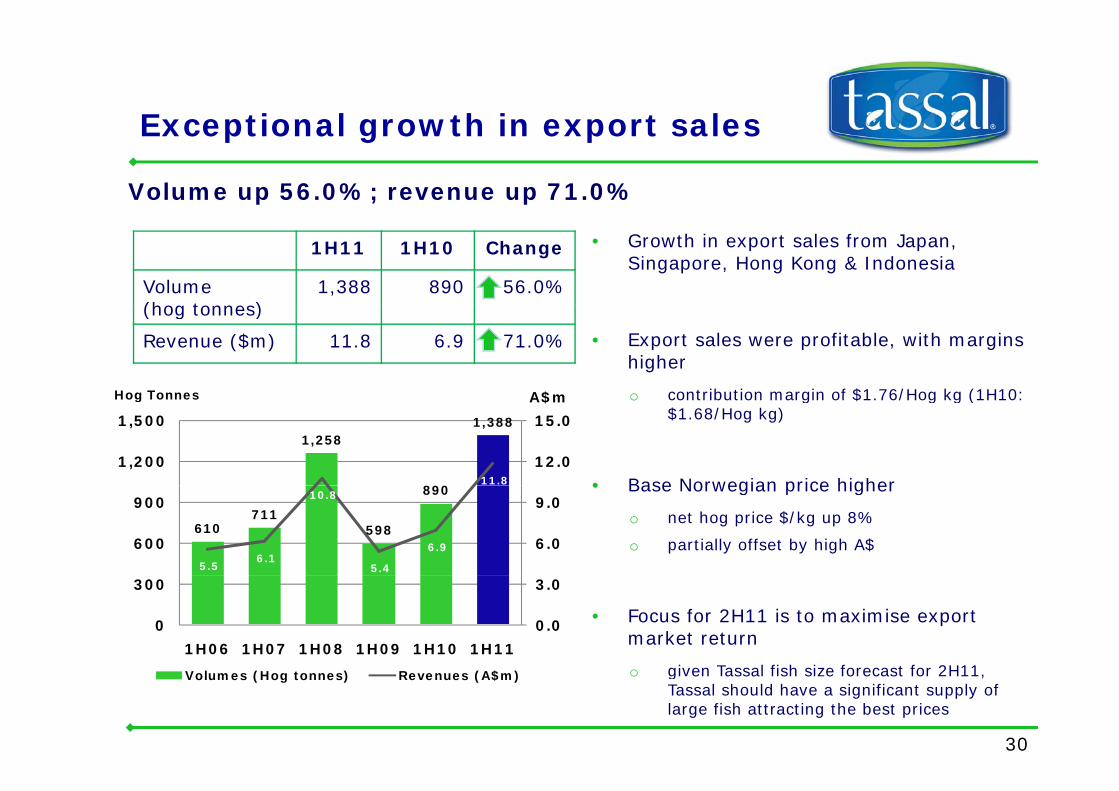
Volume up 56.0%; revenue up 71.0%
1H11 1H10 Change
Volume (hog tonnes)
1,388 890 56.0%
• Growth in export sales from Japan, Singapore, Hong Kong & Indonesia
(hog tonnes)
Revenue ($m) 11.8 6.9 71.0% • Export sales were profitable, with margins higher
o contribution margin of $1 76/Hog kg (1H10: Hog Tonnes A$m o contribution margin of $1.76/Hog kg (1H10: $1.68/Hog kg)
• Base Norwegian price higher
1,258
890
1,388
11.8
12.0
15.0
1,200
1,500
Hog Tonnes A$m
• Base Norwegian price higher
o net hog price $/kg up 8%
o partially offset by high A$610
711598
890
5.5 6.1
10.8
5.4
6.9 6.0
9.0
600
900
• Focus for 2H11 is to maximise export market return
i T l fi h i f f 2H11
0.0
3.0
0
300
1H06 1H07 1H08 1H09 1H10 1H11
30
o given Tassal fish size forecast for 2H11, Tassal should have a significant supply of large fish attracting the best prices
Volumes (Hog tonnes) Revenues (A$m)
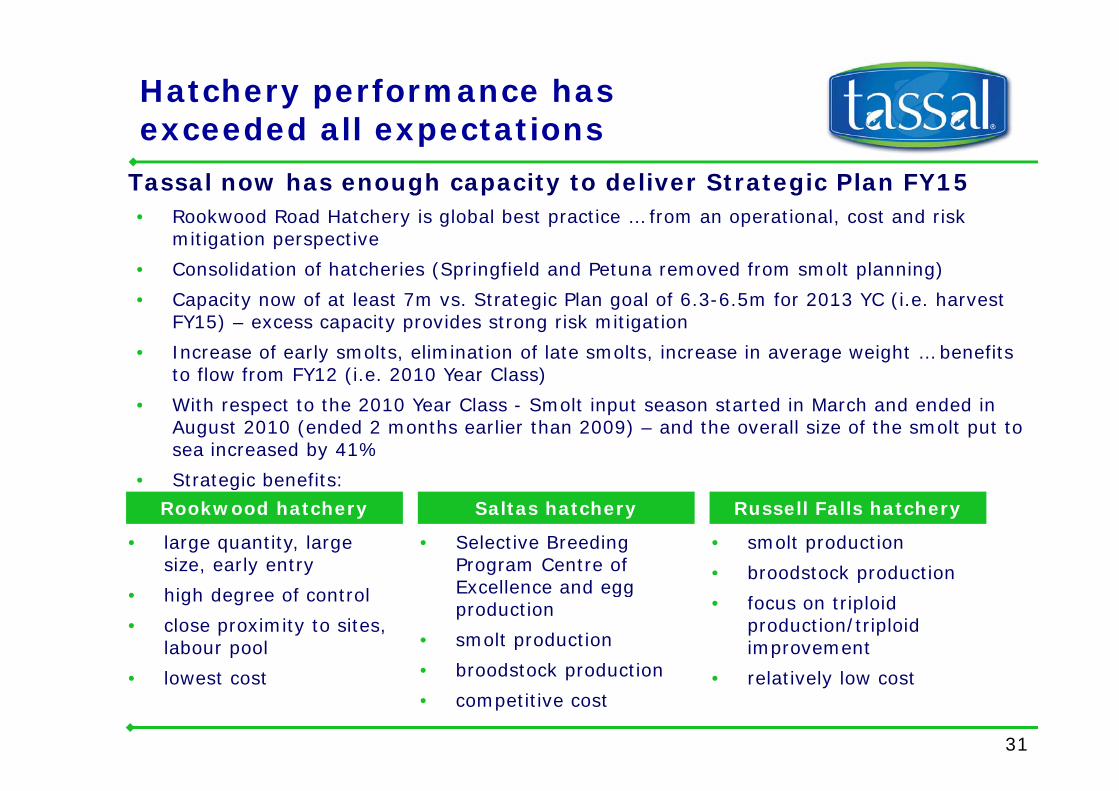
Hatchery performance has exceeded all expectationsexceeded all expectations
• Rookwood Road Hatchery is global best practice from an operational cost and risk
Tassal now has enough capacity to deliver Strategic Plan FY15• Rookwood Road Hatchery is global best practice … from an operational, cost and risk
mitigation perspective
• Consolidation of hatcheries (Springfield and Petuna removed from smolt planning)
• Capacity now of at least 7m vs. Strategic Plan goal of 6.3-6.5m for 2013 YC (i.e. harvest Capacity now of at least 7m vs. Strategic Plan goal of 6.3 6.5m for 2013 YC (i.e. harvest FY15) – excess capacity provides strong risk mitigation
• Increase of early smolts, elimination of late smolts, increase in average weight … benefits to flow from FY12 (i.e. 2010 Year Class)
• With respect to the 2010 Year Class - Smolt input season started in March and ended in August 2010 (ended 2 months earlier than 2009) – and the overall size of the smolt put to sea increased by 41%
• Strategic benefits:Strategic benefits:
Rookwood hatchery
• large quantity, large size, early entry
Saltas hatchery Russell Falls hatchery
• Selective Breeding Program Centre of
• smolt production
• broodstock production• high degree of control
• close proximity to sites, labour pool
Excellence and egg production
• smolt production
b d t k d ti
broodstock production
• focus on triploid production/triploid improvement
31
• lowest cost • broodstock production
• competitive cost• relatively low cost
Sea performance continually improvingimproving
Fish performance has been excellent since April 2010
• Bigger fisho live fish – fish for the balance of the primary FY11 harvest fish 7.1% bigger at 31 December 2010
(vs. corresponding year class at 31 December 2009)
o average harvest size for primary FY11 harvest fish 13.4% bigger for the period up to 31 December 2010 vs. corresponding year class at 31 December 2009 (4.165 hog kg vs. 3.673 hog kg)
o live fish – fish for the primary FY12 harvest fish 14.7% bigger (live biomass up 19.1%) at 31 December 2010 vs. corresponding year class at 31 December 2009
these fish will underpin the SGARA calculations for 30 June 2011
• More fish harvestedo summer risk mitigation has 28.6% more fish harvested by 31 December 2010 vs. corresponding
year class year class
means less fish at risk over summer
• More efficient growing & harvestingo increased pen and lease utilisation and performancep p
o all fish under automatic feeding – ensures feeding is at “right time, level and rate”
o on-site harvesting – leaving fish to grow mitigates risk of loss from towing pens
o automatic net washer technology – improves “in-pen” environment to allow fish to perform at their optim m
32
optimum
o selective Breeding Program - on track with expected improvements with the 2012 Year Class onwards
Sufficient processing capacity effectively now in placeeffectively now in place
Required processing infrastructure now in place to be able to deliver on Strategic Plan FY15• Dover – Wet Processing
o operating at global best practice from a cost $/kg and P&E perspective
o wastewater improvements evident – some further expansion spend required
deliver on Strategic Plan FY15
o risk rating improved
• Huonville – Value Addingo now operating at global best practice from a cost $/kg and P&E perspective
o site capacity now at 28 Hog tonnes per day
o wastewater improvements evident
o risk rating improved
M t V l Addi• Margate – Value Addingo not currently at optimal operational level – focus on utilising spare capacity
o capacity exists to significantly increase throughput – Coles direct supply from Feb 11 will ensure that
Margate will be operating at optimal operational level
operating at global best practice from a cost $/kg and P&E perspective
o focus on fresh fillets & portions, hot smoked and short run production products
33
Significant focus on sustainabilitySignificant focus on sustainability
Tassal is mitigating its risks via its focus on sustainability
• Lead player in long-term industry strategy with sustainability focus – also taking lead in food sector sustainability reporting
• Best practice infrastructure is in place – risk mitigation focus
• Focus on impact mitigation and stakeholder engagement
• Collaborative forward focused research partnerships• Collaborative, forward focused research partnerships
• Strategic planning in areas of sustainability and company reputation up to date
• Compliance, communication, stakeholder, and seal management plans implemented and resourced
• EMS developed – implementation proceeding, reporting framework designed
34
Strategy & outlook4 Strategy & outlook4
35
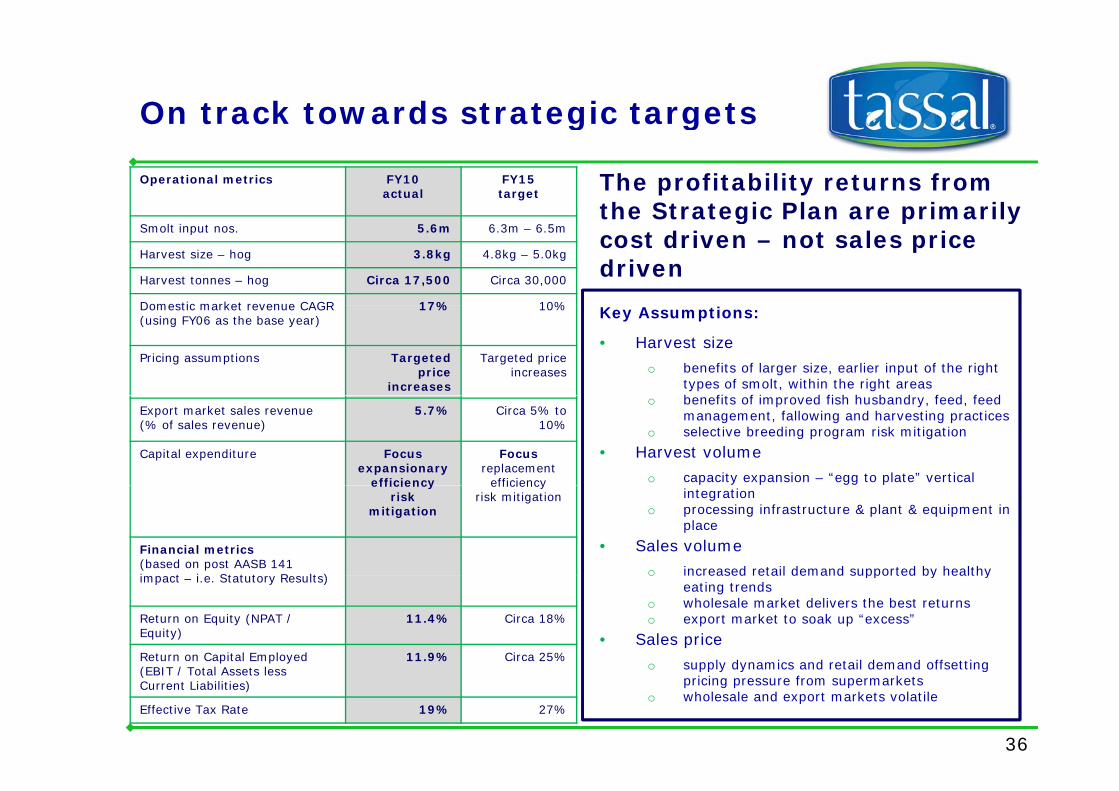
On track towards strategic targetsg g
Operational metrics FY10actual
FY15target
The profitability returns from the Strategic Plan are primarily
Smolt input nos. 5.6m 6.3m – 6.5m
Harvest size – hog 3.8kg 4.8kg – 5.0kg
Harvest tonnes – hog Circa 17,500 Circa 30,000
Domestic market revenue CAGR 17% 10%
the Strategic Plan are primarily cost driven – not sales price driven
Domestic market revenue CAGR (using FY06 as the base year)
17% 10%
Pricing assumptions Targeted price
increases
Targeted price increases
Key Assumptions:
• Harvest size
o benefits of larger size, earlier input of the right types of smolt, within the right areasb fit f i d fi h h b d f d f d
Export market sales revenue (% of sales revenue)
5.7% Circa 5% to 10%
Capital expenditure Focusexpansionary
efficiency
Focusreplacement
efficiency
o benefits of improved fish husbandry, feed, feed management, fallowing and harvesting practices
o selective breeding program risk mitigation
• Harvest volume
o capacity expansion – “egg to plate” vertical efficiencyrisk
mitigation
efficiencyrisk mitigation
Financial metrics(based on post AASB 141 i t i St t t R lt )
integrationo processing infrastructure & plant & equipment in
place
• Sales volume
o increased retail demand supported by healthy impact – i.e. Statutory Results)
Return on Equity (NPAT / Equity)
11.4% Circa 18%
Return on Capital Employed 11.9% Circa 25%
o increased retail demand supported by healthy eating trends
o wholesale market delivers the best returnso export market to soak up “excess”
• Sales price
o supply dynamics and retail demand offsetting
36
(EBIT / Total Assets less Current Liabilities)
Effective Tax Rate 19% 27%
o supply dynamics and retail demand offsetting pricing pressure from supermarkets
o wholesale and export markets volatile
2H11 priorities2H11 priorities
Platform now in place to drive bottom-line performance• Overall priority is to deliver on Strategic Plan FY15
o ensures Tassal is globally cost competitive
o achieves premium returns on sales and marketing initiatives
• Sales priority
o better match domestic supply and demand – through import substitution of Superior Gold, marketing, new product development and stimulating core domestic sales growthdomestic sales growth
o retail plan refocussed
avoid “pushing” retail beyond a desired plan – margin growth will be driven by more base sales, and less direct selling spendy , g p
higher focus on branded products – higher margin; more responsive to activities
prices for fresh fish have increased
o seasonal pricing for wholesale market – higher prices when fish are growing (i.e. maximise fish size)
o higher pricing for export market – higher prices for larger fish (i.e. maximise fish size)
37
fish size)
2H11 priorities (cont’d)2H11 priorities (cont d)
Increasing fish harvest size is key operational focus • Key operational priorities
o increasing fish harvest size is number one operational focusTassal is capturing significant fish growth at present
i tti fi h li d bi t i ifi tl d i f t ff t inputting more fish earlier and bigger to significantly underpin future efforts
summer water temperatures still biggest risk
selective breeding program (50% of stock input from 2012 Year Class) will provide a significant risk mitigant
o stabilising feed pricessignificant work has been undertaken on diet and raw material substitution – this will remain a priority
l i b fit f i f t t do leveraging benefits of infrastructure spendmajority of infrastructure investment for Strategic Plan FY15 complete
global best practice now in place
excellent platform to achieve global cost competitivenessexcellent platform to achieve global cost competitiveness
o getting fish bigger first, and then growing them more efficiently
o maximising the use of current leases and pen stocking densities
38
FY11 OutlookFY11 Outlook
Management comfortable with median broker/analyst forecast FY11 Operational NPAT at c$23.7m• NPAT uplift for FY11 (FY10 Operational NPAT $22.6m) driven primarily by:
o increases in fresh hog (improved market conditions due to supply constraints and given Tassal fish size) and smoked salmon pricing (negotiated increases)
FY11 Operational NPAT at c$23.7m
o improved yield and cost reductions through value add processing
o retail initiatives (Coles direct supply from end of February 2011)
o commissions from Crystal Bay Prawns (full period)o commissions from Crystal Bay Prawns (full period)
o cost initiatives:
negotiated improved packaging costs
d ti i t t i t ti t d t d d h i l ireduction in contract processing costs – negotiated a rate decrease and change in supply mix
reduction in cost of goods sold – reduction in 2009 & 2010 Year Class write-off rates
• Normal summer growing conditions – the effect of the hot summer for 09/10 cost Tassal d $3 t $4 i 2H10 ith th l t th & i l l di t i i t around $3m to $4m in 2H10 with the lost growth & survival leading to an increase in cost
of goods sold
39
Board strategic review5 Board strategic review5
40
Strategic review updateStrategic review update
The Board is comprehensively evaluating all strategic options available to Tassalavailable to Tassal
• The Board of Tassal announced a Strategic Review on 10 December 2010 with the objective of evaluating the company’s strategic options to ensure Tassal shareholder value is maximised maximised
• The Strategic Review is addressing:
o a review of the existing Strategic Plan out to FY15 ... this has been reconfirmed as having the potential to create significant value for shareholders in excess of the having the potential to create significant value for shareholders in excess of the current share price
o a review of acquisitions that may add value to shareholders, but that do not distract management from the implementation of the five-year Strategic Plan ... to date, no opportunity has been identified that has satisfied these conditions
o a review of change of control proposals from third parties
41
Strategic review updateStrategic review update
Due diligence continuing
C fid i li A h b d d d dili i f i h b • Confidentiality Agreements have been executed and due diligence information has been provided to a number of interested parties. Due diligence is continuing
• Should a final proposal be presented on appropriate terms, it is the Board’s current intention that this would be presented to shareholders along with an evaluation of other intention that this would be presented to shareholders along with an evaluation of other options available to Tassal so that shareholders can properly consider which path provides the best overall proposition
o as is normal in such processes, there is no assurance that any final proposal for a h f t l f th ill b i d t d diti th t th change of control of the company will be received on terms and conditions that the
Board considers appropriate to be put to shareholders
• The Board of Tassal will keep shareholders updated regularly
42
Summary6 Summary6
43
In summaryIn summary...
• 1H11 results reflect investment in long term growth
• Significant operational achievements – allowing focus to bring forward some of the • Significant operational achievements allowing focus to bring forward some of the benefits of the Strategic Plan identified for FY13 back into FY12
• Market fundamentals differing across sectorso domestic market – retail market strong, wholesale market in decline
o export market - hog prices increasing due to lower global supply
o 1H11 saw lower feed costs – some uncertainty about fishmeal & fish oil prices moving forward (substitutability with diet formulations to act as a mitigant for potential feed price increases))
o attractive opportunities to further penetrate retail market – new product opportunities, together with Coles direct supply
• Strong balance sheet – with comfortable gearing levels
• Platform for growth to deliver Strategic Plan FY15o major capex infrastructure spend complete – reduction in spend in 2H11 and beyond
o global best practice facilities in place – with the benefits of these now clearly evident in operational performance achievedp p
o more smolt, earlier input & larger size at input = larger growing fish
• Well positioned to grow shareholder value
• Management comfortable with median broker/analyst operational NPAT forecast for
44
FY11 at c$23.7m
Any questions?Any questions?
45
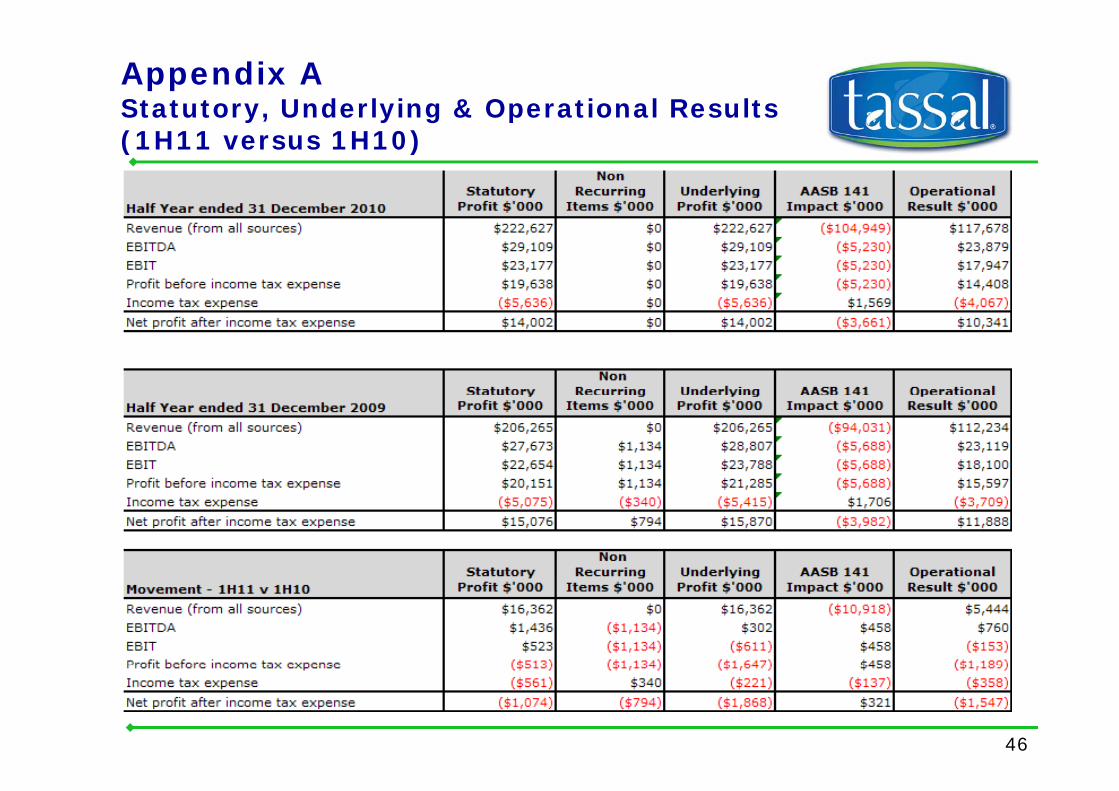
Appendix A Statutory, Underlying & Operational Results (1H11 versus 1H10)
46
DisclaimerDisclaimer
This presentation has been prepared by Tassal Group Limited for professional investors The information This presentation has been prepared by Tassal Group Limited for professional investors. The information contained in this presentation is for information purposes only and does not constitute an offer to issue, or arrange to issue, securities or other financial products. The information contained in this presentation is not investment or financial product advice and is not intended to be used as the basis for making an investment decision. The presentation has been prepared without taking into account the investment objectives, financial situation or particular need of any particular person.
No representation or warranty, express or implied, is made as to the fairness, accuracy, completeness or correctness of the information, opinions and conclusions contained in the presentation. To the maximum extent permitted by law, none of Tassal Group Limited, its directors, employees or agents, nor any other extent permitted by law, none of Tassal Group Limited, its directors, employees or agents, nor any other person accepts any liability, including, without limitation, any liability arising out of fault. In particular, no representation or warranty, express or implied is given as to the accuracy, completeness or correctness, likelihood of achievement or reasonableness of any forecasts, prospects or returns contained in this presentation nor is any obligation assumed to update such information. Such forecasts, prospects or returns are by their nature subject to significant uncertainties and contingenciesare by their nature subject to significant uncertainties and contingencies.
Before making an investment decision, you should consider, with or without the assistance of a financial adviser, whether an investment is appropriate in light of your particular investment needs, objectives and financial circumstances. Past performance is no guarantee of future performance.
The distribution of this document is jurisdictions outside Australia may be restricted by law. Any recipient of this document outside Australia must seek advice on and observe such restrictions.
47