Embed Size (px)
Citation preview
CAP Fitness Check: Executive Summary
1
Is the CAP Fit for purpose? An evidence-based fitness-check assessment
Leipzig, November 2017
Guy Pe’er, Sebastian Lakner, Robert Müller, Gioele Passoni, Vasileios Bontzorlos, Dagmar Clough, Francisco Moreira, Clémentine Azam, Jurij Berger, Peter Bezak, Aletta Bonn, Bernd Hansjürgens, Lars Hartmann, Janina Kleemann, Angela Lomba, Amanda Sahrbacher, Stefan Schindler, Christian Schleyer, Jenny Schmidt, Stefan Schüler, Clélia Sirami, Marie von Meyer-Höfer, Yves Zinngrebe
Additional members of the scoping committee: Tim Benton, Lynn Dicks, Kaley Hart, Jennifer Hauck, Felix Herzog, William Sutherland.
The work has gone through external evaluation by Iryna Herzon, Alan Matthews, Rainer
Oppermann, and Stephan Von Cramon-Taubadel.
Commissioned by
Stichting BirdLife Europe and the European Environmental Bureau (EEB)
and further supported and funded by
Naturschutzbund Deutschland (NABU), German Centre for Integrative Biodiversity Research (iDiv) Jena-Halle-Leipzig, Helmholtz Centre for Environmental Research – UFZ, the University of Göttingen, The Greens / The European Free Alliance in the European Parliament, and the
Group of the Progressive Alliance of Socialists & Democrats in the European Parliament
Disclaimer
The work has been conducted as an independent scientific process and its outcomes represent the
knowledge, experience and opinions of its authors alone.
CAP Fitness Check: Executive Summary
2
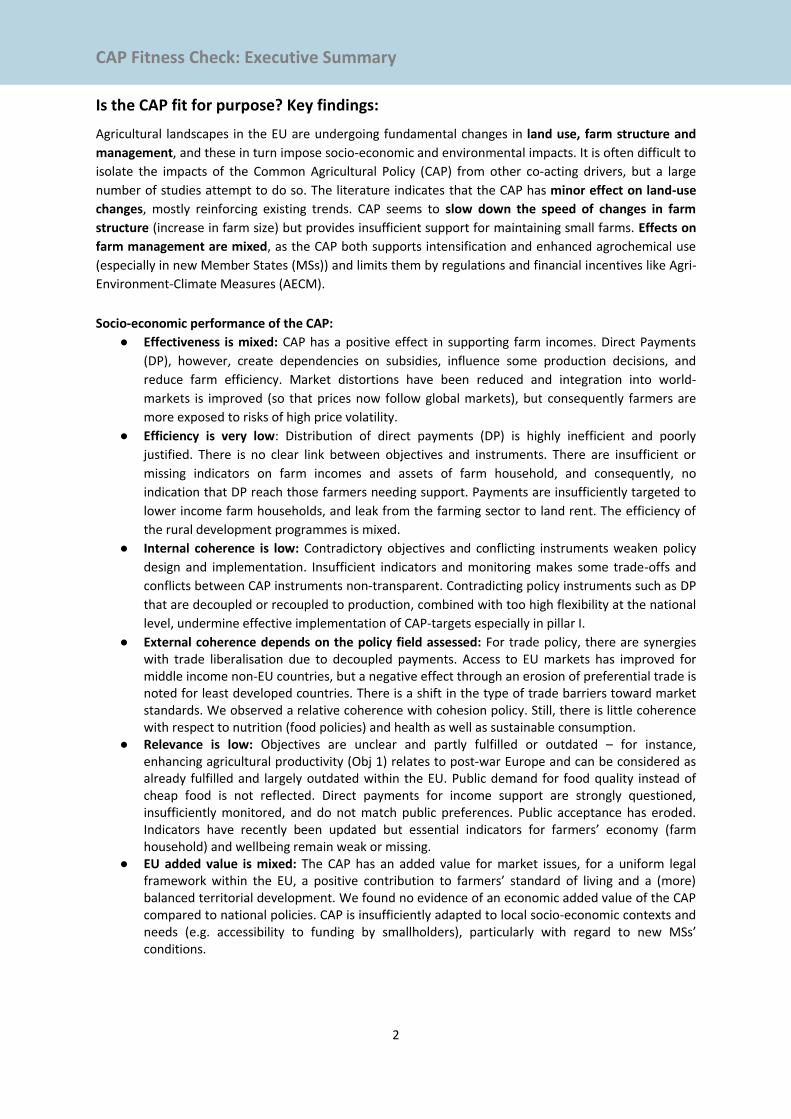
Is the CAP fit for purpose? Key findings:
Agricultural landscapes in the EU are undergoing fundamental changes in land use, farm structure and
management, and these in turn impose socio-economic and environmental impacts. It is often difficult to
isolate the impacts of the Common Agricultural Policy (CAP) from other co-acting drivers, but a large
number of studies attempt to do so. The literature indicates that the CAP has minor effect on land-use
changes, mostly reinforcing existing trends. CAP seems to slow down the speed of changes in farm
structure (increase in farm size) but provides insufficient support for maintaining small farms. Effects on
farm management are mixed, as the CAP both supports intensification and enhanced agrochemical use
(especially in new Member States (MSs)) and limits them by regulations and financial incentives like Agri-
Environment-Climate Measures (AECM).
Socio-economic performance of the CAP:
● Effectiveness is mixed: CAP has a positive effect in supporting farm incomes. Direct Payments
(DP), however, create dependencies on subsidies, influence some production decisions, and
reduce farm efficiency. Market distortions have been reduced and integration into world-
markets is improved (so that prices now follow global markets), but consequently farmers are
more exposed to risks of high price volatility.
● Efficiency is very low: Distribution of direct payments (DP) is highly inefficient and poorly
justified. There is no clear link between objectives and instruments. There are insufficient or
missing indicators on farm incomes and assets of farm household, and consequently, no
indication that DP reach those farmers needing support. Payments are insufficiently targeted to
lower income farm households, and leak from the farming sector to land rent. The efficiency of
the rural development programmes is mixed.
● Internal coherence is low: Contradictory objectives and conflicting instruments weaken policy
design and implementation. Insufficient indicators and monitoring makes some trade-offs and
conflicts between CAP instruments non-transparent. Contradicting policy instruments such as DP
that are decoupled or recoupled to production, combined with too high flexibility at the national
level, undermine effective implementation of CAP-targets especially in pillar I.
● External coherence depends on the policy field assessed: For trade policy, there are synergies with trade liberalisation due to decoupled payments. Access to EU markets has improved for middle income non-EU countries, but a negative effect through an erosion of preferential trade is noted for least developed countries. There is a shift in the type of trade barriers toward market standards. We observed a relative coherence with cohesion policy. Still, there is little coherence with respect to nutrition (food policies) and health as well as sustainable consumption.
● Relevance is low: Objectives are unclear and partly fulfilled or outdated – for instance, enhancing agricultural productivity (Obj 1) relates to post-war Europe and can be considered as already fulfilled and largely outdated within the EU. Public demand for food quality instead of cheap food is not reflected. Direct payments for income support are strongly questioned, insufficiently monitored, and do not match public preferences. Public acceptance has eroded. Indicators have recently been updated but essential indicators for farmers’ economy (farm household) and wellbeing remain weak or missing.
● EU added value is mixed: The CAP has an added value for market issues, for a uniform legal framework within the EU, a positive contribution to farmers’ standard of living and a (more) balanced territorial development. We found no evidence of an economic added value of the CAP compared to national policies. CAP is insufficiently adapted to local socio-economic contexts and needs (e.g. accessibility to funding by smallholders), particularly with regard to new MSs’ conditions.
CAP Fitness Check: Executive Summary
3
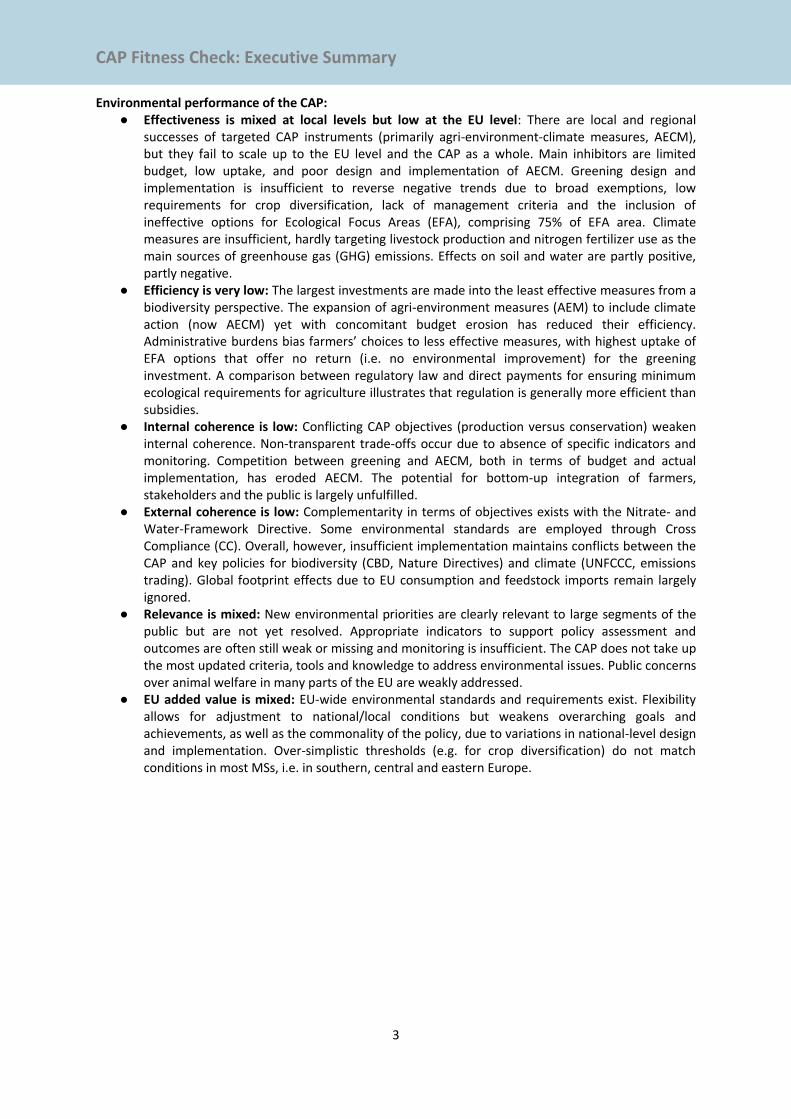
Environmental performance of the CAP: ● Effectiveness is mixed at local levels but low at the EU level: There are local and regional
successes of targeted CAP instruments (primarily agri-environment-climate measures, AECM), but they fail to scale up to the EU level and the CAP as a whole. Main inhibitors are limited budget, low uptake, and poor design and implementation of AECM. Greening design and implementation is insufficient to reverse negative trends due to broad exemptions, low requirements for crop diversification, lack of management criteria and the inclusion of ineffective options for Ecological Focus Areas (EFA), comprising 75% of EFA area. Climate measures are insufficient, hardly targeting livestock production and nitrogen fertilizer use as the main sources of greenhouse gas (GHG) emissions. Effects on soil and water are partly positive, partly negative.
● Efficiency is very low: The largest investments are made into the least effective measures from a biodiversity perspective. The expansion of agri-environment measures (AEM) to include climate action (now AECM) yet with concomitant budget erosion has reduced their efficiency. Administrative burdens bias farmers’ choices to less effective measures, with highest uptake of EFA options that offer no return (i.e. no environmental improvement) for the greening investment. A comparison between regulatory law and direct payments for ensuring minimum ecological requirements for agriculture illustrates that regulation is generally more efficient than subsidies.
● Internal coherence is low: Conflicting CAP objectives (production versus conservation) weaken internal coherence. Non-transparent trade-offs occur due to absence of specific indicators and monitoring. Competition between greening and AECM, both in terms of budget and actual implementation, has eroded AECM. The potential for bottom-up integration of farmers, stakeholders and the public is largely unfulfilled.
● External coherence is low: Complementarity in terms of objectives exists with the Nitrate- and Water-Framework Directive. Some environmental standards are employed through Cross Compliance (CC). Overall, however, insufficient implementation maintains conflicts between the CAP and key policies for biodiversity (CBD, Nature Directives) and climate (UNFCCC, emissions trading). Global footprint effects due to EU consumption and feedstock imports remain largely ignored.
● Relevance is mixed: New environmental priorities are clearly relevant to large segments of the public but are not yet resolved. Appropriate indicators to support policy assessment and outcomes are often still weak or missing and monitoring is insufficient. The CAP does not take up the most updated criteria, tools and knowledge to address environmental issues. Public concerns over animal welfare in many parts of the EU are weakly addressed.
● EU added value is mixed: EU-wide environmental standards and requirements exist. Flexibility allows for adjustment to national/local conditions but weakens overarching goals and achievements, as well as the commonality of the policy, due to variations in national-level design and implementation. Over-simplistic thresholds (e.g. for crop diversification) do not match conditions in most MSs, i.e. in southern, central and eastern Europe.
CAP Fitness Check: Executive Summary
4
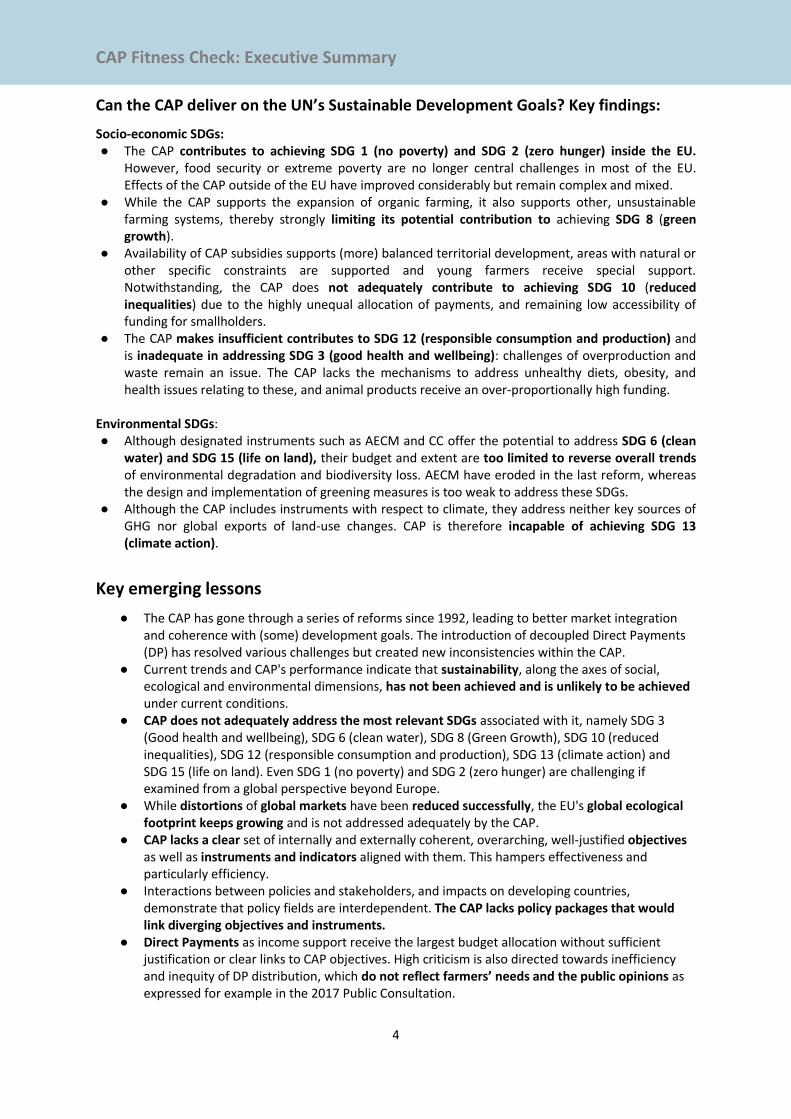
Can the CAP deliver on the UN’s Sustainable Development Goals? Key findings:
Socio-economic SDGs: ● The CAP contributes to achieving SDG 1 (no poverty) and SDG 2 (zero hunger) inside the EU.
However, food security or extreme poverty are no longer central challenges in most of the EU. Effects of the CAP outside of the EU have improved considerably but remain complex and mixed.
● While the CAP supports the expansion of organic farming, it also supports other, unsustainable farming systems, thereby strongly limiting its potential contribution to achieving SDG 8 (green growth).
● Availability of CAP subsidies supports (more) balanced territorial development, areas with natural or other specific constraints are supported and young farmers receive special support. Notwithstanding, the CAP does not adequately contribute to achieving SDG 10 (reduced inequalities) due to the highly unequal allocation of payments, and remaining low accessibility of funding for smallholders.
● The CAP makes insufficient contributes to SDG 12 (responsible consumption and production) and is inadequate in addressing SDG 3 (good health and wellbeing): challenges of overproduction and waste remain an issue. The CAP lacks the mechanisms to address unhealthy diets, obesity, and health issues relating to these, and animal products receive an over-proportionally high funding.
Environmental SDGs: ● Although designated instruments such as AECM and CC offer the potential to address SDG 6 (clean
water) and SDG 15 (life on land), their budget and extent are too limited to reverse overall trends of environmental degradation and biodiversity loss. AECM have eroded in the last reform, whereas the design and implementation of greening measures is too weak to address these SDGs.
● Although the CAP includes instruments with respect to climate, they address neither key sources of GHG nor global exports of land-use changes. CAP is therefore incapable of achieving SDG 13 (climate action).
Key emerging lessons
● The CAP has gone through a series of reforms since 1992, leading to better market integration and coherence with (some) development goals. The introduction of decoupled Direct Payments (DP) has resolved various challenges but created new inconsistencies within the CAP.
● Current trends and CAP's performance indicate that sustainability, along the axes of social, ecological and environmental dimensions, has not been achieved and is unlikely to be achieved under current conditions.
● CAP does not adequately address the most relevant SDGs associated with it, namely SDG 3 (Good health and wellbeing), SDG 6 (clean water), SDG 8 (Green Growth), SDG 10 (reduced inequalities), SDG 12 (responsible consumption and production), SDG 13 (climate action) and SDG 15 (life on land). Even SDG 1 (no poverty) and SDG 2 (zero hunger) are challenging if examined from a global perspective beyond Europe.
● While distortions of global markets have been reduced successfully, the EU's global ecological footprint keeps growing and is not addressed adequately by the CAP.
● CAP lacks a clear set of internally and externally coherent, overarching, well-justified objectives as well as instruments and indicators aligned with them. This hampers effectiveness and particularly efficiency.
● Interactions between policies and stakeholders, and impacts on developing countries, demonstrate that policy fields are interdependent. The CAP lacks policy packages that would link diverging objectives and instruments.
● Direct Payments as income support receive the largest budget allocation without sufficient justification or clear links to CAP objectives. High criticism is also directed towards inefficiency and inequity of DP distribution, which do not reflect farmers’ needs and the public opinions as expressed for example in the 2017 Public Consultation.
CAP Fitness Check: Executive Summary
5
● The CAP’s effects on small farm holders are of high importance for socio-economic and
environmental success, particularly in Eastern Europe.
● The environmental engagement of the CAP is insufficient to halt environmental degradation,
the decline of biodiversity and ecosystem services in the EU, and to cope with the challenges of
climate change, with consequences for farming and farmers in terms of enhanced risks.
● Available knowledge is often poorly incorporated into the CAP design and implementation, for example through lack of landscape-level and community-targeted implementation to improve socio-economic and environmental performance, neglecting opportunities for GHG reduction, or the design of greening measures with insufficient uptake of existing knowledge and experience from AECM.
● Administrative burdens represent important barriers for successful implementation, especially in the area of biodiversity.
● Power struggles among interest groups reduce the effectiveness, efficiency and coherence, and seem to hamper public acceptance of the CAP.
CAP Fitness Check: Executive Summary
6
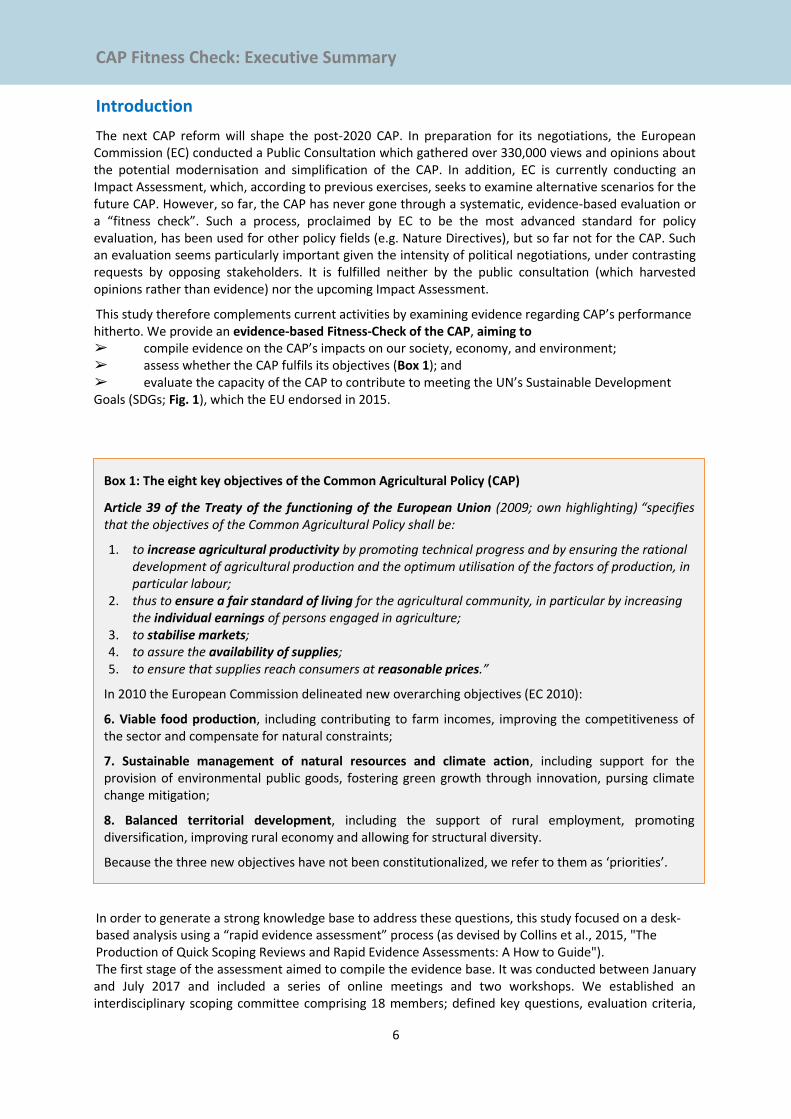
Introduction
The next CAP reform will shape the post-2020 CAP. In preparation for its negotiations, the European Commission (EC) conducted a Public Consultation which gathered over 330,000 views and opinions about the potential modernisation and simplification of the CAP. In addition, EC is currently conducting an Impact Assessment, which, according to previous exercises, seeks to examine alternative scenarios for the future CAP. However, so far, the CAP has never gone through a systematic, evidence-based evaluation or a “fitness check”. Such a process, proclaimed by EC to be the most advanced standard for policy evaluation, has been used for other policy fields (e.g. Nature Directives), but so far not for the CAP. Such an evaluation seems particularly important given the intensity of political negotiations, under contrasting requests by opposing stakeholders. It is fulfilled neither by the public consultation (which harvested opinions rather than evidence) nor the upcoming Impact Assessment.
This study therefore complements current activities by examining evidence regarding CAP’s performance hitherto. We provide an evidence-based Fitness-Check of the CAP, aiming to ➢ compile evidence on the CAP’s impacts on our society, economy, and environment; ➢ assess whether the CAP fulfils its objectives (Box 1); and ➢ evaluate the capacity of the CAP to contribute to meeting the UN’s Sustainable Development Goals (SDGs; Fig. 1), which the EU endorsed in 2015.
In order to generate a strong knowledge base to address these questions, this study focused on a desk-based analysis using a “rapid evidence assessment” process (as devised by Collins et al., 2015, "The Production of Quick Scoping Reviews and Rapid Evidence Assessments: A How to Guide"). The first stage of the assessment aimed to compile the evidence base. It was conducted between January and July 2017 and included a series of online meetings and two workshops. We established an interdisciplinary scoping committee comprising 18 members; defined key questions, evaluation criteria,
Box 1: The eight key objectives of the Common Agricultural Policy (CAP)
Article 39 of the Treaty of the functioning of the European Union (2009; own highlighting) “specifies that the objectives of the Common Agricultural Policy shall be:
1. to increase agricultural productivity by promoting technical progress and by ensuring the rational development of agricultural production and the optimum utilisation of the factors of production, in particular labour;
2. thus to ensure a fair standard of living for the agricultural community, in particular by increasing the individual earnings of persons engaged in agriculture;
3. to stabilise markets; 4. to assure the availability of supplies; 5. to ensure that supplies reach consumers at reasonable prices.”
In 2010 the European Commission delineated new overarching objectives (EC 2010):
6. Viable food production, including contributing to farm incomes, improving the competitiveness of the sector and compensate for natural constraints;
7. Sustainable management of natural resources and climate action, including support for the provision of environmental public goods, fostering green growth through innovation, pursing climate change mitigation;
8. Balanced territorial development, including the support of rural employment, promoting diversification, improving rural economy and allowing for structural diversity.
Because the three new objectives have not been constitutionalized, we refer to them as ‘priorities’.
CAP Fitness Check: Executive Summary
7
and SDGs to target; and delineated the methods of literature search and a working protocol, addressing, for example, inclusion and exclusion criteria. We searched available literature covering socio-economic and environmental aspects, trying to achieve a balanced knowledge base both thematically and geographically. We separated publications addressing baseline phenomena and trends relating to agriculture in general, from those providing a direct evaluation of the CAP, its instruments and impacts. Our assessment included peer-reviewed scientific literature from 2006-2017 (i.e. after the Fischler-Reform of 2005), as well as reports and additional data-sources such as Eurostat, FAOSTAT, and national/EU/EC reports and data. As a result, two databases were built. The first database lists all publications potentially relevant for the assessment, while the second database corresponds to the outcome of an in-depth assessment of a subset of relevant publications. Evidence was collated into the in-depth database either by our team, or via an online survey that was open for inputs between March and July 2017. The call for evidence was spread among many hundreds of experts across Europe and also linked to the EU-funded EKLIPSE project.
In order to categorise the collated evidence, we followed the EC’s criteria for policy Fitness-Checks by adopting six evaluation criteria for the CAP:
1. Effectiveness: Do the CAP design, instruments, and implementation contribute to meeting its objectives?
2. Efficiency: Are the costs reasonable and in proportion to the benefits achieved, also compared to alternative mechanisms? Are the investments well-placed and distributed?
3. Internal Coherence: Do CAP objectives and instruments complement or conflict with each other in supporting its objectives and implementation?
4. External Coherence: Does the CAP support, complement, or conflict (with) other EU and international policies in terms of objectives and implementation, and/or effects?
5. Relevance: Is the CAP relevant to current challenges and the priorities set by EU citizens, farmers, and policy makers? Is it using (and supporting) the most updated criteria, tools, and knowledge?
6. EU Added Value: Does the CAP address challenges better than national-, regional- or local-level solutions?
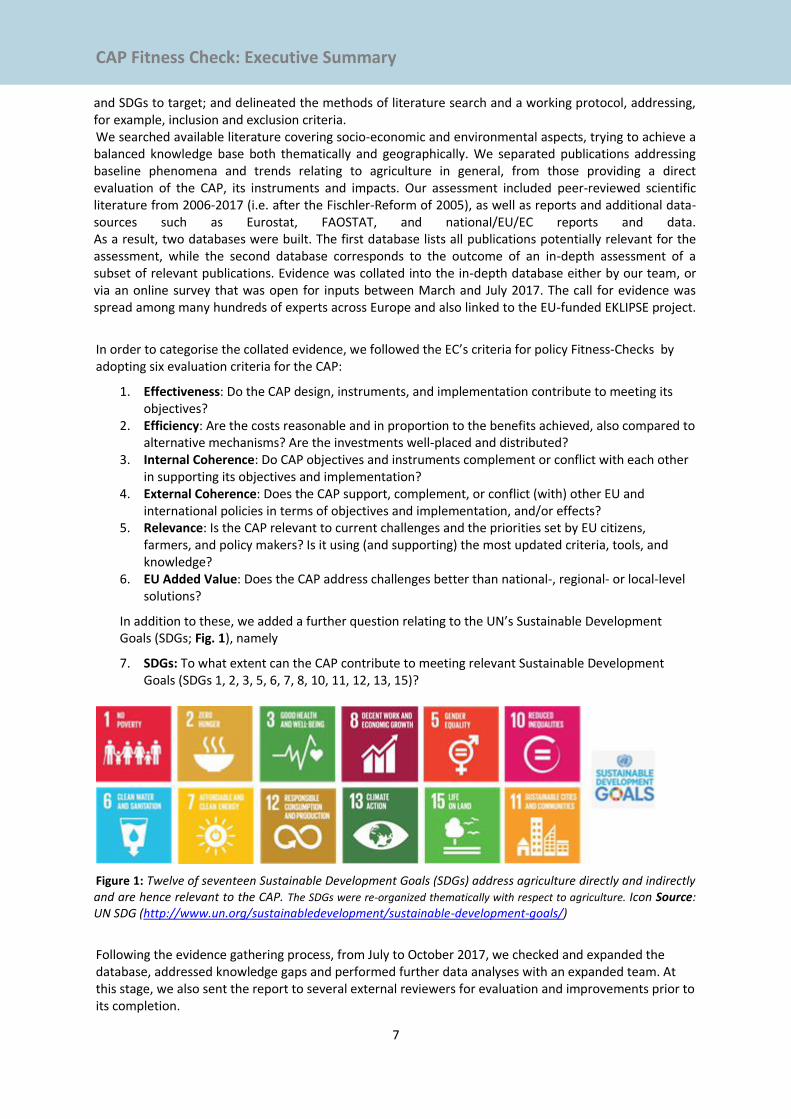
In addition to these, we added a further question relating to the UN’s Sustainable Development Goals (SDGs; Fig. 1), namely
7. SDGs: To what extent can the CAP contribute to meeting relevant Sustainable Development Goals (SDGs 1, 2, 3, 5, 6, 7, 8, 10, 11, 12, 13, 15)?
Figure 1: Twelve of seventeen Sustainable Development Goals (SDGs) address agriculture directly and indirectly and are hence relevant to the CAP. The SDGs were re-organized thematically with respect to agriculture. Icon Source: UN SDG (http://www.un.org/sustainabledevelopment/sustainable-development-goals/)
Following the evidence gathering process, from July to October 2017, we checked and expanded the database, addressed knowledge gaps and performed further data analyses with an expanded team. At this stage, we also sent the report to several external reviewers for evaluation and improvements prior to its completion.
CAP Fitness Check: Executive Summary
8
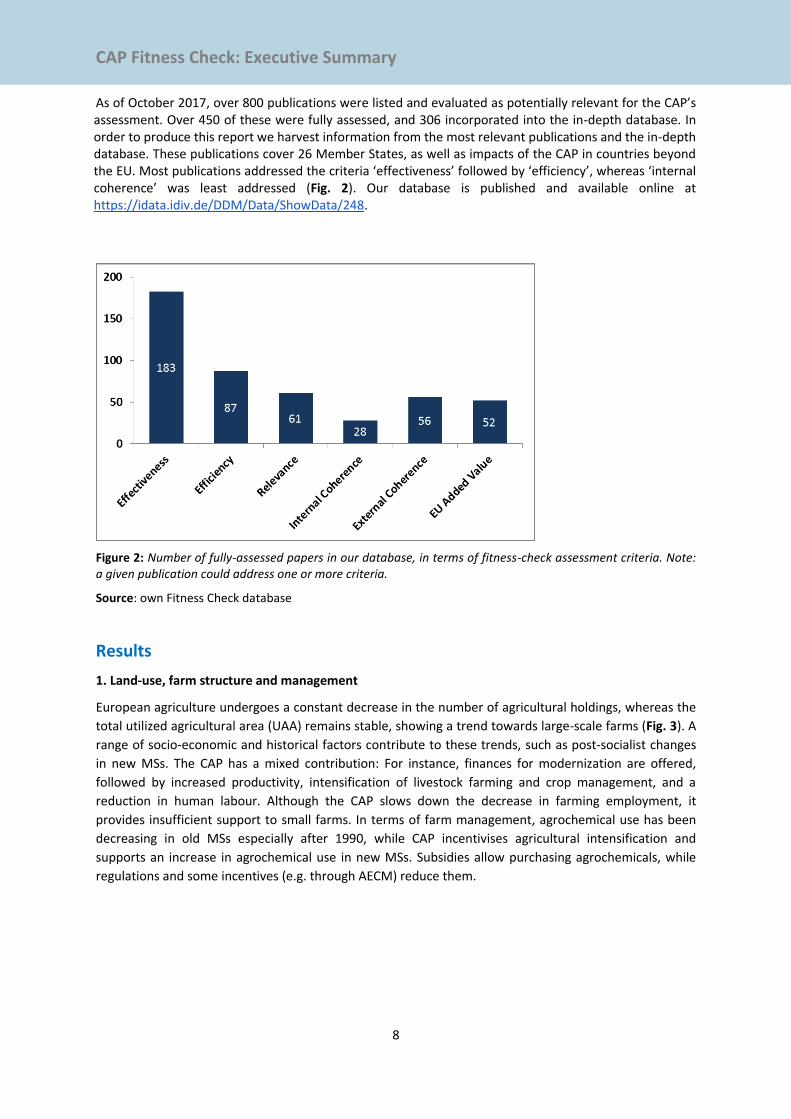
As of October 2017, over 800 publications were listed and evaluated as potentially relevant for the CAP’s assessment. Over 450 of these were fully assessed, and 306 incorporated into the in-depth database. In order to produce this report we harvest information from the most relevant publications and the in-depth database. These publications cover 26 Member States, as well as impacts of the CAP in countries beyond the EU. Most publications addressed the criteria ‘effectiveness’ followed by ‘efficiency’, whereas ‘internal coherence’ was least addressed (Fig. 2). Our database is published and available online at https://idata.idiv.de/DDM/Data/ShowData/248.
Figure 2: Number of fully-assessed papers in our database, in terms of fitness-check assessment criteria. Note: a given publication could address one or more criteria.
Source: own Fitness Check database
Results
1. Land-use, farm structure and management
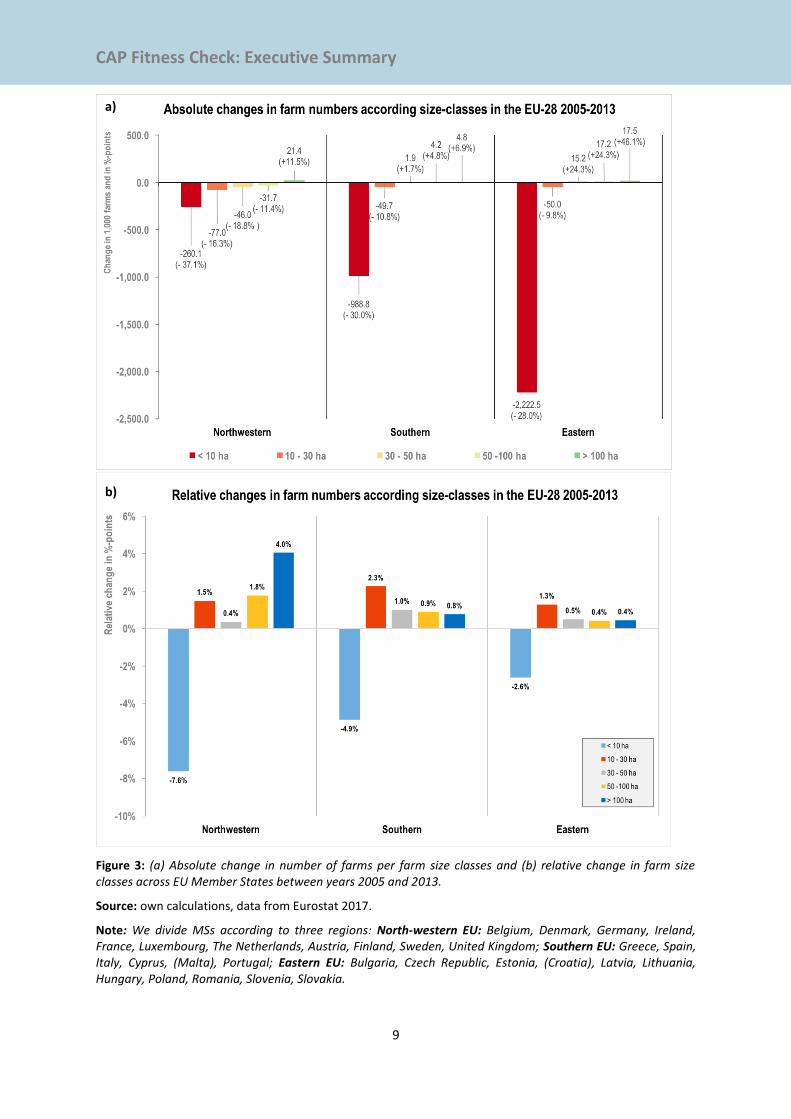
European agriculture undergoes a constant decrease in the number of agricultural holdings, whereas the
total utilized agricultural area (UAA) remains stable, showing a trend towards large-scale farms (Fig. 3). A
range of socio-economic and historical factors contribute to these trends, such as post-socialist changes
in new MSs. The CAP has a mixed contribution: For instance, finances for modernization are offered,
followed by increased productivity, intensification of livestock farming and crop management, and a
reduction in human labour. Although the CAP slows down the decrease in farming employment, it
provides insufficient support to small farms. In terms of farm management, agrochemical use has been
decreasing in old MSs especially after 1990, while CAP incentivises agricultural intensification and
supports an increase in agrochemical use in new MSs. Subsidies allow purchasing agrochemicals, while
regulations and some incentives (e.g. through AECM) reduce them.
CAP Fitness Check: Executive Summary
9
Figure 3: (a) Absolute change in number of farms per farm size classes and (b) relative change in farm size classes across EU Member States between years 2005 and 2013.
Source: own calculations, data from Eurostat 2017.
Note: We divide MSs according to three regions: North-western EU: Belgium, Denmark, Germany, Ireland, France, Luxembourg, The Netherlands, Austria, Finland, Sweden, United Kingdom; Southern EU: Greece, Spain, Italy, Cyprus, (Malta), Portugal; Eastern EU: Bulgaria, Czech Republic, Estonia, (Croatia), Latvia, Lithuania, Hungary, Poland, Romania, Slovenia, Slovakia.
a)
b)
CAP Fitness Check: Executive Summary
10
2. Effectiveness
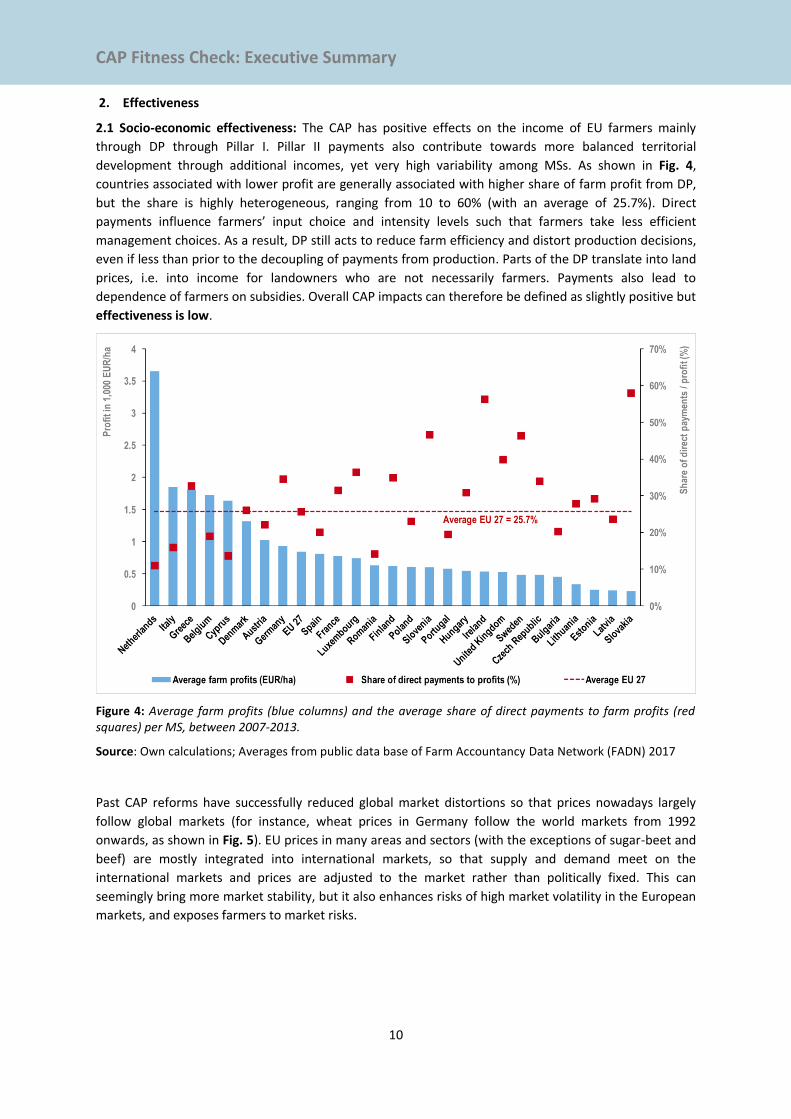
2.1 Socio-economic effectiveness: The CAP has positive effects on the income of EU farmers mainly
through DP through Pillar I. Pillar II payments also contribute towards more balanced territorial
development through additional incomes, yet very high variability among MSs. As shown in Fig. 4,
countries associated with lower profit are generally associated with higher share of farm profit from DP,
but the share is highly heterogeneous, ranging from 10 to 60% (with an average of 25.7%). Direct
payments influence farmers’ input choice and intensity levels such that farmers take less efficient
management choices. As a result, DP still acts to reduce farm efficiency and distort production decisions,
even if less than prior to the decoupling of payments from production. Parts of the DP translate into land
prices, i.e. into income for landowners who are not necessarily farmers. Payments also lead to
dependence of farmers on subsidies. Overall CAP impacts can therefore be defined as slightly positive but
effectiveness is low.
Figure 4: Average farm profits (blue columns) and the average share of direct payments to farm profits (red squares) per MS, between 2007-2013.
Source: Own calculations; Averages from public data base of Farm Accountancy Data Network (FADN) 2017
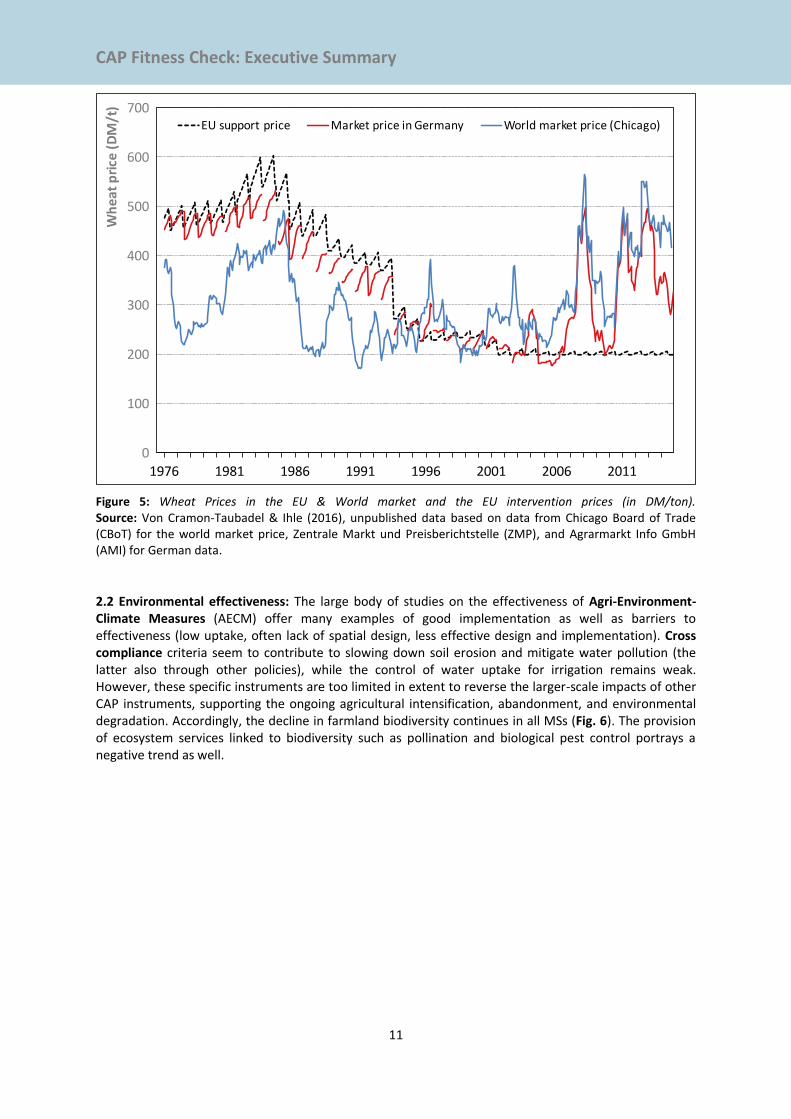
Past CAP reforms have successfully reduced global market distortions so that prices nowadays largely
follow global markets (for instance, wheat prices in Germany follow the world markets from 1992
onwards, as shown in Fig. 5). EU prices in many areas and sectors (with the exceptions of sugar-beet and
beef) are mostly integrated into international markets, so that supply and demand meet on the
international markets and prices are adjusted to the market rather than politically fixed. This can
seemingly bring more market stability, but it also enhances risks of high market volatility in the European
markets, and exposes farmers to market risks.
CAP Fitness Check: Executive Summary
11
Figure 5: Wheat Prices in the EU & World market and the EU intervention prices (in DM/ton). Source: Von Cramon-Taubadel & Ihle (2016), unpublished data based on data from Chicago Board of Trade (CBoT) for the world market price, Zentrale Markt und Preisberichtstelle (ZMP), and Agrarmarkt Info GmbH (AMI) for German data.
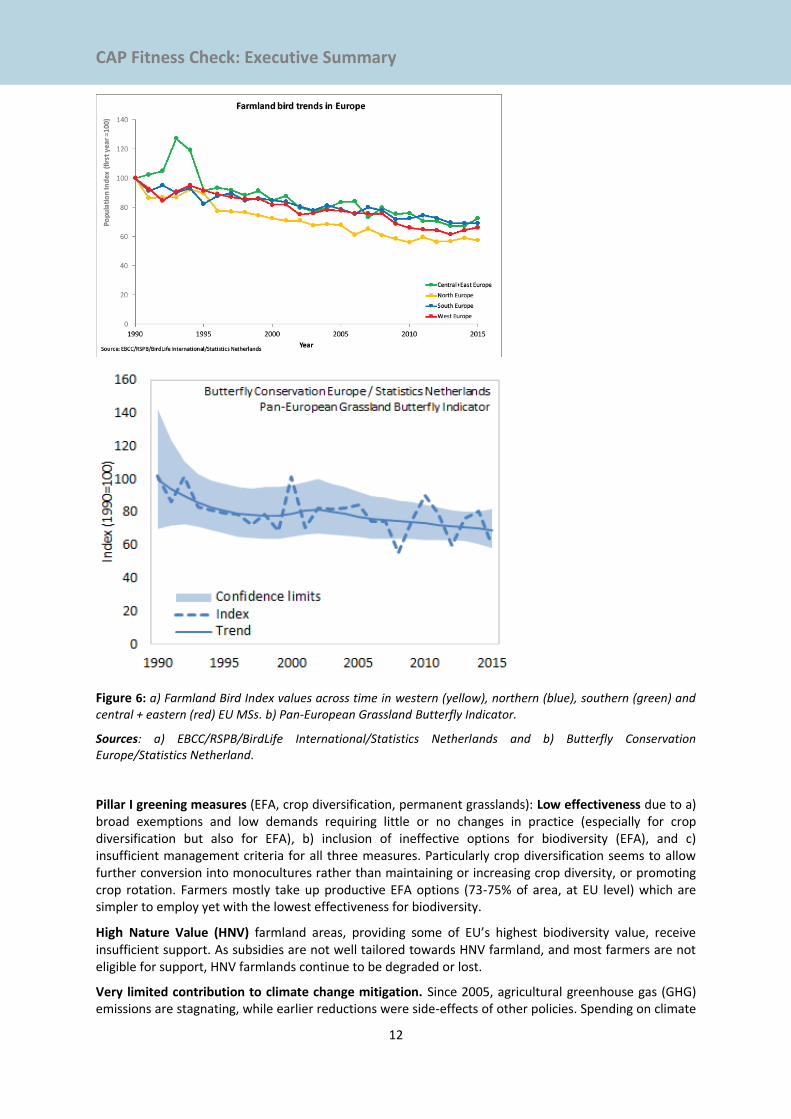
2.2 Environmental effectiveness: The large body of studies on the effectiveness of Agri-Environment-Climate Measures (AECM) offer many examples of good implementation as well as barriers to effectiveness (low uptake, often lack of spatial design, less effective design and implementation). Cross compliance criteria seem to contribute to slowing down soil erosion and mitigate water pollution (the latter also through other policies), while the control of water uptake for irrigation remains weak. However, these specific instruments are too limited in extent to reverse the larger-scale impacts of other CAP instruments, supporting the ongoing agricultural intensification, abandonment, and environmental degradation. Accordingly, the decline in farmland biodiversity continues in all MSs (Fig. 6). The provision of ecosystem services linked to biodiversity such as pollination and biological pest control portrays a negative trend as well.
0
100
200
300
400
500
600
700
1976 1981 1986 1991 1996 2001 2006 2011
Wheatprice(DM/t)
EUsupportprice MarketpriceinGermany Worldmarketprice(Chicago)
CAP Fitness Check: Executive Summary
12
Figure 6: a) Farmland Bird Index values across time in western (yellow), northern (blue), southern (green) and central + eastern (red) EU MSs. b) Pan-European Grassland Butterfly Indicator.
Sources: a) EBCC/RSPB/BirdLife International/Statistics Netherlands and b) Butterfly Conservation Europe/Statistics Netherland.
Pillar I greening measures (EFA, crop diversification, permanent grasslands): Low effectiveness due to a) broad exemptions and low demands requiring little or no changes in practice (especially for crop diversification but also for EFA), b) inclusion of ineffective options for biodiversity (EFA), and c) insufficient management criteria for all three measures. Particularly crop diversification seems to allow further conversion into monocultures rather than maintaining or increasing crop diversity, or promoting crop rotation. Farmers mostly take up productive EFA options (73-75% of area, at EU level) which are simpler to employ yet with the lowest effectiveness for biodiversity.
High Nature Value (HNV) farmland areas, providing some of EU’s highest biodiversity value, receive insufficient support. As subsidies are not well tailored towards HNV farmland, and most farmers are not eligible for support, HNV farmlands continue to be degraded or lost.
Very limited contribution to climate change mitigation. Since 2005, agricultural greenhouse gas (GHG) emissions are stagnating, while earlier reductions were side-effects of other policies. Spending on climate
CAP Fitness Check: Executive Summary
13
measures within AECM is marginal. Targeted action based on existing GHG mitigation potentials is missing, particularly for livestock farming which is responsible for over ⅔ of agricultural GHG emissions. Nitrogen fertilizer use as well as drainage and intensive land-use on high organic soils (peat soils) are also among the most important GHG sources. Emissions outside the EU caused by deforestation due to feedstock imports are not tackled by the CAP. This further contributes to a negative global climatic footprint of the EU.
3. Efficiency Our analysis reveals very low efficiency since costs are disproportionate to the benefits incurred, and investments are not optimally distributed (socially, economically and geographically).
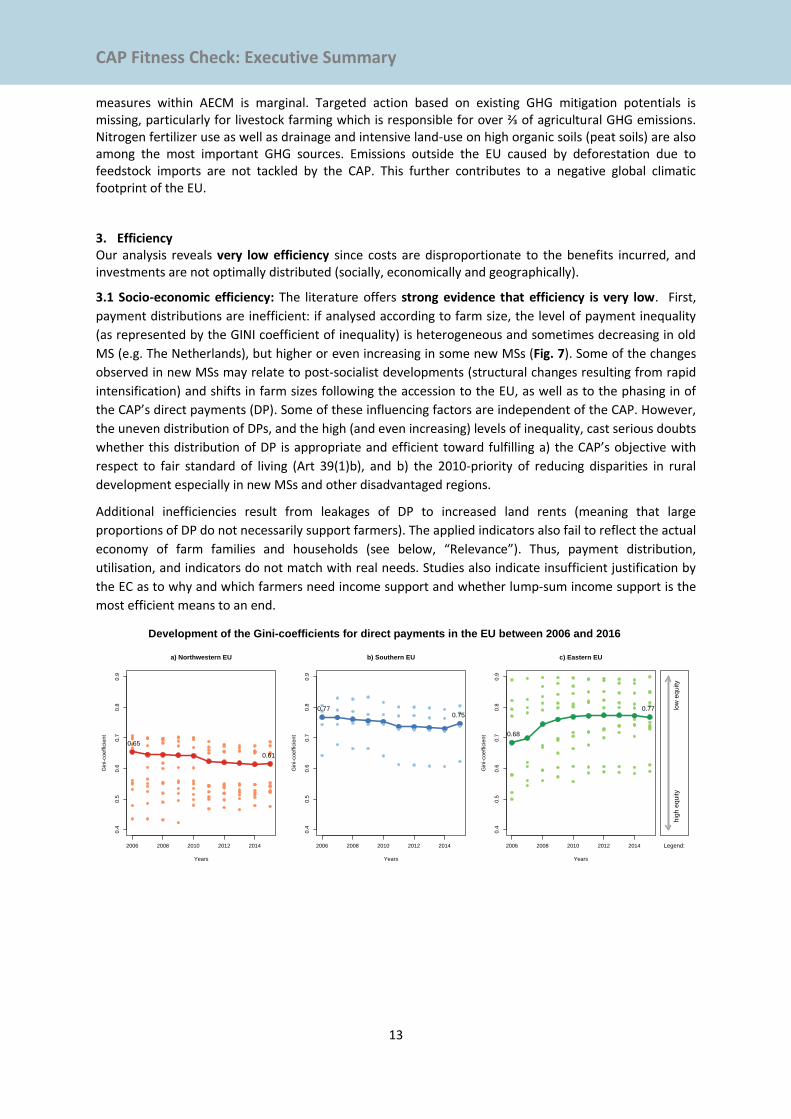
3.1 Socio-economic efficiency: The literature offers strong evidence that efficiency is very low. First,
payment distributions are inefficient: if analysed according to farm size, the level of payment inequality
(as represented by the GINI coefficient of inequality) is heterogeneous and sometimes decreasing in old
MS (e.g. The Netherlands), but higher or even increasing in some new MSs (Fig. 7). Some of the changes
observed in new MSs may relate to post-socialist developments (structural changes resulting from rapid
intensification) and shifts in farm sizes following the accession to the EU, as well as to the phasing in of
the CAP’s direct payments (DP). Some of these influencing factors are independent of the CAP. However,
the uneven distribution of DPs, and the high (and even increasing) levels of inequality, cast serious doubts
whether this distribution of DP is appropriate and efficient toward fulfilling a) the CAP’s objective with
respect to fair standard of living (Art 39(1)b), and b) the 2010-priority of reducing disparities in rural
development especially in new MSs and other disadvantaged regions.
Additional inefficiencies result from leakages of DP to increased land rents (meaning that large
proportions of DP do not necessarily support farmers). The applied indicators also fail to reflect the actual
economy of farm families and households (see below, “Relevance”). Thus, payment distribution,
utilisation, and indicators do not match with real needs. Studies also indicate insufficient justification by
the EC as to why and which farmers need income support and whether lump-sum income support is the
most efficient means to an end.
2006 2008 2010 2012 2014
0.4
0.5
0.6
0.7
0.8
0.9
a) Northwestern EU
Years
Gin
i-coe
ffic
ien
t
0.65
0.61
2006 2008 2010 2012 2014
0.4
0.5
0.6
0.7
0.8
0.9
b) Southern EU
Years
Gin
i-coe
ffic
ien
t
0.770.75
2006 2008 2010 2012 2014
0.4
0.5
0.6
0.7
0.8
0.9
c) Eastern EU
Years
Gin
i-coe
ffic
ien
t 0.68
0.77 low
equ
ity
hig
h e
quity
Legend:
Development of the Gini-coefficients for direct payments in the EU between 2006 and 2016
CAP Fitness Check: Executive Summary
14
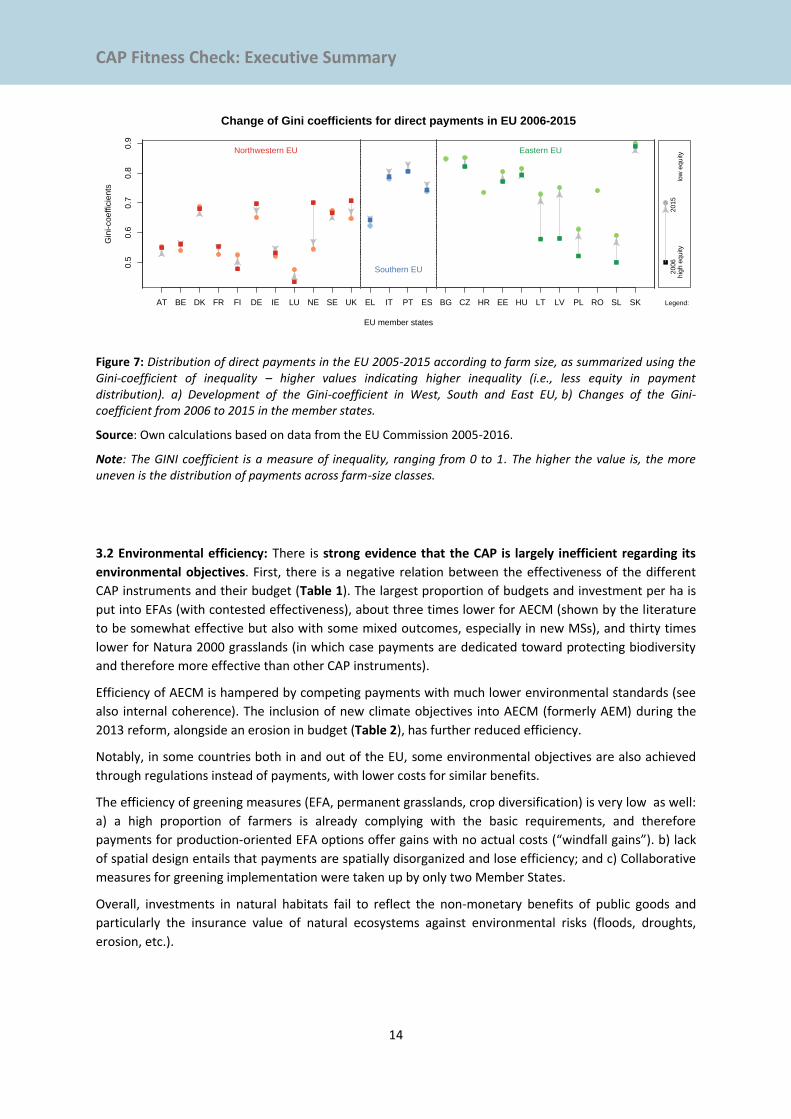
Figure 7: Distribution of direct payments in the EU 2005-2015 according to farm size, as summarized using the Gini-coefficient of inequality – higher values indicating higher inequality (i.e., less equity in payment distribution). a) Development of the Gini-coefficient in West, South and East EU, b) Changes of the Gini-coefficient from 2006 to 2015 in the member states.
Source: Own calculations based on data from the EU Commission 2005-2016.
Note: The GINI coefficient is a measure of inequality, ranging from 0 to 1. The higher the value is, the more uneven is the distribution of payments across farm-size classes.
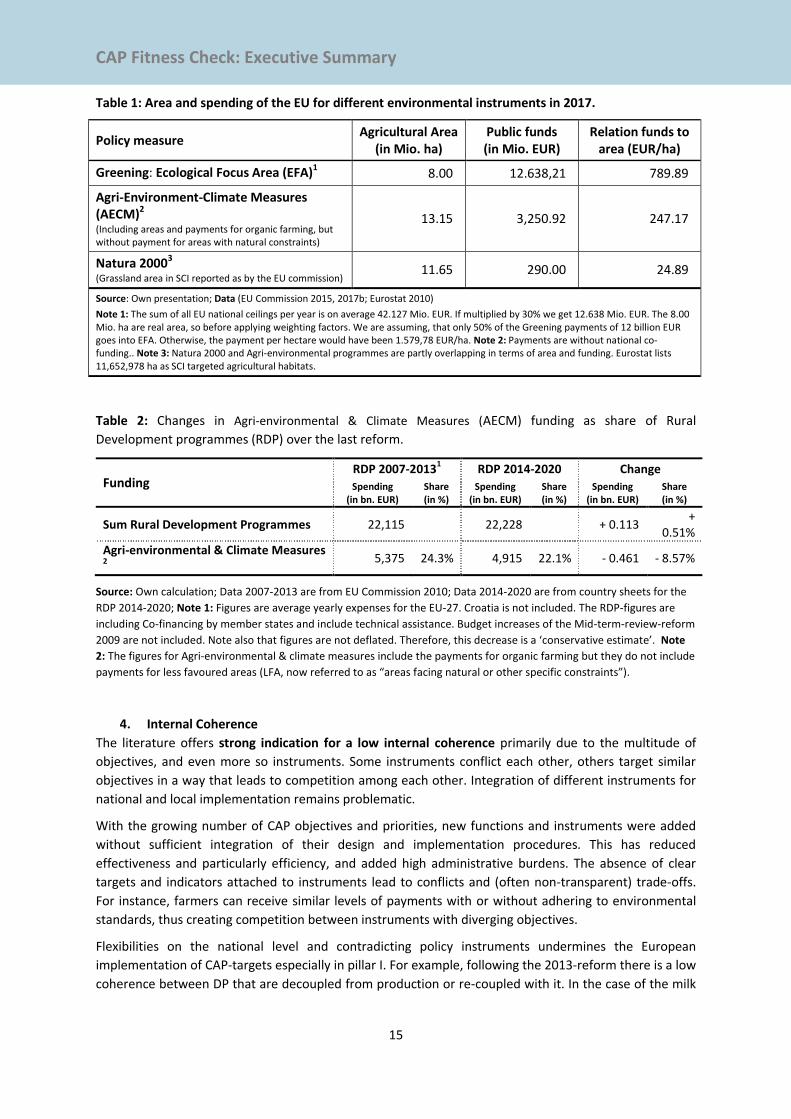
3.2 Environmental efficiency: There is strong evidence that the CAP is largely inefficient regarding its
environmental objectives. First, there is a negative relation between the effectiveness of the different
CAP instruments and their budget (Table 1). The largest proportion of budgets and investment per ha is
put into EFAs (with contested effectiveness), about three times lower for AECM (shown by the literature
to be somewhat effective but also with some mixed outcomes, especially in new MSs), and thirty times
lower for Natura 2000 grasslands (in which case payments are dedicated toward protecting biodiversity
and therefore more effective than other CAP instruments).
Efficiency of AECM is hampered by competing payments with much lower environmental standards (see
also internal coherence). The inclusion of new climate objectives into AECM (formerly AEM) during the
2013 reform, alongside an erosion in budget (Table 2), has further reduced efficiency.
Notably, in some countries both in and out of the EU, some environmental objectives are also achieved
through regulations instead of payments, with lower costs for similar benefits.
The efficiency of greening measures (EFA, permanent grasslands, crop diversification) is very low as well:
a) a high proportion of farmers is already complying with the basic requirements, and therefore
payments for production-oriented EFA options offer gains with no actual costs (“windfall gains”). b) lack
of spatial design entails that payments are spatially disorganized and lose efficiency; and c) Collaborative
measures for greening implementation were taken up by only two Member States.
Overall, investments in natural habitats fail to reflect the non-monetary benefits of public goods and
particularly the insurance value of natural ecosystems against environmental risks (floods, droughts,
erosion, etc.).
EU member states
Gin
i-co
eff
icie
nts
AT BE DK FR FI DE IE LU NE SE UK EL IT PT ES BG CZ HR EE HU LT LV PL RO SL SK
0.5
0.6
0.7
0.8
0.9
Change of Gini coefficients for direct payments in EU 2006-2015
Northwestern EU
Southern EU
Eastern EU
low
equity
hig
h e
quity
2006
2015
Legend:
CAP Fitness Check: Executive Summary
15
Table 1: Area and spending of the EU for different environmental instruments in 2017.
Policy measure Agricultural Area
(in Mio. ha) Public funds (in Mio. EUR)
Relation funds to area (EUR/ha)
Greening: Ecological Focus Area (EFA)1 8.00 12.638,21 789.89
Agri-Environment-Climate Measures (AECM)2 (Including areas and payments for organic farming, but without payment for areas with natural constraints)
13.15 3,250.92 247.17
Natura 20003 (Grassland area in SCI reported as by the EU commission)
11.65 290.00 24.89
Source: Own presentation; Data (EU Commission 2015, 2017b; Eurostat 2010)
Note 1: The sum of all EU national ceilings per year is on average 42.127 Mio. EUR. If multiplied by 30% we get 12.638 Mio. EUR. The 8.00 Mio. ha are real area, so before applying weighting factors. We are assuming, that only 50% of the Greening payments of 12 billion EUR goes into EFA. Otherwise, the payment per hectare would have been 1.579,78 EUR/ha. Note 2: Payments are without national co-funding.. Note 3: Natura 2000 and Agri-environmental programmes are partly overlapping in terms of area and funding. Eurostat lists 11,652,978 ha as SCI targeted agricultural habitats.
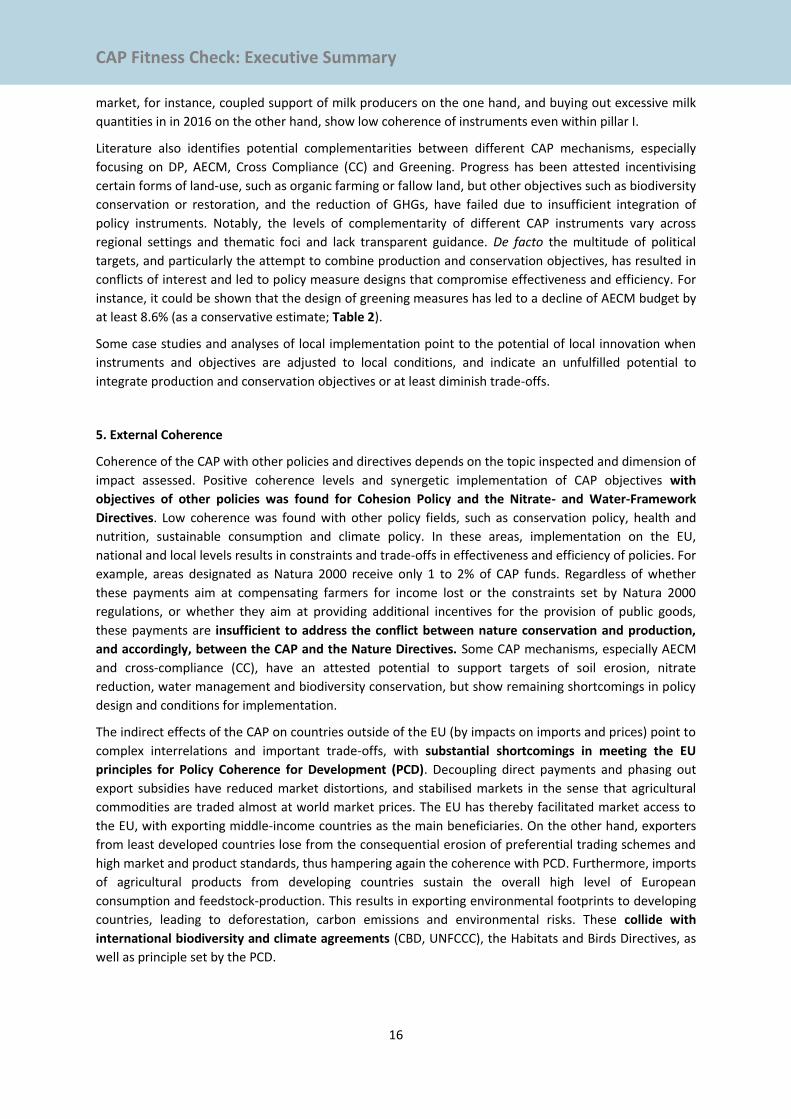
Table 2: Changes in Agri-environmental & Climate Measures (AECM) funding as share of Rural
Development programmes (RDP) over the last reform.
Funding RDP 2007-2013
1 RDP 2014-2020 Change
Spending (in bn. EUR)
Share (in %)
Spending (in bn. EUR)
Share (in %)
Spending (in bn. EUR)
Share (in %)
Sum Rural Development Programmes 22,115 22,228 + 0.113 +
0.51% Agri-environmental & Climate Measures 2
5,375 24.3% 4,915 22.1% - 0.461 - 8.57%
Source: Own calculation; Data 2007-2013 are from EU Commission 2010; Data 2014-2020 are from country sheets for the
RDP 2014-2020; Note 1: Figures are average yearly expenses for the EU-27. Croatia is not included. The RDP-figures are
including Co-financing by member states and include technical assistance. Budget increases of the Mid-term-review-reform
2009 are not included. Note also that figures are not deflated. Therefore, this decrease is a ‘conservative estimate’. Note
2: The figures for Agri-environmental & climate measures include the payments for organic farming but they do not include
payments for less favoured areas (LFA, now referred to as “areas facing natural or other specific constraints”).
4. Internal Coherence
The literature offers strong indication for a low internal coherence primarily due to the multitude of
objectives, and even more so instruments. Some instruments conflict each other, others target similar
objectives in a way that leads to competition among each other. Integration of different instruments for
national and local implementation remains problematic.
With the growing number of CAP objectives and priorities, new functions and instruments were added
without sufficient integration of their design and implementation procedures. This has reduced
effectiveness and particularly efficiency, and added high administrative burdens. The absence of clear
targets and indicators attached to instruments lead to conflicts and (often non-transparent) trade-offs.
For instance, farmers can receive similar levels of payments with or without adhering to environmental
standards, thus creating competition between instruments with diverging objectives.
Flexibilities on the national level and contradicting policy instruments undermines the European
implementation of CAP-targets especially in pillar I. For example, following the 2013-reform there is a low
coherence between DP that are decoupled from production or re-coupled with it. In the case of the milk
CAP Fitness Check: Executive Summary
16
market, for instance, coupled support of milk producers on the one hand, and buying out excessive milk
quantities in in 2016 on the other hand, show low coherence of instruments even within pillar I.
Literature also identifies potential complementarities between different CAP mechanisms, especially
focusing on DP, AECM, Cross Compliance (CC) and Greening. Progress has been attested incentivising
certain forms of land-use, such as organic farming or fallow land, but other objectives such as biodiversity
conservation or restoration, and the reduction of GHGs, have failed due to insufficient integration of
policy instruments. Notably, the levels of complementarity of different CAP instruments vary across
regional settings and thematic foci and lack transparent guidance. De facto the multitude of political
targets, and particularly the attempt to combine production and conservation objectives, has resulted in
conflicts of interest and led to policy measure designs that compromise effectiveness and efficiency. For
instance, it could be shown that the design of greening measures has led to a decline of AECM budget by
at least 8.6% (as a conservative estimate; Table 2).
Some case studies and analyses of local implementation point to the potential of local innovation when
instruments and objectives are adjusted to local conditions, and indicate an unfulfilled potential to
integrate production and conservation objectives or at least diminish trade-offs.
5. External Coherence
Coherence of the CAP with other policies and directives depends on the topic inspected and dimension of
impact assessed. Positive coherence levels and synergetic implementation of CAP objectives with
objectives of other policies was found for Cohesion Policy and the Nitrate- and Water-Framework
Directives. Low coherence was found with other policy fields, such as conservation policy, health and
nutrition, sustainable consumption and climate policy. In these areas, implementation on the EU,
national and local levels results in constraints and trade-offs in effectiveness and efficiency of policies. For
example, areas designated as Natura 2000 receive only 1 to 2% of CAP funds. Regardless of whether
these payments aim at compensating farmers for income lost or the constraints set by Natura 2000
regulations, or whether they aim at providing additional incentives for the provision of public goods,
these payments are insufficient to address the conflict between nature conservation and production,
and accordingly, between the CAP and the Nature Directives. Some CAP mechanisms, especially AECM
and cross-compliance (CC), have an attested potential to support targets of soil erosion, nitrate
reduction, water management and biodiversity conservation, but show remaining shortcomings in policy
design and conditions for implementation.
The indirect effects of the CAP on countries outside of the EU (by impacts on imports and prices) point to
complex interrelations and important trade-offs, with substantial shortcomings in meeting the EU
principles for Policy Coherence for Development (PCD). Decoupling direct payments and phasing out
export subsidies have reduced market distortions, and stabilised markets in the sense that agricultural
commodities are traded almost at world market prices. The EU has thereby facilitated market access to
the EU, with exporting middle-income countries as the main beneficiaries. On the other hand, exporters
from least developed countries lose from the consequential erosion of preferential trading schemes and
high market and product standards, thus hampering again the coherence with PCD. Furthermore, imports
of agricultural products from developing countries sustain the overall high level of European
consumption and feedstock-production. This results in exporting environmental footprints to developing
countries, leading to deforestation, carbon emissions and environmental risks. These collide with
international biodiversity and climate agreements (CBD, UNFCCC), the Habitats and Birds Directives, as
well as principle set by the PCD.
CAP Fitness Check: Executive Summary
17
6. Relevance
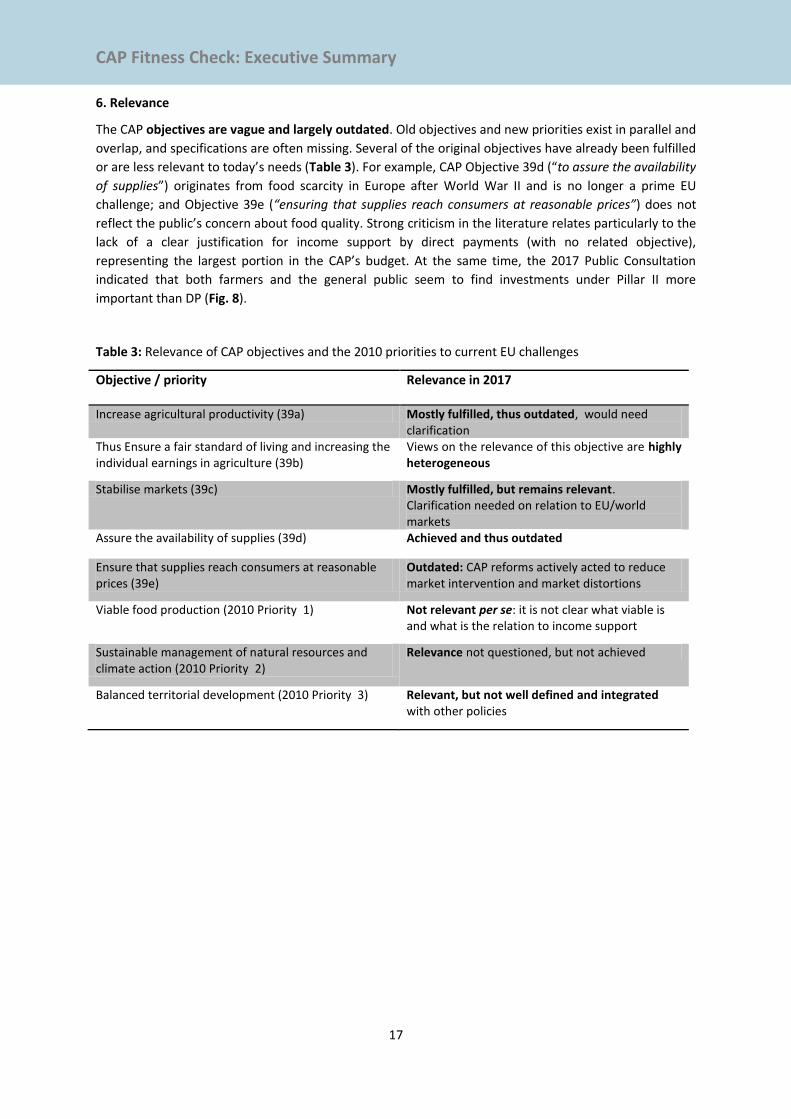
The CAP objectives are vague and largely outdated. Old objectives and new priorities exist in parallel and
overlap, and specifications are often missing. Several of the original objectives have already been fulfilled
or are less relevant to today’s needs (Table 3). For example, CAP Objective 39d (“to assure the availability
of supplies”) originates from food scarcity in Europe after World War II and is no longer a prime EU
challenge; and Objective 39e (“ensuring that supplies reach consumers at reasonable prices”) does not
reflect the public’s concern about food quality. Strong criticism in the literature relates particularly to the
lack of a clear justification for income support by direct payments (with no related objective),
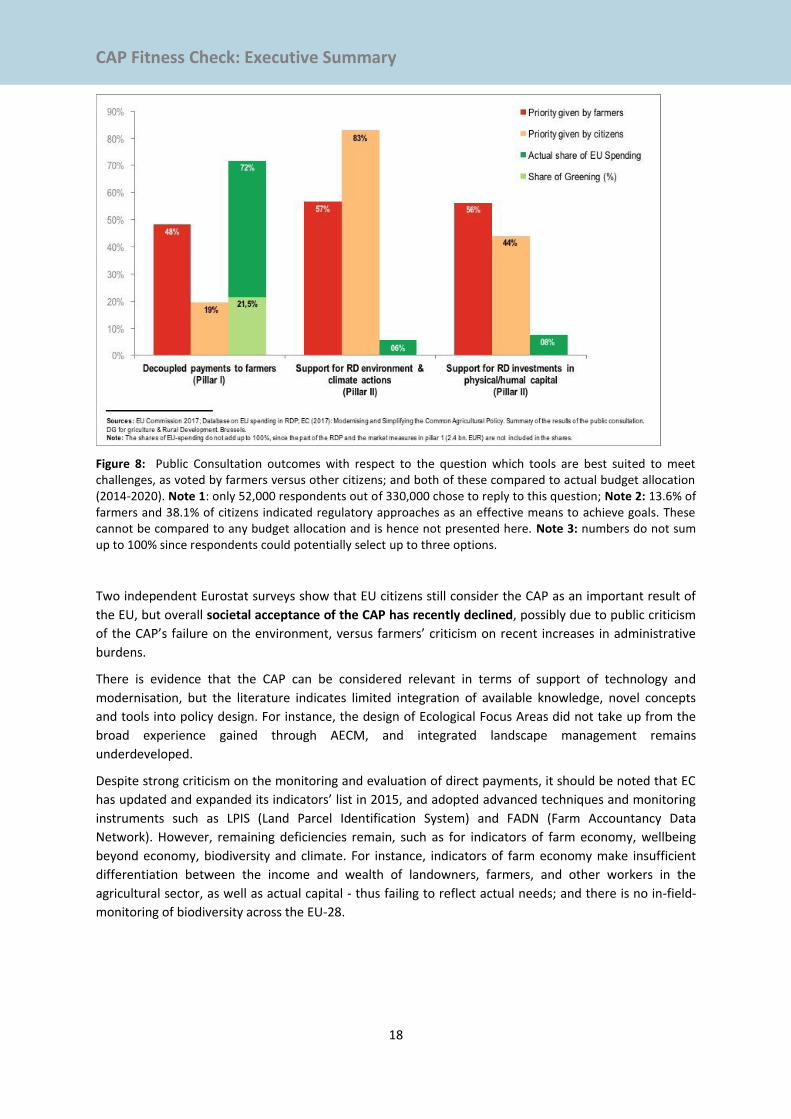
representing the largest portion in the CAP’s budget. At the same time, the 2017 Public Consultation
indicated that both farmers and the general public seem to find investments under Pillar II more
important than DP (Fig. 8).
Table 3: Relevance of CAP objectives and the 2010 priorities to current EU challenges
Objective / priority Relevance in 2017
Increase agricultural productivity (39a) Mostly fulfilled, thus outdated, would need clarification
Thus Ensure a fair standard of living and increasing the individual earnings in agriculture (39b)
Views on the relevance of this objective are highly heterogeneous
Stabilise markets (39c) Mostly fulfilled, but remains relevant. Clarification needed on relation to EU/world markets
Assure the availability of supplies (39d) Achieved and thus outdated
Ensure that supplies reach consumers at reasonable prices (39e)
Outdated: CAP reforms actively acted to reduce market intervention and market distortions
Viable food production (2010 Priority 1) Not relevant per se: it is not clear what viable is and what is the relation to income support
Sustainable management of natural resources and climate action (2010 Priority 2)
Relevance not questioned, but not achieved
Balanced territorial development (2010 Priority 3) Relevant, but not well defined and integrated with other policies
CAP Fitness Check: Executive Summary
18
Figure 8: Public Consultation outcomes with respect to the question which tools are best suited to meet challenges, as voted by farmers versus other citizens; and both of these compared to actual budget allocation (2014-2020). Note 1: only 52,000 respondents out of 330,000 chose to reply to this question; Note 2: 13.6% of farmers and 38.1% of citizens indicated regulatory approaches as an effective means to achieve goals. These cannot be compared to any budget allocation and is hence not presented here. Note 3: numbers do not sum up to 100% since respondents could potentially select up to three options.
Two independent Eurostat surveys show that EU citizens still consider the CAP as an important result of
the EU, but overall societal acceptance of the CAP has recently declined, possibly due to public criticism
of the CAP’s failure on the environment, versus farmers’ criticism on recent increases in administrative
burdens.
There is evidence that the CAP can be considered relevant in terms of support of technology and
modernisation, but the literature indicates limited integration of available knowledge, novel concepts
and tools into policy design. For instance, the design of Ecological Focus Areas did not take up from the
broad experience gained through AECM, and integrated landscape management remains
underdeveloped.
Despite strong criticism on the monitoring and evaluation of direct payments, it should be noted that EC
has updated and expanded its indicators’ list in 2015, and adopted advanced techniques and monitoring
instruments such as LPIS (Land Parcel Identification System) and FADN (Farm Accountancy Data
Network). However, remaining deficiencies remain, such as for indicators of farm economy, wellbeing
beyond economy, biodiversity and climate. For instance, indicators of farm economy make insufficient
differentiation between the income and wealth of landowners, farmers, and other workers in the
agricultural sector, as well as actual capital - thus failing to reflect actual needs; and there is no in-field-
monitoring of biodiversity across the EU-28.
CAP Fitness Check: Executive Summary
19
7. EU added value
EU added value is difficult to define and assess, because of: a) lack of reference points, b) being part of the EU entails a set of policies, and c) the term “value” in itself is perceptual rather than factual. Nonetheless, studies addressed EU added value by inspecting temporal changes (e.g. responses to CAP reforms), processes after accession to the EU, comparing the situation in countries in and outside the EU, and conducting surveys and simulations to assess the potential outcomes of hypothetical changes (e.g. CAP abolishment). We found mixed evidence on whether the CAP performs better than national, regional or local level policies in addresses relevant challenges: There is an EU added value in supporting farmers’ fair standard of living and supporting (more) balanced territorial development, but it is poorly suited to local contexts particularly in the New MSs, where most farmers are smallholders. There seems to be an EU added value for market regulations and for a uniform legal framework within the EU. We did not find evidence that the CAP delivers an economic EU added value.
From an environmental perspective, we found mixed results in terms of EU added value. Regulations, standards and the prevalence of funding and requirements for AECM and CC, as well as support for organic farming, offer a positive EU added value. The flexibility offered by the CAP has both positive and negative effects by offering the potential to adapt measures to local conditions in some regions (albeit still insufficient for new MSs, see above), but at the same time flexibility has been often used to reduce requirements or weaken implementation. The development of EU-wide thresholds has also had negative effects by leading to compromising the requirements and setting over-simplistic thresholds that do not match conditions in most MSs. For instance, the requirement for a minimum of 2 or 3 crops to satisfy the crop diversification measure are set below current crop diversity levels in most MSs, and the permitted loss of grasslands is higher than current rate of losses in some regions.
8. Does the CAP support sustainable development goals?
CAP has the potential to make contributions to the relevant SDG goals, but in its current design and implementation it cannot fulfil this potential.
CAP is partly capable of addressing SDG 1 (no poverty) and SDG 2 (zero hunger), but notably, evidence shows that food security or extreme poverty are not the key challenges in most of the EU. By contrast, the direct and indirect effects on developing countries, affecting food prices or leading to environmental degradation and consequent risks to local communities, are poorly considered.
SDG 10 (reduced inequalities) is partially supported but not addressed adequately due to the highly unequal allocation of payments, with 20% of beneficiaries receiving 80% of the payments; 1.5% receiving 32% of the payments (annually > 50,000 Euros/beneficiary); and 79% of the beneficiaries receiving annually < 5,000 Euros. In addition, there are indications for increasing level on payment inequities in Eastern EU Member States.
SDG 3 (good health and wellbeing) is poorly covered, and particular gaps relate to SDG 12 (responsible consumption and production). The CAP is not well-designed to address challenges of unhealthy diets, obesity and health issues relating to these, while animal products receive over-proportionally high funding. It also poorly addresses overall wellbeing of farmers (beyond farm economy), as well as the externalities and waste emerging from overproduction. The number of publications addressing SDGs 3 and 12, however, was notably low due to the indirect nature of these impacts and the lack of objectives or instruments to address these challenges.
With respect to environmental SDGs, local successes obtained through specific CAP instruments demonstrate some positive outcomes on local levels. They are, however, too limited to reverse the more-broadly implemented instruments supporting environmental degradation or even rapid biodiversity declines. Therefore, the CAP has an unfulfilled potential to address SDGs 6 (clean water) and SDG 15 (life on land). Despite AECM, CAP has very limited capacity to deliver on SDG 13 (climate action), due to the lack of instruments to address the most important GHG sources, such as GHG gas production from livestock production, and the export of land-use changes by importing feedstock such as soybean resulting in large GHG emissions overseas.
CAP Fitness Check: Executive Summary
20
Finally, the CAP supports organic farming, thereby contributing to SDG 8 (green growth), but it also supports unsustainable farming sectors, e.g. by incentivising intensification as well as through a disproportionate support of meat and dairy products.
Conclusion, limitations and outlook
Our work demonstrates a breadth of available evidence, with substantial potential to help identifying means for improvements as well as avenues for mitigating trade-offs and reconciling conflicts. The experience gained in years of research and implementation can therefore help avoiding political compromises where these might not be necessary.
To this end, the list of publications used for this assessment is publically available through https://idata.idiv.de/ and our team is happy to be informed of further studies and evidence.
The short time and limited resources to conduct this study entail a range of limitations. Some topics were left unstudied in this assessment, such as the CAP’s support for forestry, the direct and indirect impacts of agriculture and the CAP on public health, or the impacts of standards and regulations relating to, but extending beyond, the CAP. While some reports were used, we gave a prime focus to scientific studies published primarily in English. This entails that many further documents were inevitably left aside. We particularly acknowledge the room for further transferable results and experiences, which could be harvested from local studies and reports.
These shortcomings, and the breadth of potentially available literature, indicate a need but also a vast potential to gain from a broader evidence-based evaluation of the CAP and the gathering of recommendations, lessons learned and tools for optimization and means for conflict resolution.
We encourage the inclusion of this and further evidence in decision making and hope this report can promote a continued, informed, and rich science-policy dialogue to foster and support further advances toward a modern, simpler and smarter CAP in favour of a healthy and sustainable agriculture.
This work should be cited as:
G. Pe’er, S. Lakner, R. Müller, G. Passoni, V. Bontzorlos, D. Clough, F. Moreira, C. Azam, J. Berger, P.
Bezak, A. Bonn, B. Hansjürgens, L. Hartmann, J. Kleemann, A. Lomba, A. Sahrbacher, S. Schindler, C.
Schleyer, J. Schmidt, S. Schüler, C. Sirami, M. von Meyer-Höfer, and Y. Zinngrebe (2017). Is the CAP
Fit for purpose? An evidence based fitness-check assessment. Leipzig, German Centre for
Integrative Biodiversity Research (iDiv) Halle-Jena-Leipzig.