Embed Size (px)
Citation preview

8/6/2019 Fit for Purpose Method Development
http://slidepdf.com/reader/full/fit-for-purpose-method-development 1/17
Research Paper
Fit-for-Purpose Method Development and Validationfor Successful Biomarker Measurement
Jean W. Lee, 1,16,17 Viswanath Devanarayan, 2 Yu Chen Barrett, 3 Russell Weiner, 3 John Allinson, 4
Scott Fountain, 5 Stephen Keller, 6 Ira Weinryb, 7 Marie Green, 8 Larry Duan, 9 James A. Rogers, 10
Robert Millham, 10 Peter J. O’Brien, 11 Jeff Sailstad, 12 Masood Khan, 13 Chad Ray, 14 and John A. Wagner 15
Received July 28, 2005; accepted October 7, 2005
Abstract. Despite major advances in modern drug discovery and development, the number of new drugapprovals has not kept pace with the increased cost of their development. Increasingly, innovative usesof biomarkers are employed in an attempt to speed new drugs to market. Still, widespread adoption of biomarkers is impeded by limited experience interpreting biomarker data and an unclear regulatory
climate. Key differences preclude the direct application of existing validation paradigms for druganalysis to biomarker research. Following the AAPS 2003 Biomarker Workshop (J. W. Lee, R. S.Weiner, J. M. Sailstad, et al. Method validation and measurement of biomarkers in nonclinical andclinical samples in drug development. A conference report. Pharm Res 22:499 Y 511, 2005), these andother critical issues were addressed. A practical, iterative, Bfit-for-purpose ^ approach to biomarkermethod development and validation is proposed, keeping in mind the intended use of the data and theattendant regulatory requirements associated with that use. Sample analysis within this context of fit-for-purpose method development and validation are well suited for successful biomarker implementation,allowing increased use of biomarkers in drug development.
KEY WORDS: assay validation; biomarkers; drug development; fit-for-purpose method developmentand validation.
0724-8741/06/0200-0312/0 # 2006 Springer Science + Business Media, Inc. 312
Pharmaceutical Research, Volume 23, No. 2, February 2006 ( # 2006)DOI: 10.1007/s11095-005-9045-3
1 Formerly MDS Pharma Services, Lincoln, Nebraska, USA.2 Merck and Company, Inc., Blue Bell, Pennsylvania, USA.3 Bristol-Myers Squibb, Princeton, New Jersey, USA.4 BAS Analytics Ltd., Kenilworth, UK.5 Pfizer Global Research and Development, Ann Arbor, Michigan, USA.6 Protein Design Labs, Inc., Fremont, California, USA.7 Wyeth Research, Collegeville, Pennsylvania, USA.8 Millenium Pharmaceuticals, Cambridge, Massachusetts, USA.9 Quest Pharmaceutical Services, Newark, Delaware, USA.
10 Pfizer Global Research and Development, Groton Y New London, Connecticut, USA.11 Therakos, Inc., Exton, Pennsylvania, USA.12 Trimeris Inc., Morrisville, North Carolina, USA.13 Covance Laboratories, Inc., Chantilly, Virginia, USA.14 Eli Lilly and Company, Indianapolis, Indiana, USA.15 Merck and Company, Inc., Rahway, New Jersey, USA.16 Present Address: 1 Amgen Center Drive, Mailstop 30E-3-B, Thousand Oaks, California 91320, USA.17 To whom correspondence should be addressed. (e-mail: [email protected])ABBREVIATIONS: AAPS, American Association of Pharmaceutical Sciences; BQL, below quantifiable limit; CDER, Center for DrugEvaluation and Research; CMS, Centers for Medicare and Medicaid Services; CLAS, Clinical Ligand Assay Society; CLIA, ClinicalLaboratory Improvement Amendments; CLSI, Clinical and Laboratory Standards Institute; GLP, Good Laboratory Practices; LBABFG,Ligand Binding Assay Bioanalytical Focus Group; LOD, lower limit of detection; LLOQ, lower limit of quantification; MRD, minimumrequired dilution; NCCLS, National Committee for Clinical Laboratory Standards; PD, pharmacodynamic; PK, pharmacokinetic; QC, QualityControls; QL, quantification limits; ULOQ, upper limit of quantification; VEGF, vascular endothelial growth factor; VS, validation sample.

8/6/2019 Fit for Purpose Method Development
http://slidepdf.com/reader/full/fit-for-purpose-method-development 2/17
INTRODUCTION
Historical Perspectives and Scope
Major advances in the basic science of drug discoveryand development have led to an enormous increase in thenumber of new drug targets; however, despite increasing com-mitments of time and money to the effort, these advanceshave not culminated in an increase in new drug approvals(2,3). Consequently, efforts to improve the efficiency of thisprocess are being implemented across the continuum of drug development activities (4 Y 10). The use of biomarkers toidentify the most promising drug candidates may ultimatelyallow a more economical and timely application of develop-mental resources.
Clinicians have traditionally used biomarkers, typicallylaboratory and other measures, to monitor therapeuticprogress, disease progression, and the efficacy of interven-tions. Only recently has this use become formalized in drugdevelopment. Such increased use has been accompanied byextensive and at times confusing application of the terms
Bbiomarker^
and Bvalidation^
to variously related activities,highlighting the need for harmonization of terminology andvalidation approaches. The confusion is compounded by ageneral absence of official guidelines for the validation of laboratory biomarker assays, leading to inconsistent adapta-tions of related regulations (11,12) in both bioanalytical and
clinical laboratories. In May 2001, the FDA issued guidancefor industry for bioanalytical method validation, addressingvalidation of assays to support pharmacokinetic (PK) assess-ments of conventional small molecule drugs (11). Meanwhile,laboratories that perform testing on human specimens fordiagnosis, prevention, or treatment of any disease or im-pairment, or for the assessment of the health of individualpatients, are certified under the Clinical Laboratory Im-provement Amendments (CLIA) of 1988 or have similaraccreditation in countries outside the US (13). The standardpractices most frequently required for CLIA certification weredeveloped and published by the Clinical and LaboratoryStandards Institute [CLSI, formerly the National Committeefor Clinical Laboratory Standards (NCCLS)] (14). Therefore,because of the diverse nature of biomarker analysis and itsvaried applications in drug development, neither the FDAbioanalytical drug assay guidance nor the CLSI guidelines fullymeet the needs of drug development and diagnostic applica-tions of biomarker assays (1). Table I compares and contraststhese two validation paradigms, and illustrates some of theunique validation challenges of biomarker assays.
To further define and address these challenges, theAmerican Association of Pharmaceutical Scientists (AAPS)and Clinical Ligand Assay Society (CLAS) cosponsored aBiomarker Method Validation Workshop in October 2003(1). Members of the AAPS Ligand Binding Assay Bioana-lytical Focus Group Biomarker Subcommittee subsequently
Table I. Comparison of Pharmacokinetic (PK) Drug, Biomarker, and Diagnostic Assays
PK assayBiomarker assay fordrug development
Biomarker assayfor diagnostic
Intended use Bioequivalence, PK Safety, mechanism of action, PD Distinguish diseased from healthy
Method category Most assays are definitive quantitative Most assays are relative or quasiquantitativeNature of analyte Exogenous in most cases EndogenousCalibrators/Standards Well characterized. Standards
prepared in study matrixTypically not well characterized, may change from vendor to vendor,
lot to lot. Standards/calibrators are made in matrix different thanstudy samples
Validation samples (VS)and quality control (QC)
Made in study matrix. 4 Y 5 VS levelsand 3 QC levels
Made in study matrix. 5 VSlevels and 3 QC levels. If study matrix is limited,(e.g., tissue samples) mayuse surrogate matrix
QC often in lyophilized form,supplied by the vendors,commonly 2 or 3 levels
Assay sensitivity LLOQ defined by acceptance criteria LLOQ and LOD LOD is often usedValidation of accuracy True accuracy can be achieved by
testing spike recoveryIn majority of cases only relative
accuracy can be achieved.Endogenous background needsto be considered if spikerecovery is used
Measured result comparedto an accepted referencevalue obtained by anaccepted method
Validation of precision 2 Y 6 replicate samples per run,3 Y 6 runs
2 Y 6 replicate samples per run,3 Y 6 runs
3 replicate samples per run,one run per day for 5 days.Samples ran in random order
Stability testing Freeze/thaw, bench top, and long-termmeasured by spiking biologicalmatrix with drug
Freeze/thaw, bench top, andstorage stability with studysamples, when available.If not, with spiked samples
Focus on stability of reagentsrather than analytes. Long-term analyte stability notroutinely tested
Assay acceptance criteria 4 Y 6 Y 20/30 rule Establish confidence interval or4 Y 6 Y X rule
2 SD ranges, Westgard Rules,Levy Y Jennings Chart
Regulatory requirements GLP compliant No specific guidelines Methods are FDA-approved, resultgeneration follows CLIA andCLSI guidelines in US
313Fit-for-Purpose Method Validation for Biomarkers

8/6/2019 Fit for Purpose Method Development
http://slidepdf.com/reader/full/fit-for-purpose-method-development 3/17
collaborated to develop an approach to validate laboratorybiomarker assays in support of drug development. Althoughthe focus is on ligand-binding methods to gauge biomarkersmeasured ex vivo from body fluids and tissues, many of therecommendations can generally be applied across otherplatforms and types of biomarkers. Here we summarize theresults of these discussions, and describe a Bfit-for-purpose ^
approach for biomarker method development and validation.The key component of this approach is the notion that assayvalidation should be tailored to meet the intended purpose of the biomarker study, with a level of rigor commensurate withthe intended use of the data.
Nomenclature
Numerous publications have described the validationand use of biomarkers in clinical and nonclinical drugdevelopment. The nomenclature associated with this field,however, is not standardized. It was agreed that the NIHworking group’s definition of a biomarker would be used. A
biomarker is thus Ba characteristic that is objectively mea-sured and evaluated as an indicator of normal biologicprocesses, pathogenic processes, or pharmacologic responseto a therapeutic intervention ^ (15). A clinical endpoint isdefined as a Bcharacteristic that reflects how a patient feels,functions or survives ^ ; a surrogate endpoint is a Bbiomarkerintended to substitute for a clinical endpoint. ^ The manycontexts in which the term Bsurrogate marker ^ is used cangenerate substantial confusion. Therefore we recommend theterm not be used interchangeably with Bbiomarker. ^ Fur-thermore, an important distinction should be made betweenbiomarker analytical method validation and clinical qualifi-cation. Analytical method validation is the process of as-sessing the performance characteristics of a given assay,whereas clinical qualification is the evidentiary and statisticalprocess linking biologic, pathologic, and clinical endpoints tothe drug effect, or linking a biomarker to biologic and clinicalendpoints.
The NIH working group recommended that the termBvalidation ^ be used for analytical methods, and Bevaluation ^
be used for the determining surrogate endpoint candidacy of biomarkers (15). More recently, the term Bqualification ^ hasbeen suggested for biomarker clinical evaluation to avoidconfusion with the process of method validation (16,17).Biomarker method validation and biomarker qualificationcan be intertwined, because the statistical linkages of diseaseregression, biomarker modulation, and drug effects can
depend upon the analytical soundness of a biomarker assay.The fit-for-purpose validation approach addresses the extentto which a biomarker assay should be validated vis-a -vis theintended purpose for which the data are being generated. Forexample, the validation of a surrogate endpoint assay wouldrequire the most rigorous validation and assay performanceon the continuum of validations described below (17).
Categories of Biomarker Assay Data
Understanding exactly what is being measured and itsbiological relevance is crucial to the utility of biomarkerdata, as is an understanding of the limits of data produced
in a given assay format. Lee and colleagues (18) definedcategories of biomarker data that reflect the type of assayemployed.
A definitive quantitative assay uses calibrators fit to aregression model to calculate the absolute quantitative valuesfor unknown samples. Such assays are only possible when thereference standard is well defined and fully representative of the endogenous biomarker, such as in the case of smallmolecule bioanalytes (for example, steroids). Definitivequantitative assays using either physicochemical or biochem-ical methods can be validated to be accurate and precise. Toconfirm that these assays are reflective of the biologicalactivities of the biomarker, orthogonal assays are sometimesperformed.
A relative quantitative assay depends upon a respon-se Y concentration calibration function. However, as is the casefor many cytokine immunoassays, reference standards maynot be available in a purified form fully characterized, orfully representative of an endogenous biomarker. In suchcases, precision performance can be validated but accuracycan only be estimated.
A quasiquantitative assay (quasi: Bpossesses certainattributes ^ ) does not employ the use of a calibrationstandard, but has a continuous response and the analyticalresult is expressed in terms of a characteristic of the testsample. For example, antibody titers of antidrug antibodyassays can demonstrate assay precision, but not accuracy.
A qualitative assay generates categorical data that lackproportionality to the amount of analyte in a sample. Suchdata may be nominal, such as the presence or absence of agene or gene product, or ordinal with discrete scoring scaleslike those often used for immunohistochemical assays. In gen-eral, qualitative methods are more applicable for differentiat-ing marked effects such as the all-or-none effect of gene ex-pression, or effects on relatively homogenous cell populations.
In all but definitive quantitative assays, the use of experimental designs that provide appropriate comparisoncontrols, such as placebo or normal control subjects, arenecessary. A full discussion of quasiquantitative and qualita-tive assays and related statistical considerations is beyond thescope of this paper. Readers may refer to the report of Mire-Sluis et al. (19), which describes recommendations for thedesign and optimization of immunogenicity immunoassays.In this work we build on recommendations relating to ligand-binding assays for macromolecule drugs made by DeSilvaand colleagues (20), and focus on issues relevant to definitiveand relative quantitative biomarker assays.
Fit-for-Purpose Biomarker Method Validation
Generally, validation should demonstrate that a methodis Breliable for the intended application ^ (21,22). According-ly, the rigor of biomarker method validation increases as thebiomarker data are used for increasingly advanced clinical orotherwise business-critical decision making. For biomarkerassays, we propose the adoption of a continuous and evolving fit-for-purpose strategy. Fit-for-purpose method validationprovides for efficient drug development by conservingresources in the exploratory stages of biomarker character-ization. For example, a biomarker under exploratory devel-opment in an early phase clinical trial would be less
314 Lee et al.

8/6/2019 Fit for Purpose Method Development
http://slidepdf.com/reader/full/fit-for-purpose-method-development 4/17
rigorously validated than an already well-qualified biomarkerin the same trial. By definition, exploratory biomarker datawould be used for less critical decisions than data describinga well-qualified biomarker. In the latter case, an advancedassay validation would be required to ensure adequateconfidence in the measurements. The 2003 BiomarkerConference Report provides a snapshot of trends in bio-marker applications across the drug development continuum,and offers examples illustrating the concept of fit-for-purpose, stage-appropriate method validation (1). Figure 1and Table II further illustrate that biomarker methodvalidation is a graded, cyclical process of assay refinementwith validation criteria that are appropriate for the intendeduse of the resulting data. Table II was designed as a readyguide for researchers to consult once the objectives of a givenstudy have been established and along with recommenda-tions for the level of rigor to apply to various levels of assayvalidation, incorporates previously described assay validationparameters (19,20).
Three major factors influence the establishment of assayacceptance criteria, which should be predefined and appro-
priate for their intended application. First and foremost,acceptance criteria should meet the predefined needs of thestudy rather than simply reflecting the performance capabil-ities of the assay. The second factor is the nature of the assaymethodology and the data generated using that assay, andthird is the biological variability of the biomarker within andbetween the study populations. Below, we discuss key
elements of biomarker method validation, contrasting assay-related issues unique to biomarkers with Bsmall molecule ^
drug assays.
ISSUES AND RECOMMENDATIONS
Preanalytical Considerations
Biomarker Work Plan and Target Population
Study objectives should be defined in a biomarker workplan prior to the commencement of assay development to aidthe timely identification of reagents, controls, and experi-mental samples. In early-phase clinical trials, preclinical studiesand literature reviews can provide background information fora given population, allowing the establishment of appropriateprecision requirements for the assay. This plan also defines thelevel of rigor to be applied to the assay validation andsummarizes study objectives and the intended use of assaydata. For example, an assay measuring concentrations of a bone
resorption biomarker may be well characterized for osteopo-rotic or arthritic patients. For those populations, data on theinter- and intra-donor variability of the biomarker in thosepopulations may exist, allowing one to predict minimallydetectable changes in a biomarker (23). In certain populations,additional analytical measurements may be necessary, aschanges in the initial biomarker may be affected by measur-able morbidity- or therapy-induced changes to a sample.
Sample Collection
Results from biomarker assays are valid only if sampleintegrity is maintained from sample collection throughanalysis. Early, consistent application of predefined samplecollection and handling techniques is especially importantwhen such manipulations might affect sample and/or bio-marker integrity. The life cycle of a study sample by necessitytypically includes freeze/thaw cycles, so a definitive assess-ment of short-term, freeze/thaw, bench-top, and long-termstability is necessary (see Table II). A complete set of separate investigations should evaluate the most appropriateconditions for collecting and treating study samples to ensurethat sample integrity is maintained. Patient-related factorsincluding diurnal, disease-related, and behavioral effects (i.e.,emotional state, posture, food intake, etc.) may necessitatealterations in sampling methods and careful interpretation of biomarker data. Provision of a detailed sample collection andstorage protocol and adequate training of clinical trial sitepersonnel are especially important when extraordinarymeasures are necessary to assure analyte integrity.
Biological Fluids. The collection of human and animalbiological fluids can seem straightforward, but certainanalytes and collection methods can necessitate extraattention in collection to assure that the variability arisingfrom sample collection is minimized. Regardless of potentiallimitations encountered in the collection process, it isimportant to apply the collection procedure in a consistentmanner for continuity of biomarker measurement.
(1) Type of needle, duration of the blood draw, type of collection tube container (see below), and the type and
Fig. 1. Conceptual diagram of fit-for-purpose method validation.The method validation processes include four activity circles of prevalidation (preanalytical consideration and method develop-ment), exploratory method validation, in-study method validation,and advanced method validation. The processes are continuous anditerative, and driven by the intended purpose of the biomarker data.The solid arrows depict the normal flow of biomarker development(prevalidation), method validation (exploratory or advanced), andapplication (in-study method validation). The process could bemoving the chosen biomarkers from mechanism exploration to pilotin-study and to advanced validation for confirmatory studies; or fromexploratory validation to advanced validation due to a criticalbusiness decision change. The broken arrows represent scenariosthat validation data do not satisfy the study purpose requirements,and backtrack processes for refinement or modification are required.
315Fit-for-Purpose Method Validation for Biomarkers
8/6/2019 Fit for Purpose Method Development
http://slidepdf.com/reader/full/fit-for-purpose-method-development 5/17
concentration of anticoagulant may be very importantdeterminants of biomarker stability. For example, someassays may be affected by the activation of endothelial cellsand platelets, or other tissue damage from venipuncture. Inthese instances, it may be advisable to discard the first fewmilliliters of blood, to consider the use of an indwelling port
rather than standard venipuncture, or to examine the use of stabilizing additives and anticoagulants. Cellular componentsfrom platelets and red blood cells may be generated bysample mishandling, and be problematic. DeliberateBstressing ^ of samples may reveal such artifacts, and providevital sample collection tolerance information.
Table II. Fit-for-Purpose Elements of Biomarker Assay Development and Method Validation
Parametersassayelements
Preanalytical andmethod development a Exploratory method validation b Advanced method validation c
Reagents andreference material
Consistent and accessiblesource V do due diligence)
Initial characterizationStablity initiated
Well characterizedInventoriedEstablish stabilityEstablish change control
Target range Estimate in biomarkerwork plan
Define expectation of LLOQand ULOQ
Acquiring data Establish from incurred samples
Dynamic range(lower and upperquantitation limits)
Determine preliminary assayrange with precision profileover target range
Use 3 validation runs Use at least 6 runs(in-study validation datacan be utilized)
Establish LLOQ andULOQ
Sensitivity Define minimum detectable rangeDefine requirements of sensitivity
(LOD) and LLOQ
Estimate sensitivityConsider LOD vs. LLOQ
Establish sensitivity
Curve fitting Choose appropriate calibrationmodel fitting method and tools
Confirm choice of calibrationmodel from 3 validation runs
Use 6 validation runs toconfirm calibration model
Selectivity and specificity Reagent specificity from supplieror literature
Assess matrix effects and minimizeif possible.
Determine minimum requireddilution (MRD)
Sample and substitute matrix
Investigate likely sources of interference, including thetherapeutic agent
Extensive testing of interferenceand risk recommendation
Assessment of biomarkerheterogeneity and isoforms
Parallelism N/A Use incurred samples, if available Investigate in targeted populationDetermine maximum
tolerable dilutionDilution linearity Determine if applicable, as defined
in the biomarker plan (test range)Use spiked samples Use spiked samples and
dilution VS if applicablePrecision and accuracy
(analytical)Establish expectations early on in
biomarker work planConsider heterogeneity
Use 3 validat ion runs Use of total of a t least 6 runs(in study validation datacan be utilized)
Relative accuracy/recovery(biological)
Establish expectations early on inbiomarker work plan
Use spiked incurred samplesat multiple concentrations
Addition recovery
Use multiple donors
Robustness (reagent andchange control)
Determine needConsider availability of
biological matrix
NA Establish tolerability oncrucial elements
Sample handling, collection,processing, and storage
Establish feasible conditions Establish short-term andbench top stability
Optimize conditions andeffects on assay
Establish freeze/thaw andlong-term sample stability
Documentation Biomarker work planDraft proceduresAssess outsourcing options
Appropriate documentationto support the intendeduse of the data
Appropriate documentationto support the intendeduse of the data
In-study validation criteria are not listed in this table; they are defined through empirical testing of the Pre-, Exploratory, and AdvancedValidation. Refer to section In-Study Validation and Sample Analysis Acceptance Criteria for elements of In-study Validation.The recommendation is an example for typical immunoassay to obtain adequate statistical data. For assays with less variability, such asLC-MS/MS, less validation runs may be used.a See sections Preanalytical Considerations and Method Development.b See section Exploratory Method Validation.c See section Advanced Method Validation.
316 Lee et al.

8/6/2019 Fit for Purpose Method Development
http://slidepdf.com/reader/full/fit-for-purpose-method-development 6/17
(2) Sample collection tubing and tubes, transfer pi-pettes, and storage containers should be evaluated to ensurethat no significant adsorption of the biomarker to the contactsurfaces occurs.
(3) Although serum is preferred over plasma for someanalytical formats, some biomarkers such as those involved inthe coagulation pathway in platelet activation or susceptibleto proteolysis can only be accurately quantified in plasma.The initial coagulation of serum may not be suitable fortemperature-labile analytes. In such cases, procedures mayneed to be developed for lower temperature coagulation. Theeffect of hemolysis should be evaluated for serum and plasmacollection procedures.
(4) Differences in the handling of cells and whole bloodcan affect subsequent biomarker assays, particularly thosethat assess cellular functions. Cells can be inadvertentlyactivated through incorrect handling of the blood thuscomplicating the quantification of cellular antigens, function-al responses, and secreted products. In the latter case, thestability of both whole-blood samples and the serum orplasma samples under expected environmental conditions
should be investigated. Moreover, the conditions of theex vivo processing should be optimized.
Tissues. The above-mentioned principles often apply fortissue specimens, but the inherent heterogeneity of mosttissue samples typically necessitates customized samplingtechniques. As with biological fluids, it is important todevise standard protocols for tissue processing and storageto achieve uniformity for multiple sites over the period of thestudy (1). These protocols are often conducted by a certifiedmedical professional, such as a pathologist or a histologist,with an established sampling protocol. For example, thesampling of live tissues for imaging or subsequent cultureneeds to be conducted under sterile conditions, and often in
the presence of antibiotics, whereas tissues for histologystudies typically require immediate fixation or freezing.Assays of tissue homogenates can benefit from appropriatenormalization (e.g., to tissue mass, protein content, or thepresence of a relevant tissue marker). These conditionsmust be characterized and defined prior to study sample col-lection to maintain the integrity of both the biomarker andthe normalization factor. The identification of a representa-tive and reproducibly collected section of the tissue to serveas positive and negative controls in assay validation andsample analysis is often crucial to the success of a tissue-based assay. For example, tissue samples from healthy nor-mal subjects, and biopsies of patients at identified cancerstages can be used as negative control and various stages of positive controls; and maintained by a sample repository-coordinating agency.
Method Development
As illustrated in Fig. 1 and described briefly above,method validation is an iterative, Bfit-for-purpose ^ processthat does not end with the completion of exploratoryvalidation. Rather, method validation is a process thatrequires continuous reassessment of data and optimizationof the assay method. The extent and rigor of methoddevelopment depends on whether the validation is explor-
atory or advanced. This section reviews the key concepts andrecommended practices.
Method Feasibility
Method feasibility studies address the likelihood that anassay will be able to achieve its intended purpose. Numerous
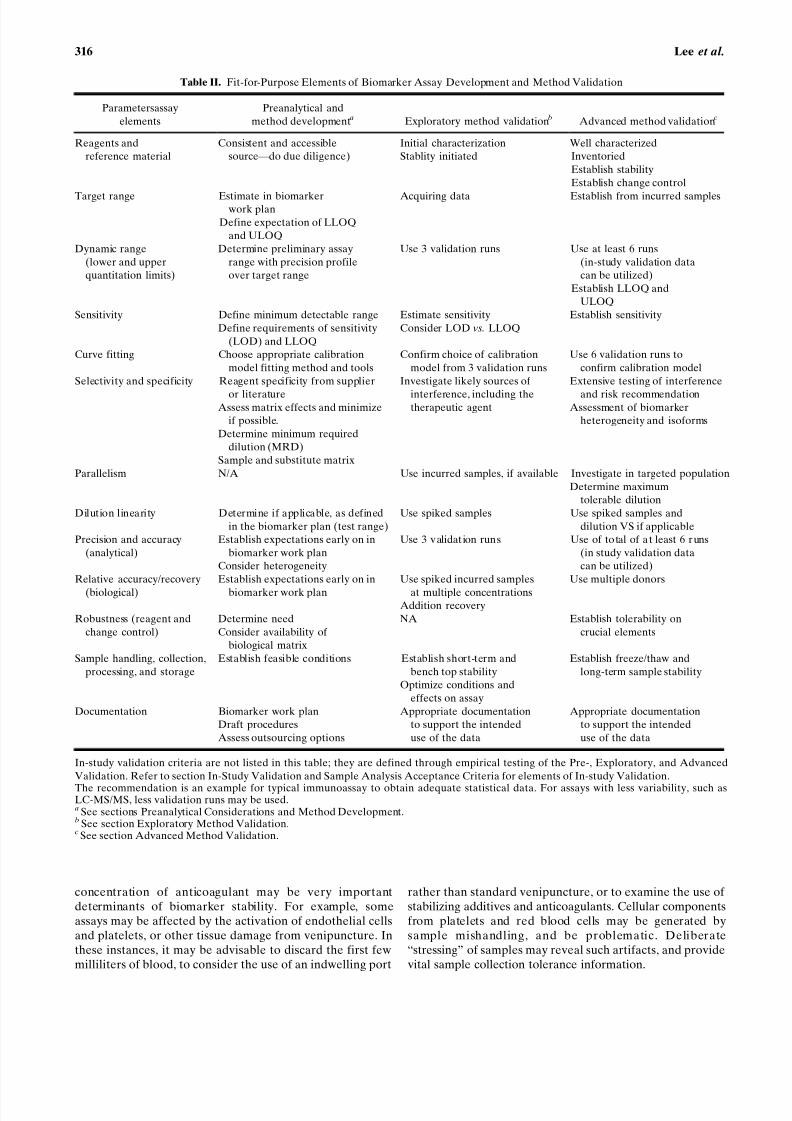
factors influence the answer to this question, including theavailability of reagents of sufficient quality, and whether theperformance characteristics of the assay are appropriate forthe needs of the study. Accordingly, an early objectiveassessment of the assay working range is essential for initialassay development. For immunoassays and other ligand-binding methods, the most commonly used method formacromolecule biomarkers, the precision profile , is a usefultool that provides preliminary evidence if an assay is capa-ble of measuring the Banalyte of interest ^ at some prede-termined concentration range. It is simply a plot of thecoefficient of variation (CV) of the backcalculated calibra-tor concentrations vs. the concentration in log scale thatserves two main purposes. First, during initial assay devel-opment and optimization, where only calibration curvedata may be available, it affords preliminary estimates of the lower and upper quantification limits (QL). Second,the precision profile is a valuable tool in the decision to pro-ceed to exploratory validation. Figure 2 in Appendix A con-tains an illustration of the use of a precision profile of atypical immunoassay. The illustration also demonstrates animportant and often misunderstood concept for immuno-assays that the apparently Blinear ^ portion of the calibrationcurve does not always define the optimal working range foran assay.
Reagents, sample matrix (from patients or other targetpopulation), and substitute matrix for calibrators, if appro-
priate, should be acquired and evaluated for their initialbehavior with regard to assay selectivity, linearity, and rangeof quantitation with calibrator matrix. Sample matrix oftencauses substantial interference with suppressed and variableanalyte signals. Despite the likely adverse effect on theassay’s lower limit of quantification (LLOQ), the commoncorrective strategy is to perform sample cleanup (usually notan option for macromolecules) or to dilute out the matrixinterference until there is no longer a major effect on analyterecovery [the minimum required dilution (MRD)].
The concept of Bspecificity ^ refers to an assay’s ability tounequivocally distinguish the Banalyte of interest ^ fromstructurally similar substances. The degree to which unrelatedmatrix components cause analytical interference is a measureof assay selectivity. The presence of the Bdrug of interest ^ ina test sample can pose a challenge to both an assay’s accuracyand selectivity, particularly when that drug targets directlyinteracts with the Bbiomarker of interest. ^ For immunoassays,the drug binding to the biomarker can substantially alter theantibody Y antigen reaction and influence detection. Assess-ment of the drug interference should be conducted to provideappropriate interpretation of the biomarker data. For exam-ple, a protein drug with a long half-life might affect thedetection of the antidrug antibody results, which wouldrequire special interpretations (19).
If a commercial reagent or kit is used, it is acceptable,during feasibility studies, to use a manufacturer’s quoted
317Fit-for-Purpose Method Validation for Biomarkers

8/6/2019 Fit for Purpose Method Development
http://slidepdf.com/reader/full/fit-for-purpose-method-development 7/17
reagent stability and antibody specificity information. Gen-erally, it is prudent to confirm such data with in-houseexperiments. Care needs to be taken to distinguish betweenthe stability of packaged components and that of storedreconstituted lyophilized components. Generally, reagentexpiry dates may be extended if stability has been proven
in-house using the same acceptance criteria to monitorperformance as those obtained in validation.Early method feasibility studies that choose a commonly
used analytical platform, such as chromatographic methodswith mass spectroscopic detection, or immunoassay, allowflexibility and reliability in outsourcing biomarker assays.Fee-for-service analytical laboratories supporting these com-mon analytical methods generally deliver reliable and expedi-tious, high capacity services. This is particularly relevant whencontemplating large numbers of biomarker assays in late-stageclinical trials. For novel or exploratory biomarker assays ortechniques, consideration of outsourcing early in assay devel-opment can help facilitate technology transfer.
Calibrators, Validation Samples, and Quality ControlsCalibrators. The selection and preparation of the
calibration curve are central in the design, validation, andapplication of all quantitative assay methods. Calibrationcurves prepared from heterogeneous, impure, and/or poorlycharacterized analytes are more likely to yield greateruncertainty and higher variability. For low molecularweight, homogeneous analytes (i.e., <1,000 Da), it should bepossible to construct an assay format that yields consistentdata with a high degree of accuracy and precision. In suchcases, the measurements can be as accurate and precise as seenwith many definitive quantitative assays. Higher molecularweight biomarkers and those of unknown or ill-definedheterogeneity often necessitate analytical compromises,because assumptions must be made regarding assay accuracy.The assumptions underlying such relative quantitative assayscan be tested in Bparallelism ^ experiments (see section Dilu-tion Linearity vs. Parallelism). Should these assumptionsprove invalid, the method would be considered to bequasiquantitative. It is desirable to use a reference standardmaterial from a single lot over the duration of the validation
program. Alternatively, provision should be made for aBbridging ^ standard that can be used for comparisons acrossstudies using different reference standard lots.
Unlike most drug/metabolite assays, biomarker assaymatrices are often complicated by the presence of endoge-nous analyte. Endogenous analyte may be removed by avariety of procedures, such as charcoal stripping, high-temperature incubation, acid or alkaline hydrolysis, or af-finity chromatography. Alternatives to matrix processing in-dclude the use of Bsurrogate ^ protein-containing buffers(which offer better stability, convenience, and long-termconsistency) or a heterologous matrix (e.g., another species)that lacks the analyte or contains a less reactive homolog.These strategies result in a substitute calibrator matrix that isdifferent from the test sample matrix. Nonetheless, theapproach is suitable as long as the agreement in concentra-tion Y response relationship between the calibrators and testsample analyte is acceptable. However, for multiplexed bio-marker assays, removal of endogenous matrix analytes orselection of a synthetic buffered substitute that is suitable forall analytes may be impractical or impossible; thus nonlinear-ity and bias could be inevitable for some of the analytes (24).
Validation Samples and Quality Controls. It is useful todistinguish validation samples (VS), used in assay validationexperiments to estimate intra- and inter-run accuracy/precision and stability, from quality control (QC) samplesthat are used during study sample analysis to judge the
acceptability of assay runs. VS from prestudy validation areusually suitable for subsequent use as QC samples during in-study validation. VS and QC are used to assess the ability of the assay to measure the biomarker of interest for itsintended use, allowing one to distinguish assay variabilityfrom inherent differences between samples. Thus, VS andQC should be as closely related to the study samples aspossible. The availability of rare matrices and the presence of multiple analytes at various concentrations may require theuse of substitute reagents including cell lines, or tissues fromrelated species, necessitating additional validation.
If alternative or less optimal matrices and controls allowthe measurement of a biomarker with adequate precision and
Fig. 2. (a) Precision profile. Data were from an immunoassaycalibration curve. The dashed lines represent the Bpreliminary ^
working range based on a stringent threshold of 10% CV. As theCV based only on the calibration curve data typically underestimatethe overall imprecision of the assay, a more stringent threshold thanthat of validation samples should be used. As discussed in the sectionMethod Feasibility, the precision profile serves as a useful toolduring the assay development and optimization, and as a screening
tool before proceeding to the formal validation phase. (b) Thecalibration curve used for the precision profile in panel (a). Thedashed lines represent the working range derived from the precisionprofile, and the dotted lines represent the linear portion of the curve.Note that the working range does not correspond to the linearportion of the curve. This is true for most assay formats such asimmunoassays (see section Method Feasibility).
318 Lee et al.

8/6/2019 Fit for Purpose Method Development
http://slidepdf.com/reader/full/fit-for-purpose-method-development 8/17
accuracy for the intended use of the data, clinical samplesmay be analyzed with QC samples and calibrators made up inthe substitute matrix. Ultimately, retrospective validation of that matrix may be possible if sufficient amounts of theclinical specimens remain following sample testing. Oneapproach uses VS/QC spiked with known amounts of thebiomarker and prepared after pooling clinical test samplescontaining low concentrations of a biomarker. Basic assayperformance data can thus be generated throughout explor-atory and advanced validation. Cross-validation between thesubstitute and rare matrices is thus possible because theendogenous biomarker concentration can be subtracted fromall results to yield amore accurate assessment of biomarkerconcentrations.
Another approach, similar to that discussed above, is toscreen naive or incurred study specimens with a preliminaryassay to identify those with low or undetectable analyteconcentrations. Such samples are then pooled and supple-mented with varying amounts of reference material to createVS and QC samples across the anticipated range of quan-titation. Depending on its endogenous level, the biomarker
concentration may be ignored or added to the spiked amountsto give the nominal VS and QC sample concentrations.For quasiquantitative or qualitative assays, positive and
negative controls from healthy normal subjects and patientsshould be set up as VS/QCs with the expected responses (orscores) and the toleration limits.
Calibration Curve Model Selection
During the method development phase, an appropriateBworking regression model ^ for the calibration curve shouldbe chosen to optimize the method protocol and to derive thepreliminary performance characteristics of the method. Theregression model can be chosen from calibration data if VSare not available. The optimization of the method protocoland the preliminary assessment of the method performanceshould be based on this working model of the calibrationcurve. This model should be confirmed with data from VSand routinely applied during the sample analysis, unless thereis a major change in the assay protocol or reagents.
An inappropriate choice of the statistical model for thecalibration curve can contribute to the total variability inbiomarker determination and limit the useful assay quantita-tion range. Owing to the wide variety of assay formats andanalytes in biomarker applications, the choice of a curve-fitting model for calibration curves should be tailored to eachanalytical method. Some of the commonly used models
include a variety of polynomial (linear, quadratic, etc.) andnonlinear models (four or five parameter logistic model,power model, etc.). The practical importance of using theright model is discussed and illustrated with an example inAppendix B.
Weighting for Calibration Curves
The default position that the standard deviation (SD) of the assay response is constant for the entire range of thecalibration curve, i.e., every data point is weighted equally, isusually not valid for ligand-binding assays. Curve fittingwithout appropriate weighting for unequal SDs can produce
suboptimal results and incorrect assessment of the true assayperformance [for example, inferior sensitivity and limitedassay range in sandwich enzyme-linked immunosorbent assay(ELISA)]. Thus, a curve-fitting method that assigns weightsto the data proportionate to the amount of variability (SD)should be considered for calibration curves. It should benoted that the weighting is done to reflect and adjust forunequal SDs, not unequal CVs. Appendix C illustrates theimportance of weighting in the bias, precision, and quantifi-cation limits of the analytical method.
Outliers
Outliers may negatively affect the quality of a calibra-tion curve and so must be either removed or accommodatedusing outlier-resistant statistical methods. Setting a prioricriteria for outlier identification and removal is an accept-able, although possibly problematic practice (20). Given thelimited degree of replication and the sample sizes invalidation experiments, outlier tests lack power to detect allbut extreme values and are somewhat arbitrary in the criteria
used to declare a point as an outlier. A less subjective andmore consistent approach is to use outlier-resistant statisticaltechniques. For example, weighting factors may be estimatedwith triplicate calibrators, and the curve fit using medianvalues for each triplicate set. In cases where only duplicatesare available, an alternative is to collaborate with a statisti-cian to use Tukey’s biweight function. In the evaluation of reported results (as opposed to the context of curve fitting,which can be considered part of the assay method), it be-comes important not only to remove the influence of outliers,but also to record their presence. Apparent outliers mayprovide valuable insight into anomalous model or methodperformance, which has significant analytical implications.Evidence for a prozone phenomenon (hook effect) in animmunoassay is a relatively commonplace example. Thus,although it is desirable that summary statistics (e.g., mediansand median absolute deviations) be uninfluenced by outliersand reflect what is happening to most of the data, it is alsonecessary to augment such summary statistics with graphicalanalyses or tabulation that facilitates recognition of possibleoutliers.
Exploratory Method Validation
General Comments
Exploratory Validation (Table II) quantitatively charac-
terizes the assay method with respect to its basic analyticalelements. Such procedures need to be geared to meet thecommon challenge of method validation for numerous anddiverse biomarkers using limited resources.
A biomarker plan is highly recommended to guide theinvestigation of method performance. The plan shouldinclude the requirements of the key elements of the studyand the level of documentation of data. At least threeevaluation runs should be carried out to provide the basicassay performance including accuracy, precision, sensitivity,parallelism (using incurred samples if possible), relativeselectivity (through investigation of likely sources of inter-ference); initial biomarker concentration range in normal
319Fit-for-Purpose Method Validation for Biomarkers

8/6/2019 Fit for Purpose Method Development
http://slidepdf.com/reader/full/fit-for-purpose-method-development 9/17
individuals and in the target population, assay dynamicrange, short-term biomarker stability in the expected biolog-ical matrix, and dilutional linearity using spiked samples. Thedata should be statistically evaluated to estimate if themethod would meet study requirements with respect to theseparameters. Such initial characterization should constitutesufficient method validation to support exploratory studysample testing.
Assay Dynamic Range and Limits of Quantitation/Detection
Assay dynamic range, also known as the Breportablerange, ^ extends from the lower to upper limits of quantifica-tion (LLOQ to ULOQ). Within these limits, the analyte ismeasurable with acceptable levels of accuracy, precision, andtotal error (see section Advanced Method Validation, Accu-racy and Precision for details and illustration). For ligand-binding assays, sample dilution is often validated to extendthe assay range at the higher end for test samples. The utilityof a biomarker assay may be evaluated via an initial assess-ment of baseline samples. This initial assessment may
provide information as to whether an assay will havesufficient sensitivity and dynamic range to cover the targetrange of the potential (inhibitory or stimulatory) impact of adrug. In addition, assessments of biomarker levels in thepresence of high concentrations of drug may provideadditional guidance on suitable assay ranges for PD markers.A common practice is to generate values from individualhumans or animals with and without the targeted diseasestate, whenever possible.
Biomarkers have been used in the clinical diagnosticarena for many years, where the diagnostic kits/reagents areoften Bborrowed ^ for clinical study analyses. These includeBfor research only ^ kits, FDA-approved tests, and othercommercial reagents. Because the intended use of a bio-marker in drug development usually differs from its diagnos-tic utility, each laboratory must define the intendedbiomarker application and carry out the assay validationaccordingly. Typically, initial assay performance is assessedusing the manufacturers’ recommendations to verify the kitspecifications. However, caution should be exercised whenassay sensitivity is evaluated, because the term Blimit of detection ^ (LOD) is often incorrectly used to describe assayBsensitivity ^ (see Table I). LOD is the concentration result-ing in a signal that is significantly higher than that of background (usually mean signal at background + 2 or 3SD), whereas LLOQ is often the lowest concentration thathas been demonstrated to be measurable with acceptable
levels of bias, precision, and total error (20).The use of the calibration curve beyond the lowestquantifiable limit to report the LOD should be undertakenwith caution. It is a common practice in pharmacokinetic(PK) analyses to assign a zero or Bbelow quantifiable limits ^
value to results lower than the LLOQ. For biomarkers,concentrations below LLOQ but above LOD may be useablefor quantitative estimates (e.g., % of control). Even thoughthe variability of these values is high, reporting of thenumeric results can be justified because it provides actualestimates rather than the assignment of Bno result, ^ <LLOQ,or zero (1). This can have a major impact on the studyconclusions if a study group yields many values near the
lower end of the curve. It is also worth noting that the actualstudy sample LLOQ is often different from that of the lowestcalibration curve point, because calibrators may not exhibitparallelism or acceptable analytical precision as the LLOQconcentration (see section Dilution Linearity vs. Parallelism).
Accuracy and Precision
Even though it may not be possible to establish absoluteaccuracy for a biomarker, relative accuracy data can beinformative. An addition recovery experiment is used foraccuracy evaluation over the anticipated analyte concentra-tion range (target range). This test should be conducted inthe biological matrix from a few donors or distinct pools atseveral concentrations over the target range. As mostbiomarkers are present in a given biological matrix, theamount of analyte to be added to the sample should be highenough to minimize the contributory effect from the endog-enous component. It is critical to include multiple measure-ments on unmodified samples in these evaluations.
In general, evaluation of the precision of a biomarker
assay will provide information on the statistical significanceof biomarker results in a study. Similar to drug/metabolitebioanalysis, precision is normally evaluated as intermediateprecision (see Glossary) and intraassay variation (repeatabil-ity) with at least three levels of VS, with divergent concen-trations of analyte, over at least three analytical runs. Theoptimum number of replicates required per level of VS mayvary but, in general, will be higher than suggested for drug/metabolite validations. In many cases, three reportableresults per VS level are adequate and three assay runs are astarting point; however, additional assay runs will likely beneeded to draw statistically sound conclusions. Between-runvariance usually exceeds the within-run variance in ligand-binding assays. It is thus usually preferable to increase thenumber of runs as opposed to increasing replication within arun to statistically improve the estimates of interassayprecision.
Dilution Linearity vs. Parallelism
The absence of suitable blank matrices means that manybiomarker immunoassays use calibrators prepared in asubstitute matrix that differs from the test sample matrix.Parallelism documents that the concentration Y response rela-tionship of the analyte in the sample matrix from the studypopulation is sufficiently similar to that in the substitutematrix. Parallelism between dilution curves, where dilution of
test samples in the range of the calibration curve does notresult in significantly different extrapolated analyte concen-trations, validates the use of the substitute matrix forcalibrator preparation. Results of these experiments mayalso define suitable dilution ranges should dilution benecessary to alleviate matrix effects.
A substantial departure from parallelism would invali-date the use of reference standards and would indicate theneed for a quasiquantitative interpretation, for which uncal-ibrated assay signal is reported. It is important to emphasizethat method validity can be achieved in the face of atolerable degree of nonparallelism, as opposed to a completelack of nonparallelism. Experimental approaches are pre-
320 Lee et al.

8/6/2019 Fit for Purpose Method Development
http://slidepdf.com/reader/full/fit-for-purpose-method-development 10/17
sented in Appendix D. Figure 6a and b shows cases of pro-ven and failed parallelism plotted on two commonly usedcharts.
When available samples contain too little analyte toperform parallelism assessments, method selectivity may beassessed using spiked recovery and dilution linearity of spiked samples. For PK assays, dilutional linearity demon-strates accuracy for samples with concentrations above theULOQ after dilution into the assay range, and furtherdemonstrates the lack of a high dose hook effect. If thereference standard is reflective of the endogenous biomarkerand the test conducted with multiple dilutions includingsamples from multiple donors, dilutional linearity supportsparallelism.
Stability Testing V Short Term and Benchtop
Biomarker storage stability can be a complex issueowing to the difficulties in defining biomarker stability understorage conditions and in judging the adequacy of the assaymethod to monitor stability changes. A case-by-case evalua-
tion must be made to address whether chromatographic,immunoreactive, or biological activity assays are mostappropriate to monitor stability of a given biomarker orbiomarker family. One should beware that, unlike smallmolecules, stability measures of endogenous macromoleculescan be method-dependent. For example, aggregation result-ing from freezing samples might change the binding charac-teristics for an immunoassay to show instability, whereas anLC-MS or HPLC assay might not render the same result. Forimmunoassays, antibodies that recognize epitopes distal tothe site of the biological activity could also lead to misleadingstability data. Stability data should be interpreted with theunderstanding of the method in relevance to the biology of the biomarker. Besides degradation, reactions producing theanalyte can occur to artificially increase the analyte concen-tration in the biological matrix. Therefore, careful consider-ation should be given to optimal, practical sample storageconditions to minimize these possibilities.
Some commonly used conditions to evaluate biomarkershort-term and benchtop stability include: whole blood atambient temperature for most flow cytometric assays, cellmedium or human peripheral blood mononuclear cells forintracellular proteins, and serum/plasma samples for mostextracellular proteins at ambient, refrigerator, or ice-waterbath, and j 20-C (as many clinical sites do not have j 80-Cfreezers). If a biomarker is unstable in a processed matrixafter 24 h storage, it will be of limited value to support drug
development.Analogous to the approach to evaluation of samplecollection integrity (see section Sample Collection), analyteshort-term storage stability should be evaluated underconditions mimicking those expected at a typical clinical siteand in the intended matrix from the study population. Theuse of incompletely characterized reference standards to pre-pare VS/QC samples for stability evaluation may not reflectthat of the clinical samples. Incurred samples or healthydonor samples of sufficiently high biomarker concentrationsfrom multiple donors could be used in the stability test.
For an exploratory validation, it is advised that samplesfrom at least three individual sources be evaluated for short-
term storage. Pools are best avoided where possible unlessrequired to obtain sufficient volumes. Furthermore, it may beappropriate during an exploratory validation to cite literaturefor stability information for certain collection conditions.
Advanced Method Validation
General Comments
Because method validation is an iterative, evolvingprocess (Fig. 1), all of the performance characteristics listedin the exploratory validation should also be included in theadvanced validation, with additional characterization asdescribed in the following sections. The increased rigor of advanced validation is undertaken in a scaled, fit-for-purposeapproach as the impact of the biomarker data on decisionsaround critical safety, efficacy, pharmacodynamic, differenti-ation, or surrogate information increases. Methods undergo-ing advanced validation may have been validated and usedfor sample testing. Alternatively, advanced validation may beundertaken as the initial phase of formal performance
characterization for the method. In the former case, in-studyvalidation (QC sample recovery) represents an ideal sourceof data because it reflects accuracy/precision performancefrom actual assay use. The advanced validation biomarkerwork plan for such a method would include experiments tosupplement, rather than replace, existing validation data. If the existing validation data do not fully meet the work planrequirements, more experiments in the prevalidation shouldbe conducted as depicted in the broken arrows in Fig. 1. Thebiomarker work plan for advanced validation should considerthe level of document control as discussed in the conferencereport (1).
Selectivity and Matrix Effect
During the advanced validation, more rigorous testing of potential interfering endogenous components should beimplemented as later-stage clinical trials typically includemore diverse populations (including patients) with lesscontrol of diet and sample collection, and more concomitantmedications. In addition, hemolysis, lipidemia, elevatedbilirubin, and other matrix environments would present morecommonly. Methods should not be considered suitable forthe analysis of samples containing elevated levels of thesesubstances until proven by matrix interference experiments.The selectivity of the assay in the presence of endogenoussubstances can be evaluated by using blank matrices from
multiple individuals (and both genders). In addition, a knownconcentration of the biomarker can be spiked into thevarious individual lots of blank matrix to assess the recovery.
Accuracy and Precision
The advanced validation entails a sufficient number of validation batches (such as six independent runs) to provideincreasingly rigorous statistical data for the confidence of theassay performance. The calibration curves should include aminimum of six nonzero concentration calibrators, and theVS should span at least five independently (if possible)prepared concentrations in duplicate or more. Two of the VS
321Fit-for-Purpose Method Validation for Biomarkers

8/6/2019 Fit for Purpose Method Development
http://slidepdf.com/reader/full/fit-for-purpose-method-development 11/17
levels should be at or near the target LLOQ, one near themiddle of the range, and two at or near the target ULOQ.The VS levels (except at the LLOQ and ULOQ) should notbe identical to the calibrator concentrations, and should notbe used as part of the calibration curve.
Analysis of the prestudy validation data described abovecan be used to estimate the bias, intermediate precision, andtotal error (20). Using these results, the sensitivity andworking range of the assay can be established. The LLOQis defined as the lowest concentration at which the total erroris within a prespecified threshold (e.g., 30%). The ULOQ isdefined similarly.
Figure 4 shows the Total Error profile (solid line) andthe absolute value of the percent bias (dashed line) for VS ina validation experiment of a biomarker assay. As the twolowest concentration samples have total error greater thanthe 30% threshold used as the criteria in this example, theLLOQ is established at the next highest VS concentrationtested ( õ 14 pg/mL). In this experiment, the ULOQ is set atthe highest VS tested concentration tested because all thehigh samples are within 30% total error.
Using these validation data, the model for the calibra-tion curve and the weighting method may be finalized andconfirmed. Various mathematical models may be fit to thecalibration curve data from each run (e.g., linear, four-parameter logistic, and five-parameter logistic). Then, thetotal error, bias, and precision may be estimated with respectto each of these models. The model that results in the lowesttotal error throughout the entire range of the curve is thenchosen for the production (in-study) phase of the assay. Thisis illustrated in Fig. 4, section Calibration Curve ModelSelection, and Appendix B (calibration curve model selec-tion). Similarly, the optimal weighting method can also bechosen based on these data.
If test/study samples need to be diluted to accommodatelimits of the method range, then dilutional linearity should beestablished within the context of parallelism assessment asdescribed in section Assay Dynamic Range and Limits of Quantitation/Detection, and the maximum tolerable dilutionshould be determined based on the validation sample data.Dilutional linearity can be assessed with respect to theprespecified limit on the CV of the difference between thedilution-adjusted results and the expected results. Forexample, if the specified limit on the CV is 20%, then themaximum tolerable dilution is the highest dilution where theCV is within 20%.
Where VS are in the same matrix as test samples, andthere is endogenous biomarker present in the matrix used,
then actual values need to take the endogenous concentra-tion into account. This will help assign Bnominal ^ targetvalues for the VS and QC samples in prestudy and in-studyvalidation. The endogenous level can be estimated via directinterpolation from the calibration curve, and if that is notpossible, it can be estimated via the Bstandard additions ^
method. Here, linear regression (in log scale) of observedresults ( y) vs. expected results ( x) of VS/QC samples is rec-ommended. The negative X -intercept approximately quanti-fies the endogenous component and when multiplied by j 1and added to the expected result value will yield theBestimated ^ nominal target value to be used when calculatingbias.
Parallelism
In addition to the basic considerations described inDilution Linearity vs. Parallelism, the advanced validationshould ensure that the issue of parallelism has been exploredin the targeted population, and that if a substantial deviationfrom ideal behavior exists, the implications of the significantnonparallelism for the reliable estimation of analyte concen-trations are understood. One aspect of the interpretation of such results will be the relationship of the reference stand-ards used to prepare VS and calibrators to the endogenousanalyte, and indeed (when appropriate) the variability of reference standards from commercial kit to commercial kitfrom different vendors, and between lots of commercial kitsfrom the same vendor.
In the case that a calibration curve has a different curveshape than that in study matrix, decisions should be made onwhat the assay reporting ranges will be, whether a differenttype of matrix should be used for the calibration curve, orwhether dilutions to the study samples will alleviate thisconcern. It may be prudent in the longer term to expend
considerable time and effort to obtain a matrix as close aspossible to that of the study samples. The key issue here is toensure the reliability of an assay and to seek consistency inthe concentration Y response behavior of the reference stan-dard from lot to lot. It must be recognized that in some casesit may not be possible to assess parallelism until incurred (orother) samples are available that contain high enoughconcentrations of the biomarker of interest. In these cases,other experiments may be used to give confidence thatinterferences from the matrix of interest are not present.However, these do not investigate the tolerability of non-parallelism, and therefore the specific experiments outlinedin Dilution Linearity vs. Parallelism and Appendix D shouldstill be conducted retrospectively. If nonparallelism exists, itsextent, tolerability, and effect on data interpretation shouldbe considered.
Stability Testing V Freeze/Thaw and Long Term
Advanced validation should include assessments of freeze/thaw and long-term stability sufficient to cover therange of conditions to which samples are likely expected tobe exposed. Practical limitations to the assessment of long-term stability of incurred sample storage may occur, partic-ularly for extended longitudinal studies in which specificbiomarker measures are not identified at study initiation.Interpretation of biomarker modulation from extended in-life studies should consider any uncertainties in long-termstability assessments.
Validation for Reagent or Change Control
As a drug development program matures, consistency inthe performance of a biomarker method over a long period isan important consideration. Data commenting on suchconsistency, which is an aspect of the robustness (seeGlossary) of the assay, may be generated over time by theuse and evaluation of VS pool results, or by a series of experiments designed to test the response of the method to
322 Lee et al.

8/6/2019 Fit for Purpose Method Development
http://slidepdf.com/reader/full/fit-for-purpose-method-development 12/17
anticipate perturbations of the assay environment. Further-more, additional validation and systematic comparison of method revisions may be necessary to ensure the reliability of biomarker measurements. The need for such additionalvalidation work (e.g., qualification, cross-validation, partialvalidation, or revalidation, depending on circumstances) mayarise as a result of a change in critical assay reagent(s) (e.g.,antibody lot or kit vendor), assay laboratory (e.g., transferfrom a pharmaceutical company to contract research organi-zation), process instrumentation (e.g., plate reader or roboticpipette upgrade), or methodology (e.g., plate-based ELISAto point-of-care devices). For successful biomarker applica-tions, the laboratory should consider having defined proce-dures (e.g., SOPs) for qualification/requalification of keyanalytical reagents.
In-Study Validation and Sample AnalysisAcceptance Criteria
The in-study validation phase seeks to ensure that the
assay continues to perform as per predefined specifications ineach study run (i.e., to ensure the assay remains Bin control ^ ).This entails the use of QC samples, typically at threelevels V at low, mid, and high concentration of the analytewith at least two replicates at each level.
Ideally, the QC samples used in the in-study sampleanalysis phase should be prepared identically to the VS usedin the prestudy validation phase, although this is not anabsolute necessity. Where this is possible, it avoids the needfor reassessment (e.g., lot-to-lot changes) and assignment of Bnominal ^ target values for the purpose of calculating bias.Such continuity of samples for the purpose of assay controlensures that assay performance has not changed from theprestudy validation phase.
The similarity of the reference standard to the analyte instudy samples should be investigated as described in DilutionLinearity vs. Parallelism if such samples were not evaluatedduring the prestudy validation phase. Stability of thebiomarker may also need to be assessed at this stage if samples with high enough concentrations of the biomarker of interest have not been available. If possible, incurred samplesshould be used to perform stability testing instead of spikedsamples.
It is important that the approaches for assessment of method performance are suitable for the intended purpose.QC methods used in PK assays [e.g., the 4 Y 6 Y X scheme; (21),see Glossary)] and clinical diagnostics (control charts with
confidence limits) may both be applicable. The laboratoryperforming the analysis should choose the most relevantmethod to use and justify it based on relevant scientific andstatistical grounds and on clinical need. These judgments willbe pivotal in order to assign an appropriate value to X (thetotal error, or bias + precision) in the 4 Y 6 Y X scheme.
It should be emphasized that the acceptance criteria forbiomarker assays will depend heavily on the intended use of the assay and should be based on physiological variability aswell. The appropriate value of X in 4 Y 6 Y X can be determinedbased on the variability of the total error estimates inprestudy validation. When it is feasible to use more QCsamples in each run, 8 Y 12 Y X or 10 Y 15 Y X will have much
better statistical properties than the 4 Y 6 Y X criterion. Alter-natively, use of control charts (25) or tolerance limits (26,27)provides better control of relevant error rates, and thus maybe preferable to the approach of fixed criteria.
As indicated above, an important consideration fordefining the performance criteria of most biomarker methodsis the physiological/biological variability in the study popula-tion of interest and other variables such as diurnal effect,operator, instrument, etc. (28). That is, to determine whethera biomarker method is fit-for-purpose, we should determinewhether it is capable of distinguishing changes that arestatistically significant based on the intra- and intersubjectvariation. For example, an assay with 40% total errordetermined during validation may be adequate for statisti-cally detecting a desired treatment effect in a clinical trial fora certain acceptable sample size, but this same assay may notbe suitable for a clinical trial involving a different studypopulation that has much greater physiological variability.Thus whenever possible, physiological variation should beconsidered when evaluating the suitability of biomarkermethods for specific applications. When the relevant physi-
ological data (e.g., treated patients of interest) are notavailable during the assay validation phase, then healthydonor samples should be used to estimate the intra- andinter-subject variation. If healthy donor samples are notavailable, then other biological rationale should be consid-ered and periodically updated as more information becomeavailable. In the absence of physiological data or otherbiological rationale, only the assay performance character-istics determined from validation experiment such as the bias,precision, and total error should be reported. The sensitivityand dynamic range of the assay can be defined based on aBworking criteria ^ of say, 20 or 30%, on bias, precision and/ortotal error. However, any decision regarding the suitability of the assay should be based on the availability of adequateinformation related to the physiological data.
Setting a definitive acceptance criteria on the desiredanalytical precision and total error a priori may not beappropriate (or even possible) when taking into account allpossible outcomes in the analytical phase V especially as thevalues seen in the incurred samples may not be what isexpected or predicted. This is especially the case for new ornovel biomarkers as opposed to those where historicalinformation in normal and diseased populations is available.However, the Bworking criteria ^ can be used as a prioricriteria to track assay performance.
CONCLUSIONS
Biomarker data can be extremely valuable as earlypredictors of drug effects and can yield important efficacyand safety information regarding the dose Y response relation-ship. Thus, biomarkers are potentially useful for successfuland efficient drug development. The intended diverse arraysof biomarker applications present an analytical challengewhen one attempts to adopt regulatory guidelines for eitherPK assays or diagnostics development. This paper is theresult of intense and ongoing discussions by the authors fol-lowing the AAPS 2003 Biomarker Workshop (1). Here wepropose the conceptual strategy for a fit-for-purpose approach
323Fit-for-Purpose Method Validation for Biomarkers

8/6/2019 Fit for Purpose Method Development
http://slidepdf.com/reader/full/fit-for-purpose-method-development 13/17
for biomarker method development and validation (depictedin Fig. 1) with four activities: prevalidation (preanalyticalconsideration and method development), exploratory valida-tion, in-study validation, and advanced validation. Therecommended processes of these activities are summarizedin Table II. A biomarker work plan should be prepared todefine the study purpose and requirements. The recommen-ded basic approaches are conceived and designed to avoidmajor pitfalls without stifling research efficiency. The keyelements for fundamental validation include sample stabilityfrom the time of collection, preparation of calibrators, VSand QCs, setting target and dynamic ranges with appropriatecalibration curve-fitting, selectivity, precision, and accuracy.The process from exploratory to advanced validation iscontinuous and iterative with increasing rigor for all thevalidation elements, and with additional needs focused onmethod robustness, cross-validation, and documentation con-trol. Critical differences between biomarker assays and those of drugbioanalysis and diagnosticshavebeendiscussed to provideclarification to readers more familiar with the latter disciplines.We hope that this position paper will stimulate more discussion
and foster consensus building on best practices in the relativelyyoung field of biomarker development.
Acknowledgments
The authors are grateful to Ronald R. Bowsher, PhD(Linco Diagnostic Services), for providing encouragementand critical review on the manuscript. We also thank WesleyTanaka, PhD, and Omar Laterza, PhD (Merck & Co.) forproviding input and suggestions.
Glossary
The following definitions are meant to be valid in thecontext of bioanalytical methods. Not all definitions will beconsistent with terminology from other disciplines.
1. Accuracy: Per the FDA Guidance on BioanalyticalMethod Validation (May, 2001), Accuracy of an analyticalmethod describes the closeness of mean test results obtainedby the method to the true value (concentration) of theanalyte. This is sometimes referred to as Trueness or Bias.
2. Advanced Validation: A method validation that requiresmore rigor and thorough investigation, both in validation tasksand documentation, to support pivotal studies or criticaldecisions; e.g., differentiating subtle graded drug effects,
monitoring drug safety, or for submission to regulatoryagencies for drug approval.3. Biomarker: A characteristic that is objectively measured
and evaluated as an indicator of normal biologic processes,pathogenic processes, or pharmacologic response to a ther-apeutic intervention.
4. Clinical Endpoint: A characteristic or variable thatreflects how a patient feels, functions, or survives.
5. Clinical Qualification: The evidentiary and statisticalprocess linking biologic, pathologic and clinical endpoints tothe drug effect, or linking a biomarker to biologic and/orclinical endpoints.
6. Definitive Quantitative Assay: An assay with well-
characterized reference standards, which represents theendogenous biomarker, and uses a response Y concentrationstandardization function to calculate the absolute quantita-tive values for unknown samples.
7. Dilution(al) Linearity: A test to demonstrate that theanalyte of interest, when present in concentrations above therange of quantification, can be diluted to bring the analyteconcentrations into the validated range for analysis by themethod. Samples used for this test are, in general, the onescontaining high concentrations of spiked analyte, not endog-enous analyte.
8. Dynamic Range: The range of the assay that is de-monstrated from the prestudy validation experiments to bereliable for quantifying the analyte levels with acceptablelevels of bias, precision, and total error.
9. Exploratory Validation: Method validation that is lessrigorous but adequate to meet study needs; e.g., looking forbig effects in drug candidate screen, mechanism exploration,or internal decision with relatively minor impact to the finalproduct, and not used for submission to regulatory agencies.10. Interference: (1) Analytical interference: presence of
entities in samples that causes a difference in the measuredconcentration from the true value. (2) Physicochemical inter-ference (matrix interference): A change in measured physi-cal chemical property of the specimen (e.g., excess bilirubinor hemoglobin, ionic strength, and pH) that causes a differ-ence between the population mean and an accepted refer-ence value.11. Intermediate Precision: Closeness of agreement of results measured under changed operating conditions withina laboratory; e.g., different runs, analysts, equipments, orplates, etc. This is one of the three types of Precision.12. Limit of Detection: A concentration resulting in a signalthat is significantly different (higher or lower) from that of background. Limit of detection is commonly calculated frommean signal at background T 2 or 3 standard deviations. Thisis often described as the analytical Bsensitivity ^ of the assayin a diagnostic kit.13. Limit of Quantification: Highest and lowest concentra-tions of analyte that have been demonstrated to be measur-able with acceptable levels of bias, precision, and total error.The highest concentration is termed the Upper Limit of Quantification, and the lowest concentration is termed theLower Limit of Quantification.14. Minimum Required Dilution: The minimum dilutionrequired to dilute out matrix interference in the sample foracceptable analyte recovery.15. Parallelism: Relative accuracy from recovery tests on the
biological matrix, incurred study samples, or diluted matrixagainst the calibrator calibrators in a substitute matrix. It iscommonly assessed with multiple dilutions of actual studysamples or samples that represent the same matrix and analytecombination of the study samples.16. Pharmacodynamic: The relationship between drug con-centrations and biochemical and physiological effects of drugs and mechanisms of drug action.17. Precision: Precision is a quantitative measure (usuallyexpressed as standard deviation and coefficient of variation)of the random variation between a series of measurementsfrom multiple sampling of the same homogenous sampleunder the prescribed conditions. If it is not possible to obtain
324 Lee et al.

8/6/2019 Fit for Purpose Method Development
http://slidepdf.com/reader/full/fit-for-purpose-method-development 14/17
a homogenous sample, it may be investigated using artificial-ly prepared samples or a sample solution. Precision may beconsidered at three levels: 1. Repeatability, 2. IntermediatePrecision, and 3. Reproducibility.18. Precision Profile: A plot of the coefficient of variationof the calibrated concentration vs. the concentration in logscale. It provides preliminary estimates of the quantificationlimits and feasibility assessments on the intended range.19. Quality Controls: A set of stable pools of analyte,prepared in the intended biological matrix with concentra-tions that span the range claimed for the test method, used ineach sample assay run to monitor assay performance forbatch acceptance.20. Qualitative Assay: The assay readout does not have acontinuous proportionality relationship to the amount of analyte in a sample; the data is categorical in nature. Datamay be nominal (positive or negative) such as presence orabsence of a gene or gene product. Alternatively, data mightbe ordinal, with discrete scoring scales (1 to 5, j +, +++, etc.),such as immunohistochemistry assays.21. Quasiquantitative Assay: (Quasi: Bpossesses certain at-
tributes^) A method that has no calibrator, has a continuousresponse, and the analytical result is expressed in terms of a
characteristic of the test sample. An example would be anantidrug antibody assay that is express as titer or % bound.22. Relative Quantitative Assay: A method which uses cali-brators with a response Y concentration calibration function tocalculate the values for unknown samples. The quantificationis considered relative because the reference standard is eithernot well characterized, not available in a pure form, or is notfully representative of the endogenous biomarker.23. Relative Accuracy: For relative quantitative methods,absolute accuracy is not possible to evaluate due to theunknown nature of the endogenous biomarker. Relativeaccuracy is the recovery (see below) of the reference standardspiked into the study matrix.24. Recovery: The quantified closeness of an observed resultto its theoretical true value, expressed as a percent of thenominal (theoretical) concentration. Recovery is often used asa measure of accuracy.25. Repeatability: Closeness of agreement between results of successive measurements of the same samples carried out inthe same laboratory under the same operating conditionwithin short intervals of time. It is also termed intraassay orintrabatch precision. This is one of the three types of Precision.26. Reproducibility: Closeness of agreement of results mea-sured under significantly changed conditions; e.g., inter labo-
ratory, alternate vendor of a critical reagent. This is alsoreferred to as cross validation.27. Robustness of the assay: A measure of the capacity of amethod to remain unaffected by small, but deliberate changesin method parameters and provides an indication of itsreliability during normal run conditions.28. Selectivity: The ability of a method to determine theanalyte unequivocally in the presence of components that maybe expected to be present in the sample.29. Sensitivity: The lowest concentration of analyte that ananalytical method can reliably differentiate from background(limit of detection).30. Specificity: The ability of assay reagents (e.g., antibody)
to distinguish between the analyte, to which the reagents areintended to detect, and other components.31. Surrogate Endpoint: A biomarker that is intended tosubstitute for a clinical endpoint. A surrogate endpoint isexpected to predict clinical benefit or harm (or lack of benefitor harm) based on epidemiologic, therapeutic, pathophysio-logic, or other scientific evidence.32. Target Range: Range of analyte concentrations wherethe study samples are expected to fall.33. Total Error: The sum of all systematic bias and variancecomponents that affect a result; i.e., the sum of the absolutevalue of the Bias and Intermediate Precision. This reflects thecloseness of the test results obtained by the analytical methodto the true value (concentration) of the analyte.34. Validation: It is the confirmation via extensive laboratoryinvestigations that the performance characteristics of an assayare suitable and reliable for its intended analytical use. Itdescribes in mathematical and quantifiable terms the perfor-mance characteristics of an assay.35. Validation samples: Test samples in biological matrixmimicking study samples, endogenous and/or spiked, used in
prestudy validation to provide characterizations of assayperformances; e.g., intra- and inter-run accuracy and precision,and analyte stability.
APPENDIX A
Precision profiles of calibration curves
The Precision Profile is a plot of the coefficient of variation of the calibrated concentration vs. the true concen-tration in log scale. The standard error of the calibratedconcentration should include the variability of both the assayresponse and the calibration curve. Complex computationprograms can be implemented with the help of a statistician(29) or simple calculations can be performed in an Excelspreadsheet.
A Precision Profile of an ELISA standard curve basedon a four-parameter logistic (4PL) model with weighting isshown in Fig. 2a. In this example, the quantitative limits at 10and 2,000 pg/mL do not approximate the bounds of Blinear ^
portion of the calibration curve that is typically symmetricaround EC 50 . This is attributable to the relatively lowervariability (standard deviation) of the low response valuesand the relatively higher variability of the higher responsevalues. Thus the quantitative range of the curve/assay maynot be at the apparently Blinear ^ region of the curve/assay
(see Fig. 2b). This is usually true for immunoassays and mostother assay formats where the response error variability isnot constant across the entire range of the response.
APPENDIX B
Calibration curve model selection
Using data from a validation experiment, we describe acomputation procedure for selecting the appropriate calibra-tion curve model. Some of the calculations below, such asbias, precision and total error, can be easily implemented in
325Fit-for-Purpose Method Validation for Biomarkers
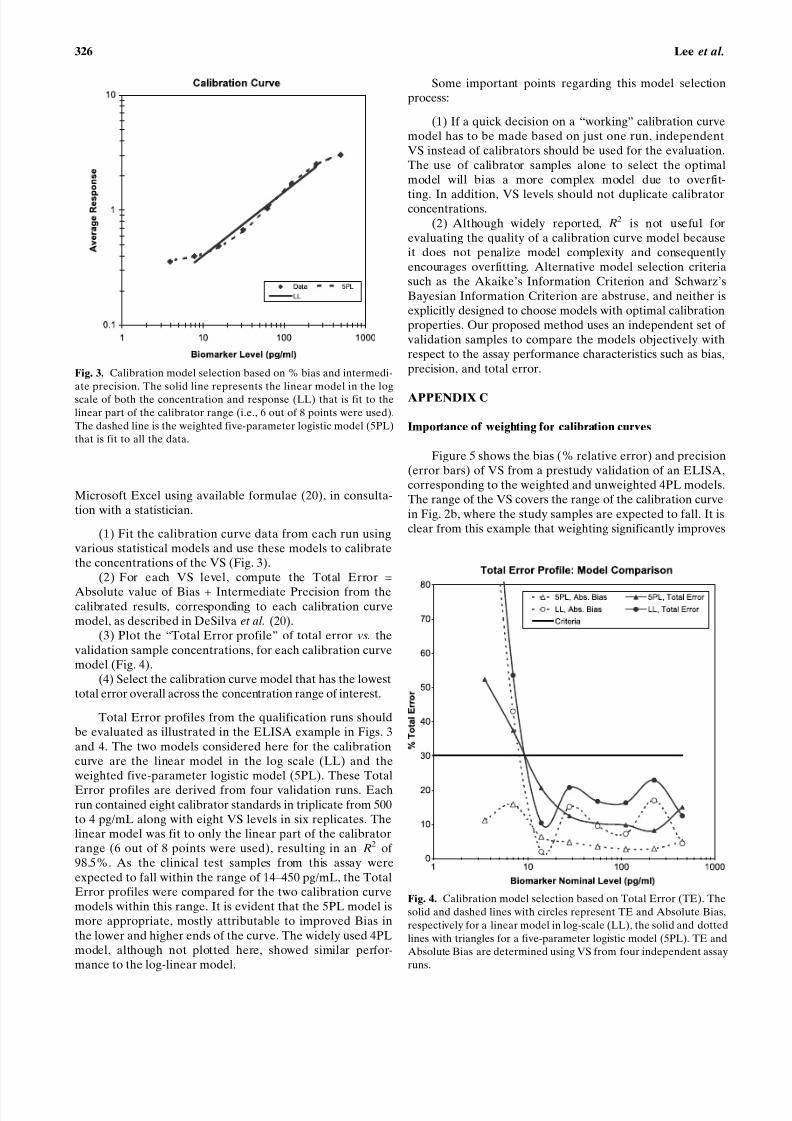
8/6/2019 Fit for Purpose Method Development
http://slidepdf.com/reader/full/fit-for-purpose-method-development 15/17
Microsoft Excel using available formulae (20), in consulta-tion with a statistician.
(1) Fit the calibration curve data from each run usingvarious statistical models and use these models to calibratethe concentrations of the VS (Fig. 3).
(2) For each VS level, compute the Total Error =Absolute value of Bias + Intermediate Precision from thecalibrated results, corresponding to each calibration curvemodel, as described in DeSilva et al. (20).
(3) Plot the BTotal Error profile ^ of total error vs. thevalidation sample concentrations, for each calibration curvemodel (Fig. 4).
(4) Select the calibration curve model that has the lowesttotal error overall across the concentration range of interest.
Total Error profiles from the qualification runs shouldbe evaluated as illustrated in the ELISA example in Figs. 3and 4. The two models considered here for the calibrationcurve are the linear model in the log scale (LL) and theweighted five-parameter logistic model (5PL). These TotalError profiles are derived from four validation runs. Eachrun contained eight calibrator standards in triplicate from 500to 4 pg/mL along with eight VS levels in six replicates. Thelinear model was fit to only the linear part of the calibratorrange (6 out of 8 points were used), resulting in an R2 of 98.5%. As the clinical test samples from this assay wereexpected to fall within the range of 14 Y 450 pg/mL, the TotalError profiles were compared for the two calibration curvemodels within this range. It is evident that the 5PL model ismore appropriate, mostly attributable to improved Bias inthe lower and higher ends of the curve. The widely used 4PLmodel, although not plotted here, showed similar perfor-mance to the log-linear model.
Some important points regarding this model selectionprocess:
(1) If a quick decision on a Bworking ^ calibration curvemodel has to be made based on just one run, independentVS instead of calibrators should be used for the evaluation.The use of calibrator samples alone to select the optimalmodel will bias a more complex model due to overfit-
ting. In addition, VS levels should not duplicate calibratorconcentrations.(2) Although widely reported, R 2 is not useful for
evaluating the quality of a calibration curve model becauseit does not penalize model complexity and consequentlyencourages overfitting. Alternative model selection criteriasuch as the Akaike’s Information Criterion and Schwarz’sBayesian Information Criterion are abstruse, and neither isexplicitly designed to choose models with optimal calibrationproperties. Our proposed method uses an independent set of validation samples to compare the models objectively withrespect to the assay performance characteristics such as bias,precision, and total error.
APPENDIX C
Importance of weighting for calibration curves
Figure 5 shows the bias (% relative error) and precision(error bars) of VS from a prestudy validation of an ELISA,corresponding to the weighted and unweighted 4PL models.The range of the VS covers the range of the calibration curvein Fig. 2b, where the study samples are expected to fall. It isclear from this example that weighting significantly improves
Fig. 3. Calibration model selection based on % bias and intermedi-ate precision. The solid line represents the linear model in the logscale of both the concentration and response (LL) that is fit to thelinear part of the calibrator range (i.e., 6 out of 8 points were used).The dashed line is the weighted five-parameter logistic model (5PL)that is fit to all the data.
Fig. 4. Calibration model selection based on Total Error (TE). Thesolid and dashed lines with circles represent TE and Absolute Bias,respectively for a linear model in log-scale (LL), the solid and dottedlines with triangles for a five-parameter logistic model (5PL). TE andAbsolute Bias are determined using VS from four independent assayruns.
326 Lee et al.

8/6/2019 Fit for Purpose Method Development
http://slidepdf.com/reader/full/fit-for-purpose-method-development 16/17
the recovery (total error) of the VS across the range of interest, and thus can have a tremendous impact on theperformance of an analytical method.
In general, the weights should be estimated based onmultiple runs of replicate data using one of the methodsdescribed by Carroll and Ruppert (29) in consultation with astatistician. We recommend this practice during methoddevelopment and prestudy validation. The estimated weight-ing factor/parameter derived from the prestudy validationshould then be used to fix the weights for the calibrationcurves generated during the sample analysis.
APPENDIX D
Parallelism experiments
The following are points to consider in constructingparallelism experiments. Some of the following experimentswill not be part of exploratory validation, but may be carriedout in subsequent stages of validation. The experimentsshould be performed on a case-by-case and matrix-by-matrixbasis with a fit-for-purpose approach.
(1) The parallelism sample(s) should be serially dilutedto result in a set of samples having analyte concentrationsthat fall within the quantitative range of the assay. Ideally,the diluent should be the same as the intended sample matrixif an analyte-free matrix is available. In practice, the diluentused should be the same as that used for the calibrators.
(2) Samples from at least three individual donors shouldbe used. They should not be pooled unless the samplevolumes are too small. Pooled samples could result inpotential assay interferences (e.g., aggregates) and falsenonparallelism. Lot-to-lot consistency of parallelism shouldbe noted.
(3) When only limited samples are available at a highanalyte concentration, the approach of mixing a high- with a
low-concentration sample at various ratios and correlatingthe concentration to the proportion may be considered.
(4) When no samples of high analyte concentration areavailable, the endogenous level may be increased by stimu-lation of transfected cells, or by use of a nontarget populationsource (e.g., differing in gender or species), if applicable.
(5) Varying cell counts may be used instead of dilution if the analyte is intracellular.
The measured concentrations of the dilution samples canbe plotted against 1/dilution factor using log scales and a linearregression performed. Some individuals use observed resultsvs. expected where there is confidence in the actual concen-tration of the analyte in the samples used. Parallelism isproven when the results show a slope of nearly 1. The brokenline in Fig. 6a approached parallel with a slope of 0.995,compared to the less parallel, solid line with a slope of 0.877.
Alternatively, the coefficient of variation (CV) amongthe recovered concentrations at different dilutions of the testsample can be used to verify parallelism (30). The value of this CV can be adapted on a case-by-case basis based onconsiderations of other assay performance parameters aswell. Figure 6b shows a plot with the Brecovered ^ concen-trations replaced by Bdilution adjusted ^ concentrations
Fig. 5. Weighting for calibration curves. The solid line and thedashed line are the % bias corresponding to the weighted andunweighted four-parameter logistic model, respectively. The errorbars represent the intermediate precision of the assay. The %relative error and the intermediate precision are determined using
VS from four independent assay runs.
Fig. 6. Parallelism. Data from two individual samples to showparallelism ( Í ) or the lack of it ( r ). The same dataset was plottedas (a) observed concentration vs. 1/dilution factor, or (b) dilutionadjusted concentrations vs. 1/dilution factor.
327Fit-for-Purpose Method Validation for Biomarkers

8/6/2019 Fit for Purpose Method Development
http://slidepdf.com/reader/full/fit-for-purpose-method-development 17/17
(observed concentration  dilution factor) because theabsolute concentration is usually unknown. CV was 5.1%for the matrix that showed parallelism, and 58.7% for the onethat did not.
REFERENCES
1. J. W. Lee, R. S. Weiner, and J. M. Sailstad et al. Methodvalidation and measurement of biomarkers in nonclinical andclinical samples in drug development. A conference report.Pharm RRes R22:499 Y 511 (2005).
2. J. A. DiMasi, R. W. Hansen, and H. G. Grabowski. The price of innovation: new estimates of drug development costs. J RHealthEcon R22:151 Y 185 (2003).
3. J. M. Reichert. Trends in development and approval times fornew therapeutics in the United States. Nat RRev RDrug RDiscov R2:695 Y 702 (2003).
4. FDA Mar 2004 report. Innovation or Stagnation? Challenge andopportunity on the critical path to new medical products. Avail-able at http://www.fda.gov/oc/initiatives/criticalpath/.
5. E. Zerhouni. Medicine. The NIH roadmap. Science 302:63 Y 72(2003).
6. G. J. Downing (ed). Biomarkers and surrogate endpoints:
clinical research and applications. Proceedings of the NIH Y
FDA Conference held on April 15 Y 16, 1999. Elsevier, NewYork, 2000.
7. G. Levy. Mechanism-based pharmacodynamics modeling. Clin.Pharmacol. Ther. 56:356 Y 358 (1994).
8. C. C. Peck, W. H. Barr, and L. Z. Benet et al. Opportunities forintegration of pharmacokinetics, pharmacodynamics, and tox-icokinetics in rational drug development. Pharm. Sci. 81:600 Y 610(1992).
9. W. A. Colburn. Selecting and validating biologic markers fordrug development. J. Clin. Pharmacol. 37:355 Y 362 (1997).
10. E. S. Vesell. Advances in pharmacogenetics and pharmacoge-nomics. J. Clin. Pharmacol. 40:930 Y 938 (2000).
11. Guidance for industry on bioanalytical method validation:availability. Fed. Regist. 66:28526 Y 28527 (2001).
12. Code of Federal Regulations, Title 21, Vol. 1. Good LaboratoryPractice for Nonclinical Laboratory Studies. Revised April 1, 2001.
13. Code of Federal Regulations, Title 42, Vol. 3. Clinical Labora-tory Improvement Amendment. Revised October 1, 2001.
14. National Committee for Clinical Laboratory Standards (CLSI),Document EP5-A: Evaluation of Precision Performance of Clinical Chemistry Devices: Approved Guideline. 1999. Docu-ment EP6-P: Evaluation of the Linearity of Quantitative Analyt-ical Method: Proposed Guideline. 1986. Document EP7-P:Interference Testing in Clinical Chemistry: Proposed Guideline.1986. Document EP9-A: Method Comparison and Bias Estima-tion Using Patient Samples: Approved Guideline. 1995.
15. Biomarkers Definitions Working Group, Biomarkers and surro-gate endpoints: preferred definitions and conceptual framework.Clin. Pharmacol. Ther. 69:89 Y 95 (2001).
16. J. A. Wagner. Overview of biomarkers and surrogate endpointsin drug development. Dis. Markers 18:41 Y 46 (2002).
17. J. A. Wagner R Bridging preclinical and clinical development:biomarker validation and qualification, in R. Krishna andD. Howard (eds R), Dose Optimization in Drug Development ,Marcel Dekker, New York, in press.
18. J. W. Lee, W. C. Smith, G. D. Nordblom ( R. R. Bowsher.Validation of assays for the bioanalysis of novel biomarkers RIn C. Bloom, R. A. Dean (eds.), Biomarkers in Clinical DrugDevelopment , Marcel Dekker, New York, 2003, pp. 119 Y 149.
19. A. R. Mire-Sluis, Y. C. Barrett, and V. Devanarayan ( et al.Recommendations for the design and of immunoassays used in thedetection of host antibodies against biotechnology products. J. Immunol. Methods 289:1 Y 16 (2004).
20. B. DeSilva, W. Smith, and R. Weiner ( et al. Recommendationsfor the bioanalytical method validation of ligand-binding assaysto support pharmacokinetic assessments of macromolecules.Pharm. Res. 20:1885 Y 1900 (2003).
21. V. P. Shah, K. K. Midha, and S. Dighe ( et al. Analytical methodsvalidation: bioavailability, bioequivalence, and pharmacokineticstudies. Pharm. Res. 9:588 Y 592 (1992).
22. ICH Guidelines R Text on validation of analytical procedures,Q2A; International Conference on Harmonization, Geneva,
Switzerland, 1994.23. D. Borderie, C. Roux, and B. Toussaint ( et al. Variability inurinary excretion of bone resorption markers: limitations of a single determination in clinical practice. Clin. Biochem. 34:571 Y 577 (2001).
24. C. A. Ray, R. R. Bowsher, W. C. Smith ( et al. Development,validation and implementation of a multiplex immunoassay forthe simultaneous determination of five cytokines in humanserum. J. Pharm. Biomed. Anal. 36:1037 Y 1044 (2001).
25. J. O. Westgard, P. L. Barry, and M. R. Hunt ( et al. A multi-ruleShewhart chart for quality control in clinical chemistry. Clin.Chem. 27:493 Y 501 (1981).
26. M. Feinber, B. Boulanger, and W. Dewe ( et al. New advances inmethod validation and measurement uncertainty aimed atimproving the quality of clinical data. Anal. Bioanal. Chem.380:502 Y 514 (2004).
27. J. A. Rogers. Statistical limits for assessment of accuracy andprecision in immunoassay validation: a review. J. Clin. Ligand Assay 27:256 Y 261 (2005).
28. C. A. Ray, C. Dumaual, and M Willey ( et al. Optimization of analytical and pre-analytical variables associated with an ex vivocytokine secretion assay. J. Pharm. Biomed. Anal., In press.
29. R. J. Carroll ( D. Ruppert. Transformation and Weighting inRegression , Chapman & Hall, New York, 1988.
30. J. W. A. Findlay, W. C. Smith, and J. W. Lee ( et al. Validation of immunoassays for bioanalysis: a pharmaceutical industry per-spective. J. Pharm. Biomed. Anal. 21:1249 Y 1273 (2000).
328 Lee et al.