Embed Size (px)
Citation preview

Irion et al., May 3, 2005 Page 1
Ozone validation for AIRS V4
Fredrick W. Irion, Michael R. GunsonJet Propulsion Laboratory
California Institute of Technology
Michael J. Newchurch University of Alabama at Huntsville
Sunmi NaPusan National University
AIRS Science Team MeetingMay 3, 2005
Irion et al., May 3, 2005 Page 2
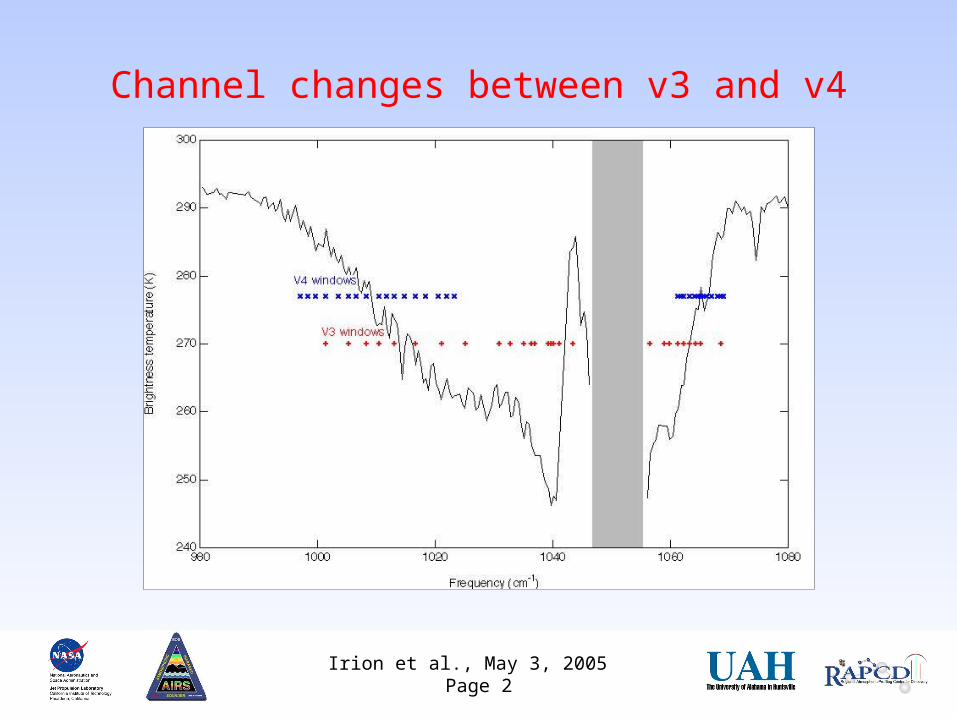
Channel changes between v3 and v4
Irion et al., May 3, 2005 Page 3
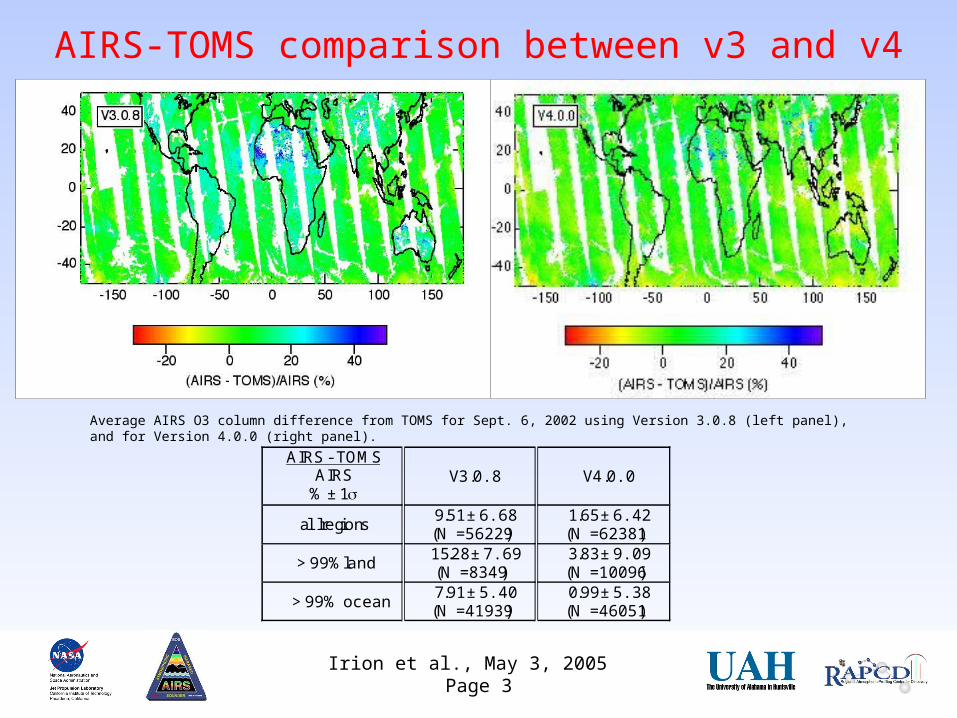
AIRS-TOMS comparison between v3 and v4
AIRS - TOMSAIRS
% ± 1V3.0.8 V4.0.0
all regions9.51 ± 6.68(N = 56229)
1.65 ± 6.42(N = 62381)
> 99% land15.28 ± 7.69(N = 8349)
3.83 ± 9.09(N = 10096)
> 99% ocean7.91 ± 5.40(N = 41939)
0.99 ± 5.38(N = 46051)
Average AIRS O3 column difference from TOMS for Sept. 6, 2002 using Version 3.0.8 (left panel), and for Version 4.0.0 (right panel).
Irion et al., May 3, 2005 Page 4
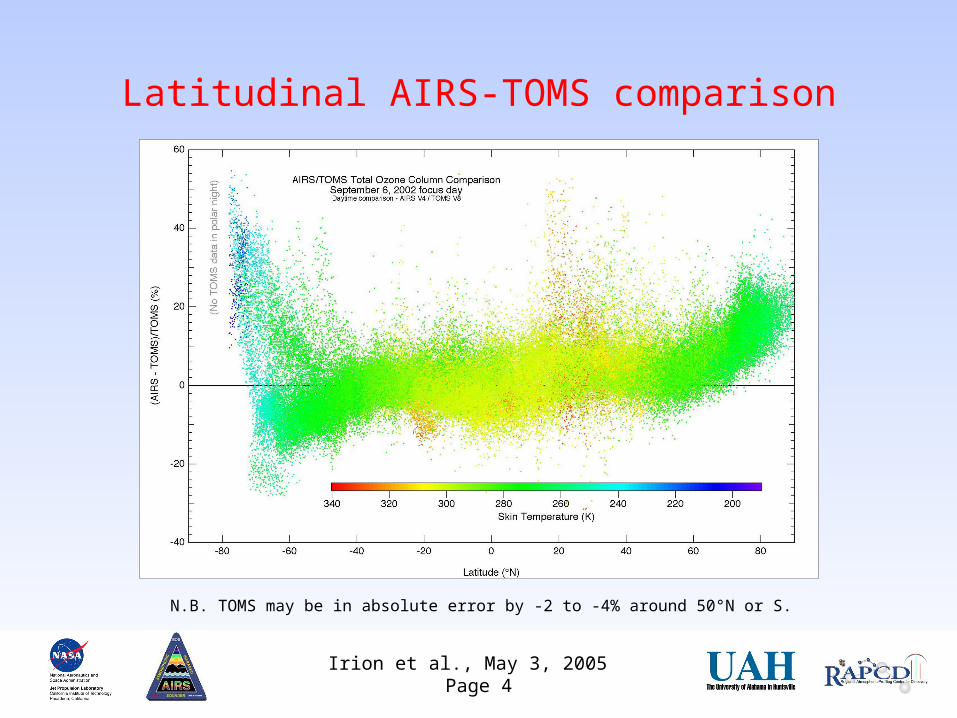
Latitudinal AIRS-TOMS comparison
N.B. TOMS may be in absolute error by -2 to -4% around 50°N or S.
Irion et al., May 3, 2005 Page 5
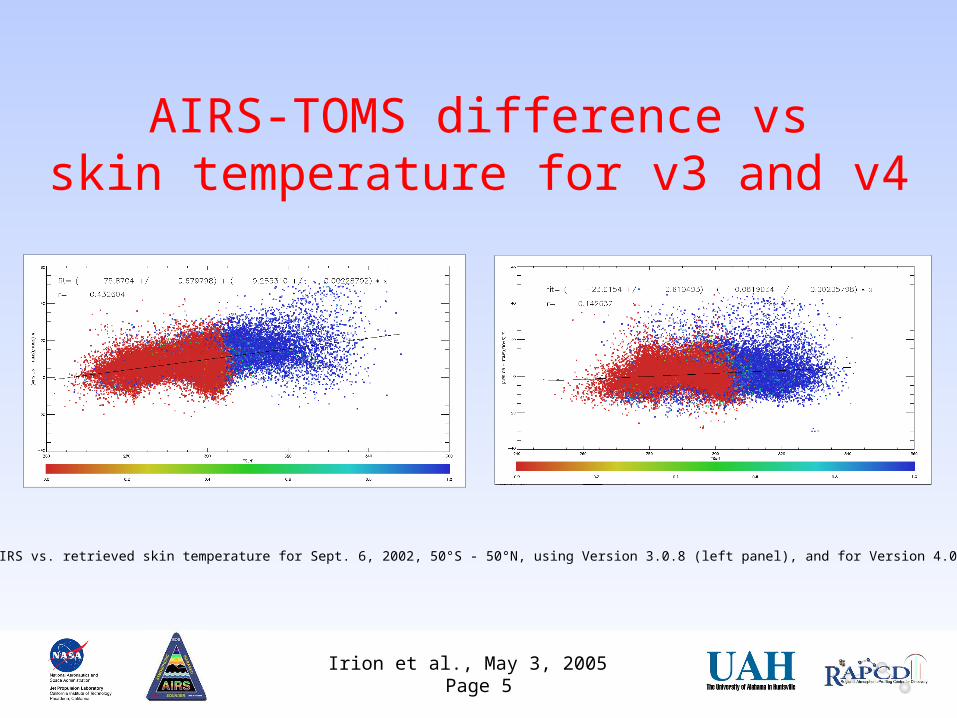
AIRS-TOMS difference vsskin temperature for v3 and v4
(AIRS - TOMS) / AIRS vs. retrieved skin temperature for Sept. 6, 2002, 50°S - 50°N, using Version 3.0.8 (left panel), and for Version 4.0.0 (right panel).
Irion et al., May 3, 2005 Page 6
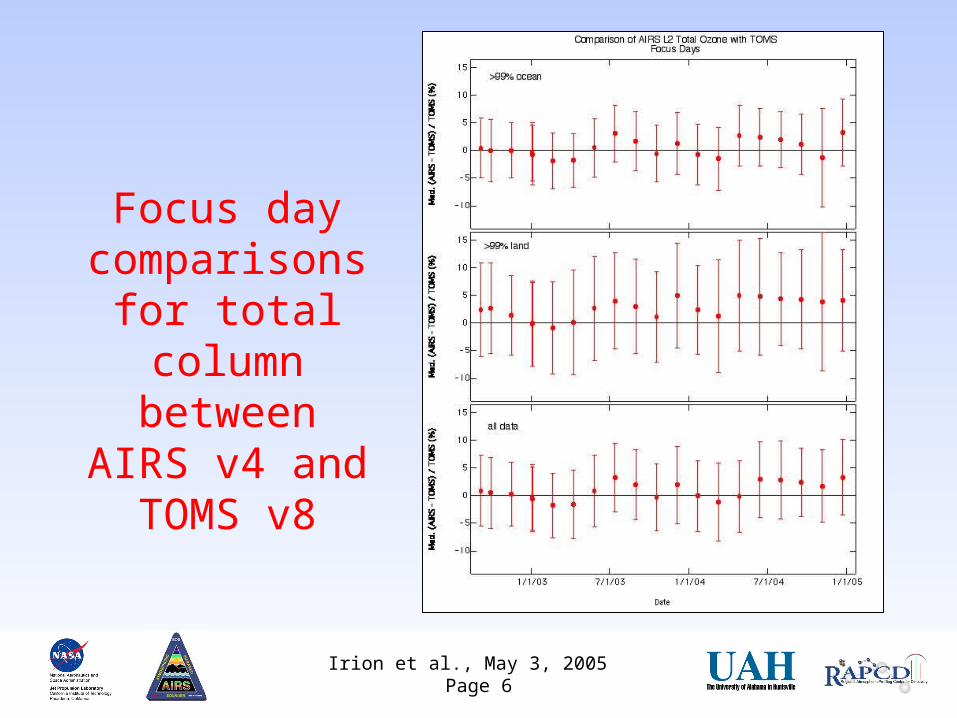
Focus day comparisons for
total column between
AIRS v4 and TOMS v8
Irion et al., May 3, 2005 Page 7
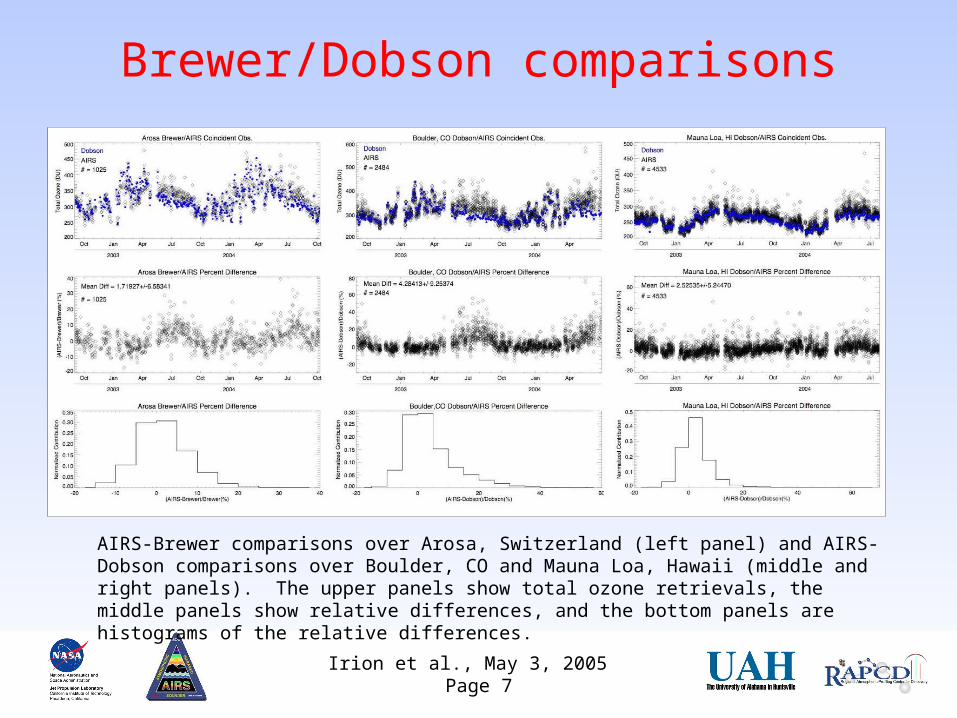
Brewer/Dobson comparisons
AIRS-Brewer comparisons over Arosa, Switzerland (left panel) and AIRS-Dobson comparisons over Boulder, CO and Mauna Loa, Hawaii (middle and right panels). The upper panels show total ozone retrievals, the middle panels show relative differences, and the bottom panels are histograms of the relative differences.
Irion et al., May 3, 2005 Page 8
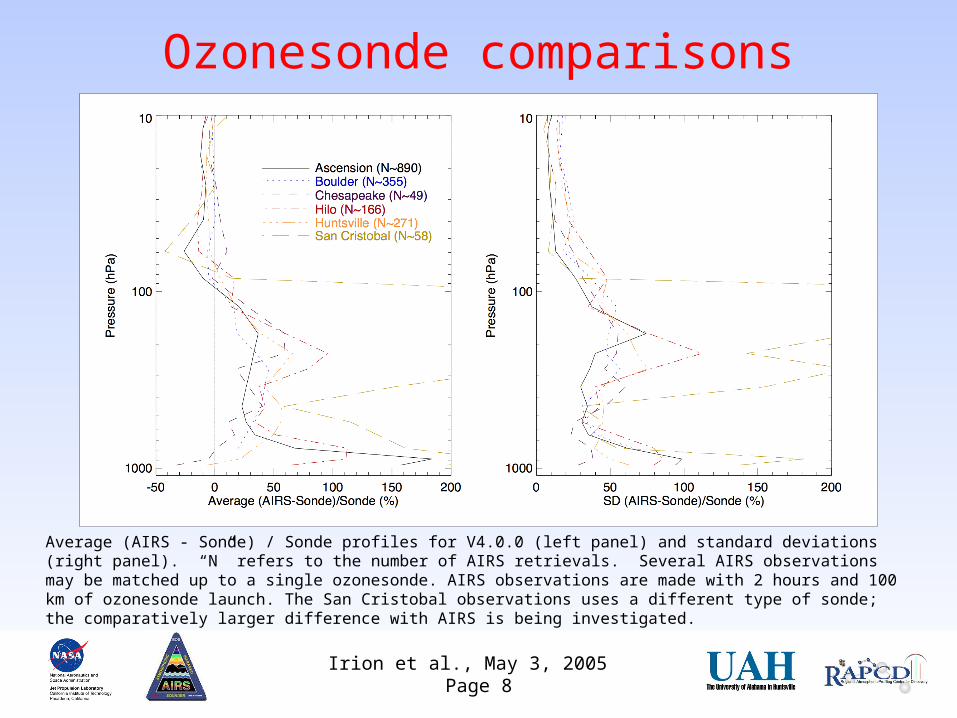
Ozonesonde comparisons
Average (AIRS - Sonde) / Sonde profiles for V4.0.0 (left panel) and standard deviations (right panel). “N” refers to the number of AIRS retrievals. Several AIRS observations may be matched up to a single ozonesonde. AIRS observations are made with 2 hours and 100 km of ozonesonde launch. The San Cristobal observations uses a different type of sonde; the comparatively larger difference with AIRS is being investigated.
Irion et al., May 3, 2005 Page 9
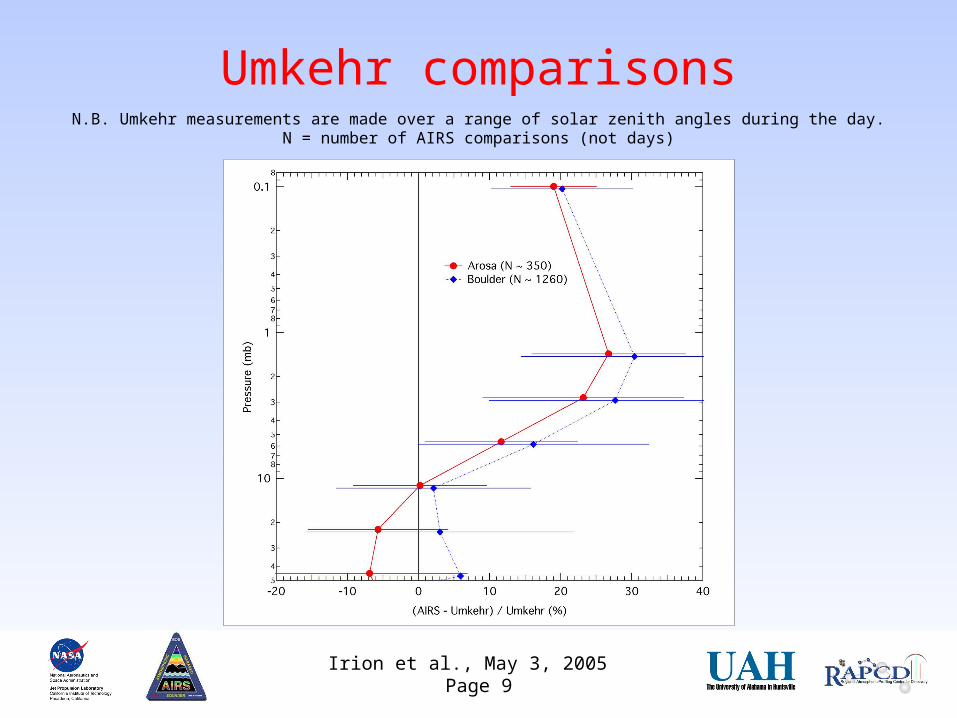
Umkehr comparisonsN.B. Umkehr measurements are made over a range of solar zenith angles during the day.
N = number of AIRS comparisons (not days)
Irion et al., May 3, 2005 Page 10
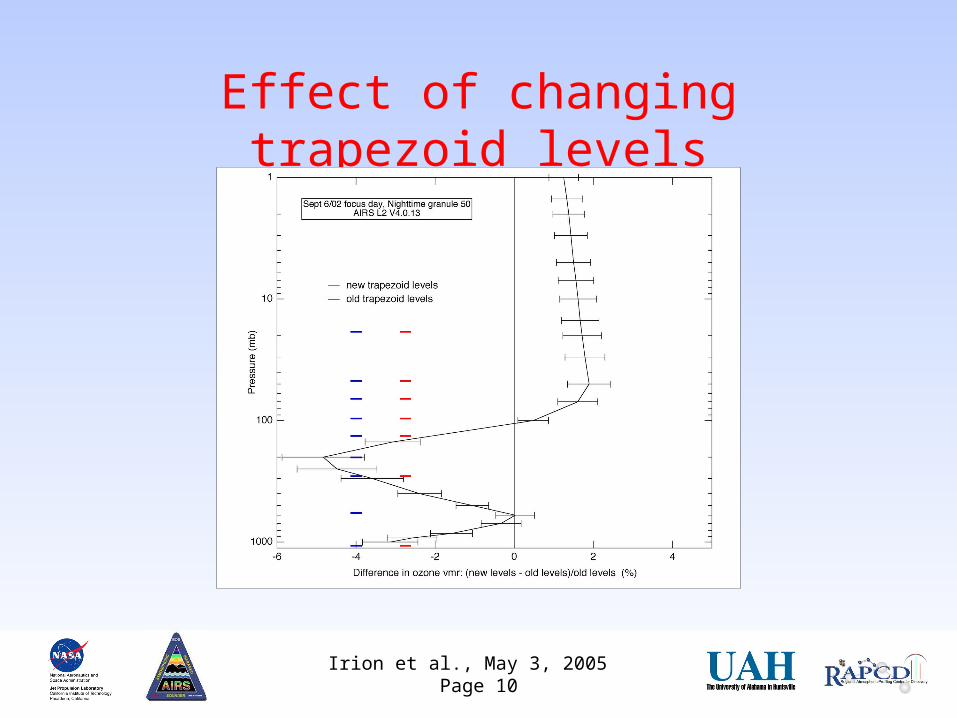
Effect of changing trapezoid levels
Irion et al., May 3, 2005 Page 11
Conclusions• Average (AIRS-TOMS)/TOMS column differences vary
from -2 to +4% with a standard deviation of ~7%.• Dobson comparisons:
– show slightly higher columns over land in summer – sampling issue of tropospheric pollution?
• Ozonesonde comparisons:– AIRS 20-70% high in troposphere,– ~10% low in stratosphere.
• Umkehr comparisons:– positive bias in upper stratosphere/lower mesosphere
• Changes in trapezoid levels only make small changes in retrievals.