Embed Size (px)
Citation preview
IPM Blight 2.0 : using pathogen population information
to improve late blight control
D. Andrivon project coordinator
on behalf of all project partners

Phytophthora infestans on potato
• A destructive… – Strong defoliation – Fast epidemics – Over 900 M€ annual cost in
Europe • … and re-emerging pathogen
Oospores
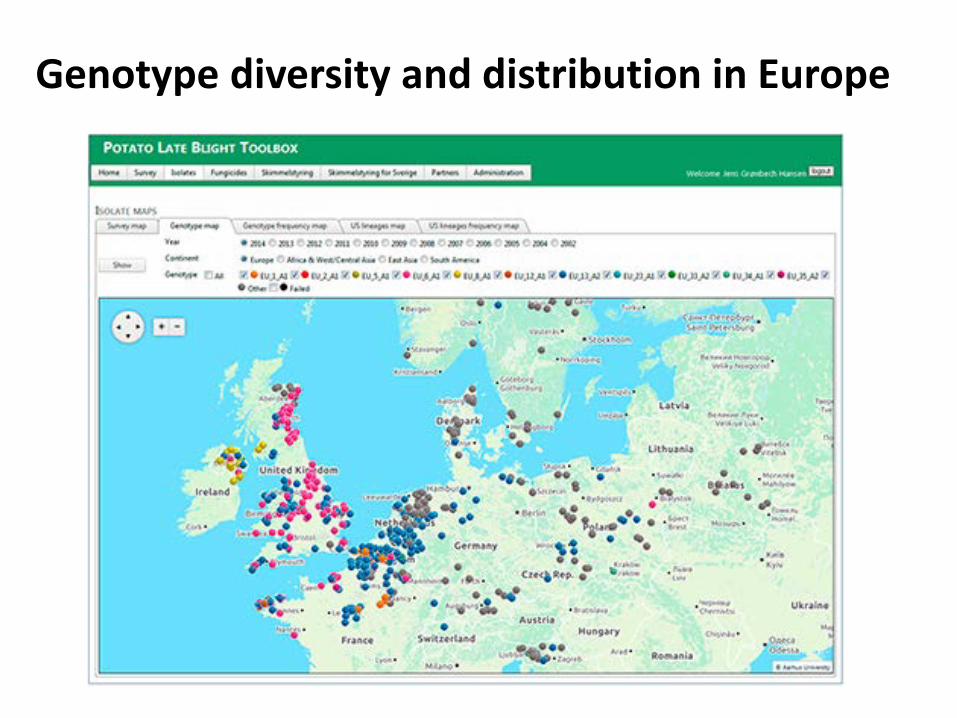
Genotype diversity and distribution in Europe
2013-2014

Rapid changes in clones
0%
10%
20%
30%
40%
50%
60%
70%
80%
90%
100%
2001-02 2004 2005 2006 2007 2008 2009 2010 2011-12 2013 2014
n = 109 255 268 239 195 89 100 36 53 409 376
EU_1_A1
EU_2_A1
EU_5_A1
EU_6_A1
EU_8_A1
EU_3_A2
EU_13_A2
EU_35_A2
autres MLG
MLG_6 / A1
MLG_13/A1
MLG_8 / A2

Clone diversity: between and within
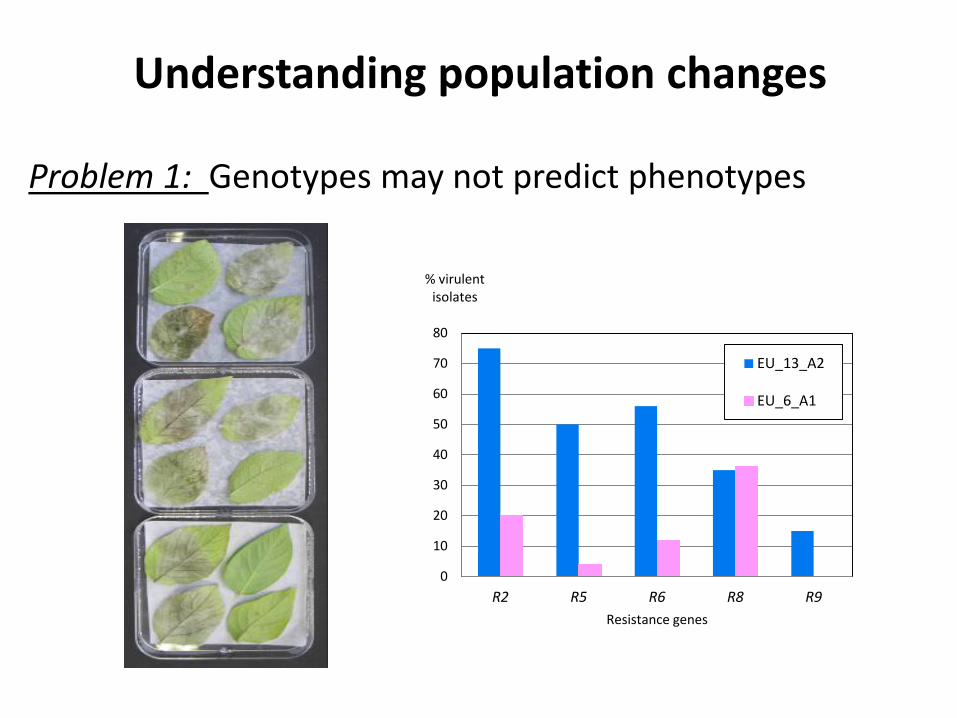
Problem 1: Genotypes may not predict phenotypes
0
10
20
30
40
50
60
70
80
R2 R5 R6 R8 R9
% virulent isolates
Resistance genes
EU_13_A2
EU_6_A1
Understanding population changes

2
3
4
5
6
7
10°C 14°C 18°C 24°C
Lesion growth rate cm2/ / jour
6_A1n = 913_A2n = 8
A
***
***
0
10
20
30
40
50
10°C 14°C 18°C 24°C
Spores x104
/ lesion 6_A1 n= 913_A2n = 8
B
***
***
***
**
3,5
4,0
4,5
5,0
5,5
10°C 14°C 18°C 24°C
Sporanges mm2
6_A1n = 9
13_A2n = 8
C
**
*
4
4,2
4,4
4,6
4,8
13_A2; n = 75 6_A1; n = 65
Sporanges mm2
15°C (8h) / 18°C (16h) D
Problem 2: All clones do not respond equally to climate
Understanding population changes
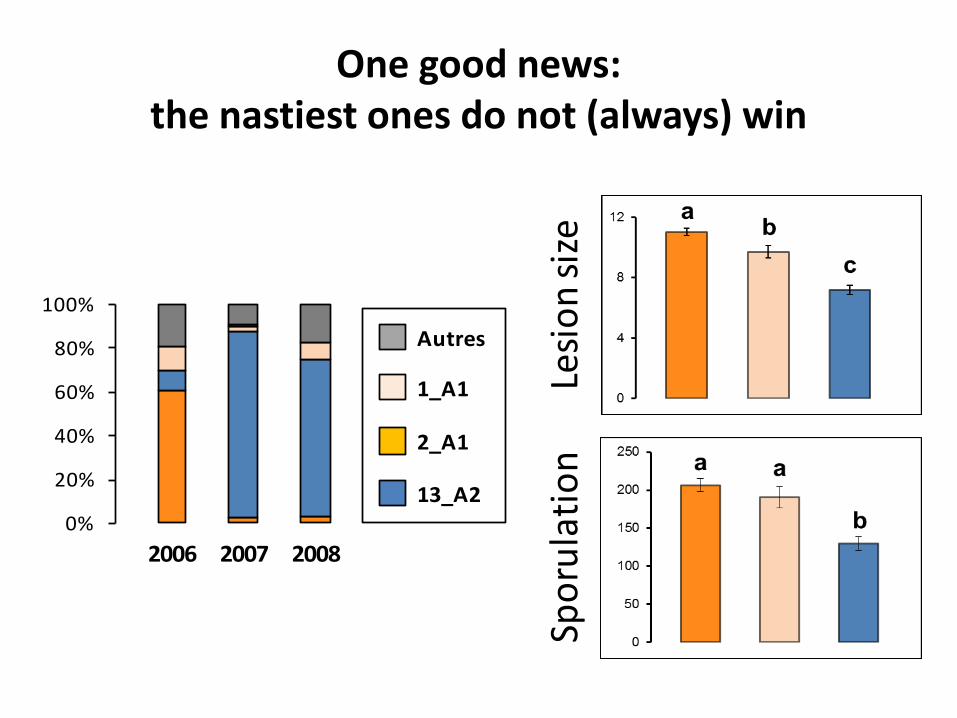
Autres
1_A1
13_A2
2_A1
0%
20%
40%
60%
80%
100%
2006 2007 2008Le
sion
size
Spor
ulat
ion
One good news: the nastiest ones do not (always) win
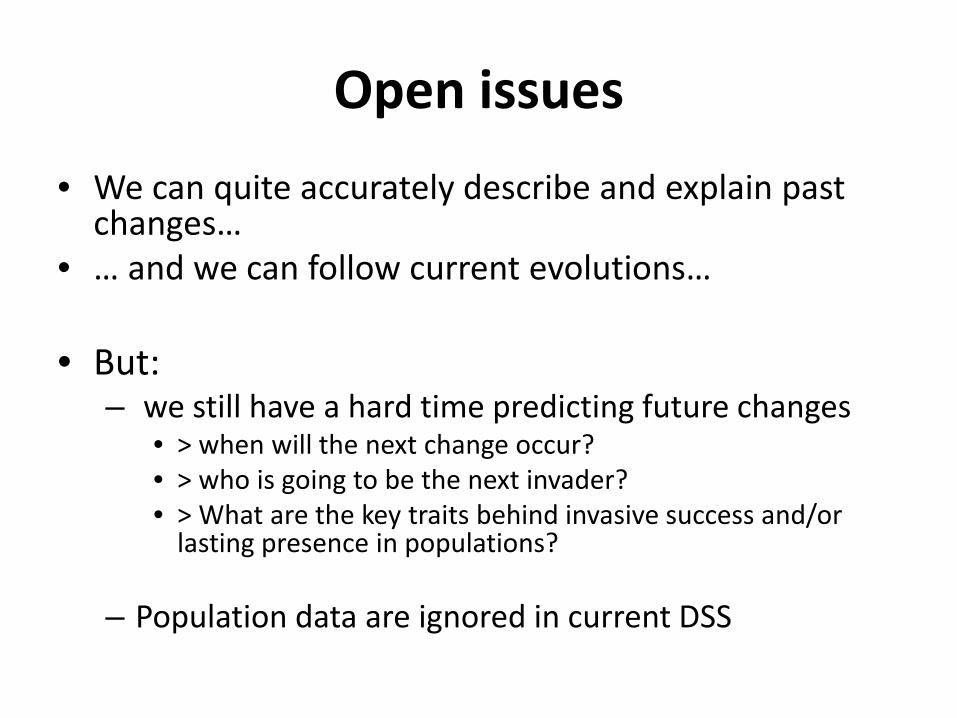
Open issues • We can quite accurately describe and explain past
changes… • … and we can follow current evolutions…
• But:
– we still have a hard time predicting future changes • > when will the next change occur? • > who is going to be the next invader? • > What are the key traits behind invasive success and/or
lasting presence in populations?
– Population data are ignored in current DSS
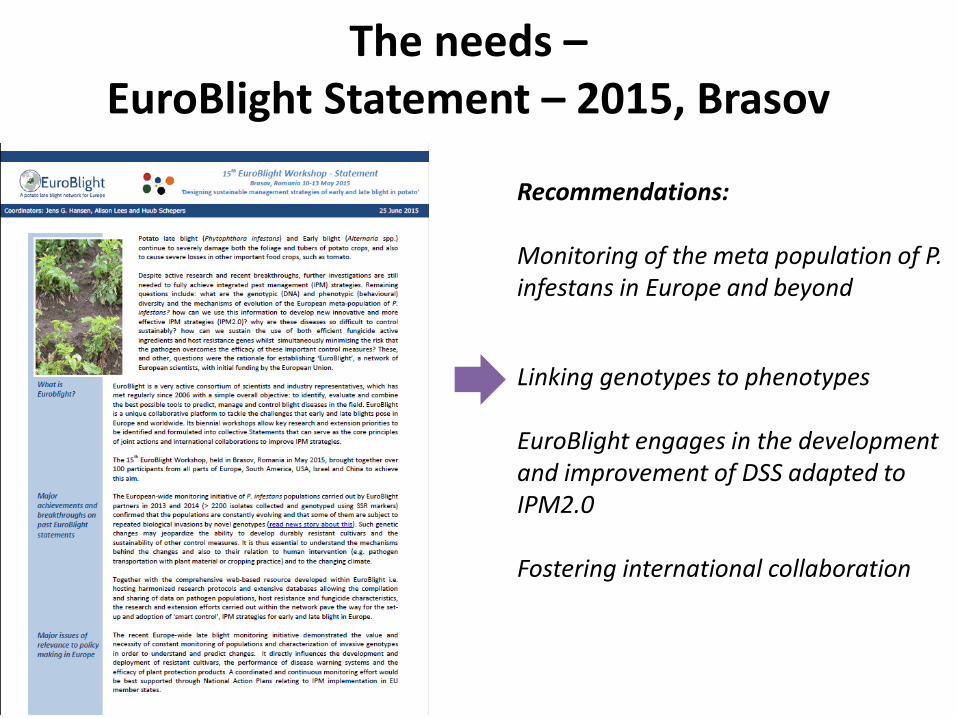
The needs – EuroBlight Statement – 2015, Brasov
Recommendations: Monitoring of the meta population of P. infestans in Europe and beyond Linking genotypes to phenotypes EuroBlight engages in the development and improvement of DSS adapted to IPM2.0 Fostering international collaboration
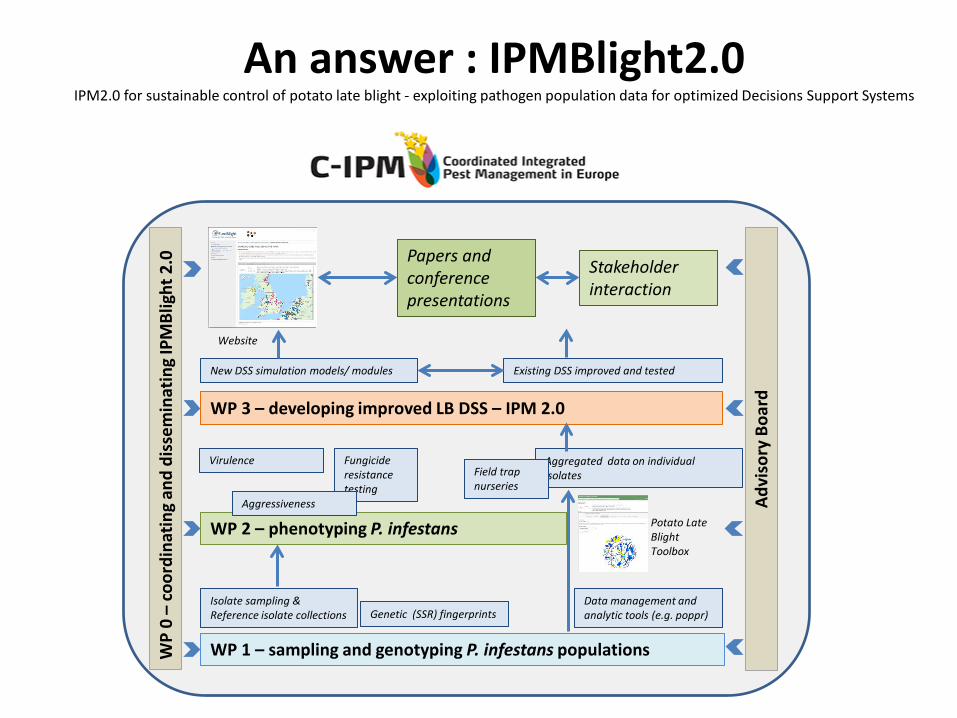
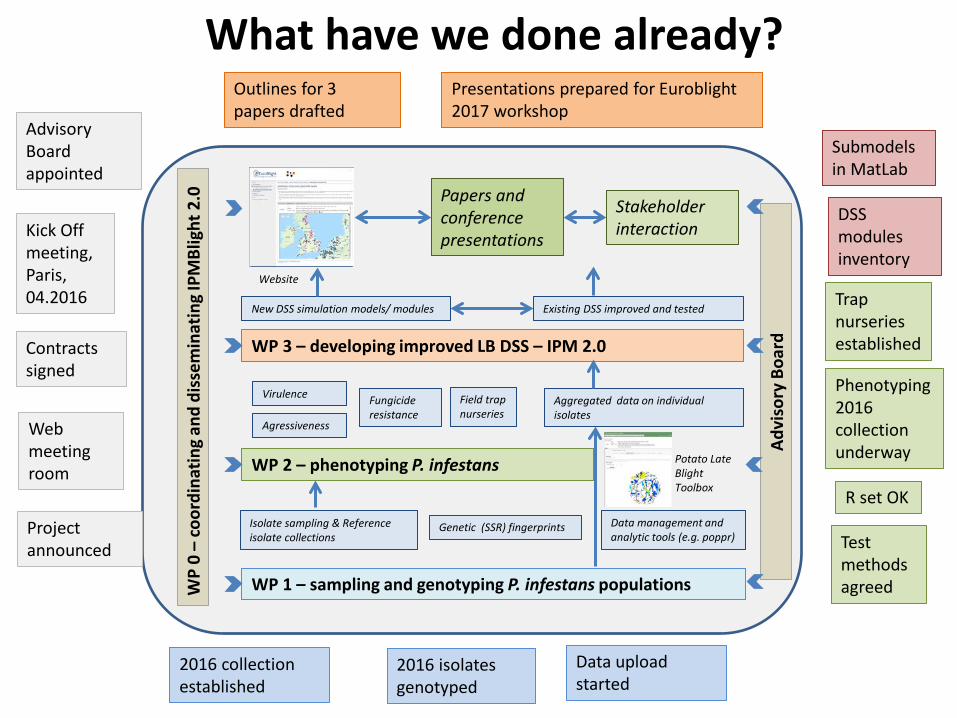
WP 1 – sampling and genotyping P. infestans populations
WP 2 – phenotyping P. infestans
WP 3 – developing improved LB DSS – IPM 2.0
WP
0 –
coor
dina
ting
and
diss
emin
atin
g IP
MBl
ight
2.0
Isolate sampling & Reference isolate collections
Aggregated data on individual isolates
Virulence
Data management and analytic tools (e.g. poppr)
New DSS simulation models/ modules
Papers and conference presentations
Website
Potato Late Blight Toolbox
Genetic (SSR) fingerprints
Advi
sory
Boa
rd
Existing DSS improved and tested
Fungicide resistance testing
Stakeholder interaction
An answer : IPMBlight2.0 IPM2.0 for sustainable control of potato late blight - exploiting pathogen population data for optimized Decisions Support Systems
Field trap nurseries
Aggressiveness
IPMBlight 2.0 – partners
NAES

IPMBlight 2.0 – deliverables and communication
• New knowledge • Population structures
Population phenotypes and variability Phenotype x genotype connections
• Methods and protocols
• Operational tools • New/improved open DSS modules • Network of reference labs for efficient
epidemiovigilance (connected to Euroblight)
WP 1 – sampling and genotyping P. infestans populations
WP 2 – phenotyping P. infestans
WP 3 – developing improved LB DSS – IPM 2.0
WP
0 –
coor
dina
ting
and
diss
emin
atin
g IP
MBl
ight
2.0
Isolate sampling & Reference isolate collections
Aggregated data on individual isolates
Agressiveness
Data management and analytic tools (e.g. poppr)
New DSS simulation models/ modules
Papers and conference presentations
Website
Potato Late Blight Toolbox
Genetic (SSR) fingerprints
Advi
sory
Boa
rd
Existing DSS improved and tested
Fungicide resistance
Stakeholder interaction
What have we done already?
Kick Off meeting, Paris, 04.2016
Contracts signed
Web meeting room
Project announced
2016 isolates genotyped
2016 collection established
R set OK
Test methods agreed
DSS modules inventory
Data upload started
Outlines for 3 papers drafted
Presentations prepared for Euroblight 2017 workshop
Advisory Board appointed
Trap nurseries established
Phenotyping 2016 collection underway
Submodels in MatLab
Virulence Field trap nurseries
First achievements
• Population structures > emergence of 36_A2, 37_A2 and 38_A1
• Talk D Cooke • Poster R Corbière et al
• Pathogen phenotypes
• Fungicide sensitivity • Talk Britt Puidet et al
• Agressiveness
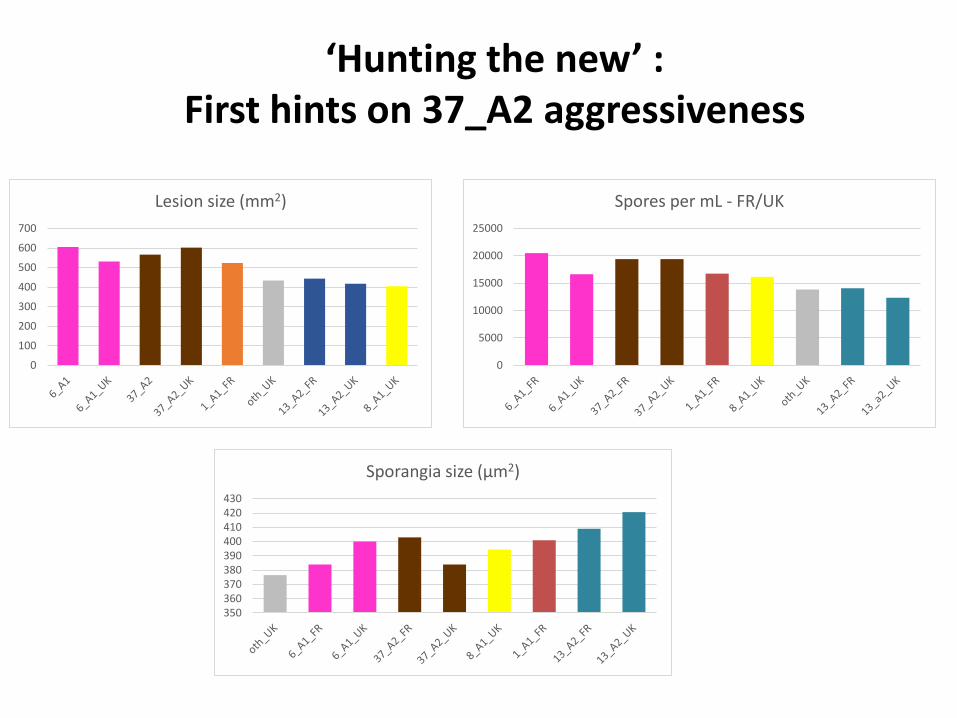
‘Hunting the new’ : First hints on 37_A2 aggressiveness
0
100
200
300
400
500
600
700
Lesion size (mm2)
0
5000
10000
15000
20000
25000
Spores per mL - FR/UK
350360370380390400410420430
Sporangia size (µm2)
Early conclusions...
• ‘Hunting the new’ ... • Infrastructures • Fast reaction value of an EU wide ( and global) epidemiovigilance scheme
• ... knowing the old
• Large subclonal variation • Genotypes alone do not predict everything right
• Network strength
• Population surveys • Sampling • Databases
• Complementary expertises • Protocols
... and questions still pending
• From population knowledge to improved control?
• Proof of concept still to be made • Integration in DSS underway
• Faster phenotyping?
• Is important • How to do it best?
• How much will global change jeopardize LB control? • Better characterisation of climate response needed • Will cultivars select as much/more than did fungicides • One world, one health
• Time to get LB research global?