Embed Size (px)
Citation preview

ORIGINAL PAPER
Contrasted effects of temperature during defoliation vs. refoliationperiods on the infection of rubber powdery mildew (Oidium heveae)in Xishuangbanna, China
De-Li Zhai1 & Jing Wang2& Philippe Thaler1,3,4 & Yiqi Luo5
& Jianchu Xu1,6
Received: 12 February 2020 /Revised: 1 July 2020 /Accepted: 7 July 2020# ISB 2020
AbstractRubber powdery mildew caused by the foliar fungi Oidium heveae is one of the main diseases affecting rubberplantations (Hevea brasiliensis) worldwide. It is particularly serious in sub-optimal growing areas, such asXishuangbanna in SW China. To prevent and control this disease, fungicides causing serious environmental prob-lems are widely used. Strong correlations between the infection level and the temperature variables were reportedpreviously, but they were related to monthly data that did not allow unraveling the patterns during the entiresensitive period. We correlated the infection level of powdery mildew of rubber trees recorded over 2003–2011with antecedent 365 days daily temperature variables using partial least squares (PLS) regression. Our PLS regres-sion results showed that the infection level of powdery mildew responded differently to the temperature variables ofthe defoliation and refoliation periods. Further analysis with Kriging interpolation showed that the infection levelincreased by 20% and 11%, respectively, per 1 °C rise of the daily maximum and mean temperature in thedefoliation season, while it decreased by 8% and 10%, respectively, per 1 °C rise of the daily maximum andtemperature difference in the refoliation season. This pattern was likely linked to the effects of temperature on leafphenology. It seems highly possible that the infection level of powdery mildew increases, as increasing trends ofmaximum temperature and mean temperature during the defoliation continue.
Keywords Rubber plantation .Hevea brasiliensis . Partial least squares (PLS) regression . Phenology . Xishuangbanna
Electronic supplementary material The online version of this article(https://doi.org/10.1007/s00484-020-01969-y) contains supplementarymaterial, which is available to authorized users.
* De-Li [email protected]
* Jianchu [email protected]
Jing [email protected]
Philippe [email protected]
Yiqi [email protected]
1 Key Laboratory for Economic Plants and Biotechnology, KunmingInstitute of Botany, Chinese Academy of Sciences, 132 Lanhei Road,Kunming 650201, Yunnan, China
2 Tiantong National Forest Ecosystem Observation and ResearchStation & Research Center for Global Change and EcologicalForecasting, School of Ecological and Environmental Sciences, EastChina Normal University, Shanghai 200062, China
3 CIRAD, UMR Eco&Sols, F-34398 Montpellier, France
4 Eco&Sols, CIRAD, INRAE, Institut Agro, IRD, University ofMontpellier, Montpellier, France
5 Center for Ecosystem Science and Society, Department of BiologicalSciences, Northern Arizona University, Arizona,Flagstaff, AZ 86011, USA
6 East and Central Asia Office, World Agroforestry Centre (ICRAF),132 Lanhei Road, Kunming 650201, Yunnan, China
International Journal of Biometeorologyhttps://doi.org/10.1007/s00484-020-01969-y

Introduction
Powdery mildew disease, caused by Oidium heveae, is a ma-jor disease affecting rubber trees in almost all rubber-growingcountries, especially in Southeast Asia, which accounts for93% of the natural rubber production in the global market(Liyanage et al. 2018; Priyadarshan 2011). Most rubber plan-tations are monospecific and plots are monoclonal, makingthem particularly sensitive to leaf diseases such as powderymildew (Liyanage et al. 2016). The powdery mildew diseasemainly infects the immature leaves, flowers, and other imma-ture tissues of rubber trees during refoliation season after an-nual wintering. It is particularly serious in the sub-optimalcultivating habitats, like Xishuangbanna in SW China, wherethe rubber trees have distinct phenology for annual leaf shed-ding (wintering) and leaf flushing (refoliation) (Liyanage et al.2018; Priyadarshan 2011; Zhai et al. 2019).
The epidemic duration of Oidium heveae in natural condi-tions is only 40 days, and climatic variables directly affect thedevelopment of the pathogen (Paris and Cohen 2002; Shaoand Hu 1984; Shao et al. 1996). Copper sulfate powder, one ofthe cheapest and most effective pesticides, is widely used toprevent and control this disease; however, it causes decreasein soil pH, changes the soil bacterial composition and diversi-ty, and affects biogeochemical cycling (Lan et al. 2018; Liet al. 2016). The climatic factors have been reported seriouslyinfluencing the infection incidence and being critical for fore-casting and estimating the infection of this disease (SCATCS1959; SCATCS 1983; Shao and Hu 1984; Yu and Wang1988; Yu et al. 1980; YITC 1981; Zhou 1982). Therefore, toestimate the powdery mildew infection incidence and to guidedisease control, people have paid great attention to the impactof climatic variables, especially in critical periods (Paris andCohen 2002; SCATCS, 1983 1985; Shao and Hu 1984; Shaoet al. 1996). The Chinese government supported strongly in-vestigations into the powdery mildew disease in the 1960s–1980s, during which most of the rubber trees were managedby state farms (Xu et al. 2009). During that time, studies havebeen conducted to identify the determining climatic factorsthat affect the powdery mildew infection (SCATCS 1959;SCATCS 1983; Shao and Hu 1984; Yu and Wang 1988; Yuet al. 1980; YITC 1981; Zhou 1982). Most of these studieshave identified temperature as the main factor and mainlyfocused on the response of the infection level to monthlytemperature data during the refoliation phase. The powderymildew infection appears to respond differently to temperaturein the defoliation and refoliation seasons of rubber trees. Forexample, a high mean temperature in December–Januarycould increase the powdery mildew infection level (Yu et al.1980; YITC 1981). Conversely, high mean temperature inspring, during the refoliation season, decreases the infectionlevel (PPRI, SCATCS 1983; Shao and Hu 1984; Shao et al.1996; Yu et al. 1980; YITC 1981). However, the monthly
climatic data used in the previous studies might overlook theeffects of climatic variables on the dynamics of powdery mil-dew infection in critical periods. Hence, they are not preciseenough to analyze the effects of ongoing and future impacts ofclimate changes on the disease in rubber plantations.Moreover, they considered only the infection period, whereasthe full annual climatic conditions, especially winter climaticconditions, may have an influence (Luedeling and Gassner2012; Yu et al. 1980).
Therefore, long-term and detailed observation data is crit-ical to understand and predict the impacts of climatic condi-tion on the disease. In this study, we collected 9-year longobservation data from 2003 to 2011 to investigate the impactsof climatic variables at a daily resolution on the powderymildew infection. In 2011, state farms implemented reformsfor rubber plantations involving contracting work out to cer-tain households; accordingly, monitoring, measurements, andother related research were terminated. We used partial leastsquares regression to better identify the critical periodsinfluencing the infection level. Our site-based disease obser-vation data and the daily meteorological data provided aunique opportunity for exploring the responses of this diseaseto climate change. Our findings will provide a new under-standing for how rubber powdery mildew may respond toprojected long-term climate change.
Materials and methods
Study area
Xishuangbanna, one of the two main rubber-producing re-gions in China, is located at the northern edge of the Asiantropical zone (Zhu et al. 2006). It is a sub-optimal region forrubber cultivation (Yu et al. 2014) (Fig. 1), for its colder anddrier climate compared with the humid tropics, the optimalenvironment of rubber trees (Priyadarshan 2011; Yu et al.2014). The mean annual temperature is 22.6 °C, and annualprecipitation is 1130 mm (Zhai et al. 2019) (Fig. 2).Xishuangbanna has two seasons (Cao et al. 2006; Zhang andCao 1995): dry season (from November to April) and rainyseason (from May to October). The dry season is further di-vided into a cool-dry season (from November to February)and a hot-dry season (from March to April) (Cao et al.2006). The cool-dry season is distinct, with a 17 °C meantemperature and dense fog during the night and in the morningand little rain. This is when the rubber trees shed leaves (win-tering, from early December to the middle of January) andrefoliated (from the end of January to the end of March)(Zhou et al. 2008). The hot-dry season (end of March toMay) is distinct with dry and hot weather in the afternoonand dense fog in the morning only but still little rain (Caoet al. 2006). During this season, the leaves continue to develop
Int J Biometeorol

(Liyanage et al. 2019). The rainy season, from May toOctober, accounts for 87% of the annual rainfall in this region.The rubber trees are tapped in the rainy season until the cool-dry season.
We studied the powdery mildew disease of rubber trees in astate-owned farm (the sixth branch of Jinghong Farm) locatednear Jinghong City, Xishuangbanna Prefecture, YunnanProvince (21° 48 N, 100° 46 E). There are 1813 ha of rubberplantations in this farm. The major clones of rubber trees areRRIM600, GT1, PR107, and YUNYAN1. GT1 and PR107
are less resistant to powdery mildew than RRIM600 andYUNYAN1 (Zhang et al. 2009).
Rubber powdery mildew data and climate data
Rubber powdery mildew monitoring and measurements wereconducted from the end of January to the end of March with a3-day interval from 2003 to 2011. The observation sites werechosen to represent the whole area of the plantation with ma-ture (tapped) trees. Following the guidelines and standards of
Fig. 1 The location of study site
Fig. 2 Monthly meanprecipitation (a) and temperature(b) in 2003–2011. Theprecipitation has been log10transformed. The tall and narrowbars indicated intense storms thatoccurs infrequently, while theborder bars indicated less intenserainfall events occurring morefrequently
Int J Biometeorol
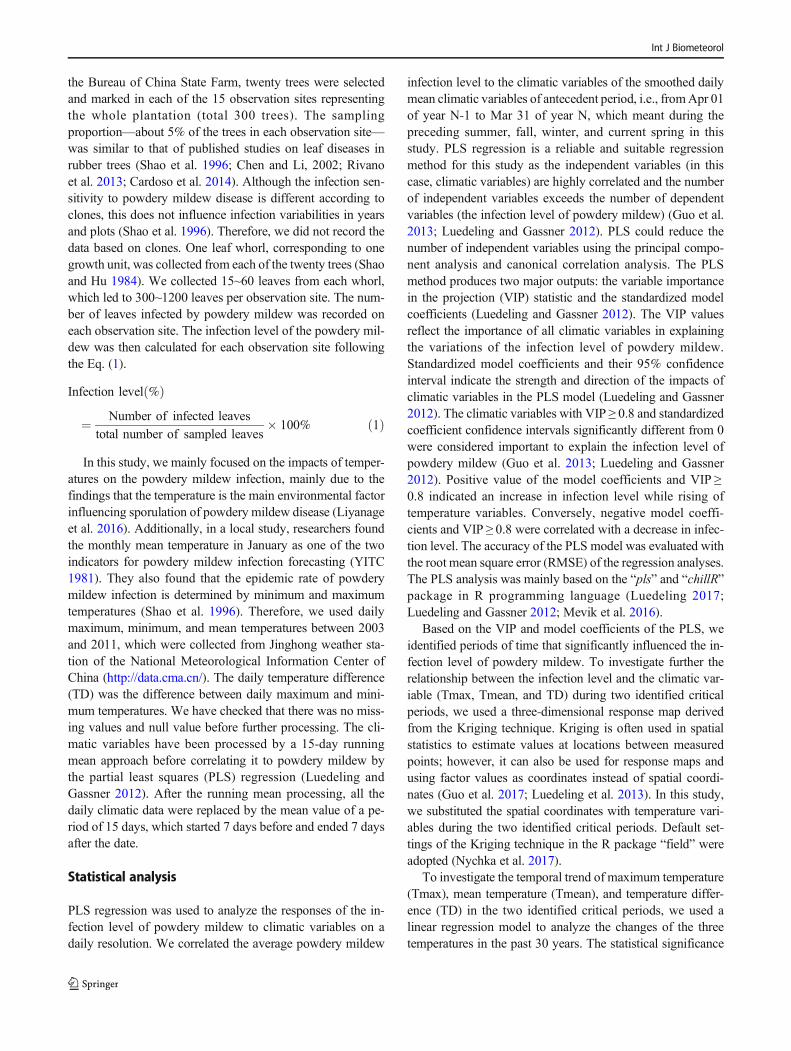
the Bureau of China State Farm, twenty trees were selectedand marked in each of the 15 observation sites representingthe whole plantation (total 300 trees). The samplingproportion—about 5% of the trees in each observation site—was similar to that of published studies on leaf diseases inrubber trees (Shao et al. 1996; Chen and Li, 2002; Rivanoet al. 2013; Cardoso et al. 2014). Although the infection sen-sitivity to powdery mildew disease is different according toclones, this does not influence infection variabilities in yearsand plots (Shao et al. 1996). Therefore, we did not record thedata based on clones. One leaf whorl, corresponding to onegrowth unit, was collected from each of the twenty trees (Shaoand Hu 1984). We collected 15~60 leaves from each whorl,which led to 300~1200 leaves per observation site. The num-ber of leaves infected by powdery mildew was recorded oneach observation site. The infection level of the powdery mil-dew was then calculated for each observation site followingthe Eq. (1).
Infection level %ð Þ
¼ Number of infected leaves
total number of sampled leaves� 100% ð1Þ
In this study, we mainly focused on the impacts of temper-atures on the powdery mildew infection, mainly due to thefindings that the temperature is the main environmental factorinfluencing sporulation of powdery mildew disease (Liyanageet al. 2016). Additionally, in a local study, researchers foundthe monthly mean temperature in January as one of the twoindicators for powdery mildew infection forecasting (YITC1981). They also found that the epidemic rate of powderymildew infection is determined by minimum and maximumtemperatures (Shao et al. 1996). Therefore, we used dailymaximum, minimum, and mean temperatures between 2003and 2011, which were collected from Jinghong weather sta-tion of the National Meteorological Information Center ofChina (http://data.cma.cn/). The daily temperature difference(TD) was the difference between daily maximum and mini-mum temperatures. We have checked that there was no miss-ing values and null value before further processing. The cli-matic variables have been processed by a 15-day runningmean approach before correlating it to powdery mildew bythe partial least squares (PLS) regression (Luedeling andGassner 2012). After the running mean processing, all thedaily climatic data were replaced by the mean value of a pe-riod of 15 days, which started 7 days before and ended 7 daysafter the date.
Statistical analysis
PLS regression was used to analyze the responses of the in-fection level of powdery mildew to climatic variables on adaily resolution. We correlated the average powdery mildew
infection level to the climatic variables of the smoothed dailymean climatic variables of antecedent period, i.e., fromApr 01of year N-1 to Mar 31 of year N, which meant during thepreceding summer, fall, winter, and current spring in thisstudy. PLS regression is a reliable and suitable regressionmethod for this study as the independent variables (in thiscase, climatic variables) are highly correlated and the numberof independent variables exceeds the number of dependentvariables (the infection level of powdery mildew) (Guo et al.2013; Luedeling and Gassner 2012). PLS could reduce thenumber of independent variables using the principal compo-nent analysis and canonical correlation analysis. The PLSmethod produces two major outputs: the variable importancein the projection (VIP) statistic and the standardized modelcoefficients (Luedeling and Gassner 2012). The VIP valuesreflect the importance of all climatic variables in explainingthe variations of the infection level of powdery mildew.Standardized model coefficients and their 95% confidenceinterval indicate the strength and direction of the impacts ofclimatic variables in the PLS model (Luedeling and Gassner2012). The climatic variables with VIP ≥ 0.8 and standardizedcoefficient confidence intervals significantly different from 0were considered important to explain the infection level ofpowdery mildew (Guo et al. 2013; Luedeling and Gassner2012). Positive value of the model coefficients and VIP ≥0.8 indicated an increase in infection level while rising oftemperature variables. Conversely, negative model coeffi-cients and VIP ≥ 0.8 were correlated with a decrease in infec-tion level. The accuracy of the PLS model was evaluated withthe root mean square error (RMSE) of the regression analyses.The PLS analysis was mainly based on the “pls” and “chillR”package in R programming language (Luedeling 2017;Luedeling and Gassner 2012; Mevik et al. 2016).
Based on the VIP and model coefficients of the PLS, weidentified periods of time that significantly influenced the in-fection level of powdery mildew. To investigate further therelationship between the infection level and the climatic var-iable (Tmax, Tmean, and TD) during two identified criticalperiods, we used a three-dimensional response map derivedfrom the Kriging technique. Kriging is often used in spatialstatistics to estimate values at locations between measuredpoints; however, it can also be used for response maps andusing factor values as coordinates instead of spatial coordi-nates (Guo et al. 2017; Luedeling et al. 2013). In this study,we substituted the spatial coordinates with temperature vari-ables during the two identified critical periods. Default set-tings of the Kriging technique in the R package “field” wereadopted (Nychka et al. 2017).
To investigate the temporal trend of maximum temperature(Tmax), mean temperature (Tmean), and temperature differ-ence (TD) in the two identified critical periods, we used alinear regression model to analyze the changes of the threetemperatures in the past 30 years. The statistical significance
Int J Biometeorol
was tested using the t test. All analyses were implemented inthe R programming language (R Core Team 2017).
Results
Responses of rubber powdery mildew to thetemperatures
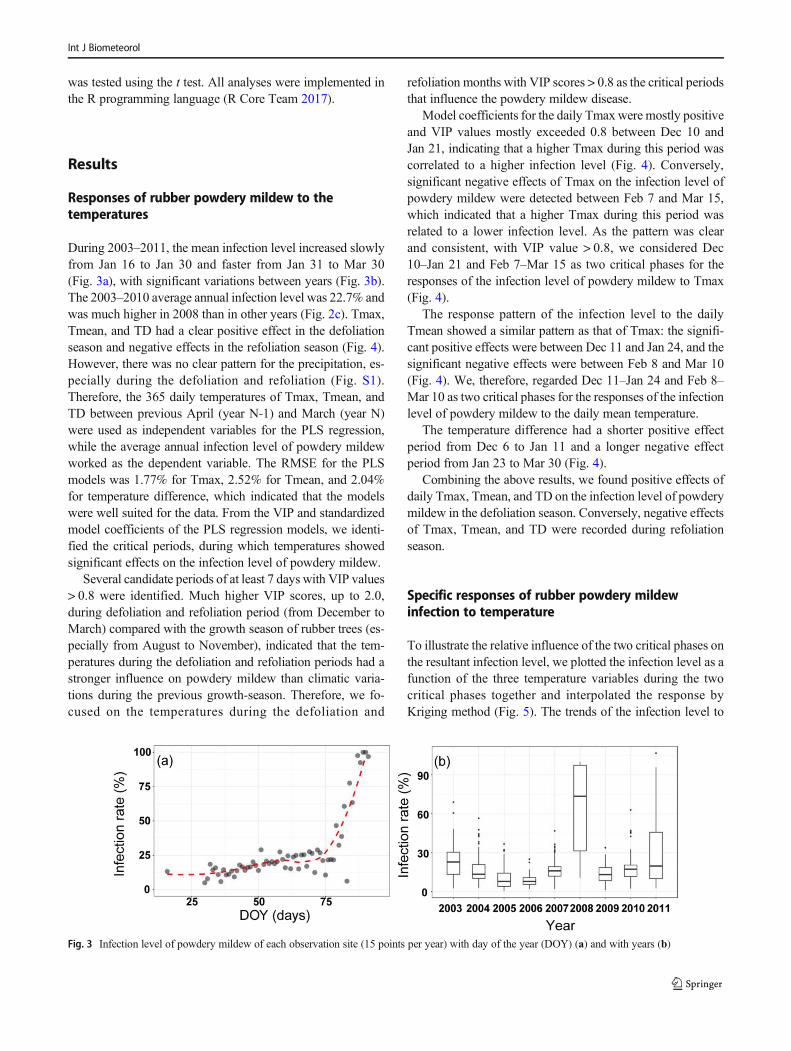
During 2003–2011, the mean infection level increased slowlyfrom Jan 16 to Jan 30 and faster from Jan 31 to Mar 30(Fig. 3a), with significant variations between years (Fig. 3b).The 2003–2010 average annual infection level was 22.7% andwas much higher in 2008 than in other years (Fig. 2c). Tmax,Tmean, and TD had a clear positive effect in the defoliationseason and negative effects in the refoliation season (Fig. 4).However, there was no clear pattern for the precipitation, es-pecially during the defoliation and refoliation (Fig. S1).Therefore, the 365 daily temperatures of Tmax, Tmean, andTD between previous April (year N-1) and March (year N)were used as independent variables for the PLS regression,while the average annual infection level of powdery mildewworked as the dependent variable. The RMSE for the PLSmodels was 1.77% for Tmax, 2.52% for Tmean, and 2.04%for temperature difference, which indicated that the modelswere well suited for the data. From the VIP and standardizedmodel coefficients of the PLS regression models, we identi-fied the critical periods, during which temperatures showedsignificant effects on the infection level of powdery mildew.
Several candidate periods of at least 7 days with VIP values> 0.8 were identified. Much higher VIP scores, up to 2.0,during defoliation and refoliation period (from December toMarch) compared with the growth season of rubber trees (es-pecially from August to November), indicated that the tem-peratures during the defoliation and refoliation periods had astronger influence on powdery mildew than climatic varia-tions during the previous growth-season. Therefore, we fo-cused on the temperatures during the defoliation and
refoliation months with VIP scores > 0.8 as the critical periodsthat influence the powdery mildew disease.
Model coefficients for the daily Tmaxwere mostly positiveand VIP values mostly exceeded 0.8 between Dec 10 andJan 21, indicating that a higher Tmax during this period wascorrelated to a higher infection level (Fig. 4). Conversely,significant negative effects of Tmax on the infection level ofpowdery mildew were detected between Feb 7 and Mar 15,which indicated that a higher Tmax during this period wasrelated to a lower infection level. As the pattern was clearand consistent, with VIP value > 0.8, we considered Dec10–Jan 21 and Feb 7–Mar 15 as two critical phases for theresponses of the infection level of powdery mildew to Tmax(Fig. 4).
The response pattern of the infection level to the dailyTmean showed a similar pattern as that of Tmax: the signifi-cant positive effects were between Dec 11 and Jan 24, and thesignificant negative effects were between Feb 8 and Mar 10(Fig. 4). We, therefore, regarded Dec 11–Jan 24 and Feb 8–Mar 10 as two critical phases for the responses of the infectionlevel of powdery mildew to the daily mean temperature.
The temperature difference had a shorter positive effectperiod from Dec 6 to Jan 11 and a longer negative effectperiod from Jan 23 to Mar 30 (Fig. 4).
Combining the above results, we found positive effects ofdaily Tmax, Tmean, and TD on the infection level of powderymildew in the defoliation season. Conversely, negative effectsof Tmax, Tmean, and TD were recorded during refoliationseason.
Specific responses of rubber powdery mildewinfection to temperature
To illustrate the relative influence of the two critical phases onthe resultant infection level, we plotted the infection level as afunction of the three temperature variables during the twocritical phases together and interpolated the response byKriging method (Fig. 5). The trends of the infection level to
Fig. 3 Infection level of powdery mildew of each observation site (15 points per year) with day of the year (DOY) (a) and with years (b)
Int J Biometeorol

temperature variables were indicated by contour lines in therespective Kriging figures.
The average slope of the contour lines from the Tmax wasaround 45°, indicating that both periods had about the sameimportance on the infection level: an increasing effect ofTmax during Dec 10−Jan 21 of the defoliation season and adepressing effect of Tmax during Feb 07–Mar 15 of therefoliation season (Fig. 5). The infection level of powderymildew was expected to be greater than 40%, when the max-imum temperature during Dec 10−Jan 21 was above 26 °C orthe maximum temperature during Feb 07–Mar 15 was lowerthan 29 °C. When a higher maximum temperature during
Dec 10−Jan 21 was followed by a lower maximum tempera-ture during Feb 07–Mar 15, a higher infection level would beexpected in that year. Conversely, when a lower maximumtemperature during Dec 10−Jan 21 was followed by a highermaximum temperature during Feb 07–Mar 15, a lower infec-tion level would be expected. The relationships between in-fection level and daily Tmax during the two periods werefurther analyzed. The results from the linear model were con-sistent with the results from the Kriging interpolation analysis.The infection level increased by 11% per 1 °C rise of Tmaxduring the defoliation season (Dec 10−Jan 21; P < 0.05;Fig. 6), while the infection level decreased by 8% per 1 °C
Fig. 5 Response of infection level of powdery mildew to daily maximumtemperature (a), mean temperature (b), and temperature difference (c)during the defoliation season (x-axis) and the refoliation season (y-axis).Variation in color reflects variation in infection level, while the black dots
indicate the mean infection level of each year during 2003–2011. Theslopes of the contour lines show the relative importance of impacts oftemperature during the defoliation and the refoliation season
Fig. 4 Results of partial least squares (PLS) regression correlating infec-tion level of powdery mildew during 2003–2011 with 15-day runningmeans of (a), (b) daily maximum temperature, (c), (d) daily mean tem-perature, and (e), (f) daily temperature difference from previous April toMarch. The effects of variables are considered important when the con-fidence intervals of model coefficients (b, d, f) are significantly different
from 0, and very important for projection (VIP) values are greater than0.8. The blue bars in the left panel stand for the VIP scores of the dailymaximum, mean temperature, andmean temperature difference. Red barsin the right panel correspond to important negative effects of climatevariables on powdery mildew infection, while green bars indicate impor-tant positive effects. Gray bars indicate non-significant effects
Int J Biometeorol

rise of Tmax during the refoliation season (Feb 07–Mar 15;P < 0.05; Fig. 6).
Regarding daily mean temperature, the steep slope of thecontour lines indicated that the infection level was mainlydetermined by the variation of mean temperature during thedefoliation season (Fig. 5). Although a depressing effect ofhigh mean temperature was detected during the refoliationseason, the infection level was more sensitive to the highermean temperature during the defoliation season. When ahigher mean temperature during Dec 11−Jan 24 was followedby a lower mean temperature during Feb 08–Mar 10, a higherinfection level would be expected. Conversely, when a lowermean temperature during Dec 11−Jan 24 was followed by ahigher mean temperature during Feb 08–Mar 10, a lower in-fection level would be expected. During the defoliation sea-son, 1 °C rise of mean temperature increased the infectionlevel by 20% (P < 0.1; Fig. 6). Once the mean temperatureduring the defoliation season was above 19.5 °C, the infectionlevel of powdery mildew was expected to reach to 40% and itwould increase to 60% when the temperature rose to 20 °C.From Feb 08–March 10, higher daily mean temperature re-duced the infection level, which was less than 30% when themean temperature was above 22 °C during this period. Themean temperature during the refoliation season had a negative
effect on the infection level; however, the effect was not sta-tistically significant (P = 0.15).
Regarding daily temperature difference (TD), the low slopeof the contour lines indicated that the infection level of pow-dery mildew was almost entirely determined by the variationof temperature difference during Jan 23–Mar 30, i.e., therefoliation season, which is also the main epidemic period ofpowdery mildew in Xishuangbanna. Further analysis of therelationships between infection level and temperature differ-ence during the two periods showed that during Jan 23–Mar30 of the refoliation season, the infection level of powderymildew decreased by 10% per 1 °C rise of temperature differ-ence (P < 0.05; Fig.4). Therefore, the infection level was ex-pected to be lower than 30% when the temperature differenceduring the refoliation period was above 16 °C.
Considering the significant effects of the Tmax during bothdefoliation and refoliation seasons, Tmean during the defoli-ation season, and the temperature difference during therefoliation season on the infection level of powdery mildew,we investigated the changes of the above temperature vari-ables in the last 30 years from 1981 to 2011. The maximumand mean temperature during the defoliation season had asignificant increasing pattern with years. In the past 30 years,the Tmax during the defoliation season increased by 1.65 °C,
Infectionleve
l(%)
Infectionleve
l(%)
Infectionleve
l(%)
Fig. 6 Relationships betweeninfection level of powderymildew and daily maximumtemperature during defoliation (a)and refoliation (b), meantemperature during defoliation (c)and refoliation (d), andtemperature difference duringdefoliation (e) and refoliation (f).Each point represents the annualaverage level from 2003 to 2011.Trends are significant withP < 0.05
Int J Biometeorol

with the rate of 0.55 °C per decade (Fig. 7). The mean tem-perature during the defoliation season increased by 1.44 °Cduring the past 30 years, with the rate of 0.48 °C per decade(Fig. 7). The Tmax and TD during the refoliation season alsopresented an increasing pattern, but this was not statisticallysignificant (P = 0.16 for Tmax and P= 0.5 for TD).
Discussion
Contrasted effects of temperatures in the twophenological stages on the powdery mildew infection
There are few publications evaluating the responses of therubber powdery mildew infection to temperatures in both de-foliation and refoliation periods. The positive response ofpowdery mildew infection to the daily mean temperature dur-ing defoliation season detected in our research matched pre-vious observations: higher mean temperatures in winter al-ways related to a higher infection level of powdery mildewbased on a short-term field observation (Shi 2012; Zhang et al.2009). This is consistent to the reported effects of winter meantemperature on the epidemiology of oak powdery mildew inEurope (Desprez-Loustau et al. 2011; Marcais and Desprez-Loustau 2014). However, our results demonstrated that theinfection level of powdery mildew responded differently totemperatures (the mean temperature, maximum temperature,and temperature difference) in the defoliation and refoliationperiods (Figs. 4 and 5). Such differences could be relatedeither to the development of the fungi itself or to the sensitivity
of the trees. In fact, the development of rubber powdery mil-dew occurs on a wide range of temperature (16–32 °C) (Luet al. 1982); therefore, the observed pattern might rather relateto the phenology of rubber trees during these periods. It isknown that during the defoliation season, higher maximumand mean temperature can delay the leaf shedding (YITC1981; Zhou 1982), then also delaying refoliation. If new leafdevelops later, they may be in their most sensitive phase whenrain restarts. Such conditions have been shown favorable tothe development of several fungal leaf diseases in rubber trees(Guyot et al. 2010, 2005, 2001). Moreover, the higher tem-perature in the defoliation season could sustain moreoverwintering fungi by keeping more overwinter leaves, thusincreasing the source of parasitism of next spring (PPRI,SCATCS 1983; Yu et al. 1980; Yu et al. 1985). In contrast,the higher temperature during the refoliation season can accel-erate the development of leaves from budburst (Yu and Wang1988; Zhai et al. 2019), thereby shortening the disease sensi-tive period. A slower leaf development and longer duration ofleaf development to maturation, as when temperature is low inrefoliation season like in year 2008, also indicates a widerwindow of opportunities for the powdery mildew fungi toparasitize the leaf tissues (PPRI, SCATCS 1983; Yu et al.1980). This is consistent with three recently published studiesshowing that relatively low temperature in February–Marchincreased the infection level of powdery mildew in Yunnan(Cai et al. 2018; Chen et al. 2019; Su et al. 2015). A case studyfrom Hainan, the other large rubber cropping region in China,found that high temperature during defoliation stage causedthe prolong of leaf shedding period and then a high infection
Fig. 7 The trends of the (a) dailymaximum temperature duringDec 10–Jan 21 and (c) during Feb7–Mar 15, (b) mean temperatureduring Dec 11–Jan 24, and (d)temperature difference during Jan23–Mar 30 over 30 years. Trendsare significant with P < 0.05
Int J Biometeorol

level has been observed in 2017 (Wen et al. 2018). As awhole, our results underline the importance of rubber phenol-ogy for powdery mildew infection research (PPRI, SCATCS1983; Yu et al. 1980).
Other climatic factors could also have a strong influence onleaf fungal disease in rubber tree. For example, Guyot et al.(2010) showed that air humidity was the most important fac-tor, followed by rainfall, for South American Leaf Blight in-cidence in Brazil. However, in their conditions, temperaturesdid not vary much during the year. Higher rainfall duringrefoliation tends to increase powdery mildew incidence inChina (PPRI, SCATCS 1983; Yu et al. 1980 in Hainan;YITC 1981 in Xishuangbanna) and we found the same (Fig.S1). But the influence was likely indirect, by decreasing tem-perature (PPRI, SCATCS 1983; Yu et al. 1980; YITC 1981).In practice, the control of the disease by spraying copper sul-fate is guided by the temperatures (Chen et al. 2019; Tan andWang 2003; Tan et al. 2001).
The critical period for powdery mildew infection
In this study, we identified both defoliation and refoliationseasons as critical periods for the infection level of powderymildew using the PLS method. The significant effects of thetemperatures in the defoliation season were overlooked inprevious studies, while that of the refoliation season werehighlighted (PPRI, SCATCS 1983, 1985; Yu et al. 1980;YITC 1981). Here, we found that the temperatures in bothdefoliation season and refoliation season significantly affectthe infection level of powdery mildew in Xishuangbanna. Incontrast, previous short-term observation or experience-basedmethod, which was commonly applied to identify critical pe-riods for the powdery mildew infection (Paris and Cohen2002; PPRI, SCATCS 1983, 1985; Yu and Wang 1988;YITC 1981), might overestimate or underestimate the dura-tion of critical periods. A research team in Xishuangbannaidentified the period of January–March as the critical period(YITC 1981), while Zhou (1982) found December–January asthe critical period. The studies from other regions identifiedthe season of winter–spring (PPRI, SCATCS 1983, 1985) oronly the refoliation season (Paris and Cohen 2002) as thecritical period.
Moreover, most previous studies used monthly data in cer-tain months to relate the infection level of powdery mildew toclimatic factors, while many processes of plants have beenfound to respond to daily temperatures (Guo et al. 2013;Guo et al. 2015). The use of monthly climate data might notbe able to identify the patterns as detailed as the daily climatedata (Guo et al. 2017; Guo et al. 2013; Guo et al. 2015). Ourresults and findings proved that the PLS regression methodwas an effective approach to identify the detailed respondingpattern of daily climate variables on the infection level ofpowdery mildew. This method has been proved effective in
analyzing the relationship between daily temperatures andplants’ phenology, chilling and heating requirements ofplants, and productivity of grasslands (Guo et al. 2017,2013, 2015). All these findings will further improve our abil-ity to explain the variation in the infection level of powderymildew and show great potential for future disease monitoringand forecasting.
The PLS results showed also some positive relationshipsbetween temperatures from the end of May to the middle ofJuly and infection level and negative relationship betweentemperatures from April to May and the infection level.Some significant effects also occurred during the rainy season.This may relate to the flowering (March to April), fruiting(Middle of April to September), and new leaf flushing thatoccur 2 or 3 times during the year (Priyadarshan 2011). Thatcould also relate to the fungi development, as conidia couldspread during the rainy season to complete the disease cycle(Yu and Wang 1988).
Implications for forecasting powdery mildew diseasebased on temperatures
Our results indicated that daily maximum temperature,mean temperature, and temperature difference during bothdefoliation (December to January) and refoliation(January to March) are critical for forecasting powderymildew disease. Any studies based on only one seasonwill overlook the important influences of the other one.Therefore, to predict the infection level of powdery mil-dew of next spring, the temperatures during defoliationand refoliation season are all crucial. During the defolia-tion season, when the daily maximum temperature duringthe defoliation season is lower than 26 °C or the meantemperature lower than 19.3 °C, the infection level ofpowdery mildew is expected to be less than 30%.However, to predict the infection level of powdery mil-dew while it occurs and makes a control decision, weshould pay more attention to the temperatures during therefoliation season. During that season, if temperature dif-ference is lower than 15 °C or maximum temperaturelower than 29 °C, the infection level of powdery mildewis expected to be higher than 40%.
Although our study relies on data collected up to 2011, theobserved relationships would likely be still valid today.Actually, in the last 30 years, warming trends of the dailymaximum temperature and mean temperature have been ob-served during the defoliation period, but not during therefoliation one. If such warming trends continue in the future,as expected from climatic scenarios downscaled toXishuangbanna region (Zomer et al. 2014), more severe pow-derymildew infection will likely occur, which will cause greateconomic losses and have serious environmental conse-quences with more fungicide used.
Int J Biometeorol

Conclusion
In this study, we used partial least squares regression to cor-relate the infection level of powdery mildew to daily temper-atures. This method has been shown to be effective in identi-fying the critical periods and in presenting how the tempera-tures in the critical periods affected the infection level of pow-dery mildew in Xishuangbanna. Our results indicated that toforecast the infection level of powdery mildew, we shouldmonitor the daily maximum and mean temperature duringthe defoliation season, while the decision-making for powderymildew disease control during the refoliation season shouldpay more attention to the daily maximum temperature andtemperature difference. The findings from our study showgreat potential applications for the early warning system ofrubber powdery mildew.
Acknowledgments The first author thanks all the members of Ecolab atNAU for their research experiences and skills sharing.
Funding information This work was funded by the National NaturalScience Foundation of China (NSFC), by the Belmont ForumCollaborative Research Action “Mountains as Sentinels of Change-2015” (No. 41661144001), and by the Key Research Program ofFrontier Sciences, Chinese Academy of Sciences (QYZDY-SSW-SMC014). This work was supported by a visiting scholar grant to DeliZhai to the University of Northern Arizona in 2017–2018 from theKunming Institute of Botany.
References
Agro-meteorology Group of South China Academy of Tropical CropsSc iences (SCATCS) (1959) The pr imary resu l t s o fagrometeorological factors of rubber powdery mildew. ChineseState Farms 11:8–9
Cai Z, Shi Y, JiangG, Liu Y, ZhangC, Xiong Y,Wang J, GuoH, Ning L,Li G (2018) Investigation and causes analysis of rubber powderymildew and its comtrolling suggestions in Xishuangbanna region in2017. China Plant Protection 38:29–33
Cao M, Zou XM, Warren M, Zhu H (2006) Tropical forests ofXishuangbanna, China. Biotropica 38:306–309. https://doi.org/10.1111/j.1744-7429.2006.00146.x
Chen Y, Zhu Y, Zhang J, Zhou S, Zhang L (2019) Study on dynamicforecast of the suitability degree of rubber powdery mildew weathercondition in Yunnan Province. J Catastrophol 34:148–152
Cardoso SEA, Freitas TA, Silva DDC, Gouvêa LRL, Gonçalves PDS,Mattos CRR, Garcia D (2014) Comparison of growth, yield andrelated traits of resistant Hevea genotypes under high SouthAmerican leaf blight pressure. Ind Crop Prod 53:337–349
Desprez-Loustau ML, Feau N, Mougou-Hamdane A, Dutech C (2011)Interspecific and intraspecific diversity in oak powdery mildews inEurope: coevolution history and adaptation to their hosts.Mycoscience 52(3):165–173. https://doi.org/10.1007/s10267-010-0100-5
Guo L, Dai J, Ranjitkar S, Xu J, Luedeling E (2013) Response of chestnutphenology in China to climate variation and change. Agric ForMeteorol 180:164–172. https://doi.org/10.1016/j.agrformet.2013.06.004
Guo L, Dai J, Wang M, Xu J, Luedeling E (2015) Responses of springphenology in temperate zone trees to climate warming: a case studyof apricot flowering in China. Agric For Meteorol 201:1–7. https://doi.org/10.1016/j.agrformet.2014.10.016
Guo L, Cheng JM, Luedeling E, Koerner SE, He JS, Xu JC, Gang CC, LiW, Luo RM, Peng CH (2017) Critical climate periods for grasslandproductivity on China’s Loess Plateau. Agric For Meteorol 233:101–109. https://doi.org/10.1016/j.agrformet.2016.11.006
Guyot J, Omanda EN, Ndoutoume A, Otsaghe A-AM, Enjalric F,Assoumou H-GN (2001) Effect of controlling Colletotrichum leaffall of rubber tree on epidemic development and rubber production.Crop Prot 20:581–590. https://doi.org/10.1016/S0261-2194(01)00027-8
Guyot J, Ntawanga Omanda E, Pinard F (2005) Some epidemiologicalinvestigations on Colletotrichum leaf disease on rubber tree. CropProt 24:65–77. https://doi.org/10.1016/j.cropro.2004.06.009
Guyot J, Condina V, Doare F, Cilas C, Sache I (2010) Segmentationapplied to weather-disease relationships in South American leafblight of the rubber tree. Eur J Plant Pathol 126:349–362. https://doi.org/10.1007/s10658-009-9540-1
Lan G, Li Y, Lesueur D, Wu Z, Xie G (2018) Seasonal changes impactsoil bacterial communities in a rubber plantation on Hainan Island,China. Sci Total Environ 626:826–834. https://doi.org/10.1016/j.scitotenv.2018.01.147
Li YW, Xia YJ, Li HY, Deng XB, Sha LQ, Li B, Lin LX, Cao M (2016)Accumulated impacts of sulfur spraying on soil nutrient availabilityand microbial biomass in rubber plantations. Clean-Soil Air Water44:1001–1010. https://doi.org/10.1002/clen.201400397
Liyanage KK, Khan S, Mortimer PE, Hyde KD, Xu J, Brooks S, Ming Z(2016) Powdery mildew disease of rubber tree. For Pathol 46:90–103. https://doi.org/10.1111/efp.12271
Liyanage KK, Khan S, Brooks S, Mortimer PE, Karunarathna SC, Xu JC,Hyde KD (2018) Morpho-molecular characterization of twoAmpelomyces spp. (Pleosporales) strains mycoparasites of powderymildew of Hevea brasiliensis. Front Microbiol 9:12. https://doi.org/10.3389/fmicb.2018.00012
LiyanageKK, Khan S, Ranjitkar S, YuH,Xu J, Brooks S, Beckschäfer P,Hyde KD (2019) Evaluation of key meteorological determinants ofwintering and flowering patterns of five rubber clones inXishuangbanna, Yunnan, China. Int J Biometeorol 63:617–625.https://doi.org/10.1007/s00484-018-1598-z
Lu D, Zhou Q, Zheng G, Yu Z (1982) A biological study on OidiumHeveae. Chin J Trop Crop Research 3:63–70
Luedeling E (2017) ChillR: statistical methods for phenology analysis intemperate fruit trees., R package version 0.66. http://cran.r-project.org/package=chillR (accessed on 20 May 2018). Accessed 20May 2018
Luedeling E, Gassner A (2012) Partial least squares regression for ana-lyzing walnut phenology in California. Agric For Meteorol 158–159:43–52. https://doi.org/10.1016/j.agrformet.2011.10.020
Luedeling E, Guo L, Dai JH, Leslie C, Blanke MM (2013) Differentialresponses of trees to temperature variation during the chilling andforcing phases. Agric For Meteorol 181:33–42. https://doi.org/10.1016/j.agrformet.2013.06.018
Marcais B, Desprez-Loustau ML (2014) European oak powdery mildew:impact on trees, effects of environmental factors, and potential ef-fects of climate change. Ann For Sci 71:633–642. https://doi.org/10.1007/s13595-012-0252-x
Mevik BH, Wehrens R, Liland K (2016) PLS: partial least squares andprincipal component regression., R Package Version 2.6.0, http://cran.r-project.org/package=pls
Int J Biometeorol

Nychka D, Furrer R, Paige J, Sain S (2017) Fields: tools for spatial data, RPackage Version 9.0, http://cran.r-project.org/package=fields
Paris HS, Cohen R (2002) Powdery mildew-resistant summer squashhybrids having higher yields than their susceptible, commercialcounterparts. Euphytica 124:121–128. https://doi.org/10.1023/a:1015623013740
Plant Protection Research Institute of South China Academy of TropicalCrops Sciences (PPRI, SCATCS) (1983) Epidemic pattern of rubberpowdery mildew in 1959–1981. Chin J Trop Crop Res 4:75–84
Plant Protection Research Institute of South China Academy of TropicalCrops Sciences (PPRI, SCATCS) (1985) Rubber powdery mildewforecasting in 1960–1980. Chin J Trop Crop Res 6:51–56
Priyadarshan P (2011) Biology of Hevea rubber. CAB International,Wallingford
R Core Team (2017) R: A Language and environment for statisticalComputing. R Foundation for Statistical Computing, Vienna,Austria. https://www.R-project.org/
Rivano F,Mattos CRR, Cardoso SEA,MartinezM, Cevallos V, Le GuenV, Garcia D (2013) Breeding Hevea brasiliensis for yield, growthand SALB resistance for high disease environments. Ind Crop Prod44:659–670. https://doi.org/10.1016/j.indcrop.2012.09.005
Shao Z, Hu Z (1984) Powdery mildew infestation investigation on dif-ferent leaf phenologies of rubber trees. Yunnan Trop Technol 1:1–5
Shao Z, Zhou J, Chen J, Li C, Meng Y (1996) Powdery mildew epidemicrate of rubber trees Yunnan. Trop Technol 19:2–12
Shi S (2012) The control of rubber powdery mildew. Yunnan Agr 4:25–26
Su C, Chen G, Zhang Z, Peng R, ZHang Y, Yang J (2015) Investigationon powdery mildew in private Hevea plantaions of Ruili City in theyear of 2013. Trop Agr Sci Technol 38:10–12
Tan F, Wang S (2003) The application of spraying sulfur to control therubber powdery mildew disease. Chin J Trop Crop Sci 23:8–13
Tan F, Wang S, Chen J (2001) Rubber powdery mildew control technol-ogies in Hekou, Yunnan. Yunnan Trop Technol 24:11–16
Wen Y, Li R, He C, Li J, Yang K, Wu X (2018) Prevalence of Heveapowdery mildew (Oidium heveae) in Danzhou and its adjacent areasin Hainan. Chin J Trop Agr 38:74–78
Xu JC, Lebel L, Sturgeon J (2009) Functional links between biodiversity,livelihoods, and culture in a Hani Swidden landscape in SouthwestChina. Ecol Soc 14:20
Yu Z, Wang S (1988) Epidemic processes and structure of rubber pow-dery mildew. Chin J Tropical Crops 1:83–89
Yu Z,Wang S, Zhou C (1980) Rubber powdery mildew epidemic factorsand control analysis, and the assessment in 1979. Chin J Trop AgrRes 2:89–99
Yu Z, Wang S, Zhou C (1985) Changing patterns of spores of OidiumHeveae. Chin J Trop Crop Res 2:34–40
Yu H, Hammond J, Ling S, Zhou S, Mortimer PE, Xu J (2014) Greaterdiurnal temperature difference, an overlooked but important climaticdriver of rubber yield. Ind Crop Prod 62:14–21. https://doi.org/10.1016/j.indcrop.2014.08.001
Yunnan Institute of Tropical Crops (YITC) (1981) Rubber powdery mil-dew forecasting in Jinghong. Yunnan Trop Technol 1:28–34
Zhai D-L, Yu H, Chen S-C, Ranjitkar S, Xu J (2019) Responses of rubberleaf phenology to climatic variations in Southwest China. Int JBiometeorol 63:607–616. https://doi.org/10.1007/s00484-017-1448-4
Zhang J, CaoM (1995) Tropical forest vegetation of Xishuangbanna, SWChina and its secondary changes, with special reference to someproblems in local nature conservation. Biol Conserv 73:229–238.https://doi.org/10.1016/0006-3207(94)00118-a
Zhang H, Yang S, Li W, Hu Y, Bai X (2009) Epidemic pattern of rubberpowdery mildew in Dehong. The 2009 annual conference ofYunnan tropical crops, Xishuangbanna. pp. 12
Zhou G (1982) The relationships between winter climate and leaf shed-ding and powderymildew in Jinghong. Yunnan Trop Technol 4:18–23
Zhou W, Sha L, Shen S, Zheng Z (2008) Seasonal change of soil respi-ration and its influence factors in rubber (Hevea brasiliensis) plan-tation in Xishuangbanna, SW China. J Mt Sci 03:317–325
Zhu H, CaoM, HuHB (2006) Geological history, flora, and vegetation ofXishuangbanna, southern Yunnan, China. Biotropica 38:310–317.https://doi.org/10.1111/j.1744-7429.2006.00147.x
Zomer RJ, Trabucco A, Wang M, Lang R, Chen H, Metzger MJ, SmajglA, Beckschäfer P, Xu J (2014) Environmental stratification to modelclimate change impacts on biodiversity and rubber production inXishuangbanna, Yunnan, China. Biol Conserv 170:264–273
Publisher's note Springer Nature remains neutral with regard tojurisdictional claims in published maps and institutional affiliations.
Int J Biometeorol