Embed Size (px)
Citation preview

Iowa State Board of Education
Executive Summary January 22, 2015
Agenda Item: Review of the School Finance Formula Review Committee Meeting
Iowa Goal: All PK-12 students will achieve at a high level. State Board Role/Authority: The State Board acts in an advocacy role to promote
effective education opportunities for all students in Iowa.
Presenter: Jeff Berger Deputy Director
Attachments: 1
Recommendation: It is recommended that the State Board hear and discuss this information.
Background: The School Finance Formula Review Committee is
required to be appointed every five years to conduct regular reviews of the school finance formula and produce a school finance formula status report for submission to the General Assembly. The Review Committee met on December 15, 2014. Jeff Berger presented the attached document and will provide the State Board an overview of the meeting and next steps.
Framework for Board Policy
Development and Decision Making
Issue Identification
Board Identifies Priorities
Board Analysis
Study
Board Follow-
Up
Board Action

Jeff BergerIowa Department of Education
Lisa Oakley Iowa Department of Management
John ParkerLegislative Services Agency

Formula Basics – Oakley
Changes over past 5 years - Oakley
District Cost Per Pupil – Parker
Comparison with Other States – Parker
Formula Equity/Inequity – Berger
State Aid vs. Property Taxes – Berger
Categorical Funding - Berger

338 school districts
9 Area Education Agencies
478,920.9 budget enrollment
$2,873,761,313 state foundation aid
$1,349,340,006 foundation property tax
$2,122,027,702 total property tax
$103,055,261 total income surtax

Iowa Code 257.31:
Equalize educational opportunity
Provide good education for all children of Iowa
Provide property tax relief
Decrease percentage of school costs paid from
property taxes
Provide reasonable control of school costs

Spending limit/ceiling
Local school district funding is primarily
determined by the number of students and
the district’s cost per pupil

Step 1: Determine spending authority
Step 2: Determine state aid vs.
property tax
District Cost X Weighted = District's
Per Pupil Enrollment Basic Budget
State Aid
Uniform Levy
$5.40 Per
$1000 Valuation
Additional Levy
Foundation Level

Limits school district spending (general
fund)
Represents legal or statutory maximum
Unused spending authority carries forward
to next year
Negative unspent balance = violation of
statutory authority


Regular Program Cost =
District Cost per Pupil X Enrollment◦ State Percent of Growth – applied to per pupil funding
amount (not the overall budget)◦ Supplemental State Aid – amount per pupil funding
grows
◦ Enrollment Count taken October 1 October 2014 used to determine FY 2015-16 funding Pupils counted for funding purposes where they reside
FY 2014 FY 2015 FY 2015District Cost + Supplemental State = District Cost
Per Pupil Aid Amount Per Pupil$245
FY 2014 FY 2015 FY 2015State Cost + State Percent of = Supplemental StatePer Pupil Growth Aid Amount$6,121 4% $245

Budget Adjustment – 101% guarantee◦ One year cushion
◦ 100% property tax
◦ Board resolution required
Weighted Enrollment Funding◦ Special Education
◦ English Language Learners
◦ Operational Function Sharing
◦ Others – Sharing, At-Risk, Reorganization

State Categorical Supplements – separate state
percent of growth and district cost per pupil◦ FY 2010
Teacher Salary
Professional Development
Class Size/Early Intervention
◦ FY 2016
Teacher Leadership Supplement
39 districts that received FY 2015 grants
$308.82 cost per pupil

AEA Program Funding ◦ Flows through local district
◦ Pupil driven
◦ Special Education Support Services
◦ Media Services
◦ Educational Services
◦ Operational Function Sharing
◦ Categorical - Teacher Salary and Professional Development
Discretionary – General Fund◦ Instructional Support Program
◦ 4-Year-Old Preschool Program
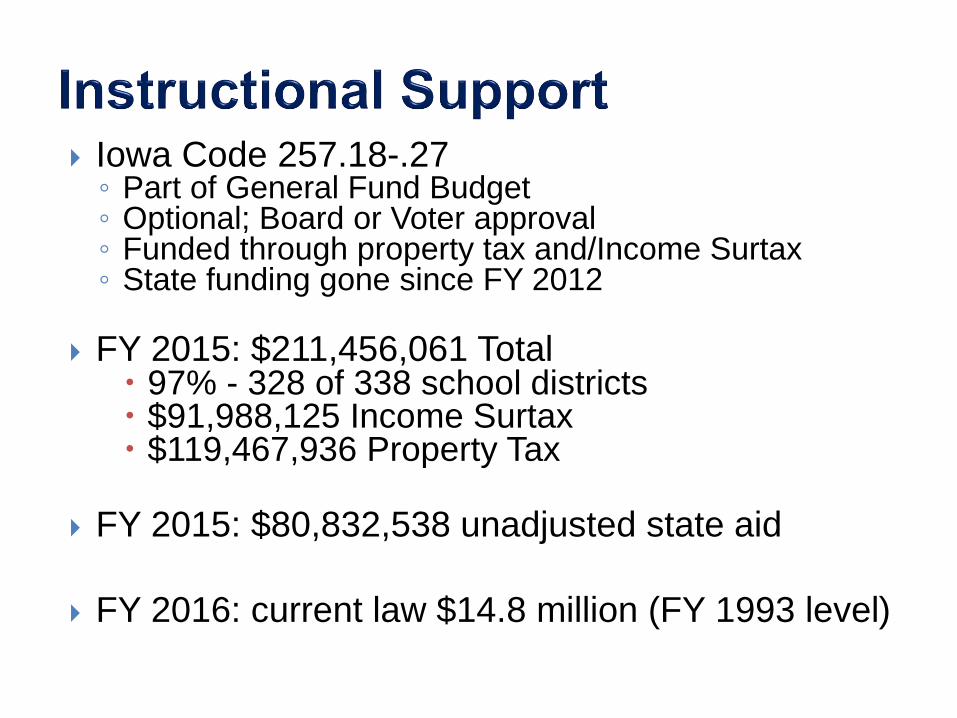
Iowa Code 257.18-.27◦ Part of General Fund Budget◦ Optional; Board or Voter approval◦ Funded through property tax and/Income Surtax ◦ State funding gone since FY 2012
FY 2015: $211,456,061 Total 97% - 328 of 338 school districts $91,988,125 Income Surtax $119,467,936 Property Tax
FY 2015: $80,832,538 unadjusted state aid
FY 2016: current law $14.8 million (FY 1993 level)

FY 2009
100% state aid
50% of enrollment X state cost per pupil
FY 2015:◦ 21,926 formula count
◦ $3183 per enrollment (1/2 of state cost per pupil)
◦ $70 million; 310 districts

Spending Authority approved by SBRC◦ Dropout Prevention
◦ Ontime Funding, ELL, Open Enrollment Out
◦ Other
Miscellaneous Income◦ Federal and State Grants
Previous year Unspent Authority carried forward

Positive◦ Unused total spending authority
◦ Authority to spend – is not cash
◦ Use for one-time expenditures; once spent is gone
Negative – over spent◦ Report to SBRC
◦ Corrective action plan – reduce expenditures; reorganization; dissolution; increase Instructional Support Levy if possible

Step 1: Determine spending authority
Step 2: Determine state aid vs.
property tax
District Cost X Weighted = District's
Per Pupil Enrollment Basic Budget
State Aid
Uniform Levy
$5.40 Per
$1000 Valuation
Additional Levy
Foundation Level

19
Foundation Formula
Foundation Level
FY 2015:
87.5% of State Cost ($6,366)
= $5,570 Per Pupil
State Aid
Uniform Levy
$5.40 Per
$1000
Valuation
Additional Levy

20
Foundation FormulaProperty Rich
District
Property Poor
District
Uniform Levy
$5.40
Additional Levy
State Aid
Uniform Levy
$5.40
Additional Levy
State Aid
Foundation
LevelFoundation
Level
Uniform Levy
$5.40
Additional Levy
State Aid
Uniform Levy
$5.40
Additional Levy
State Aid
Property Rich
District
Property Poor
District
Uniform Levy
$5.40
Additional Levy
State Aid
Uniform Levy
$5.40
Additional Levy
State Aid
Foundation
LevelFoundation
Level
Uniform Levy
$5.40
Additional Levy
State Aid
Uniform Levy
$5.40
Additional Levy
State Aid

AEA Sp. Ed.
Support
$280
$52 $58 $29 $3
= Additional Levy
= Uniform Levy
= State Aid
AEA Media
Services
AEA Ed.
Support
Teacher
Salary
Supplement Prof. Dev.
Supplement
Key

22
Foundation Percentage Foundation Cost per Pupil X Enrollment = Total
Foundation Dollars◦ State Foundation Cost per Pupil X Weighted Enrollment
(w/o special ed) ◦ Special Education Foundation Cost per Pupil X Special
Ed Weight◦ AEA Foundation Cost per Pupil X Weighted Enrollment◦ Supplemental Categorical (TSS, PD, EI, TLS) – 100%
state aid
Total Foundation Dollars minus Uniform Levy Add 4-Year-Old Preschool State Foundation Aid Equals Unadjusted State Foundation Aid

Receive revenue other than formula state aid and property taxes
Utility Replacement Excise Tax◦ Began in FY 2002◦ Gas & Electric companies pay excise tax based on energy delivered◦ Estimate – based on tax rate and G&E valuation◦ Actual – based on energy delivered
Commercial/Industrial State Replacement◦ Began in FY 2015◦ C/I property tax relief◦ Property Valuation rollback
FY 2015 – 95%
FY 2016 and beyond – 90%
◦ State is reimbursing local governments for lost property taxes

Components of Additional Levy:
12.5% of the Regular Program Foundation Level
12.5% of the Special Education Foundation Level
21.0% of the AEA Foundation Level
AEA Media and Education Services
DCPP above SCPP
District and AEA Budget Adjustment
Dropout Prevention Program
Property Tax Adjustment Aid
Adjusted Additional Property Tax Levy Aid
Property Tax Replacement Payment
Miscellaneous
Combined District Cost minus Total Foundation Level

25
(1) Property Tax Adjustment Aid◦ FY 1992
◦ Gradual phase-out as valuations grow
◦ FY 2015 - $9.3m; 288 districts
(2) Property Tax Replacement Payment (PTRP)◦ FY 2014
◦ Replaces $15 in FY 2014 and $46 in FY 2015
◦ FY 2015 - $25.4m; all 338 districts
◦ FY 2016 – current law $46 only continues

26
State Aid
$46 state aid
Uniform Tax
Levy 5.40/1000
Additional Levy
$796 $750

27
(3) Adjusted Additional Property Tax Levy Aid◦ FY 2007 state GF / FY 2010 PTER◦ Districts with highest adjusted additional levy rate; lowest
valuation per pupil◦ FY 2015 rate brought down from $5.73 to $3.39 ◦ FY 2015 - $32.2m; 68 districts ($24.0m state GF; $8.2m
PTER)
(4) Additional PTER funding◦ FY 2010◦ Increases foundation level for all districts◦ Amount = zero

28

29
Provides “cash” behind spending authority
Property taxes levied for:◦ Cash to back unfunded spending authority
◦ State aid, property tax shortfall
◦ Modified Supplemental Amount (spending authority
approved by the SBRC)
◦ Included in district’s general fund levy
FY 2015 - $182,986,988; 220 districts
Iowa Code limitation = 20% of expenditures minus
assigned and unassigned ending fund balance

30
Used to replace property tax
Surtax on individual income tax collections
20% maximum
Instructional Support Levy, Voted Physical Plant
and Equipment Levy, or Educational Improvement
Levy
FY 2015 - $103,055,261; 281 districts

31
Management Levy◦ Specified use; $147,221,151; 328 districts
Physical Plant and Equipment Levy (PPEL)◦ Board approved $0.33; $49,428,480; 328 districts◦ Voter approved $1.34; $108,535,282; 244 districts
Public Education and Recreation Levy (PERL)◦ Voter approved $0.135; $2,390,310; 20 districts
Debt Service/Bond Levy◦ 60% voter approval◦ $2.70 maximum unless voters approved higher ($4.05)◦ $162,368,318; 184 districts

32
FY 2010◦ Teacher Salary, Professional Development, Early
Intervention Roll-in
◦ Property Tax Equity and Relief (PTER) funding for
property tax relief
FY 2011◦ None
FY 2012◦ 4-year-old preschool weight changed from 60% to 50%
FY 2013◦ Cash Reserve Levy Limit changed from 25% to 20%
◦ Final year of the scale down budget guarantee
33
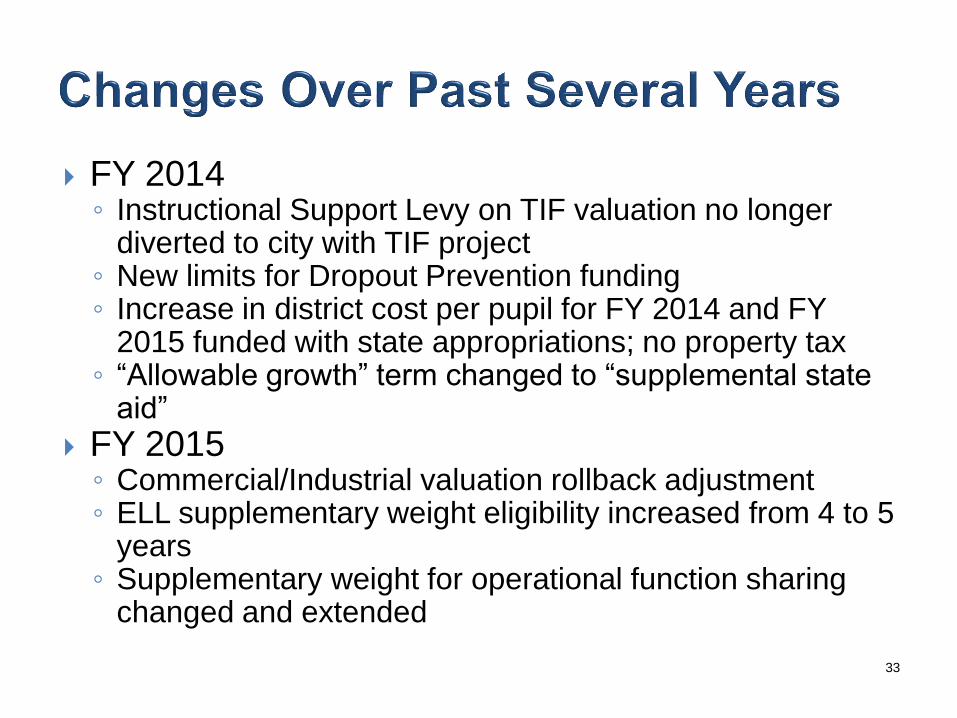
FY 2014◦ Instructional Support Levy on TIF valuation no longer
diverted to city with TIF project◦ New limits for Dropout Prevention funding◦ Increase in district cost per pupil for FY 2014 and FY
2015 funded with state appropriations; no property tax◦ “Allowable growth” term changed to “supplemental state
aid”
FY 2015◦ Commercial/Industrial valuation rollback adjustment◦ ELL supplementary weight eligibility increased from 4 to 5
years◦ Supplementary weight for operational function sharing
changed and extended

34
FY 2016◦ Teacher Leadership Compensation funding roll-in
◦ Set amount (2.1%) of school infrastructure sales tax
dedicated to PTER fund

$3,406
$6,366
0
1,000
2,000
3,000
4,000
5,000
6,000
7,000
0.0%
0.5%
1.0%
1.5%
2.0%
2.5%
3.0%
3.5%
4.0%
4.5%
1994 1995 1996 1997 1998 1999 2000 2001 2002 2003 2004 2005 2006 2007 2008 2009 2010 2011 2012 2013 2014 2015
$
Fiscal Year
State Percent of Growth Rates and State Cost Per Pupil Amounts FY 1994 to FY 2015
State Percent of Growth Rate SCPP

36
State
Percent of
Growth
Session
Enacted Bill #
Date
Enacted
Meets Reqirements
under 257.8 and
8.21
FY 2015 4.0% 2013 HF 215 6/3/2013 No
FY 2014 2.0% 2013 HF 215 6/3/2013 No
FY 2013 2.0% 2011 SF 533 7/27/2011 No
FY 2012 0.0% N.A. N.A. N.A. No
FY 2011 2.0% 2009 SF 218 2/27/2009 Yes
FY 2010 4.0% 2008 HF 2140 2/12/2008 Yes
FY 2009 4.0% 2007 SF 109 2/22/2007 Yes
FY 2008 4.0% 2006 HF 2095 6/1/2006 No
FY 2007 4.0% 2005 SF 36 2/2/2005 Yes
FY 2006 4.0% 2004 SF 2298 5/17/2004 No
FY 2005 2.0% 2003 SF 211 3/3/2003 No
FY 2004 2.0% 2002 SF 2328 5/9/2002 Yes
FY 2003* 1.0% 2002 SF 2315 3/28/2002 No/Yes *
FY 2002 4.0% 2000 SF 2082 2/9/2000 Yes
FY 2001 4.0% 1999 HF 146 2/4/1999 Yes
FY 2000 3.0% 1998 SF 2094 2/19/1998 Yes
*Note: The State percent of growth for FY 2003 was originally set at 4.0%
during the 2001 Session (HF 191 approved on 2/12/2001).
Iowa Code 257.8 - "The state percent of growth for each subsequent budget year shall
be established by statute which shall be enacted within thirty days of the submission in
the year preceding the base year of the governor’s budget under section 8.21."
Iowa Code 8.21 - "Not later than February 1 of each legislative session, the governor
shall transmit to the legislature a document to be known as a budget, setting forth the
governor’s financial program for the ensuing fiscal year and having the character and
scope set forth in sections 8.22 through 8.29."

37
Districts Below Districts Above
SCPP Minimum Maximum Range SCPP SCPP
Regular Program 6,366$ 6,366$ 6,541$ 175$ 165 173
Teacher Salary Supplement 549$ 468$ 882$ 414$ 98 240
Professional Dev. Supp. 62$ 36$ 111$ 75$ 186 152
Early Intervention 68$ 40$ * 112$ 72$ 218 120
*LuVerne Received $8.21 per pupil, but was not inculded due to reporting issues.
Districts Below Districts Above
SCPP Minimum Maximum Range SCPP SCPP
AEA Special Ed. Support 280$ 272$ 294$ 22$ 118 220
AEA Media Services 52$ 52$ 52$ 0.54$ 185 153
AEA Ed Support 58$ 57$ 59$ 2.30$ 139 199
AEA Teacher Salary Supp. 29$ 22$ 36$ 14$ 139 199
AEA Professional Dev. Supp. 3.35$ 2.83$ 4.15$ 1.32$ 208 130
District Cost Per Pupil
District Cost Per Pupil
Note: The Teacher Leadership Compensation in FY 2016 and beyond,
all districts in the program will receive the same amount per pupil.

38
Expenditures Per Pupil 2010-2011(Constant 2012-13
Dollars)
◦ U.S.- $11,153
◦ Iowa - $10,249
◦ Difference - $904
◦ Rank – 28th
Expenditures Per Pupil 2010-2011(Unadjusted Dollars)
◦ U.S.- $10,658
◦ Iowa - $9,795
◦ Difference - $863
◦ Rank – 28th
Note: Current expenditures include instruction, support services, food services, and enterprise operations. Expenditures for state administration are excluded in all years. Unadjusted (or “current”) dollars have not been adjusted to compensate for inflation. Constant dollars based on the Consumer Price Index (CPI), prepared by the Bureau of Labor Statistics, U.S. Department of Labor, adjusted to a school-year basis. The CPI does not account for differences in inflation rates from state to state.
Source: U.S. Department of Education, National Center for Education Statistics, “National Public Education Financial Survey," July 2013.

39
Estimated Expenditures
Per Pupil 2013-2012
◦ U.S.- $11,373
◦ Iowa - $9,761
◦ Difference - $1,612
◦ Rank – 35th
Estimated Expenditures
Per Pupil 2010-2011
◦ U.S.- $10,770
◦ Iowa - $9,484
◦ Difference - $1,286
◦ Rank – 35th
Note: Current expenditures of elementary and secondary day schools include amounts paid for general control, instructional service, operation, maintenance, fixed charges, and other school services including expenditures for state administration. Current expenditures comprise all governmental contributions to the retirement fund and expenditures for school services, including attendance, health services, transportation, and other school services. This figure does not include payments for capital outlay and interest on school debt or amounts spent for community colleges, community services, summer school, community centers, and services to nonpublic school students.
Source: National Education Association , “Rankings of the States 2013 and Estimates of School Statistics 2014”

40
Iowa’s School Aid Funding formula is widely known
as a very stable, equitable formula
Over the years, funding situations like roll-ins,
optional levies, and unequal expenses create
inequities
As with any complex formula, adjustments can
cause unintended consequences
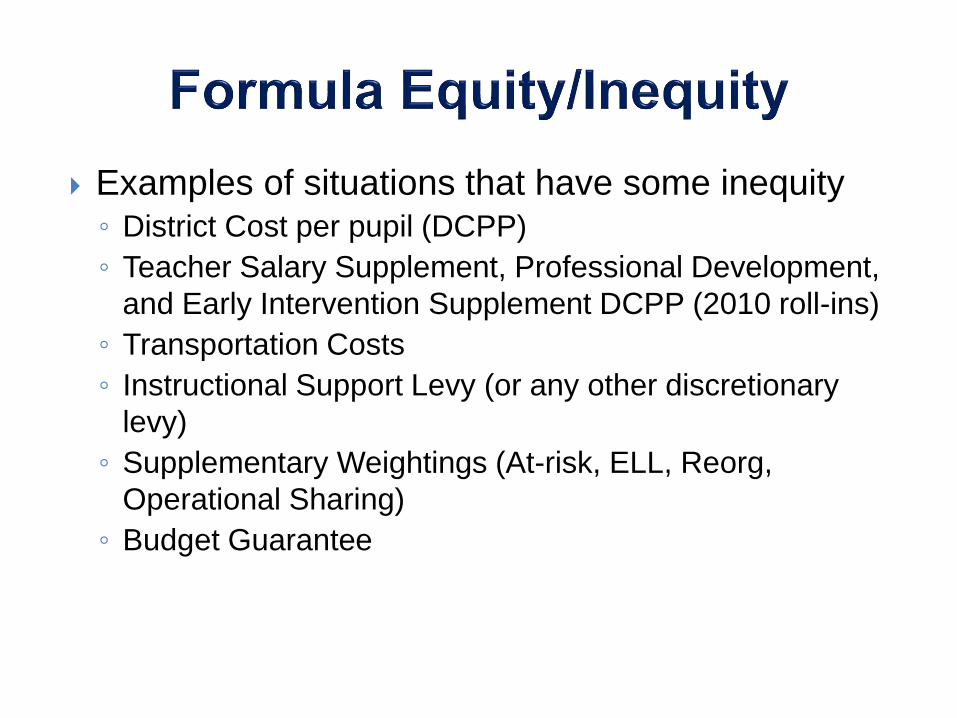
Examples of situations that have some inequity◦ District Cost per pupil (DCPP)
◦ Teacher Salary Supplement, Professional Development,
and Early Intervention Supplement DCPP (2010 roll-ins)
◦ Transportation Costs
◦ Instructional Support Levy (or any other discretionary
levy)
◦ Supplementary Weightings (At-risk, ELL, Reorg,
Operational Sharing)
◦ Budget Guarantee

Examples of situations that have some inequity◦ Special Education Weightings◦ Drop-out Prevention Modified Supplemental Aid◦ Lack of on-time funding◦ Differential cost of support for various types of students and
locations
Solutions are typically:◦ Add funds to raise lower limit◦ Reduce funds to bring down upper limit◦ Hybrid
There will always be some inequities. Fixing some inequities can create other inequities.

Critical to Iowa’s long-time formula stability and equity
is the “blended portfolio” concept behind our formula
Similar to stocks vs. bonds concept in your own
investments
When state revenues are stretched, the ability to
support with local property taxes is essential to
avoiding severe fluctuations in local school revenue
In FY09/10, the property tax component of our formula
helped Iowa avoid the severe fluctuations in other
states (NJ, CO, CA, etc.)

The “correct balance” is always a subject of
debate for policy-makers
Extremes either way will destabilize what is a
functional, equitable formula
Modified supplemental state aid is necessary to a
degree to avoid slowly creeping on amounts of
property taxes (budget deficits filled with property
taxes in certain situations)
Whatever we do, let’s continue to support this
“blended portfolio” concept (Berger’s opinion)

Categorical funding is funding created for a
specific purpose
Can be state, federal, local, or other
Typically have statute related to uses, separate
formula computation, and accounting
Dillon’s rule applicable and appropriate◦ Why this is an advantage for legislators

Pros◦ Guide funding to a specific purpose
◦ Easier to track uses of funds
◦ Discrete decision-making
◦ Can establish separate formulas for each fund
Cons◦ Complexity of various funding increases risk of errors
◦ Increased need for management
◦ May not be necessary (TAG example)
◦ Creates inequities