Embed Size (px)
Citation preview

BOARD OF EDUCATION Board Auditorium Portland Public Schools Blanchard Education Service Center STUDY SESSION 501 North Dixon Street May 6, 2013 Portland, Oregon 97227 Note: Those wishing to speak before the School Board should sign the citizen comment sheet prior to the start of the regular meeting. No additional speakers will be accepted after the sign-in sheet is removed, but citizens are welcome to sign up for the next meeting. While the School Board wants to hear from the public, comments must be limited to three minutes. All citizens must abide by the Board’s Rules of Conduct for Board meetings.
Citizen comment related to an action item on the agenda will be heard immediately following staff presentation on
that issue. Citizen comment on all other matters will be heard during the “Remaining Citizen Comment” time.
This meeting may be taped and televised by the media.
STUDY SESSION AGENDA
1. PUBLIC COMMENT 6:00 pm
2. STUDENT PRESENTATION: GREENING SCHOOLS 6:20 pm
3. TEACHER APPRECIATION WEEK 6:35 pm
4. WILSON CLUSTER UPDATE 6:40 pm
5. BUDGET DISCUSSION – Board as Budget Committee 7:40 pm
6. CASH MANAGEMENT POLICY UPDATE DISCUSSION 8:40 pm
7. CAPITAL ASSET RENEWAL POLICY DISCUSSION 8:55 pm
8. BUSINESS AGENDA 9:20 pm
9. ADJOURN 9:25 pm
The next meeting of the Board will be held on May 13, 2013, at 6:00 pm in the Board Auditorium at the Blanchard Education Service Center.
Portland Public Schools Nondiscrimination Statement
Portland Public Schools recognizes the diversity and worth of all individuals and groups and their roles in society. All individuals and groups shall be treated with fairness in all activities, programs and operations, without regard to age, color, creed, disability, marital status, national origin, race, religion, sex, or sexual orientation. Board of Education Policy 1.80.020-P
Congratulations!!
2013 Teacher Appreciation Honorees
Matt Bacon‐Brenes ~ Mt Tabor Middle School
George Bishop ~ Roosevelt High School
Jennifer Christ ~ Harvey Scott Elementary School
Theresa Egan ~ ACCESS Academy
MaryLynn Gardner – Peninsula Elementary School
Theresa Hawkins ~ Franklin High School
Paul Kroswek – Jackson Middle School
Luis Lopez ~ Bridger Elementary School
Lisa Lum ~ Sitton Elementary School
Peggy Maloney ~ Vernon Elementary School
Shawn Swanson~ Roosevelt High School
Tara Vargas ~ Student Services

The Portland Public Schools Board of Education would like to recognize, congratulate and extend appreciation to all of the following employees for their devoted service to the students, families and staff of Portland Public Schools. Your dedication and service to the Portland community are not taken for granted. In 2012-2013, years of service are honored in five-year increments, ranging from five years to forty years.
All service award recipients will receive a pin signifying their years of service.
Forty Years Harriet Adair Office of Schools Renee Banks Boise-Eliot School Lynda Darling Alliance High School Lois Read Scott School Patricia Stanich Maplewood School
Thirty-Five Years Laura Boitano Vestal School Steven Bourdeau Maintenance Services Pamela Haines Benson High School Susan Himelhoch West Sylvan Alan Jelkrem Facility Services Center, Marshall HS Susan Lehman Wilcox School Kristine Marcus-McEwen King School Carl Miller Facilities Services Center, Forest Park School Tracy Pulford Lincoln High School Eunice Tursi Llewellyn School Margaret Verhaeghe Headstart, Creston Annex Kathleen Williams Creston School Pamela Wilson Capitol Hill School
Thirty Years Michael Ball Cleveland High School Leslie Beach Astor School Elizabeth Casson-Taylor Beaumont Middle School Paul Cook Cleveland High School Kimberly Davis Madison High School Bonnie Doyle Special Education Mark Franklin Maintenance Services Lynsey Howatt Special Education Eileen Isham Headstart, Sacajawea Site Pamela Jones Information Technology Eve Liebman Special Education Jerrold Lively Facility Services Center Benita Lloyd Vestal School Tracie Lynch King School Katherine Meyer Benson High School Dawn Nelson Forest Park School Nanci Noyer Stephenson School David Peake Madison High School Cynthia Roby Ainsworth School Charlene Russell Sellwood Middle School

Thirty Years (con’t.) Susanna Sabah-Klee Beach School Julie Smith Special Education Gary Snarr Special Education, Cleveland High School Kimberly Strange Student Transportation Lorie Taylor Wilcox School Kevin Test Facilities Services, Mt. Tabor Eli Triplett Facilities Services Mitchell Whitehurst Faubion School Mae Won Wilcox School
Twenty-Five Years Kimberly Abel Maplewood School Scott Aker Wilson High School Maria Aldaz Ainsworth School Leslie Anderson Nutrition Services, Cleveland High School Mary Anderson Facilities Services Center, Tubman Melissa Appollo Abernethy School Carol Arneson Metro Learning Center Kelli Barrett Gray Middle School Tara Barton Special Education Pamela Britt Grants & Compliance, Chapman School Steven Buckmaster Franklin High School Kathleen Cameron Nutrition Services Scott Cameron Jackson Middle School Clara Cook Franklin High School Shannon Cooper-Campagna Special Education, Harrison Park School Ann Davis Markham School Michael Duchow-Pressley Wilson High School Rhonda Duran Headstart, Creston Annex Sheila Dygert Franklin High School Leonard Edwards, Jr. Jefferson High School Mary Lynn Gardner Peninsula School Mary Gay Special Education, Jackson Middle School Teri Geist Beverly Cleary School Suzanne Germaneri-Clarkson Astor School William Green Benson High School Pamela Gwynn Creston School Charles Hardy Vestal School Martha Heller Hayhurst School Joellen Holmes Duniway School Rose Hurner Arleta School Doug Ingamells da Vinci Arts Middle School Kim Johnston Sabin School Sherri Jorgensen Ainsworth School Richard Kolinsky Lincoln High School Kurt Krohn Roseway Heights School Christine Lentz Special Education Patricia Linck Marysville School Kathy Lloyd Benson High School Annette McLaughlin Student Transportation
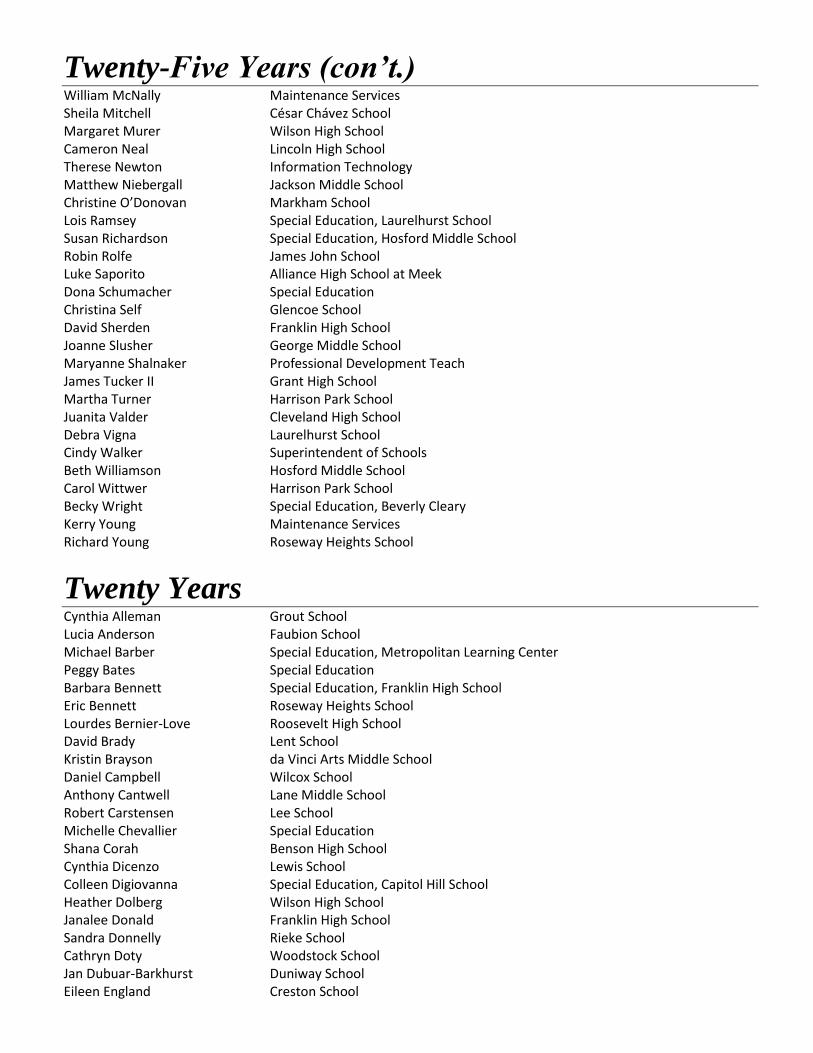
Twenty-Five Years (con’t.) William McNally Maintenance Services Sheila Mitchell César Chávez School Margaret Murer Wilson High School Cameron Neal Lincoln High School Therese Newton Information Technology Matthew Niebergall Jackson Middle School Christine O’Donovan Markham School Lois Ramsey Special Education, Laurelhurst School Susan Richardson Special Education, Hosford Middle School Robin Rolfe James John School Luke Saporito Alliance High School at Meek Dona Schumacher Special Education Christina Self Glencoe School David Sherden Franklin High School Joanne Slusher George Middle School Maryanne Shalnaker Professional Development Teach James Tucker II Grant High School Martha Turner Harrison Park School Juanita Valder Cleveland High School Debra Vigna Laurelhurst School Cindy Walker Superintendent of Schools Beth Williamson Hosford Middle School Carol Wittwer Harrison Park School Becky Wright Special Education, Beverly Cleary Kerry Young Maintenance Services Richard Young Roseway Heights School
Twenty Years Cynthia Alleman Grout School Lucia Anderson Faubion School Michael Barber Special Education, Metropolitan Learning Center Peggy Bates Special Education Barbara Bennett Special Education, Franklin High School Eric Bennett Roseway Heights School Lourdes Bernier-Love Roosevelt High School David Brady Lent School Kristin Brayson da Vinci Arts Middle School Daniel Campbell Wilcox School Anthony Cantwell Lane Middle School Robert Carstensen Lee School Michelle Chevallier Special Education Shana Corah Benson High School Cynthia Dicenzo Lewis School Colleen Digiovanna Special Education, Capitol Hill School Heather Dolberg Wilson High School Janalee Donald Franklin High School Sandra Donnelly Rieke School Cathryn Doty Woodstock School Jan Dubuar-Barkhurst Duniway School Eileen England Creston School

Twenty Years (con’t.) Marcia Esther Glencoe School Ann Fournier da Vinci Arts Middle School Angela Gadbois Astor School John Glover Wilcox School Howard Goldstein West Sylvan Middle School Bonnie Gordon Capitol Hill School Todd Graham Stephenson School William Griffin Grant High School Linda Gundolff Special Education, Bridlemile School Scott Guthrie Wilson High School Jane Hanson Vestal School Anita Hartling Wilcox School Melinda Hawley Professional Development Teach Thea Hayes Lent School Patricia Heard-Hobson Grant High School Marion Heins Woodmere School Kathryn Hook Wilcox School Nancy Husbands Capitol Hill School Joyce Iliff Woodstock School Rose Jensen Woodmere School Jeffrey Johnson Creston School Anne Keebaugh Markham School Natalya Khvilivitzky Cleveland High School Daniel Kropp James John School Elizabeth Lannigan Abernethy School Rita Leonard Special Education, Lee School Deborah Levinson Wilcox School David Lickey Grant High School Penny Machado Laurelhurst School Rebekah Martin Special Education, Arleta School Thomas McCarthy Franklin High School Karen McEwan Woodmere School Patrick McGrady Beach School Stacy Mercer Special Education, Gray Middle School Mia Meyer Sunnyside Environmental School Patricia Miksa Special Education Jennifer Miller Research, Evaluation, Assessment Joyce Moore Pioneer – Holladay Annex Ruthann Moore Astor School Carolyn Morris Beverly Cleary School Mary Morris da Vinci Arts Middle School Rhonda Morris West Sylvan Middle School Kevin Muir Lent School Zsuzsa Nemeth Hosford Middle School Margaret Nesbitt Special Education, Franklin High School Sally Niedermeyer Benson High School Lisa O’Brien Beverly Cleary School Steven O’Neill Wilson High School Mary Patterson Woodstock School Julie Plato Stephenson School Alexander Quan Cleveland High School
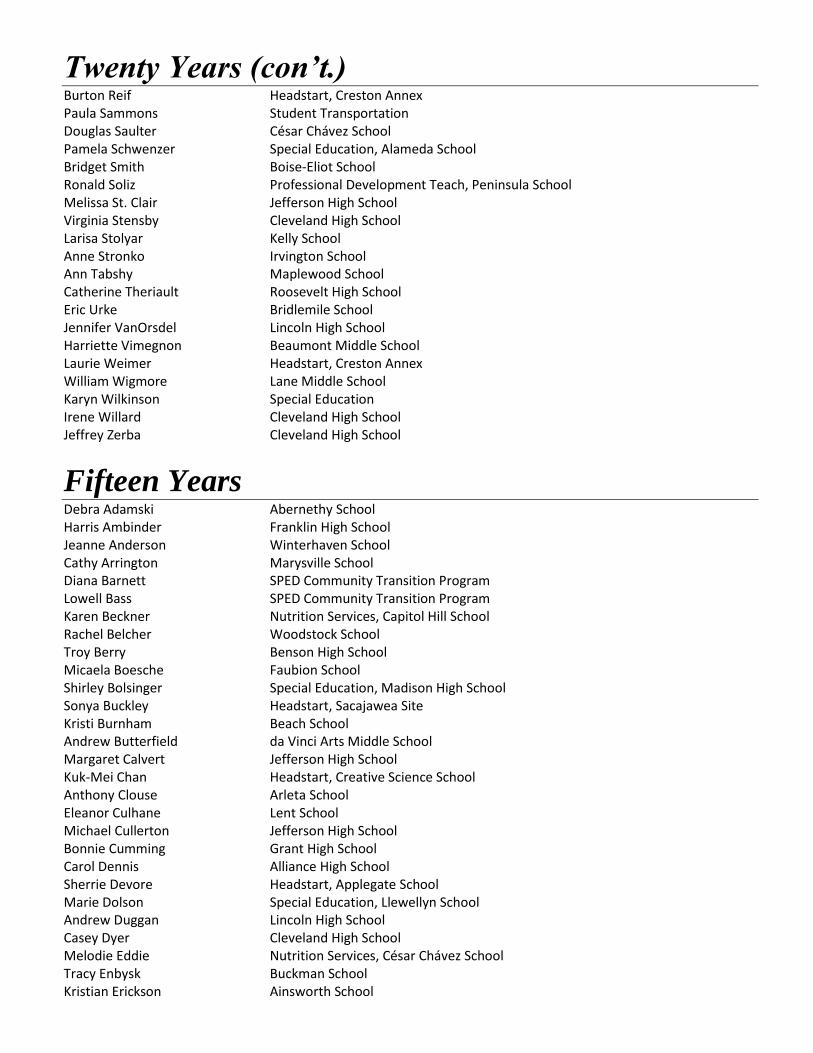
Twenty Years (con’t.) Burton Reif Headstart, Creston Annex Paula Sammons Student Transportation Douglas Saulter César Chávez School Pamela Schwenzer Special Education, Alameda School Bridget Smith Boise-Eliot School Ronald Soliz Professional Development Teach, Peninsula School Melissa St. Clair Jefferson High School Virginia Stensby Cleveland High School Larisa Stolyar Kelly School Anne Stronko Irvington School Ann Tabshy Maplewood School Catherine Theriault Roosevelt High School Eric Urke Bridlemile School Jennifer VanOrsdel Lincoln High School Harriette Vimegnon Beaumont Middle School Laurie Weimer Headstart, Creston Annex William Wigmore Lane Middle School Karyn Wilkinson Special Education Irene Willard Cleveland High School Jeffrey Zerba Cleveland High School
Fifteen Years Debra Adamski Abernethy School Harris Ambinder Franklin High School Jeanne Anderson Winterhaven School Cathy Arrington Marysville School Diana Barnett SPED Community Transition Program Lowell Bass SPED Community Transition Program Karen Beckner Nutrition Services, Capitol Hill School Rachel Belcher Woodstock School Troy Berry Benson High School Micaela Boesche Faubion School Shirley Bolsinger Special Education, Madison High School Sonya Buckley Headstart, Sacajawea Site Kristi Burnham Beach School Andrew Butterfield da Vinci Arts Middle School Margaret Calvert Jefferson High School Kuk-Mei Chan Headstart, Creative Science School Anthony Clouse Arleta School Eleanor Culhane Lent School Michael Cullerton Jefferson High School Bonnie Cumming Grant High School Carol Dennis Alliance High School Sherrie Devore Headstart, Applegate School Marie Dolson Special Education, Llewellyn School Andrew Duggan Lincoln High School Casey Dyer Cleveland High School Melodie Eddie Nutrition Services, César Chávez School Tracy Enbysk Buckman School Kristian Erickson Ainsworth School
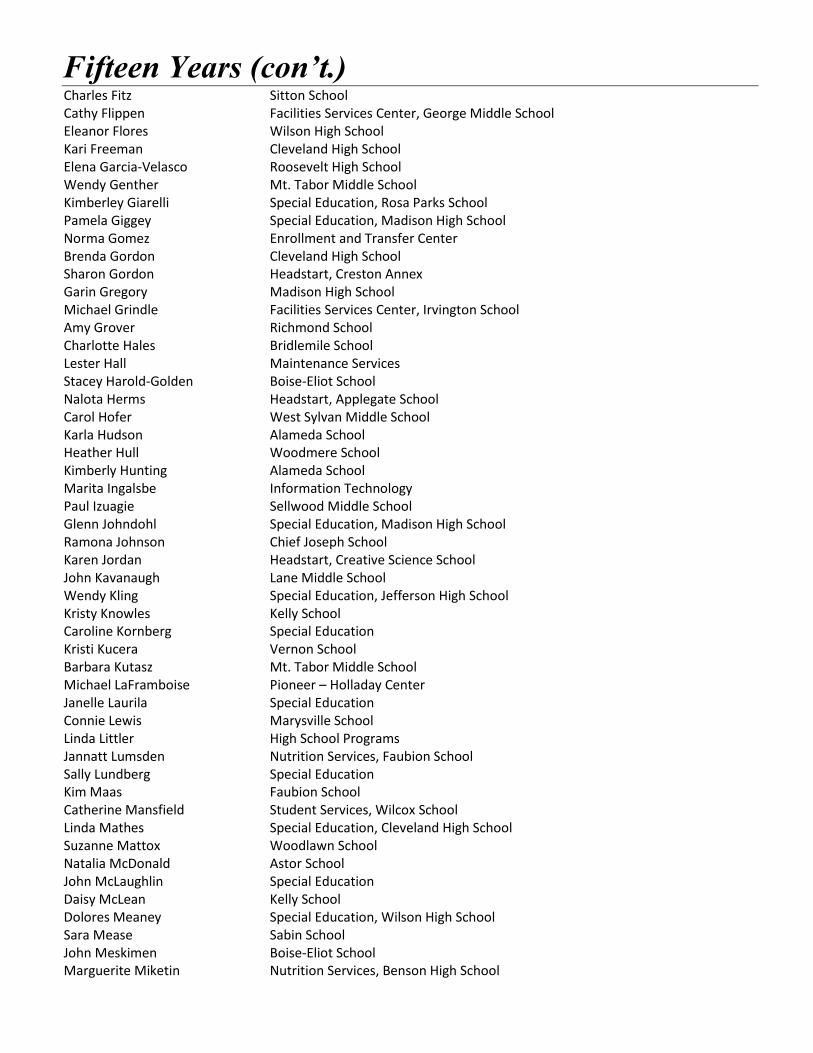
Fifteen Years (con’t.) Charles Fitz Sitton School Cathy Flippen Facilities Services Center, George Middle School Eleanor Flores Wilson High School Kari Freeman Cleveland High School Elena Garcia-Velasco Roosevelt High School Wendy Genther Mt. Tabor Middle School Kimberley Giarelli Special Education, Rosa Parks School Pamela Giggey Special Education, Madison High School Norma Gomez Enrollment and Transfer Center Brenda Gordon Cleveland High School Sharon Gordon Headstart, Creston Annex Garin Gregory Madison High School Michael Grindle Facilities Services Center, Irvington School Amy Grover Richmond School Charlotte Hales Bridlemile School Lester Hall Maintenance Services Stacey Harold-Golden Boise-Eliot School Nalota Herms Headstart, Applegate School Carol Hofer West Sylvan Middle School Karla Hudson Alameda School Heather Hull Woodmere School Kimberly Hunting Alameda School Marita Ingalsbe Information Technology Paul Izuagie Sellwood Middle School Glenn Johndohl Special Education, Madison High School Ramona Johnson Chief Joseph School Karen Jordan Headstart, Creative Science School John Kavanaugh Lane Middle School Wendy Kling Special Education, Jefferson High School Kristy Knowles Kelly School Caroline Kornberg Special Education Kristi Kucera Vernon School Barbara Kutasz Mt. Tabor Middle School Michael LaFramboise Pioneer – Holladay Center Janelle Laurila Special Education Connie Lewis Marysville School Linda Littler High School Programs Jannatt Lumsden Nutrition Services, Faubion School Sally Lundberg Special Education Kim Maas Faubion School Catherine Mansfield Student Services, Wilcox School Linda Mathes Special Education, Cleveland High School Suzanne Mattox Woodlawn School Natalia McDonald Astor School John McLaughlin Special Education Daisy McLean Kelly School Dolores Meaney Special Education, Wilson High School Sara Mease Sabin School John Meskimen Boise-Eliot School Marguerite Miketin Nutrition Services, Benson High School

Fifteen Years (con’t.) Merrie Miller Special Education, Kelly School Dunya Minoo Equity & Partnerships, Tubman School Lisa Morrell Portland DART Schools, White Shield Home Dawn Mower Harrison Park School Diane Namba-Welsick Alliance High School Susan Nelson Beverly Cleary School Phu Nguyen Vestal School Maria Peterson Roosevelt High School Brian Quinn West Sylvan Middle School Chris Retherford Vernon School James Rodriguez Special Education, Boise-Eliot Gregory Ross District Athletics Laurie Ross Markham School Marian Sanders Facility Services Center, Creative Science School Maria Santana Cleveland High School Anne Schagen Special Education Stephanie Schiavo Special Education Diana Schneider-Barne Special Education Rasheedah Shabazz Nutrition Services, Roosevelt High School Wendy Shelton Jefferson High School German Shteyman Student Transportation Daniel Siprian Sabin School Andrea Snowadski Beaumont Middle School James Sours Franklin High School Shannon Stember Nutrition Services Lynn Stratham Gray Middle School Mary Straub Roseway Heights School Brooke Tuggle Scott School Kim Vorasai Harrison Park School Teresa Walworth Vernon School Susan Webb James John School Laurie Whiteman Special Education, Benson High School Marilynn Wieneke Wilson High School Susan Wilcox Alameda School Jane Williams Professional Development Teach, Woodmere School Arthur Williams, Jr. Special Education, Beaumont Middle School Cassandra Wilson Laurelhurst School Marsha Wolfe Rosa Parks School Deborah Wright Ainsworth School Jean Wyman George Middle School
Ten Years Cheryl Allbaugh Bridger School Amanda Alonso Madison High School Ricardo Alonso, Jr. Lincoln High School Bernice Arditi Faubion School James Avison Winterhaven School Julie Barnes Special Education Jennifer Barzee Special Education, Metropolitan Learning Center Michael Bauer Special Education, Roosevelt High School

Ten Years (con’t.) Kerry Bayne da Vinci Arts Middle School Lorna Beckley Special Education, Peninsula School Loretta Benjamin Samuels Human Resources Candice Bielman Abernethy School Jason Breaker Mt. Tabor Middle School Beth Brod Special Education, Harrison Park School Barbara Brown Lincoln High School Richard Brown Grant High School Tina Bruce Vernon School Scott Burns Cleveland High School Jeanette Campbell Wilcox School Allyson Casey Sitton School Christine Caton Alameda School Lucila Cervantes-Campbell Scott School Noah Chadd Madison High School Marjorie Chambers Franklin High School Vicky Chantry Creston School Gaye Chapman Cleveland High School Jenna Conklin Beverly Cleary School Amy Craig-McFarland Portland DART Schools, Parry Center Larry Dashiell Elementary Programs Michael Delf Special Education, Chapman School Miriam Diaz SPED Community Transition Program Karen Dischner Special Education, Capitol Hill School Jennifer Edelson Madison High School Ann Eldredge-Burns Alameda School Sarah Epstein Roosevelt High School Kim Erickson Atkinson School Rebecca Erickson Astor School Charles Fall Hosford Middle School John Ferraro Jackson Middle School Daniel Fredgant Madison High School Yolanda Gallegos-Cortes Boise-Eliot School Maria Gilson Atkinson School Sharon Grigsby Nutrition Services, Chief Joseph School Mary Hanel Franklin High School Denise Hartvedt Nutrition Services, Arleta School Jay Hatcher Maintenance Services Maria Herrera Headstart, James John School Jason Hieggelke da Vinci Arts Middle School Amber Hilbourne Creston School Suzanne Hiscox Research, Evaluation, Assessment Jason Hoerauf Special Education, Madison High School Jessica Hollyfield-Melz West Sylvan Middle School Barbara Hopp Creative Science School Michelle Irons Harrison Park School Marja Johnson Headstart, Creston Annex Julie Jorgensen Pioneer – Holladay Center Chelyn Joseph Special Education Michelle Kenney Madison High School Rebecca Kimple Pioneer – Holladay Center

Ten Years (con’t.) Shelly Kimpton Laurelhurst School Michael King SPED Community Transition Program Amy Kingsbury Pioneer – Holladay Center Leah Kirschner Grant High School Seth Kreiss Information Technology Ariel Lavandera Interpretation & Translation, Tubman School Charlene Letson Glencoe School Christopher Lewis Grant High School Ali Maileh Scott School Pamela Maloney Special Education Kiya Masunaga Alameda School Anne May Special Education Robert Mecalis, Jr. Winterhaven School Richard Melling Chapman School Kim Meyrick Pioneer – Holladay Annex Jorge Meza César Chávez School Karen Miller Sunnyside Environmental School Elizabeth Minch Alameda School Susan Minich Nutrition Services, Gray Middle School Patrick Murphy Pioneer – Holladay Annex Catherine Murray Marysville School Christopher Naze Capitol Hill School Demetra Ned Nutrition Services, King School Elaine Nussbaum Special Education, Wilson High School Susan Ouderkirk Special Education, Cleveland High School Kristan Parman Professional Development Teach, George Middle School Shelley Penny Hayhurst School Barbara Petrie Special Education, Alameda School Susan Pfohman Benson High School Leslie Phillips Nutrition Services, Woodmere School Shyla Piper Irvington School Cynthia Plank Beaumont Middle School Cori Plinski Instructional Resource Center Nadejda Plotnikova Nutrition Services, Whitman School Charity Powell Special Education, Laurelhurst School Candace Price Special Education, Roseway Heights School Beverly Pruitt Richmond School Brian Prusynski Wilcox School Rachel Ray Special Education Leticia Reyes Headstart, Sacajawea Site Michelle Riddell Human Resources Nora Robertson ESL Irene Robles Grants & Compliance Judith Roumpf Laurelhurst School Justin Ryland Special Education, Faubion School Brian Sahler Wilson High School Mathew Sancomb Arleta School Dalia Sandino Cruz Jefferson High School Angela Schar Becker Special Education Elizabeth Schmidtke Special Education, Roosevelt High School Vangie Shaw Sabin School
Ten Years (con’t.) Laval Short Pioneer –Holladay Annex Shana Spiekerman Nutrition Services, Madison High School Megan Stephens Special Education Susan Stone Integrated Curriculum Development Brandi Streeter George Middle School Christine Sugura Bridlemile School Gabrielle Sussman Portland DART Schools, White Shield Home Amy Sutton Lee School Jacqueline Sutton SPED Community Transition Program Ivan Tarnowski SPED Community Transition Program Raymond Tate Grant High School Aunice Taylor Nutrition Services, Scott School Rakhilya Tee Nutrition Services, Mt. Tabor Middle School Keri Troehler Roosevelt High School Bi Tsoi Headstart, Creston Annex JoAnn Wadkins Lincoln High School Melody Weaver Special Education, King School Lynn Wendt Information Technology Trudy Whittle Nutrition Services, James John School Amanda Yampolsky Bridger School Gerald Young Grant High School
Five Years Tina Acker Vernon School Melodie Adams King School Melanie Allan Pioneer – Holladay Center Ricky Allen Jefferson High School Travis Allison Procurement & Distribution Services Ariana Altieri Roosevelt High School Francisca Alvarez Scott School Isabel Alvarez-Jubiel Woodlawn School Kimberly Anderson Cleveland High School Louise Anderson Woodmere School Kelly Andrews Franklin High School Amanda Ansell Hosford Middle School John Appleton Student Transportation Kevin Bacon Hosford Middle School Todd Bales Information Technology Veronica Banuelos Office of Schools Aaron Barnes Lincoln High School Michael Bauerlein Special Education, Woodlawn School Todd Beatty Maintenance Services Robert Becker King School Antony Bertrand Professional Development Teach, Kelly School Matthew Bertson Student Transportation Bella Bishop Bridger School Kimberly Bishop Facility Services Center, Grout School Alyssa Blum Special Education, Cleveland High School Jeralene Boettcher Special Education, Capitol Hill School Devon Bolt Information Technology
Five Years (con’t.) Matthew Bowman Cleveland High School Theresa Brady Student Transportation Jamie Brown Buckman School Kristie Buckowski Alameda School Trevor Butenhoff Franklin High School Margaret Byrkit Lee School Ian Camp Lent School Roger Campbell Warehousing Michael Cantino Wilcox School Jeandre Carbone Benson High School Allen Carpenter FAM Management Max Cartagena Creston School Jennifer Caslavka Wilcox School Lisa Cavallo Pioneer – Holladay Center Nicole Chaplin Special Education, Abernethy School Gerald Choate Chapman School Bryan Chu Lane Middle School Dezire Clarke ACCESS Program Brian Clinton Facility Services Center, Ockley Green School Kyle Cooke Arleta School Pin Pin Coppedge Nutrition Services, Lent School Robb Cowie Community Involvement and Public Affairs Stephanie Cranley Llewellyn School Karanja Crews Vernon School Joseph Dagostino Special Education, Lent School Jacqueline Daly Student Transportation Sheri Davis Special Education Lindsay Deacon Harrison Park School Harriet Deary Accounting Services Erin Dec Woodmere School Seth Denlinger Richmond School Martha Diaz Kelly School Marietta Dickey Headstart, Applegate School Jon Dickman Special Education, Vestal School Maggie Dixon Laurelhurst School Lonny Doi Procurement and Distribution Services Marquis Domingue Roosevelt High School Jeanette Drury Nutrition Services, Markham School James Dunlap Maintenance Services Joseph Duran Cleveland High School Trinity Dutton Nutrition Services, Atkinson School Shelley Ellsworth Special Education, Woodmere School Lynette Engstrom Instructional Resource Center Brian Erbach Woodstock School Jennifer Estevez Special Education, Capitol Hill School Meghan Ewing Sellwood Middle School Emily Ferguson Winterhaven School Virginia Ferrer-Burgett Special Education, Rieke School Eddie Fisher Facility Services Center, Atkinson School Hannah Flinn Lee School Stacey Foiles Special Education, Sitton School

Five Years (con’t.) Maia Foley-Weintraub Rieke School Fred Fox Lincoln High School David Frankunas Grout School John Freimark Facility Services Center, Cleveland High School Rachael Frey Facility Services Center, Roosevelt High School Anthony Fronk Special Education, Capitol Hill School Emily Gaffney Lincoln High School Fabiola Garcie Lent School Elizabeth Gardner Forest Park School Craig Gibson West Sylvan Middle School Tracy Giordano-Buckley Lewis School Hallie Gleason Roosevelt High School Matthew Goldstein Richmond School Dianne Gollhofer Special Education Mikayla Goodrich Information Technology Lisa Goyne Special Education Brittany Grahn Lee School Emily Grant-Molina West Sylvan Middle School Melanie Grasle Benson High School Gina Gray Arleta School Rebecca Gregor Peninsula School Cholla Grigsby Nutrition Services, Sitton School Verenice Gutierrez Scott School Karen Swaltney Scott School David Hakam Hosford Middle School Rachel Hanes Glencoe School Jenni Hansen Nutrition Services, Sabin School Rashelle Harding Headstart, Applegate School Crystal Harkleroad Pioneer – Holladay Center Anne Harper Richmond School Todd Haywood Special Education, Peninsula School Deborah Heggem Sabin School Rachel Hermansen SPEC Community Transition Program Paul Hippe Special Education, Sunnyside Environmental School Angela Hoffart Chapman School Gretchen Hollands Property Management Lashell Holton Special Education, Markham School Chad Honl Vestal School Pamela Huaripata Grants and Compliance Mary Huck Arleta School Donald Huld FAM Management Julie Hunt Madison High School Amy Jackson Special Education, Woodlawn School Caleb Jackson Benson High School Abdiwahid Jamac Office of Schools Sarah Jamesbarry Lewis School Alicia Johnson Special Education, Jackson Middle School Daniel Johnson Beach School Leah Johnson Ainsworth School Craig Johnston Grant High School Kevin Jones Special Education, Capitol Hill School

Five Years (con’t.) Tammy Jones Alliance High School Lisa Kallmeyer Pioneer – Holladay Center Carol Kennedy Wilcox School Ann Klein Special Education, James John School Amy Kleiner Sunnyside Environmental School Berit Kuchs Wilcox School Megan Kurkinen Ainsworth School Marianne Laird Special Education, Ainsworth School Abby Largo Alameda School Chrysanthius Lathan Boise-Eliot School Nancy Lea Student Transportation Nora Lehnhoff Roosevelt High School Diane Lewis Special Education Silvia Lewis Bridger School Rui Liang Headstart, Creative Science School Kristie Lindholm Rigler School Jessalyn Lively Instructional Resource Center Barbara Lopez Tubman School Mary Loughney Rieke School Chrysann Lowe Special Education, Beverly Cleary School Alexandra Luria Sabin School William Lynch Lincoln High School Stephanie Macdonald Beach School Michelle Mackey Nutrition Services, Harrison Park School Marla MacNeill Rigler School Barbra Mark Nutrition Services, Bridlemile School Kevin Marquardt Hosford Middle School Jennifer Martin Facility Services Center, Jefferson High School Mike Mattson Capitol Hill School Geri Matyiko Pioneer – Holladay Center Judith McClain Wilcox School Rebecca McCullough Nutrition Services, James John School Janice McDow Facility Services Center, Gray Middle School Kristy McFarland Special Education Kelli McGuire Facility Services Center Darci McKibben Lent School Nancy McLean Alameda School Michael McLeron Lent School Shawn McMahon Special Education, Benson High School Carl McSwain Facility Services Center, Cleveland High School Rian Meguire Jefferson High School Abby Menashe Wilson High School Benson Meyers Risk Management Kelly Milford Wilson High School Andrew Miller Special Education, Lent School Elena Miller Special Education, Chapman School Sue Miller Special Education, Wilson High School Marlys Mock Property Management Catherine Moore Grants and Compliance Kathryn Moore Franklin High School
Five Years (con’t.) Yolanda Morales César Chávez School Jeanne Morgan Accounting Services Jennifer Morgan Woodstock School David Morley Markham School Robert Moxley Marysville School Stacey Moy Capitol Hill School Hana Mulah Facility Services Center, Lent School Bridget Mullaney Special Education, Sabin School Tonya Myers Ainsworth School Lisa Neeley Creative Science School May Nelson Special Education Jovan Nieto Special Education, Hosford Middle School Margo O’Connell Special Education, Harrison Park School Katherine O’Hanlon Pioneer – Holladay Center Katrina O’Hearn Special Education, Lent School Kevin Okerlund Special Education, Beaumont Middle School Thomas Onderko Maintenance Services Michelle Orr Cleveland High School Eugene Osborn Maintenance Services Melissa Osborn Special Education, Beaumont Middle School Lauren Page Special Education Teri Parente Abernethy School Danielle Parks Lincoln High School Michiko Parshalle Richmond School Mary Patterson Special Education Kristine Pearson-Denning Sunnyside Environmental School Andrea Pepitone Buckman School Jennifer Pettit Special Education, Chief Joseph School Baret Pinyoun Elementary Programs Cheryl Pitman Information Technology Cathryn Pitt Nutrition Services Emily Pixley Alameda School Michael Plein Rieke School Sue Poff Special Education, Jackson Middle School Dmitry Polishchuk Warehousing Brian Post Special Education, Lewis School Anastacia Postema Rosa Parks School Carmela Pulido Grants and Compliance Suzanne Ramirez Special Education Jonnetta Randolph Student Transportation Susan Reavis Special Education Isabel Recht César Chávez School Mirabai Reimuller Elementary Programs Ruthie Richard Rosa Parks School Elizabeth Robbins Kelly School Stori Robertson Creston School Aaron Roddis Glencoe School Christopher Roe Accounting Services Keri Rose Cleveland High School Sarah Rosman Sunnyside Environmental School Roxanne Ross Nutrition Services, Boise-Eliot School

Five Years (con’t.) Diana Rowey Cleveland High School Kari Ryckebosch Laurelhurst School Mark Sandilands Winterhaven School Merritt Sansom Franklin High School Stephanie Savage Rieke School Jennifer Schafrath Sitton School Dawn Schlegel Alliance High School Jayson Schmidt Wilson High School Jerod Schmidt Lincoln High School Rosemarie Schroeder Maintenance Services Carlin Schwinghamer Special Education Angela Scotto Harrison Park School David Seifert Special Education Anne Simpson Special Education Crystal Simpson Woodlawn School Claire Skelly Special Education Lauren Skye Roseway Heights School Jeremy Sloan Special Education, Beverly Cleary School Amanda Smith Beverly Cleary School Bryan L. Smith Cleveland High School Candice Snell Risk Management Christopher SnyderBrown Metropolitan Learning Center Carrie Sorric Beach School Howard Spengler Jefferson High School Rachell Spink Rieke School Melissa Standley Woodmere School Anita Stark West Sylvan Middle School Amanda Stelter Llewellyn School Lupe Stone Nutrition Services Jill Storie Maplewood School Kelli Stubbs Human Resources Louis Terrones Special Education, George Middle School Margaret Tims Stephenson School Anna Tofel Llewellyn School Eric Tong Lent School Melissa Toren Hrin Lee School Tristan Trotter Special Education Roslyn Tucker Special Education Patricia Tundidor Special Education, Markham School Danielle Turley Kelly School Jerry Turney Maintenance Services Patricia Vo Special Education, Peninsula School Linda von Werssowetz Madison High School Lauren Wahl-Stephens Creative Science School Galen Waldrep Human Resources Derrell Walker King School Rita Walker Nutrition Services, Youngson School Susanna Walker Chief Joseph School John Walrod Special Education, Metropolitan Learning Center Julianne Walrod Special Education, Metropolitan Learning Center Bradley Waters Reike School

Five Years (con’t.) Lily Watkins Lent School Melissa Watson Instructional Resource Center Lurena Weesner Special Education, Cleveland High School Melissa Wenger Richmond School Tara West Sunnyside Environmental School Christen Wheeler Vestal School William White Facility Services Center, Harrison Park School Ida Wiley Headstart, Sitton School Reiko Williams Office of Schools Anne Williamson Grant High School Courtney Wilson Special Education, César Chávez School Daniel Wilson Pioneer – Holladay Center Desiree Wolff-Myren Special Education, Franklin High School Andrea Woodward Bridlemile School Wade Worthington Student Transportation Emily Wright Jefferson High School Keith Wright Student Transportation Nancy Yates Special Education Nicholas Yoder Marysville School
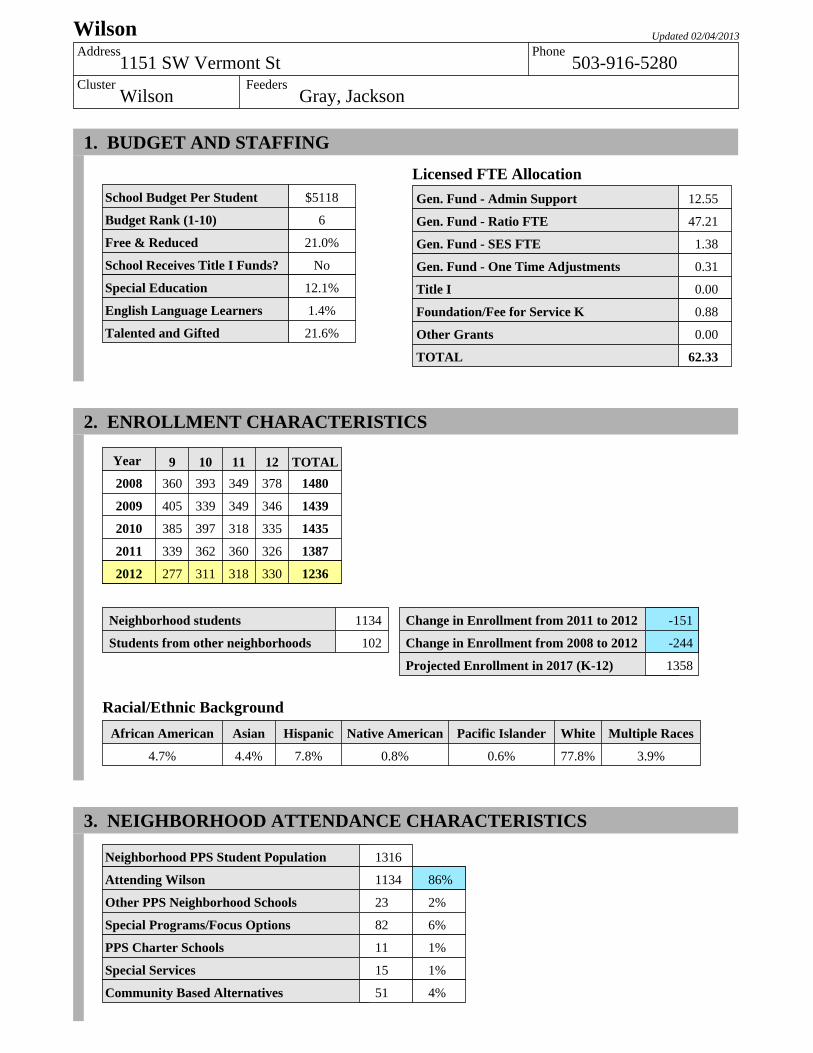
Wilson Updated 02/04/2013Address Phone
1151 SW Vermont St 503-916-5280Cluster Feeders
Wilson Gray, Jackson
1. BUDGET AND STAFFING
School Budget Per Student
Budget Rank (1-10)
Free & Reduced
School Receives Title I Funds?
Special Education
English Language Learners
Talented and Gifted
$5118
6
21.0%
No
12.1%
1.4%
21.6%
Licensed FTE AllocationGen. Fund - Admin Support
Gen. Fund - Ratio FTE
Gen. Fund - SES FTE
Gen. Fund - One Time Adjustments
Title I
Foundation/Fee for Service K
Other Grants
TOTAL
12.55
47.21
1.38
0.31
0.00
0.88
0.00
62.33
2. ENROLLMENT CHARACTERISTICS
Year 9 10 11 12 TOTAL2008 360 393 349 378 1480
2009 405 339 349 346 1439
2010 385 397 318 335 1435
2011 339 362 360 326 1387
2012 277 311 318 330 1236
Change in Enrollment from 2011 to 2012
Change in Enrollment from 2008 to 2012
Projected Enrollment in 2017 (K-12)
-151
-244
1358
Neighborhood students
Students from other neighborhoods
1134
102
Racial/Ethnic BackgroundAfrican American Asian Hispanic Native American Pacific Islander White Multiple Races
4.7% 4.4% 7.8% 0.8% 0.6% 77.8% 3.9%
3. NEIGHBORHOOD ATTENDANCE CHARACTERISTICS
Neighborhood PPS Student Population
Attending Wilson
Other PPS Neighborhood Schools
Special Programs/Focus Options
PPS Charter Schools
Special Services
Community Based Alternatives
1316
1134
23
82
11
15
51
86%
2%
6%
1%
1%
4%

Wilson Updated 02/04/2013
4. EDUCATIONAL PROGRAMSAchievement - % Meeting or Exceeding Benchmarks
10th Grade 11th Grade
Year Reading Math Reading Math
2009-2010 85.7% 75.1%
2010-2011 93.6% 83.8%
2011-2012 >95% 81.6%
For detailed achievement information go to: http://www.pps.k12.or.us/depts-c/rne/results/In 2010-11 the percent meeting or exceeding in Math declined at many schools because of a higher threshold for "Meeting"In 2011-12 the percent meeting or exceeding in Reading declined at many schools because of a higher threshold for "Meeting"
5. SCHOOL ENVIRONMENT
2011-2012 SchoolComparableDistrict Average
Highly Qualified Teaching Assignments
Teacher Experience (Average in years)
Substitute Usage (Average in days)
Average Daily Attendance
Average Class Size
Stability Index
Student Expulsions
Student Suspensions
100.0%
15.4
12.0
93.7%
28.0
91.3%
0.6%
5.8%
98.4%
15.3
91.7%
12.8
25.6
87.8%
0.6%
5.9%
October 2012 Enrollment Number of Classrooms
1236 80
Density Index
15
6. ENROLLMENT INDICATORS
Student loss >5% since 2011 AND >15% since 2008? NoNeighborhood students attending Wilson below 55%? NoBuilding density index below 15 or above 20? No
7. COMMENTS/ISSUESWilson has an overall ESEA rating of Level 4 as of October 2012.
PPS Research, Evaluation & Assessment—10/11/2012jws
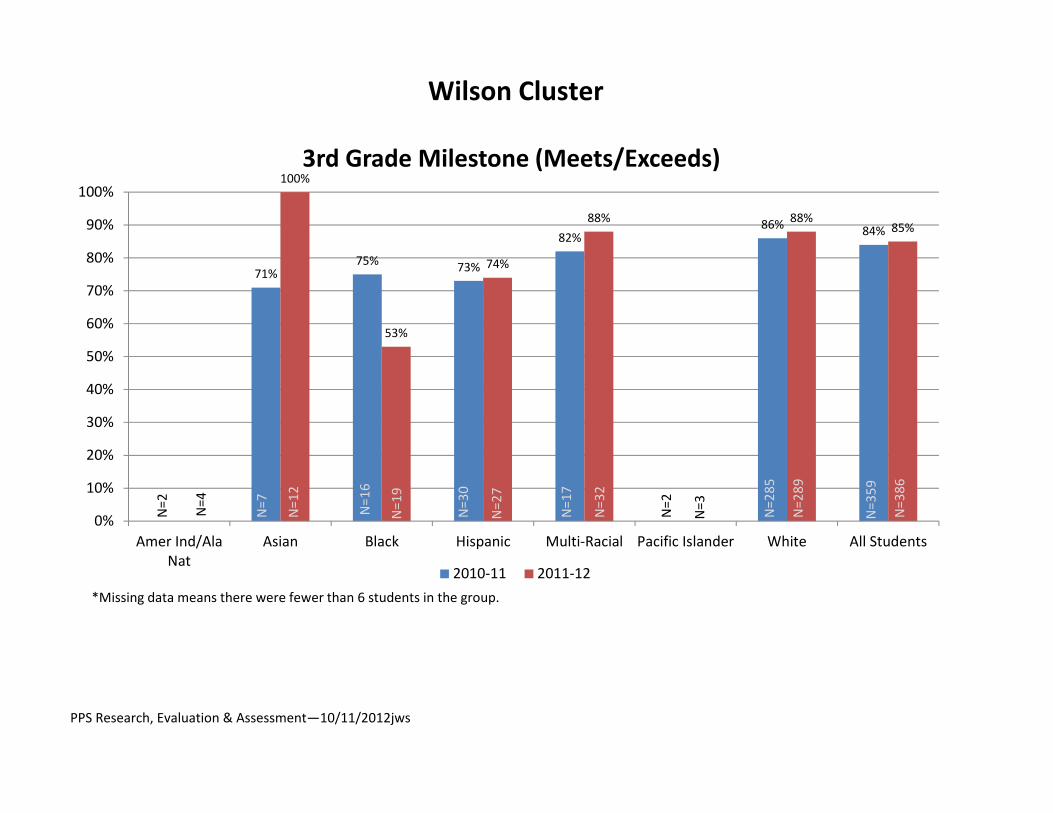
Wilson Cluster
71%75% 73%
82%86% 84%
100%
53%
74%
88% 88%85%
0%
10%
20%
30%
40%
50%
60%
70%
80%
90%
100%
Amer Ind/AlaNat
Asian Black Hispanic Multi‐Racial Pacific Islander White All Students
3rd Grade Milestone (Meets/Exceeds)
2010‐11 2011‐12*Missing data means there were fewer than 6 students in the group.
N=2 N=4
N=7
N=12
N=16
N=19
N=30
N=27
N=17
N=32
N=2
N=3 N=285
N=289
N=359
N=386
PPS Research, Evaluation & Assessment—10/11/2012jws
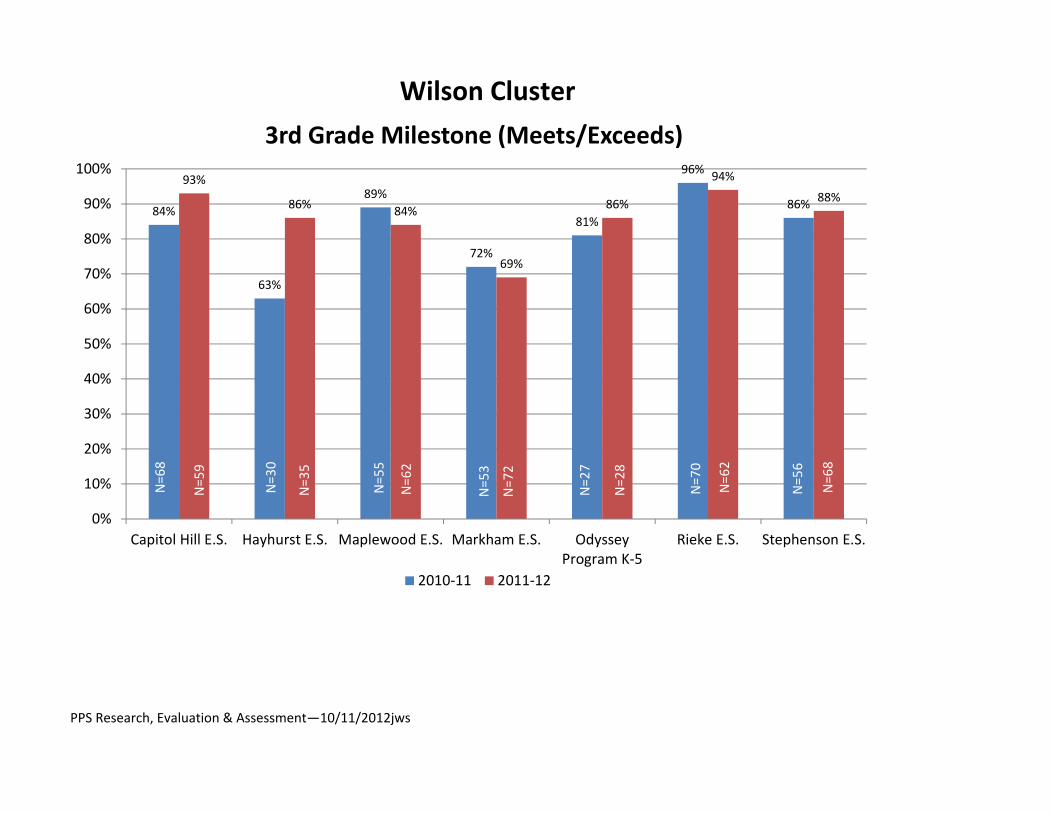
Wilson Cluster
84%
63%
89%
72%
81%
96%
86%
93%
86% 84%
69%
86%
94%
88%
0%
10%
20%
30%
40%
50%
60%
70%
80%
90%
100%
Capitol Hill E.S. Hayhurst E.S. Maplewood E.S. Markham E.S. OdysseyProgram K‐5
Rieke E.S. Stephenson E.S.
3rd Grade Milestone (Meets/Exceeds)
2010‐11 2011‐12
N=68
N=59
N=35
N=30
N=62
N=55
N=53
N=72
N=62
N=70
N=56
N=68
N=28
N=27
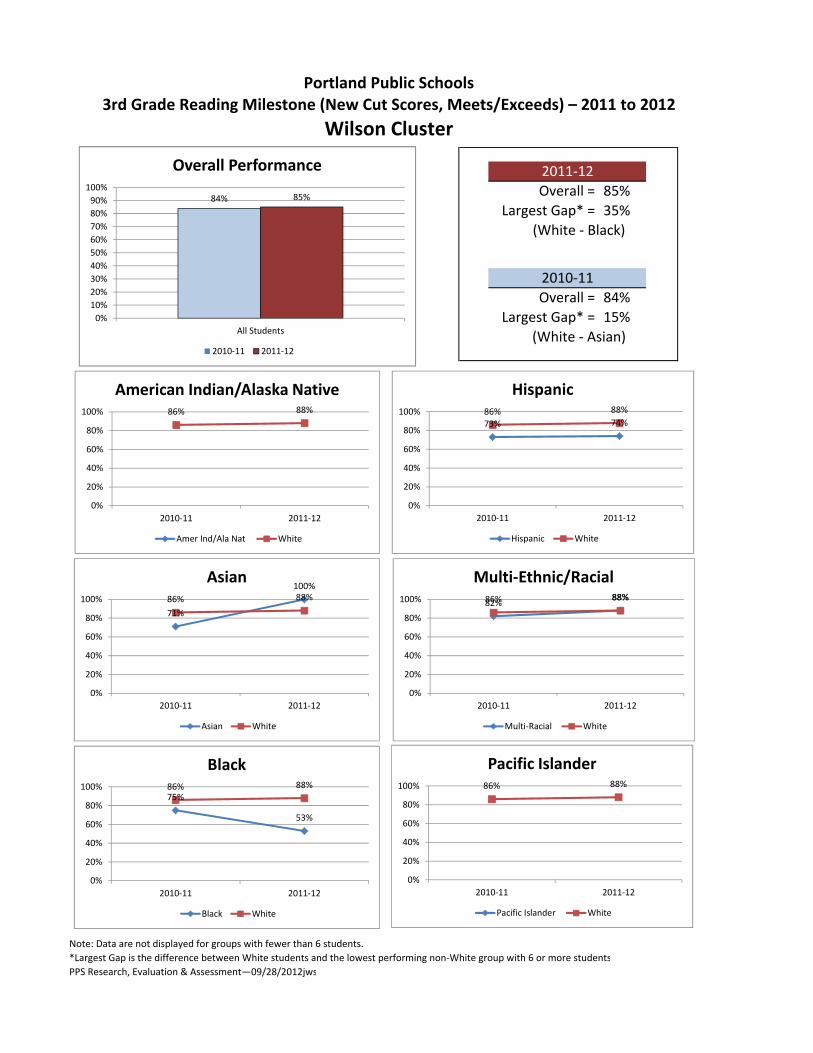
Overall = 85%Largest Gap* = 35%
(White ‐ Black)
Overall = 84%Largest Gap* = 15%
(White ‐ Asian)
Note: Data are not displayed for groups with fewer than 6 students.*Largest Gap is the difference between White students and the lowest performing non‐White group with 6 or more studentsPPS Research, Evaluation & Assessment—09/28/2012jws
2011‐12
2010‐11
Wilson Cluster
Portland Public Schools3rd Grade Reading Milestone (New Cut Scores, Meets/Exceeds) – 2011 to 2012
84% 85%
0%10%20%30%40%50%60%70%80%90%100%
All Students
Overall Performance
2010‐11 2011‐12
86% 88%
0%
20%
40%
60%
80%
100%
2010‐11 2011‐12
American Indian/Alaska Native
Amer Ind/Ala Nat White
71%
100%86% 88%
0%
20%
40%
60%
80%
100%
2010‐11 2011‐12
Asian
Asian White
75%
53%
86% 88%
0%
20%
40%
60%
80%
100%
2010‐11 2011‐12
Black
Black White
73% 74%86% 88%
0%
20%
40%
60%
80%
100%
2010‐11 2011‐12
Hispanic
Hispanic White
82% 88%86% 88%
0%
20%
40%
60%
80%
100%
2010‐11 2011‐12
Multi‐Ethnic/Racial
Multi‐Racial White
86% 88%
0%
20%
40%
60%
80%
100%
2010‐11 2011‐12
Pacific Islander
Pacific Islander White
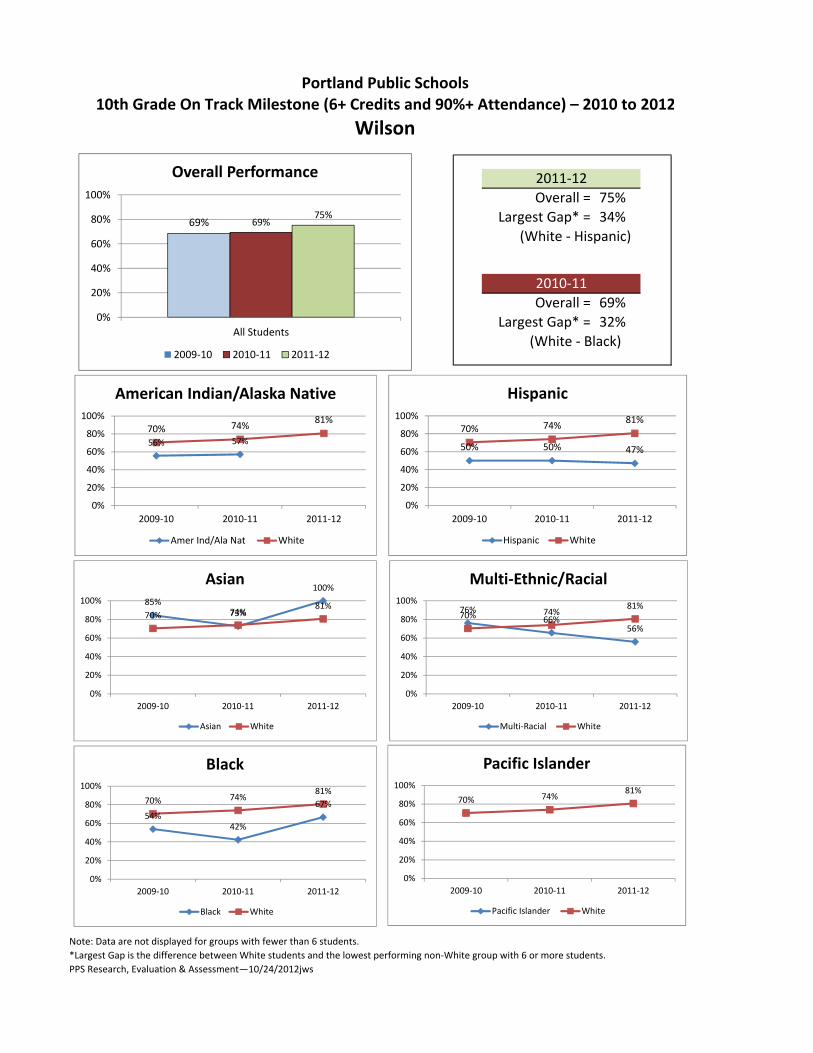
Overall = 75%Largest Gap* = 34%
(White ‐ Hispanic)
Overall = 69%Largest Gap* = 32%
(White ‐ Black)
Note: Data are not displayed for groups with fewer than 6 students. *Largest Gap is the difference between White students and the lowest performing non‐White group with 6 or more students.PPS Research, Evaluation & Assessment—10/24/2012jws
Portland Public Schools10th Grade On Track Milestone (6+ Credits and 90%+ Attendance) – 2010 to 2012
Wilson
2011‐12
2010‐11
69% 69%75%
0%
20%
40%
60%
80%
100%
All Students
Overall Performance
2009‐10 2010‐11 2011‐12
56% 57%70% 74% 81%
0%
20%
40%
60%
80%
100%
2009‐10 2010‐11 2011‐12
American Indian/Alaska Native
Amer Ind/Ala Nat White
85%73%
100%
70% 74%81%
0%
20%
40%
60%
80%
100%
2009‐10 2010‐11 2011‐12
Asian
Asian White
54%42%
67%70% 74%81%
0%
20%
40%
60%
80%
100%
2009‐10 2010‐11 2011‐12
Black
Black White
50% 50% 47%
70% 74% 81%
0%
20%
40%
60%
80%
100%
2009‐10 2010‐11 2011‐12
Hispanic
Hispanic White
76%66%
56%70% 74%
81%
0%
20%
40%
60%
80%
100%
2009‐10 2010‐11 2011‐12
Multi‐Ethnic/Racial
Multi‐Racial White
70% 74%81%
0%
20%
40%
60%
80%
100%
2009‐10 2010‐11 2011‐12
Pacific Islander
Pacific Islander White
PPS Research, Evaluation & Assessment—10/24/2012jws
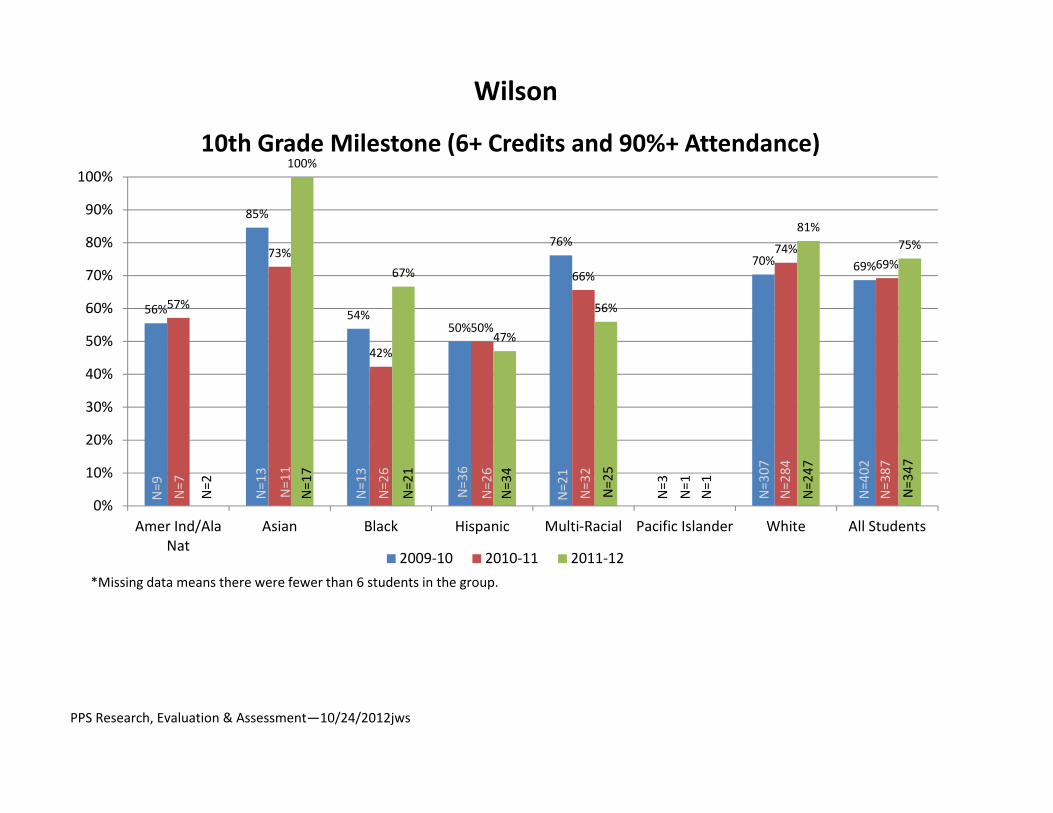
Wilson
56%
85%
54%50%
76%70% 69%
57%
73%
42%
50%
66%
74%69%
100%
67%
47%
56%
81%75%
0%
10%
20%
30%
40%
50%
60%
70%
80%
90%
100%
Amer Ind/AlaNat
Asian Black Hispanic Multi‐Racial Pacific Islander White All Students
10th Grade Milestone (6+ Credits and 90%+ Attendance)
2009‐10 2010‐11 2011‐12*Missing data means there were fewer than 6 students in the group.
N=9 N=7
N=2
N=13
N=11
N=17
N=13
N=26
N=21
N=36
N=26
N=34
N=21
N=32
N=25
N=3
N=1
N=1
N=307
N=284
N=247
N=402
N=387
N=347
Note: Significant data cleanup occurred with the 2010‐11 cohort, which accounts for some of the changes in data for that year.
PPS Research, Evaluation & Assessment—10/02/2012jws
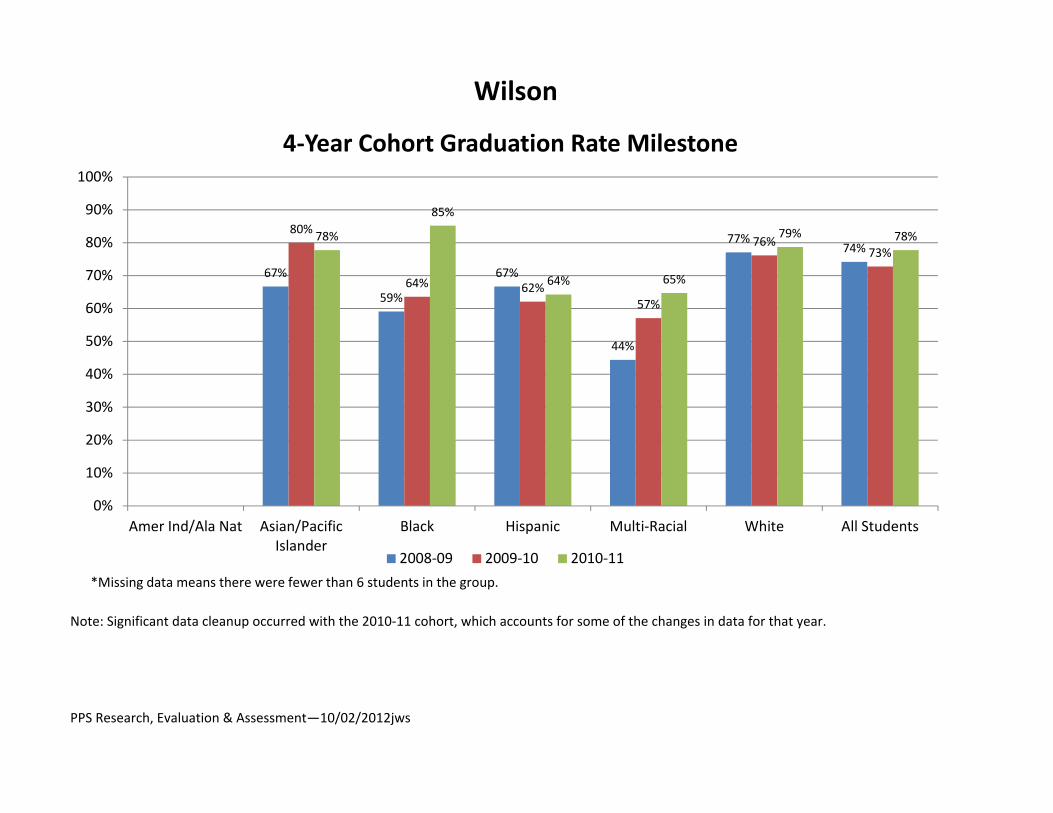
Wilson
67%
59%
67%
44%
77%74%
80%
64% 62%57%
76%73%
78%
85%
64% 65%
79% 78%
0%
10%
20%
30%
40%
50%
60%
70%
80%
90%
100%
Amer Ind/Ala Nat Asian/PacificIslander
Black Hispanic Multi‐Racial White All Students
4‐Year Cohort Graduation Rate Milestone
2008‐09 2009‐10 2010‐11*Missing data means there were fewer than 6 students in the group.
Overall = 78%Largest Gap* = 15%
(White ‐ Hispanic)
Overall = 73%Largest Gap* = 19%(White ‐ Multi‐Racial)
Notes: Data are not displayed for groups with fewer than 6 students. Significant data cleanup occurred with the 2010‐11 cohort, which accountsfor some of the changes in data for that year.*Largest Gap is the difference between White students and the lowest performing non‐White group with 6 or more students.PPS Research, Evaluation & Assessment—10/02/2012jws
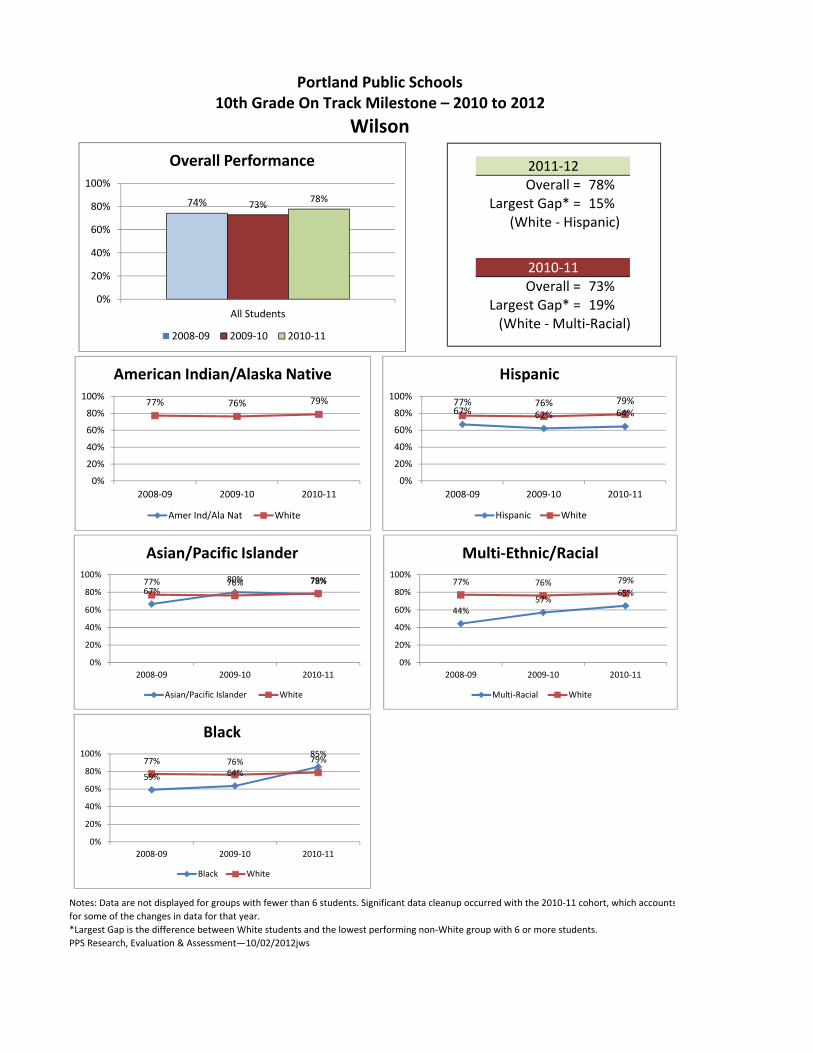
Portland Public Schools10th Grade On Track Milestone – 2010 to 2012
Wilson
2011‐12
2010‐11
74% 73% 78%
0%
20%
40%
60%
80%
100%
All Students
Overall Performance
2008‐09 2009‐10 2010‐11
77% 76% 79%
0%
20%
40%
60%
80%
100%
2008‐09 2009‐10 2010‐11
American Indian/Alaska Native
Amer Ind/Ala Nat White
67%80% 78%77% 76% 79%
0%
20%
40%
60%
80%
100%
2008‐09 2009‐10 2010‐11
Asian/Pacific Islander
Asian/Pacific Islander White
59% 64%
85%77% 76% 79%
0%
20%
40%
60%
80%
100%
2008‐09 2009‐10 2010‐11
Black
Black White
67% 62% 64%77% 76% 79%
0%
20%
40%
60%
80%
100%
2008‐09 2009‐10 2010‐11
Hispanic
Hispanic White
44%57%
65%77% 76% 79%
0%
20%
40%
60%
80%
100%
2008‐09 2009‐10 2010‐11
Multi‐Ethnic/Racial
Multi‐Racial White
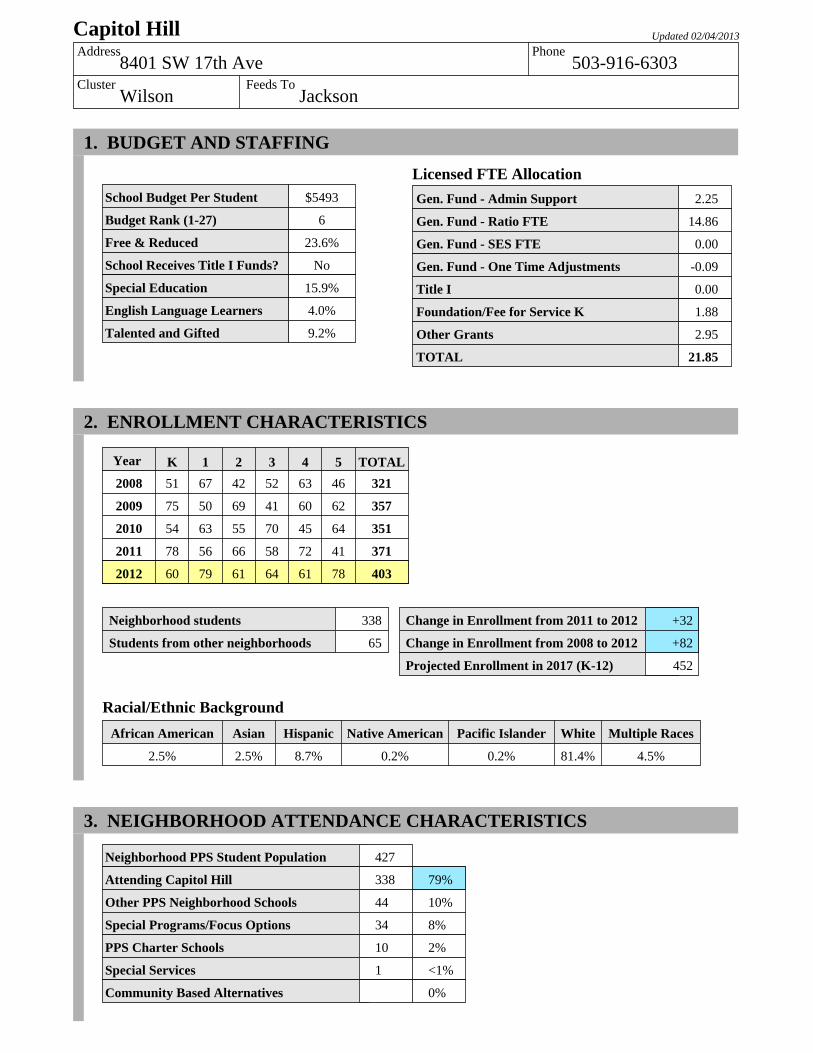
Capitol Hill Updated 02/04/2013Address Phone
8401 SW 17th Ave 503-916-6303Cluster Feeds To
Wilson Jackson
1. BUDGET AND STAFFING
School Budget Per Student
Budget Rank (1-27)
Free & Reduced
School Receives Title I Funds?
Special Education
English Language Learners
Talented and Gifted
$5493
6
23.6%
No
15.9%
4.0%
9.2%
Licensed FTE AllocationGen. Fund - Admin Support
Gen. Fund - Ratio FTE
Gen. Fund - SES FTE
Gen. Fund - One Time Adjustments
Title I
Foundation/Fee for Service K
Other Grants
TOTAL
2.25
14.86
0.00
-0.09
0.00
1.88
2.95
21.85
2. ENROLLMENT CHARACTERISTICS
Year K 1 2 3 4 5 TOTAL2008 51 67 42 52 63 46 321
2009 75 50 69 41 60 62 357
2010 54 63 55 70 45 64 351
2011 78 56 66 58 72 41 371
2012 60 79 61 64 61 78 403
Change in Enrollment from 2011 to 2012
Change in Enrollment from 2008 to 2012
Projected Enrollment in 2017 (K-12)
+32
+82
452
Neighborhood students
Students from other neighborhoods
338
65
Racial/Ethnic BackgroundAfrican American Asian Hispanic Native American Pacific Islander White Multiple Races
2.5% 2.5% 8.7% 0.2% 0.2% 81.4% 4.5%
3. NEIGHBORHOOD ATTENDANCE CHARACTERISTICS
Neighborhood PPS Student Population
Attending Capitol Hill
Other PPS Neighborhood Schools
Special Programs/Focus Options
PPS Charter Schools
Special Services
Community Based Alternatives
427
338
44
34
10
1
79%
10%
8%
2%
<1%
0%

Capitol Hill Updated 02/04/2013
4. EDUCATIONAL PROGRAMSAchievement - % Meeting or Exceeding Benchmarks
3rd Grade 5th Grade
Year Reading Math Reading Math
2009-2010 92.7% >95% 89.7% 88.1%
2010-2011 92.5% 67.2% 93.3% 76.7%
2011-2012 92.7% 80.0% 81.4% 76.7%
For detailed achievement information go to: http://www.pps.k12.or.us/depts-c/rne/results/In 2010-11 the percent meeting or exceeding in Math declined at many schools because of a higher threshold for "Meeting"In 2011-12 the percent meeting or exceeding in Reading declined at many schools because of a higher threshold for "Meeting"
5. SCHOOL ENVIRONMENT
2011-2012 SchoolComparableDistrict Average
Highly Qualified Teaching Assignments
Teacher Experience (Average in years)
Substitute Usage (Average in days)
Average Daily Attendance
Average Class Size
Stability Index
Student Expulsions
Student Suspensions
100.0%
18.8
11.7
95.0%
26.6
97.3%
0.0%
1.9%
98.0%
14.7
94.7%
14.9
25.4
94.7%
0.0%
2.7%
October 2012 Enrollment Number of Classrooms
403 19
Density Index
21
6. ENROLLMENT INDICATORS
Student loss >5% since 2011 AND >15% since 2008? NoNeighborhood students attending Capitol Hill below 55%? NoBuilding density index below 15 or above 20? Yes
7. COMMENTS/ISSUESCapitol Hill has an overall ESEA rating of Level 4 as of October 2012.
PPS Research, Evaluation & Assessment—10/11/2012jws
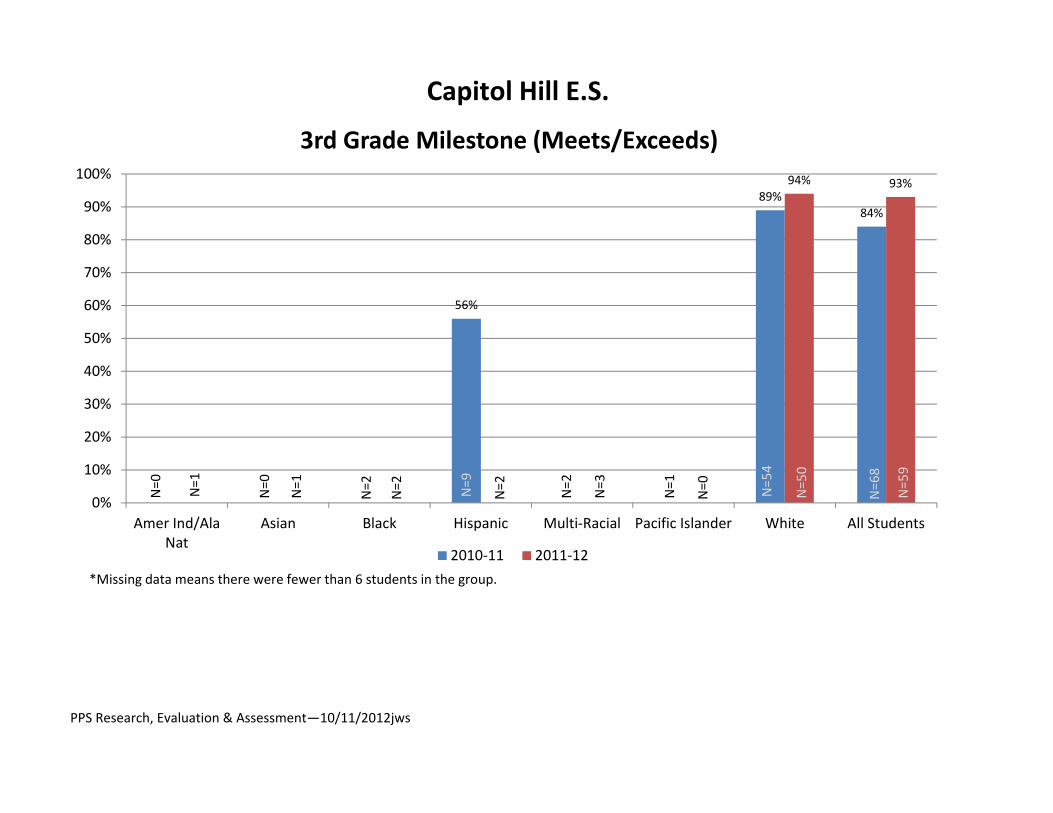
Capitol Hill E.S.
56%
89%84%
94% 93%
0%
10%
20%
30%
40%
50%
60%
70%
80%
90%
100%
Amer Ind/AlaNat
Asian Black Hispanic Multi‐Racial Pacific Islander White All Students
3rd Grade Milestone (Meets/Exceeds)
2010‐11 2011‐12*Missing data means there were fewer than 6 students in the group.
N=0 N=1
N=0
N=1
N=2
N=2 N=9
N=2 N=2
N=3
N=1
N=0 N=54
N=50
N=68
N=59

Overall = 93%Largest Gap* = N/A
Overall = 84%Largest Gap* = 33%
(White ‐ Hispanic)
Note: Data are not displayed for groups with fewer than 6 students.*Largest Gap is the difference between White students and the lowest performing non‐White group with 6 or more studentsPPS Research, Evaluation & Assessment—09/28/2012jws
2011‐12
2010‐11
Capitol Hill E.S.
Portland Public Schools3rd Grade Reading Milestone (New Cut Scores, Meets/Exceeds) – 2011 to 2012
84%93%
0%10%20%30%40%50%60%70%80%90%100%
All Students
Overall Performance
2010‐11 2011‐12
89% 94%
0%
20%
40%
60%
80%
100%
2010‐11 2011‐12
American Indian/Alaska Native
Amer Ind/Ala Nat White
89% 94%
0%
20%
40%
60%
80%
100%
2010‐11 2011‐12
Asian
Asian White
89% 94%
0%
20%
40%
60%
80%
100%
2010‐11 2011‐12
Black
Black White
56%
89% 94%
0%
20%
40%
60%
80%
100%
2010‐11 2011‐12
Hispanic
Hispanic White
89% 94%
0%
20%
40%
60%
80%
100%
2010‐11 2011‐12
Multi‐Ethnic/Racial
Multi‐Racial White
89% 94%
0%
20%
40%
60%
80%
100%
2010‐11 2011‐12
Pacific Islander
Pacific Islander White
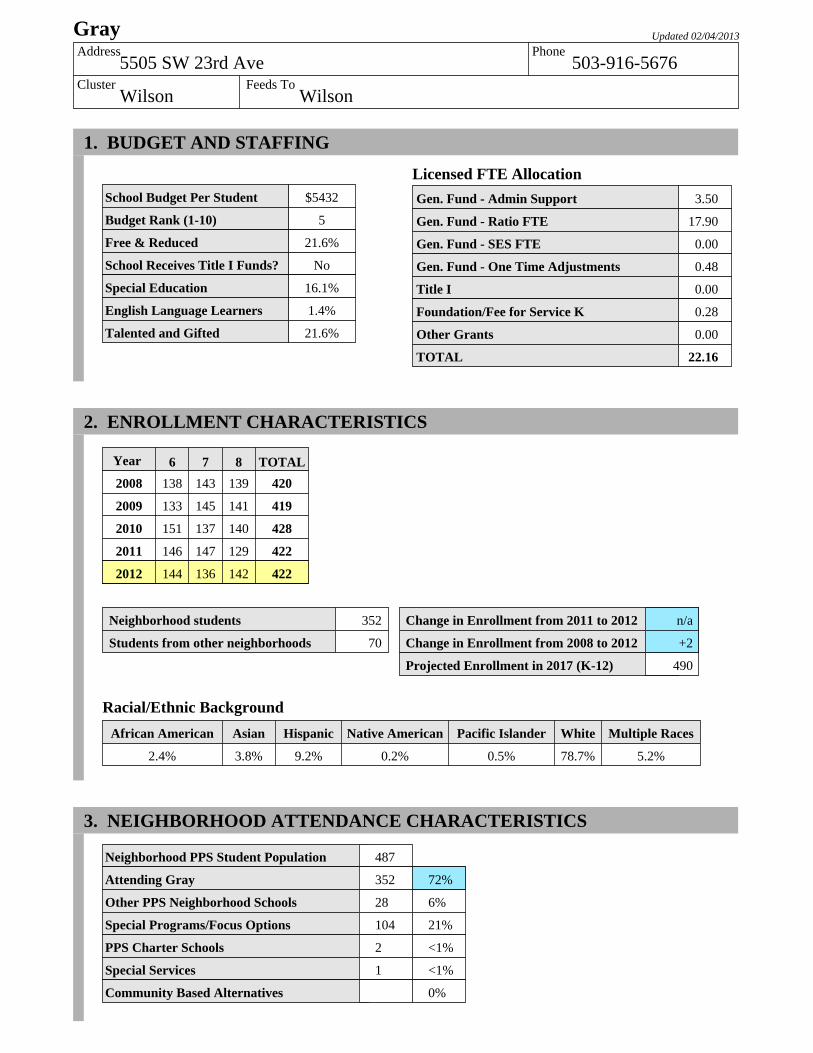
Gray Updated 02/04/2013Address Phone
5505 SW 23rd Ave 503-916-5676Cluster Feeds To
Wilson Wilson
1. BUDGET AND STAFFING
School Budget Per Student
Budget Rank (1-10)
Free & Reduced
School Receives Title I Funds?
Special Education
English Language Learners
Talented and Gifted
$5432
5
21.6%
No
16.1%
1.4%
21.6%
Licensed FTE AllocationGen. Fund - Admin Support
Gen. Fund - Ratio FTE
Gen. Fund - SES FTE
Gen. Fund - One Time Adjustments
Title I
Foundation/Fee for Service K
Other Grants
TOTAL
3.50
17.90
0.00
0.48
0.00
0.28
0.00
22.16
2. ENROLLMENT CHARACTERISTICS
Year 6 7 8 TOTAL2008 138 143 139 420
2009 133 145 141 419
2010 151 137 140 428
2011 146 147 129 422
2012 144 136 142 422
Change in Enrollment from 2011 to 2012
Change in Enrollment from 2008 to 2012
Projected Enrollment in 2017 (K-12)
n/a
+2
490
Neighborhood students
Students from other neighborhoods
352
70
Racial/Ethnic BackgroundAfrican American Asian Hispanic Native American Pacific Islander White Multiple Races
2.4% 3.8% 9.2% 0.2% 0.5% 78.7% 5.2%
3. NEIGHBORHOOD ATTENDANCE CHARACTERISTICS
Neighborhood PPS Student Population
Attending Gray
Other PPS Neighborhood Schools
Special Programs/Focus Options
PPS Charter Schools
Special Services
Community Based Alternatives
487
352
28
104
2
1
72%
6%
21%
<1%
<1%
0%
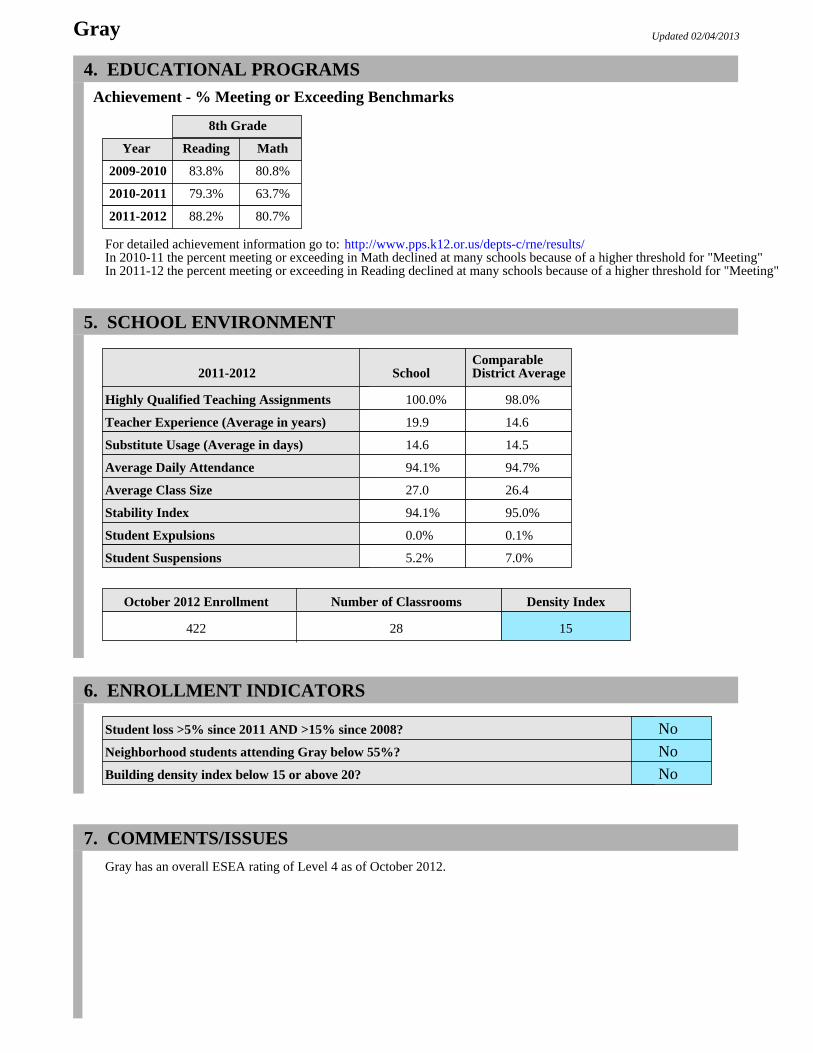
Gray Updated 02/04/2013
4. EDUCATIONAL PROGRAMSAchievement - % Meeting or Exceeding Benchmarks
8th Grade
Year Reading Math
2009-2010 83.8% 80.8%
2010-2011 79.3% 63.7%
2011-2012 88.2% 80.7%
For detailed achievement information go to: http://www.pps.k12.or.us/depts-c/rne/results/In 2010-11 the percent meeting or exceeding in Math declined at many schools because of a higher threshold for "Meeting"In 2011-12 the percent meeting or exceeding in Reading declined at many schools because of a higher threshold for "Meeting"
5. SCHOOL ENVIRONMENT
2011-2012 SchoolComparableDistrict Average
Highly Qualified Teaching Assignments
Teacher Experience (Average in years)
Substitute Usage (Average in days)
Average Daily Attendance
Average Class Size
Stability Index
Student Expulsions
Student Suspensions
100.0%
19.9
14.6
94.1%
27.0
94.1%
0.0%
5.2%
98.0%
14.6
94.7%
14.5
26.4
95.0%
0.1%
7.0%
October 2012 Enrollment Number of Classrooms
422 28
Density Index
15
6. ENROLLMENT INDICATORS
Student loss >5% since 2011 AND >15% since 2008? NoNeighborhood students attending Gray below 55%? NoBuilding density index below 15 or above 20? No
7. COMMENTS/ISSUESGray has an overall ESEA rating of Level 4 as of October 2012.

Hayhurst Updated 02/04/2013Address Phone
5037 SW Iowa St 503-916-6300Cluster Feeds To
Wilson Gray
1. BUDGET AND STAFFING
School Budget Per Student
Budget Rank (1-32)
Free & Reduced
School Receives Title I Funds?
Special Education
English Language Learners
Talented and Gifted
$5188
26
18.7%
No
6.1%
0.5%
23.1%
Licensed FTE AllocationGen. Fund - Admin Support
Gen. Fund - Ratio FTE
Gen. Fund - SES FTE
Gen. Fund - One Time Adjustments
Title I
Foundation/Fee for Service K
Other Grants
TOTAL
3.50
16.27
0.00
-0.05
0.00
1.50
0.11
21.33
2. ENROLLMENT CHARACTERISTICS
Year K 1 2 3 4 5 6 7 8 TOTAL2008 61 49 47 43 47 45 21 22 16 351
2009 52 66 55 52 42 48 31 19 20 385
2010 49 59 61 56 54 40 27 29 21 396
2011 65 52 50 66 58 47 31 25 26 420
2012 61 58 43 50 63 55 30 30 22 412
Change in Enrollment from 2011 to 2012
Change in Enrollment from 2008 to 2012
Projected Enrollment in 2017 (K-12)
-8
+61
468
Neighborhood students
Students from other neighborhoods
222
190
Racial/Ethnic BackgroundAfrican American Asian Hispanic Native American Pacific Islander White Multiple Races
0.5% 1.9% 5.6% 0.5% 0.7% 83.7% 7.0%
3. NEIGHBORHOOD ATTENDANCE CHARACTERISTICS
Neighborhood PPS Student Population
Attending Hayhurst
Other PPS Neighborhood Schools
Special Programs/Focus Options
PPS Charter Schools
Special Services
Community Based Alternatives
297
222
45
24
6
75%
15%
8%
2%
0%
0%

Hayhurst Updated 02/04/2013
4. EDUCATIONAL PROGRAMSAchievement - % Meeting or Exceeding Benchmarks
3rd Grade 5th Grade 8th Grade
Year Reading Math Reading Math Reading Math
2009-2010 92.0% >95% 88.0% 85.0% >95% 90.0%
2010-2011 85.7% 71.4% 85.0% 77.5% >95% 76.2%
2011-2012 84.1% 76.2% 86.0% 69.8% >95% >95%
For detailed achievement information go to: http://www.pps.k12.or.us/depts-c/rne/results/In 2010-11 the percent meeting or exceeding in Math declined at many schools because of a higher threshold for "Meeting"In 2011-12 the percent meeting or exceeding in Reading declined at many schools because of a higher threshold for "Meeting"
5. SCHOOL ENVIRONMENT
2011-2012 SchoolComparableDistrict Average
Highly Qualified Teaching Assignments
Teacher Experience (Average in years)
Substitute Usage (Average in days)
Average Daily Attendance
Average Class Size
Stability Index
Student Expulsions
Student Suspensions
100.0%
14.1
11.6
95.0%
24.6
93.1%
0.0%
1.2%
99.4%
13.0
94.3%
15.5
23.8
92.5%
0.1%
6.1%
October 2012 Enrollment Number of Classrooms
412 22
Density Index
19
6. ENROLLMENT INDICATORS
Student loss >5% since 2011 AND >15% since 2008? NoNeighborhood students attending Hayhurst below 55%? NoBuilding density index below 15 or above 20? No
7. COMMENTS/ISSUESHayhurst has an overall ESEA rating of Level 4 as of October 2012.
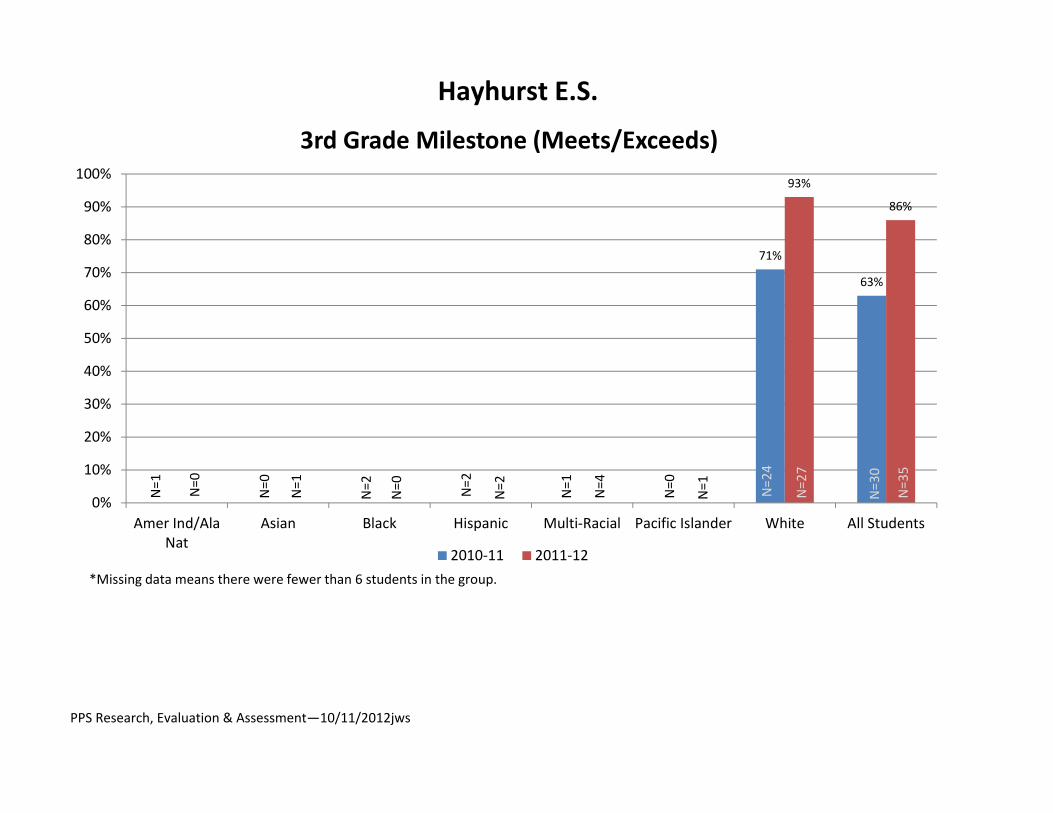
PPS Research, Evaluation & Assessment—10/11/2012jws
Hayhurst E.S.
71%
63%
93%
86%
0%
10%
20%
30%
40%
50%
60%
70%
80%
90%
100%
Amer Ind/AlaNat
Asian Black Hispanic Multi‐Racial Pacific Islander White All Students
3rd Grade Milestone (Meets/Exceeds)
2010‐11 2011‐12*Missing data means there were fewer than 6 students in the group.
N=1 N=0
N=0
N=1
N=2
N=0 N=2
N=2 N=1
N=4
N=0
N=1 N=24
N=27
N=30
N=35
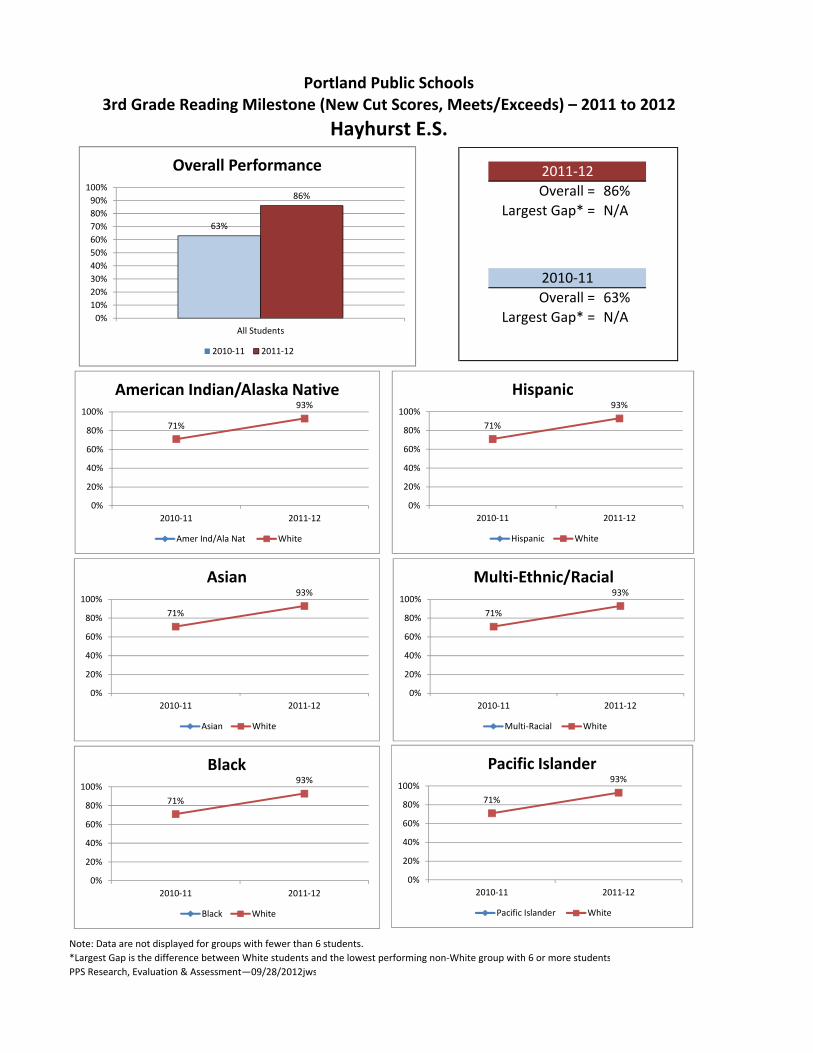
Overall = 86%Largest Gap* = N/A
Overall = 63%Largest Gap* = N/A
Note: Data are not displayed for groups with fewer than 6 students.*Largest Gap is the difference between White students and the lowest performing non‐White group with 6 or more studentsPPS Research, Evaluation & Assessment—09/28/2012jws
2011‐12
2010‐11
Hayhurst E.S.
Portland Public Schools3rd Grade Reading Milestone (New Cut Scores, Meets/Exceeds) – 2011 to 2012
63%
86%
0%10%20%30%40%50%60%70%80%90%100%
All Students
Overall Performance
2010‐11 2011‐12
71%
93%
0%
20%
40%
60%
80%
100%
2010‐11 2011‐12
American Indian/Alaska Native
Amer Ind/Ala Nat White
71%
93%
0%
20%
40%
60%
80%
100%
2010‐11 2011‐12
Asian
Asian White
71%
93%
0%
20%
40%
60%
80%
100%
2010‐11 2011‐12
Black
Black White
71%
93%
0%
20%
40%
60%
80%
100%
2010‐11 2011‐12
Hispanic
Hispanic White
71%
93%
0%
20%
40%
60%
80%
100%
2010‐11 2011‐12
Multi‐Ethnic/Racial
Multi‐Racial White
71%
93%
0%
20%
40%
60%
80%
100%
2010‐11 2011‐12
Pacific Islander
Pacific Islander White

Jackson Updated 02/04/2013Address Phone
10625 SW 35th Ave 503-916-5680Cluster Feeds To
Wilson Wilson
1. BUDGET AND STAFFING
School Budget Per Student
Budget Rank (1-10)
Free & Reduced
School Receives Title I Funds?
Special Education
English Language Learners
Talented and Gifted
$4963
9
26.7%
No
18.0%
4.1%
18.4%
Licensed FTE AllocationGen. Fund - Admin Support
Gen. Fund - Ratio FTE
Gen. Fund - SES FTE
Gen. Fund - One Time Adjustments
Title I
Foundation/Fee for Service K
Other Grants
TOTAL
4.25
21.66
0.00
0.45
0.00
0.00
0.00
26.36
2. ENROLLMENT CHARACTERISTICS
Year 6 7 8 TOTAL2008 215 239 258 712
2009 172 225 254 651
2010 187 177 220 584
2011 168 199 166 533
2012 164 168 200 532
Change in Enrollment from 2011 to 2012
Change in Enrollment from 2008 to 2012
Projected Enrollment in 2017 (K-12)
-1
-180
618
Neighborhood students
Students from other neighborhoods
485
47
Racial/Ethnic BackgroundAfrican American Asian Hispanic Native American Pacific Islander White Multiple Races
5.6% 2.6% 10.7% 0.8% 0.6% 72.9% 6.8%
3. NEIGHBORHOOD ATTENDANCE CHARACTERISTICS
Neighborhood PPS Student Population
Attending Jackson
Other PPS Neighborhood Schools
Special Programs/Focus Options
PPS Charter Schools
Special Services
Community Based Alternatives
547
485
16
42
2
2
89%
3%
8%
<1%
<1%
0%

Jackson Updated 02/04/2013
4. EDUCATIONAL PROGRAMSAchievement - % Meeting or Exceeding Benchmarks
8th Grade
Year Reading Math
2009-2010 78.5% 77.6%
2010-2011 83.0% 71.6%
2011-2012 77.6% 75.0%
For detailed achievement information go to: http://www.pps.k12.or.us/depts-c/rne/results/In 2010-11 the percent meeting or exceeding in Math declined at many schools because of a higher threshold for "Meeting"In 2011-12 the percent meeting or exceeding in Reading declined at many schools because of a higher threshold for "Meeting"
5. SCHOOL ENVIRONMENT
2011-2012 SchoolComparableDistrict Average
Highly Qualified Teaching Assignments
Teacher Experience (Average in years)
Substitute Usage (Average in days)
Average Daily Attendance
Average Class Size
Stability Index
Student Expulsions
Student Suspensions
100.0%
14.4
14.6
94.9%
28.5
96.6%
0.0%
2.1%
98.0%
14.6
94.7%
14.5
26.4
95.0%
0.1%
7.0%
October 2012 Enrollment Number of Classrooms
532 38
Density Index
14
6. ENROLLMENT INDICATORS
Student loss >5% since 2011 AND >15% since 2008? NoNeighborhood students attending Jackson below 55%? NoBuilding density index below 15 or above 20? Yes
7. COMMENTS/ISSUESJackson has an overall ESEA rating of Level 3 as of October 2012.

Maplewood Updated 02/04/2013Address Phone
7452 SW 52nd Ave 503-916-6308Cluster Feeds To
Wilson Gray
1. BUDGET AND STAFFING
School Budget Per Student
Budget Rank (1-27)
Free & Reduced
School Receives Title I Funds?
Special Education
English Language Learners
Talented and Gifted
$5167
12
26.9%
No
9.8%
1.8%
8.3%
Licensed FTE AllocationGen. Fund - Admin Support
Gen. Fund - Ratio FTE
Gen. Fund - SES FTE
Gen. Fund - One Time Adjustments
Title I
Foundation/Fee for Service K
Other Grants
TOTAL
1.75
12.42
0.00
0.35
0.00
2.22
0.00
16.74
2. ENROLLMENT CHARACTERISTICS
Year K 1 2 3 4 5 TOTAL2008 63 53 52 62 56 45 331
2009 59 60 56 55 58 54 342
2010 51 53 65 61 59 61 350
2011 59 48 53 61 54 60 335
2012 58 58 51 46 62 52 327
Change in Enrollment from 2011 to 2012
Change in Enrollment from 2008 to 2012
Projected Enrollment in 2017 (K-12)
-8
-4
329
Neighborhood students
Students from other neighborhoods
293
34
Racial/Ethnic BackgroundAfrican American Asian Hispanic Native American Pacific Islander White Multiple Races
0.9% 1.8% 8.0% 0.6% 0.3% 79.2% 9.2%
3. NEIGHBORHOOD ATTENDANCE CHARACTERISTICS
Neighborhood PPS Student Population
Attending Maplewood
Other PPS Neighborhood Schools
Special Programs/Focus Options
PPS Charter Schools
Special Services
Community Based Alternatives
388
293
32
58
5
76%
8%
15%
1%
0%
0%

Maplewood Updated 02/04/2013
4. EDUCATIONAL PROGRAMSAchievement - % Meeting or Exceeding Benchmarks
3rd Grade 5th Grade
Year Reading Math Reading Math
2009-2010 87.3% 81.8% 87.8% 81.6%
2010-2011 >95% 69.1% 85.5% 67.7%
2011-2012 85.0% 68.3% 83.9% 62.9%
For detailed achievement information go to: http://www.pps.k12.or.us/depts-c/rne/results/In 2010-11 the percent meeting or exceeding in Math declined at many schools because of a higher threshold for "Meeting"In 2011-12 the percent meeting or exceeding in Reading declined at many schools because of a higher threshold for "Meeting"
5. SCHOOL ENVIRONMENT
2011-2012 SchoolComparableDistrict Average
Highly Qualified Teaching Assignments
Teacher Experience (Average in years)
Substitute Usage (Average in days)
Average Daily Attendance
Average Class Size
Stability Index
Student Expulsions
Student Suspensions
100.0%
18.2
13.1
95.3%
23.9
97.3%
0.0%
1.2%
98.0%
14.7
94.7%
14.9
25.4
94.7%
0.0%
2.7%
October 2012 Enrollment Number of Classrooms
327 16
Density Index
20
6. ENROLLMENT INDICATORS
Student loss >5% since 2011 AND >15% since 2008? NoNeighborhood students attending Maplewood below 55%? NoBuilding density index below 15 or above 20? No
7. COMMENTS/ISSUESMaplewood has an overall ESEA rating of Level 4 as of October 2012.

PPS Research, Evaluation & Assessment—10/11/2012jws
Maplewood E.S.
90% 89%
57%
100%
85% 84%
0%
10%
20%
30%
40%
50%
60%
70%
80%
90%
100%
Amer Ind/AlaNat
Asian Black Hispanic Multi‐Racial Pacific Islander White All Students
3rd Grade Milestone (Meets/Exceeds)
2010‐11 2011‐12*Missing data means there were fewer than 6 students in the group.
N=0 N=0
N=0
N=0
N=0
N=2 N=3
N=7 N=4
N=6
N=0
N=0 N=48
N=47
N=55
N=62

Overall = 84%Largest Gap* = 28%
(White ‐ Hispanic)
Overall = 89%Largest Gap* = N/A
Note: Data are not displayed for groups with fewer than 6 students.*Largest Gap is the difference between White students and the lowest performing non‐White group with 6 or more studentsPPS Research, Evaluation & Assessment—09/28/2012jws
2011‐12
2010‐11
Maplewood E.S.
Portland Public Schools3rd Grade Reading Milestone (New Cut Scores, Meets/Exceeds) – 2011 to 2012
89%84%
0%10%20%30%40%50%60%70%80%90%100%
All Students
Overall Performance
2010‐11 2011‐12
90% 85%
0%
20%
40%
60%
80%
100%
2010‐11 2011‐12
American Indian/Alaska Native
Amer Ind/Ala Nat White
90% 85%
0%
20%
40%
60%
80%
100%
2010‐11 2011‐12
Asian
Asian White
90% 85%
0%
20%
40%
60%
80%
100%
2010‐11 2011‐12
Black
Black White
57%
90% 85%
0%
20%
40%
60%
80%
100%
2010‐11 2011‐12
Hispanic
Hispanic White
100%90% 85%
0%
20%
40%
60%
80%
100%
2010‐11 2011‐12
Multi‐Ethnic/Racial
Multi‐Racial White
90% 85%
0%
20%
40%
60%
80%
100%
2010‐11 2011‐12
Pacific Islander
Pacific Islander White

Markham Updated 02/04/2013Address Phone
10531 SW Capitol Hwy 503-916-5681Cluster Feeds To
Wilson Jackson
1. BUDGET AND STAFFING
School Budget Per Student
Budget Rank (1-27)
Free & Reduced
School Receives Title I Funds?
Special Education
English Language Learners
Talented and Gifted
$5503
5
55.9%
No
15.9%
20.9%
7.0%
Licensed FTE AllocationGen. Fund - Admin Support
Gen. Fund - Ratio FTE
Gen. Fund - SES FTE
Gen. Fund - One Time Adjustments
Title I
Foundation/Fee for Service K
Other Grants
TOTAL
2.25
14.74
1.08
-0.05
0.00
1.61
0.37
20.00
2. ENROLLMENT CHARACTERISTICS
Year K 1 2 3 4 5 TOTAL2008 76 60 59 45 65 55 360
2009 81 77 56 53 48 61 376
2010 71 69 79 54 47 56 376
2011 74 60 74 69 55 52 384
2012 69 72 51 62 72 57 383
Change in Enrollment from 2011 to 2012
Change in Enrollment from 2008 to 2012
Projected Enrollment in 2017 (K-12)
-1
+23
432
Neighborhood students
Students from other neighborhoods
349
34
Racial/Ethnic BackgroundAfrican American Asian Hispanic Native American Pacific Islander White Multiple Races
18.0% 3.1% 12.5% 0.8% 1.0% 60.1% 4.4%
3. NEIGHBORHOOD ATTENDANCE CHARACTERISTICS
Neighborhood PPS Student Population
Attending Markham
Other PPS Neighborhood Schools
Special Programs/Focus Options
PPS Charter Schools
Special Services
Community Based Alternatives
518
349
123
35
10
1
67%
24%
7%
2%
<1%
0%
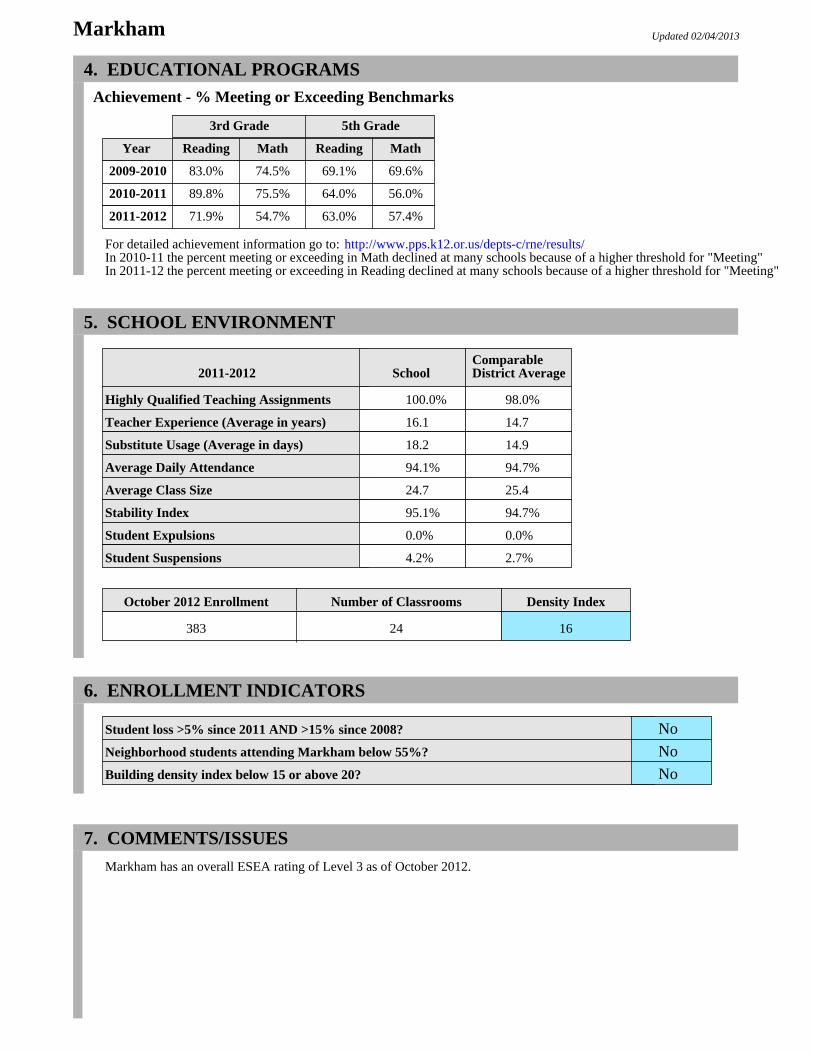
Markham Updated 02/04/2013
4. EDUCATIONAL PROGRAMSAchievement - % Meeting or Exceeding Benchmarks
3rd Grade 5th Grade
Year Reading Math Reading Math
2009-2010 83.0% 74.5% 69.1% 69.6%
2010-2011 89.8% 75.5% 64.0% 56.0%
2011-2012 71.9% 54.7% 63.0% 57.4%
For detailed achievement information go to: http://www.pps.k12.or.us/depts-c/rne/results/In 2010-11 the percent meeting or exceeding in Math declined at many schools because of a higher threshold for "Meeting"In 2011-12 the percent meeting or exceeding in Reading declined at many schools because of a higher threshold for "Meeting"
5. SCHOOL ENVIRONMENT
2011-2012 SchoolComparableDistrict Average
Highly Qualified Teaching Assignments
Teacher Experience (Average in years)
Substitute Usage (Average in days)
Average Daily Attendance
Average Class Size
Stability Index
Student Expulsions
Student Suspensions
100.0%
16.1
18.2
94.1%
24.7
95.1%
0.0%
4.2%
98.0%
14.7
94.7%
14.9
25.4
94.7%
0.0%
2.7%
October 2012 Enrollment Number of Classrooms
383 24
Density Index
16
6. ENROLLMENT INDICATORS
Student loss >5% since 2011 AND >15% since 2008? NoNeighborhood students attending Markham below 55%? NoBuilding density index below 15 or above 20? No
7. COMMENTS/ISSUESMarkham has an overall ESEA rating of Level 3 as of October 2012.

PPS Research, Evaluation & Assessment—10/11/2012jws
Markham E.S.
82% 83%
71% 72%
38%
89%
75% 74%69%
0%
10%
20%
30%
40%
50%
60%
70%
80%
90%
100%
Amer Ind/AlaNat
Asian Black Hispanic Multi‐Racial Pacific Islander White All Students
3rd Grade Milestone (Meets/Exceeds)
2010‐11 2011‐12*Missing data means there were fewer than 6 students in the group.
N=1 N=1
N=1
N=1
N=11
N=13
N=6
N=9 N=0
N=8
N=0
N=1 N=34
N=39
N=53
N=72
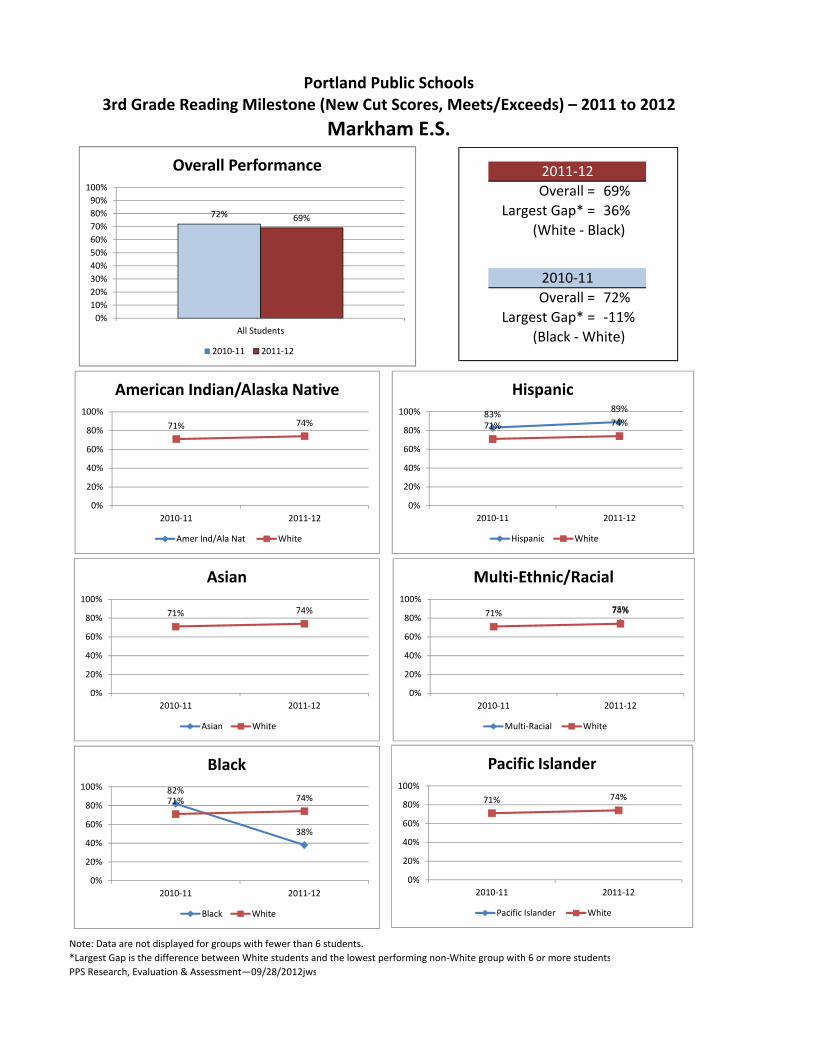
Overall = 69%Largest Gap* = 36%
(White ‐ Black)
Overall = 72%Largest Gap* = ‐11%
(Black ‐ White)
Note: Data are not displayed for groups with fewer than 6 students.*Largest Gap is the difference between White students and the lowest performing non‐White group with 6 or more studentsPPS Research, Evaluation & Assessment—09/28/2012jws
2011‐12
2010‐11
Markham E.S.
Portland Public Schools3rd Grade Reading Milestone (New Cut Scores, Meets/Exceeds) – 2011 to 2012
72% 69%
0%10%20%30%40%50%60%70%80%90%100%
All Students
Overall Performance
2010‐11 2011‐12
71% 74%
0%
20%
40%
60%
80%
100%
2010‐11 2011‐12
American Indian/Alaska Native
Amer Ind/Ala Nat White
71% 74%
0%
20%
40%
60%
80%
100%
2010‐11 2011‐12
Asian
Asian White
82%
38%
71% 74%
0%
20%
40%
60%
80%
100%
2010‐11 2011‐12
Black
Black White
83% 89%
71% 74%
0%
20%
40%
60%
80%
100%
2010‐11 2011‐12
Hispanic
Hispanic White
75%71% 74%
0%
20%
40%
60%
80%
100%
2010‐11 2011‐12
Multi‐Ethnic/Racial
Multi‐Racial White
71% 74%
0%
20%
40%
60%
80%
100%
2010‐11 2011‐12
Pacific Islander
Pacific Islander White
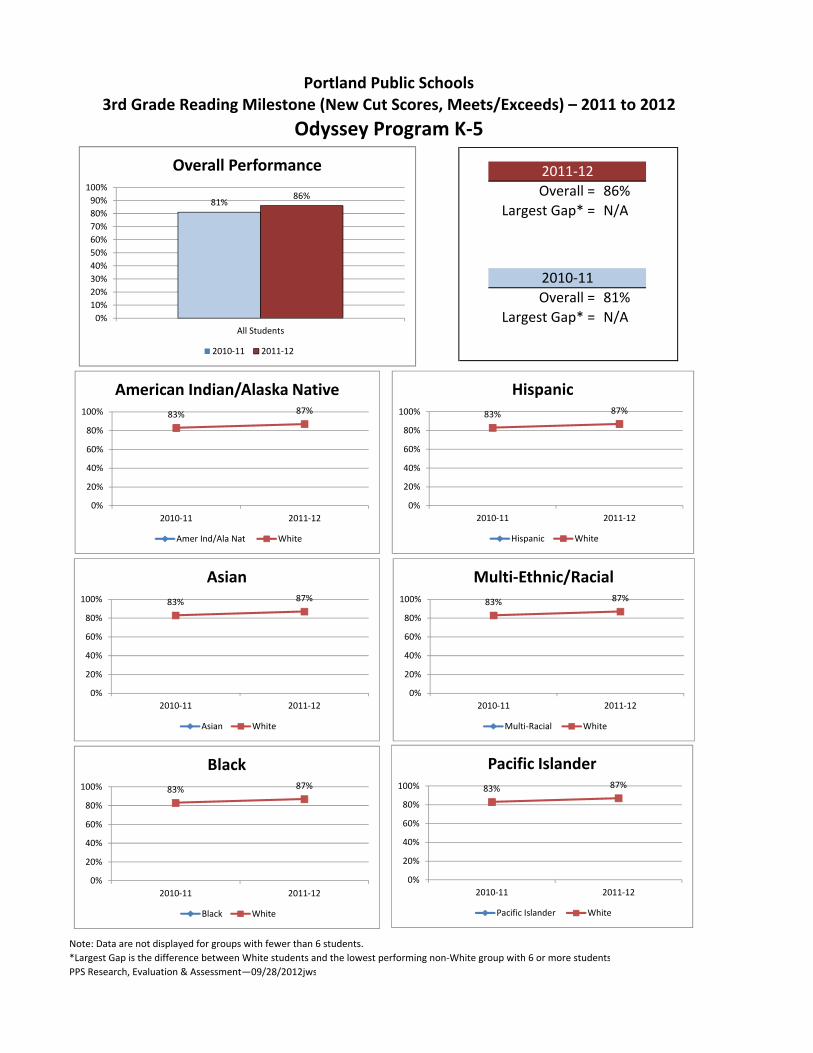
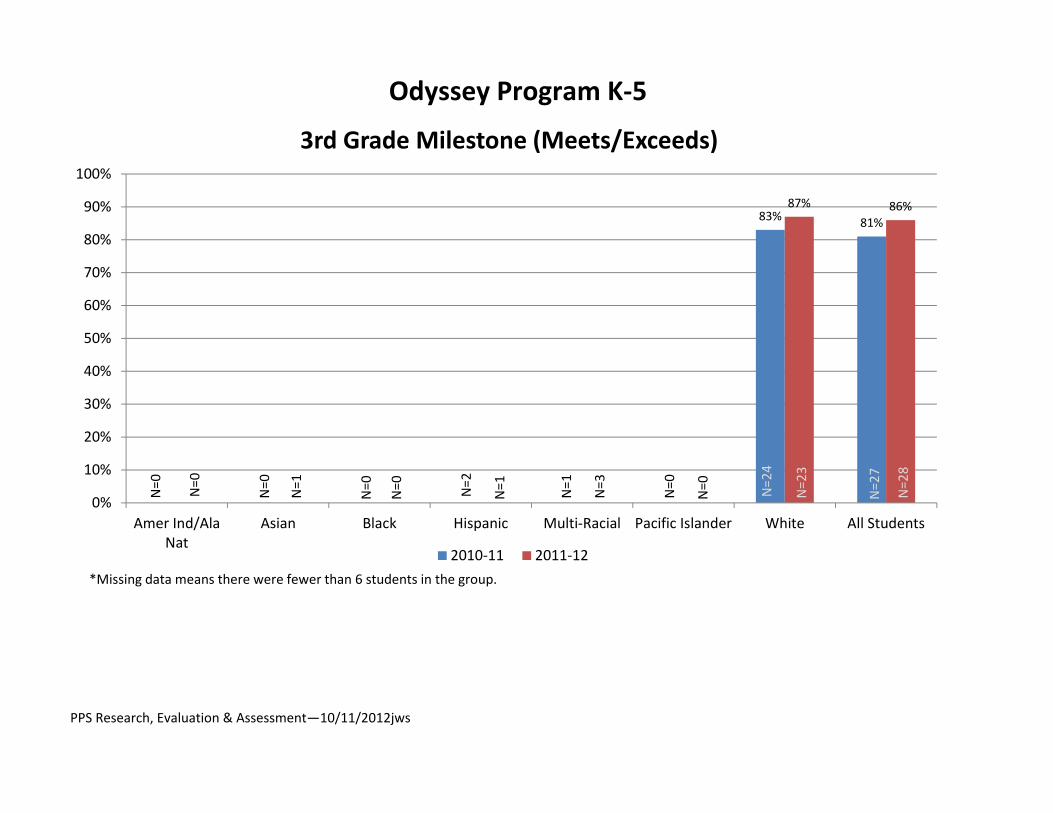
Overall = 86%Largest Gap* = N/A
Overall = 81%Largest Gap* = N/A
Note: Data are not displayed for groups with fewer than 6 students.*Largest Gap is the difference between White students and the lowest performing non‐White group with 6 or more studentsPPS Research, Evaluation & Assessment—09/28/2012jws
2011‐12
2010‐11
Odyssey Program K‐5
Portland Public Schools3rd Grade Reading Milestone (New Cut Scores, Meets/Exceeds) – 2011 to 2012
81%86%
0%10%20%30%40%50%60%70%80%90%100%
All Students
Overall Performance
2010‐11 2011‐12
83% 87%
0%
20%
40%
60%
80%
100%
2010‐11 2011‐12
American Indian/Alaska Native
Amer Ind/Ala Nat White
83% 87%
0%
20%
40%
60%
80%
100%
2010‐11 2011‐12
Asian
Asian White
83% 87%
0%
20%
40%
60%
80%
100%
2010‐11 2011‐12
Black
Black White
83% 87%
0%
20%
40%
60%
80%
100%
2010‐11 2011‐12
Hispanic
Hispanic White
83% 87%
0%
20%
40%
60%
80%
100%
2010‐11 2011‐12
Multi‐Ethnic/Racial
Multi‐Racial White
83% 87%
0%
20%
40%
60%
80%
100%
2010‐11 2011‐12
Pacific Islander
Pacific Islander White
PPS Research, Evaluation & Assessment—10/11/2012jws
Odyssey Program K‐5
83% 81%87% 86%
0%
10%
20%
30%
40%
50%
60%
70%
80%
90%
100%
Amer Ind/AlaNat
Asian Black Hispanic Multi‐Racial Pacific Islander White All Students
3rd Grade Milestone (Meets/Exceeds)
2010‐11 2011‐12*Missing data means there were fewer than 6 students in the group.
N=0 N=0
N=0
N=1
N=0
N=0 N=2
N=1 N=1
N=3
N=0
N=0 N=24
N=23
N=27
N=28

Rieke Updated 02/04/2013Address Phone
1405 SW Vermont St 503-916-5768Cluster Feeds To
Wilson Gray
1. BUDGET AND STAFFING
School Budget Per Student
Budget Rank (1-27)
Free & Reduced
School Receives Title I Funds?
Special Education
English Language Learners
Talented and Gifted
$5235
11
13.9%
No
7.5%
2.3%
20.4%
Licensed FTE AllocationGen. Fund - Admin Support
Gen. Fund - Ratio FTE
Gen. Fund - SES FTE
Gen. Fund - One Time Adjustments
Title I
Foundation/Fee for Service K
Other Grants
TOTAL
1.88
15.70
0.00
0.15
0.00
2.25
0.00
19.98
2. ENROLLMENT CHARACTERISTICS
Year K 1 2 3 4 5 TOTAL2008 67 67 58 54 56 46 348
2009 69 64 69 59 52 58 371
2010 53 69 62 69 58 45 356
2011 75 68 76 62 74 61 416
2012 58 74 61 64 57 74 388
Change in Enrollment from 2011 to 2012
Change in Enrollment from 2008 to 2012
Projected Enrollment in 2017 (K-12)
-28
+40
433
Neighborhood students
Students from other neighborhoods
322
66
Racial/Ethnic BackgroundAfrican American Asian Hispanic Native American Pacific Islander White Multiple Races
1.5% 4.4% 4.6% 0.3% 0.0% 81.4% 7.7%
3. NEIGHBORHOOD ATTENDANCE CHARACTERISTICS
Neighborhood PPS Student Population
Attending Rieke
Other PPS Neighborhood Schools
Special Programs/Focus Options
PPS Charter Schools
Special Services
Community Based Alternatives
388
322
26
34
5
1
83%
7%
9%
1%
<1%
0%

Rieke Updated 02/04/2013
4. EDUCATIONAL PROGRAMSAchievement - % Meeting or Exceeding Benchmarks
3rd Grade 5th Grade
Year Reading Math Reading Math
2009-2010 94.7% >95% >95% 94.6%
2010-2011 >95% 92.8% 84.8% 73.9%
2011-2012 93.4% 82.0% 91.7% 85.0%
For detailed achievement information go to: http://www.pps.k12.or.us/depts-c/rne/results/In 2010-11 the percent meeting or exceeding in Math declined at many schools because of a higher threshold for "Meeting"In 2011-12 the percent meeting or exceeding in Reading declined at many schools because of a higher threshold for "Meeting"
5. SCHOOL ENVIRONMENT
2011-2012 SchoolComparableDistrict Average
Highly Qualified Teaching Assignments
Teacher Experience (Average in years)
Substitute Usage (Average in days)
Average Daily Attendance
Average Class Size
Stability Index
Student Expulsions
Student Suspensions
100.0%
12.6
11.6
95.4%
26.1
95.2%
0.0%
0.5%
98.0%
14.7
94.7%
14.9
25.4
94.7%
0.0%
2.7%
October 2012 Enrollment Number of Classrooms
388 17
Density Index
23
6. ENROLLMENT INDICATORS
Student loss >5% since 2011 AND >15% since 2008? NoNeighborhood students attending Rieke below 55%? NoBuilding density index below 15 or above 20? Yes
7. COMMENTS/ISSUESRieke has an overall ESEA rating of Level 4 as of October 2012.
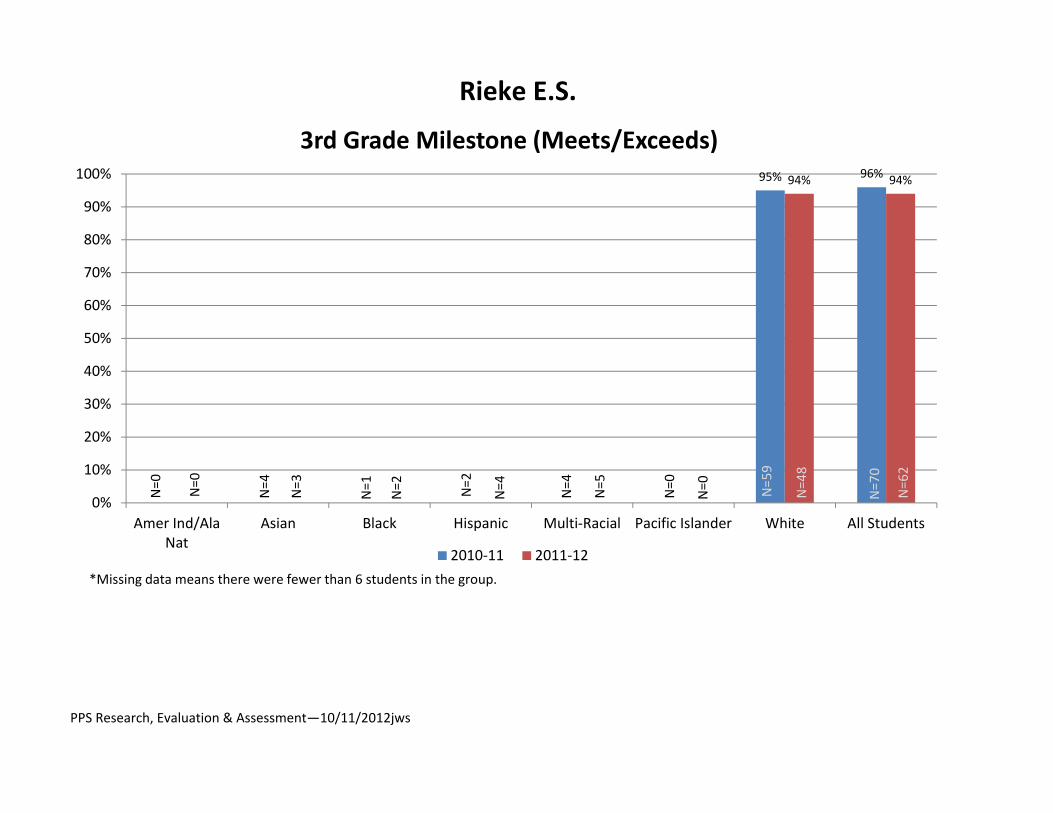
PPS Research, Evaluation & Assessment—10/11/2012jws
Rieke E.S.
95% 96%94% 94%
0%
10%
20%
30%
40%
50%
60%
70%
80%
90%
100%
Amer Ind/AlaNat
Asian Black Hispanic Multi‐Racial Pacific Islander White All Students
3rd Grade Milestone (Meets/Exceeds)
2010‐11 2011‐12*Missing data means there were fewer than 6 students in the group.
N=0 N=0
N=4
N=3
N=1
N=2 N=2
N=4 N=4
N=5
N=0
N=0 N=59
N=48
N=70
N=62

Overall = 94%Largest Gap* = N/A
Overall = 96%Largest Gap* = N/A
Note: Data are not displayed for groups with fewer than 6 students.*Largest Gap is the difference between White students and the lowest performing non‐White group with 6 or more studentsPPS Research, Evaluation & Assessment—09/28/2012jws
2011‐12
2010‐11
Rieke E.S.
Portland Public Schools3rd Grade Reading Milestone (New Cut Scores, Meets/Exceeds) – 2011 to 2012
96% 94%
0%10%20%30%40%50%60%70%80%90%100%
All Students
Overall Performance
2010‐11 2011‐12
95% 94%
0%
20%
40%
60%
80%
100%
2010‐11 2011‐12
American Indian/Alaska Native
Amer Ind/Ala Nat White
95% 94%
0%
20%
40%
60%
80%
100%
2010‐11 2011‐12
Asian
Asian White
95% 94%
0%
20%
40%
60%
80%
100%
2010‐11 2011‐12
Black
Black White
95% 94%
0%
20%
40%
60%
80%
100%
2010‐11 2011‐12
Hispanic
Hispanic White
95% 94%
0%
20%
40%
60%
80%
100%
2010‐11 2011‐12
Multi‐Ethnic/Racial
Multi‐Racial White
95% 94%
0%
20%
40%
60%
80%
100%
2010‐11 2011‐12
Pacific Islander
Pacific Islander White
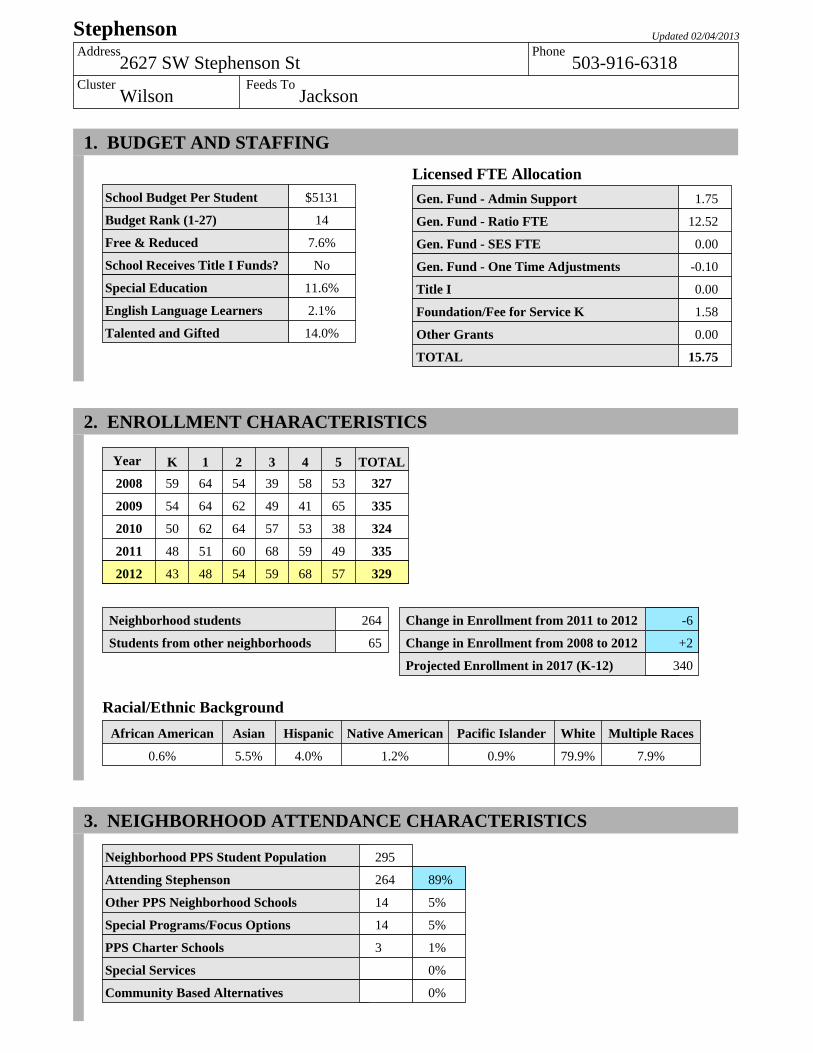
Stephenson Updated 02/04/2013Address Phone
2627 SW Stephenson St 503-916-6318Cluster Feeds To
Wilson Jackson
1. BUDGET AND STAFFING
School Budget Per Student
Budget Rank (1-27)
Free & Reduced
School Receives Title I Funds?
Special Education
English Language Learners
Talented and Gifted
$5131
14
7.6%
No
11.6%
2.1%
14.0%
Licensed FTE AllocationGen. Fund - Admin Support
Gen. Fund - Ratio FTE
Gen. Fund - SES FTE
Gen. Fund - One Time Adjustments
Title I
Foundation/Fee for Service K
Other Grants
TOTAL
1.75
12.52
0.00
-0.10
0.00
1.58
0.00
15.75
2. ENROLLMENT CHARACTERISTICS
Year K 1 2 3 4 5 TOTAL2008 59 64 54 39 58 53 327
2009 54 64 62 49 41 65 335
2010 50 62 64 57 53 38 324
2011 48 51 60 68 59 49 335
2012 43 48 54 59 68 57 329
Change in Enrollment from 2011 to 2012
Change in Enrollment from 2008 to 2012
Projected Enrollment in 2017 (K-12)
-6
+2
340
Neighborhood students
Students from other neighborhoods
264
65
Racial/Ethnic BackgroundAfrican American Asian Hispanic Native American Pacific Islander White Multiple Races
0.6% 5.5% 4.0% 1.2% 0.9% 79.9% 7.9%
3. NEIGHBORHOOD ATTENDANCE CHARACTERISTICS
Neighborhood PPS Student Population
Attending Stephenson
Other PPS Neighborhood Schools
Special Programs/Focus Options
PPS Charter Schools
Special Services
Community Based Alternatives
295
264
14
14
3
89%
5%
5%
1%
0%
0%

Stephenson Updated 02/04/2013
4. EDUCATIONAL PROGRAMSAchievement - % Meeting or Exceeding Benchmarks
3rd Grade 5th Grade
Year Reading Math Reading Math
2009-2010 >95% >95% 91.5% 93.2%
2010-2011 >95% 76.8% 83.3% 69.4%
2011-2012 90.9% 87.9% 94.0% 82.0%
For detailed achievement information go to: http://www.pps.k12.or.us/depts-c/rne/results/In 2010-11 the percent meeting or exceeding in Math declined at many schools because of a higher threshold for "Meeting"In 2011-12 the percent meeting or exceeding in Reading declined at many schools because of a higher threshold for "Meeting"
5. SCHOOL ENVIRONMENT
2011-2012 SchoolComparableDistrict Average
Highly Qualified Teaching Assignments
Teacher Experience (Average in years)
Substitute Usage (Average in days)
Average Daily Attendance
Average Class Size
Stability Index
Student Expulsions
Student Suspensions
100.0%
24.7
14.2
96.1%
27.8
96.7%
0.0%
0.9%
98.0%
14.7
94.7%
14.9
25.4
94.7%
0.0%
2.7%
October 2012 Enrollment Number of Classrooms
329 20
Density Index
16
6. ENROLLMENT INDICATORS
Student loss >5% since 2011 AND >15% since 2008? NoNeighborhood students attending Stephenson below 55%? NoBuilding density index below 15 or above 20? No
7. COMMENTS/ISSUESStephenson has an overall ESEA rating of Level 4 as of October 2012.
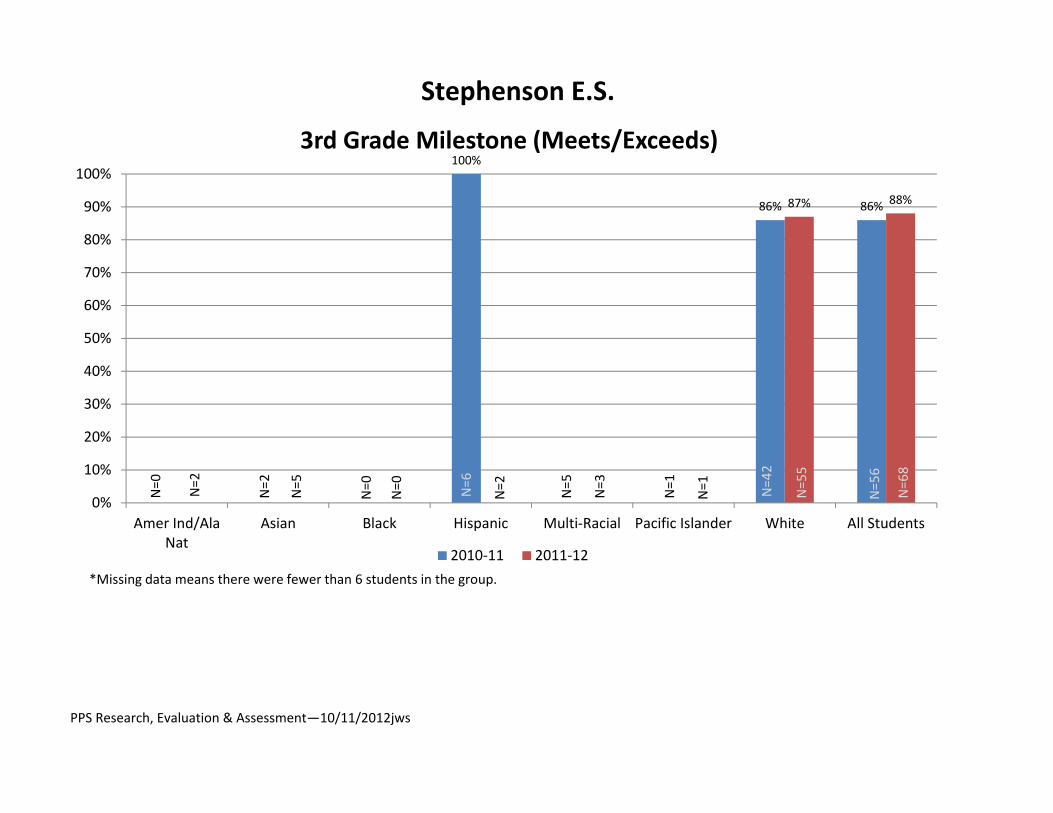
PPS Research, Evaluation & Assessment—10/11/2012jws
Stephenson E.S.
100%
86% 86%87% 88%
0%
10%
20%
30%
40%
50%
60%
70%
80%
90%
100%
Amer Ind/AlaNat
Asian Black Hispanic Multi‐Racial Pacific Islander White All Students
3rd Grade Milestone (Meets/Exceeds)
2010‐11 2011‐12*Missing data means there were fewer than 6 students in the group.
N=0 N=2
N=2
N=5
N=0
N=0 N=6
N=2 N=5
N=3
N=1
N=1 N=42
N=55
N=56
N=68

Overall = 88%Largest Gap* = N/A
Overall = 86%Largest Gap* = ‐14%
(Hispanic ‐ White)
Note: Data are not displayed for groups with fewer than 6 students.*Largest Gap is the difference between White students and the lowest performing non‐White group with 6 or more studentsPPS Research, Evaluation & Assessment—09/28/2012jws
2011‐12
2010‐11
Stephenson E.S.
Portland Public Schools3rd Grade Reading Milestone (New Cut Scores, Meets/Exceeds) – 2011 to 2012
86% 88%
0%10%20%30%40%50%60%70%80%90%100%
All Students
Overall Performance
2010‐11 2011‐12
86% 87%
0%
20%
40%
60%
80%
100%
2010‐11 2011‐12
American Indian/Alaska Native
Amer Ind/Ala Nat White
86% 87%
0%
20%
40%
60%
80%
100%
2010‐11 2011‐12
Asian
Asian White
86% 87%
0%
20%
40%
60%
80%
100%
2010‐11 2011‐12
Black
Black White
100%86% 87%
0%
20%
40%
60%
80%
100%
2010‐11 2011‐12
Hispanic
Hispanic White
86% 87%
0%
20%
40%
60%
80%
100%
2010‐11 2011‐12
Multi‐Ethnic/Racial
Multi‐Racial White
86% 87%
0%
20%
40%
60%
80%
100%
2010‐11 2011‐12
Pacific Islander
Pacific Islander White

BOARD POLICY
CASH MANAGEMENT
8.20.010-P
Portland Public Schools Page 1 of 10 Portland, Oregon
I. Scope and Pooling of Funds This cash management policy applies to all cash activities and funds under the control of Multnomah County School District No. 1J (“the District”). This policy applies to the investment of operating funds, capital funds including bond proceeds, and bond reserve funds held by Portland Public Schools. This policy excludes petty cash activities. The average size of the District’s investment portfolio approximates $125,000,000, with an approximate seasonal high and low of $200,000,000 and $30,000,000, respectively. Average ranges do not include proceeds of General Long-Term Obligation Bonds, notes etc., if any.
II. General Objectives It is the District’s policy to invest public funds not required for immediate expenditure in a manner which will provide safety of principal, maintenance of a liquid position, and the maximum return on cash invested, while meeting daily cash flow demands and conforming to Oregon Revised Statutes (ORS). The primary objectives, in priority order, of investment activities shall be safety, liquidity, and yield, with each objective discussed below. 1. Safety
Safety of principal is the foremost objective of the investment program. Investments shall be undertaken in a manner that seeks to ensure the preservation of capital in the overall portfolio. The object will be to mitigate both credit and interest rate risks.
(a) Credit Risk
The District will minimize the risk of loss due to the financial failure of the security issuer or backer, by:
Concentrating its investments in the safest types of securities.
Pre-qualifying the financial institutions, brokers/dealers, intermediaries, and advisers with which the District will do business.
Diversifying the investment portfolio to minimize potential losses.
Actively monitoring the investment portfolio holdings for changes in credit ratings and economic / market conditions.
(b) Interest Rate Risk
The District will minimize the risk of market value decline by:
Structuring the investment portfolio so that maturing securities meet cash requirements for ongoing operations and/or capital projects, thereby avoiding the need to sell securities on the open market prior to maturity.
Investing operating funds primarily in shorter-term securities or short-term

BOARD POLICY
CASH MANAGEMENT
8.20.010-P
Portland Public Schools Page 2 of 10 Portland, Oregon
investment pools. 2. Liquidity
The investment portfolio shall be kept sufficiently liquid to meet all operating requirements that may be reasonably anticipated. This is accomplished by structuring the portfolio so that securities mature concurrent with cash needs to meet anticipated demands (static liquidity). Since all possible cash demands cannot be anticipated, the portfolio shall consist of securit-ies with active secondary or resale markets (dynamic liquidity). A portion of the portfolio may be placed in the Oregon Short-Term Funds, or similar investment offering next-day liquidity.
3. Yield
The investment portfolio shall be designed with the objective of attaining a market rate of return throughout budgetary and economic cycles, taking into account the investment risk constraints and liquidity needs. High returns on investments are of secondary importance compared to the safety and liquidity objectives described above. The majority of the portfolio is limited to highly-rated / low-risk securities in anticipation of earning a fair return relative to the risk being assumed. Securities shall not be sold prior to maturity, unless:
A security with a declining credit rating may be sold early to prevent or minimize loss of principal.
An unanticipated cash demand requires that the security be sold.
A security swap would improve the quality, yield, or target duration of the portfolio. Security swaps will be made only with specific approval of the CFO or, if
absent, the CFO’s designee.
III. Standards of Care 1. Prudence
The standard of prudence to be used by investment officials shall be the “prudent person” standard and shall be applied in the context of managing an overall portfolio. Investment officers acting in accordance with written procedures and this investment policy, and exercising due diligence, shall be relieved of personal responsibility. Investments shall be made with judgment and care, under circumstances then prevailing, which persons of prudence, discretion and intelligence exercise in the management of their own affairs, not for speculation, but for investment, considering the probable safety of their capital as well as the probable income to be derived.
2. Ethics and Conflicts of Interest Officers and employees in the investment process shall refrain from personal business activity that could conflict with the proper execution and management of the investment pro-gram or that could impair their ability to disclose any material interest in financial institutions with which they conduct business. They shall further disclose any personal / financial / investment positions that could be related to the performance of the investment portfolio.

BOARD POLICY
CASH MANAGEMENT
8.20.010-P
Portland Public Schools Page 3 of 10 Portland, Oregon
Employees, officers, and their families shall refrain from undertaking personal investment transactions with the same individual with whom business is conducted on behalf of the District. Officers and employees shall, at all times, comply with the State of Oregon Government Standards and Practices code of ethics set forth in ORS Chapter 244.
3. Responsibility
The District’s Board delegates, through the Superintendent to the Chief Financial Officer (CFO), the responsibility of implementing this policy. Day-to-day administration of this investment policy shall be managed by the CFO and dele-gated to his/her designee. The CFO or designee, hereinafter referred to as Investment Officer, shall act in accordance with established written procedures and internal controls for the operation of the investment program consistent with this investment policy. Procedures should include references to: safekeeping, delivery vs. payment, investment accounting, repurchase agreements, wire transfer agreements and collateral/depository agreements. No person may engage in an investment transaction except as provided under the terms of this policy and the procedures established by the Investment Officer. The Investment Officer shall be responsible for all transactions undertaken and shall establish a system of controls to regulate activities of subordinate officials.
IV. Safekeeping and Custody
1. Authorized Financial Dealers and Institutions
A list will be maintained of approved financial institutions authorized to provide investment and safekeeping services. In addition, a list will also be maintained of approved security bro-kers / dealers selected by creditworthiness and other factors considered relevant by the Dis-trict. These may include “primary” dealers or regional dealers that qualify under the Securit-ies and Exchange Commission (SEC) rule 15c3-1 (uniform net capital rule). Qualified deal-ers and brokers will be required to maintain an office in the States of Oregon or Washington. The District will limit all security purchases to institutions on these approved lists. All finan-cial institutions and broker/dealers who wish to qualify for District investment transactions must supply the following, as appropriate:
Audited financial statements.
Proof of Financial Industry Regulatory Authority (FINRA) certification.
Proof of state registration.
Certification of having read and understood the District’s investment policy.
Certification of agreement to comply with the District’s investment policy.
The Investment Officer will conduct an annual review of the financial condition and registra-tion of qualified financial institutions and broker/dealers.
V. Internal Controls
The Investment Officer is responsible for establishing and maintaining an adequate internal con-trol structure designed to reasonably protect the assets of the District from loss, theft or misuse.
BOARD POLICY
CASH MANAGEMENT
8.20.010-P
Portland Public Schools Page 4 of 10 Portland, Oregon
The concept of reasonable assurance recognizes that (1) the cost of a control should not exceed the benefits likely to be derived and (2) the valuation of costs and benefits requires estimates and judgments by management. Accordingly, the Investment Officer shall establish a process for an annual independent review by an external auditor to assure compliance with policies and procedures. The internal controls shall address the following points:
1. Accounting Method
The District shall comply with all required legal provisions and Generally Accepted Accoun-ting Principles (GAAP) relating to investment accounting. These accounting principles are contained in the pronouncements of authoritative bodies including but not necessarily limited to, the Governmental Accounting Standards Board (GASB); the American Institute of Certi-fied Public Accountants (AICPA); and the Financial Accounting Standards Board (FASB).
2. Delivery and Safekeeping
The purchase and sale of securities, repurchase agreements and guaranteed investment contract transactions shall be settled on a delivery-versus-payment basis (DVP) in accordance with ORS 294.145(4), ORS 294.145(5) and GFOA recommended practices. It is the District’s intent that all purchased securities shall be delivered to the district’s third-party custodian in the account name of the district. Sufficient evidence to title shall be consistent with modern investment and commercial practices.
3. Collateralization All bank deposits, time deposits, certificates of deposit, and savings accounts shall be held in qualified Oregon depositories and collateralized in accordance with ORS Chapter 295.
ORS 294.035(3)(j) requires repurchase agreements be limited in maturity to three years and priced according to the written policy of the Oregon Investment Council or the Oregon Short-Term Fund Board. On March 12, 1996, the OSTF Board adopted the following margins:
US Treasuries: 102%.
US Agency discount and coupon securities: 102%.
Mortgage-backed securities, although allowed by ORS Chapter 294, are not allowed as repurchase agreement collateral under this policy.
Prior to entering into any repurchase agreement, a signed Master Repurchase Agreement must be in place between the District and the securities dealer. At a minimum, the District will monitor the collateral requirements weekly for guaranteed investment contracts.
4. Pooling of Funds
Except for cash in certain restricted and special funds, the District will consolidate cash bal-ances from all funds to maximize investment earnings. Investment income will be allocated to the various funds based on their respective participation and in accordance with GAAP.

BOARD POLICY
CASH MANAGEMENT
8.20.010-P
Portland Public Schools Page 5 of 10 Portland, Oregon
VI. Suitable and Authorized Investments The following investments will be permitted by this policy and are authorized for investment under ORS 294.035, ORS 294.046, ORS 294.052, ORS 294.805 and 294.810:
1. U.S. Treasury securities and other lawfully issued general obligations of the United States, including general obligations of agencies and instrumentalities of the United States or enterprises sponsored by the United States government.
2. Debt of the agencies and instrumentalities of the states of Oregon, California, Idaho and Washington and their political subdivisions.
3. Time deposit open accounts, certificates of deposit, share accounts and savings accounts.
4. Bankers’ acceptances. 5. Corporate indebtedness. 6. Repurchase agreements. 7. Oregon Short-Term Fund, also known as Local Government Investment Pool (“LGIP”). 8. The District may invest up to 100% of the proceeds from any bond issue in investment
agreements that meet the requirements of ORS 294.052 and the repurchase agreement collateral requirements and restrictions of this policy.
9. Demand checking accounts are excluded from this policy scope.
VII. Investment Parameters 1. Diversification
Investments shall be diversified by:
Limiting investments to avoid over-concentration in securities from a specific issuer or business sector (excluding U.S. Treasury securities);
Investing in securities that have high credit quality;
Limiting investments in securities with high interest-rate risk, such as variable-rate securities;
Investing in securities with varying maturities; and
Continuously investing a portion of the portfolio in ready available funds such as the Oregon Short-Term Fund (or LGIP).
2. Maximum Maturities and Percentage of Investments by Type
The maximum percentages for direct investments of surplus funds are as shown in the chart below. Surplus funds are defined as the sum of all investments, cash balances, deposit bal-ances of all types, and LGIP balances. The maximum maturity is measured from the settle-ment date of the investment transaction. Capital project funds are funds specifically dedicated to capital projects, and will typically include proceeds from the District’s bond sales. All bond fund reserves will be considered to be capital project funds. With Board approval, the District may designate other funds as capital project funds. Operating funds are all surplus funds that are not capital project funds. Per subsection 4 of this section, Credit Ratings, minimum ratings are required on certain investments pursuant to ORS 294.035.

BOARD POLICY
CASH MANAGEMENT
8.20.010-P
Portland Public Schools Page 6 of 10 Portland, Oregon
Security
Maximum % of Total Portfolio Maximum Maturity
US Treasury Bills, Notes and
Bonds, 100% 18 months for operating and Obligations secured by the
US funds; 5 years for Treasury capital project funds
US Government Agencies and 100% 18 months for operating
Instrumentalities, including funds; 5 years for Government-Sponsored
Enterprises capital project funds
State and Local Government Securities 30% 18 months for operating
funds; 5 years for capital project funds
Time Certificates of Deposit 50% 18 months
Repurchase Agreements 25% 30 days
Bankers Acceptances 25% 6 months
Corporate Indebtedness 35% 18 months (commercial paper and bonds)
OSTF – Local Government Pool Pool
Investment Pool Limit Maximum
In order to achieve issuer diversification, this policy sets limits on the maximum holdings by issuer for certain investment types.
There shall be a limit of 50% of the portfolio held in securities issued by any single US government agency.
Time certificates of deposit and bankers acceptances can all be issued by a single banking institution. In order to avoid over-concentration in a single banking institu-tion, there shall be a limit of 10% for overall holdings in one institution.
In addition to this policy, ORS 294.035 limits investments in corporate indebtedness to 35% of the total investment portfolio, with no more than 5% of total funds invested in a single corporate entity and its affiliates or subsidiaries.
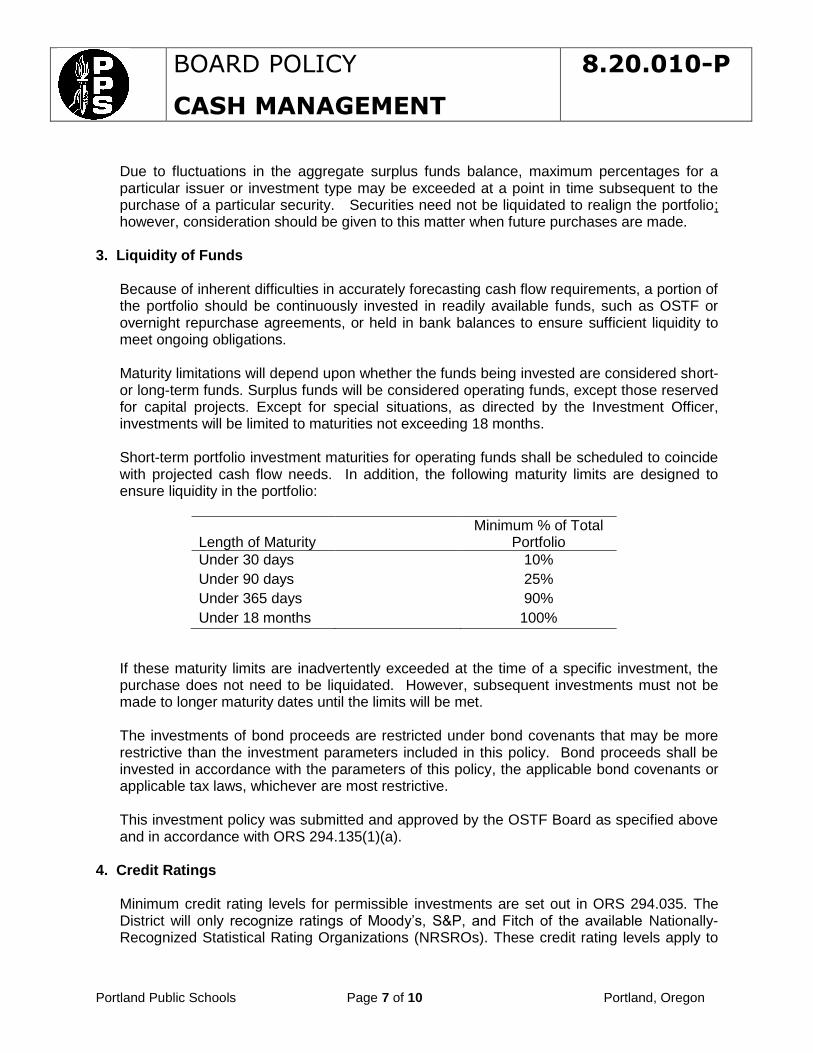
BOARD POLICY
CASH MANAGEMENT
8.20.010-P
Portland Public Schools Page 7 of 10 Portland, Oregon
Due to fluctuations in the aggregate surplus funds balance, maximum percentages for a particular issuer or investment type may be exceeded at a point in time subsequent to the purchase of a particular security. Securities need not be liquidated to realign the portfolio; however, consideration should be given to this matter when future purchases are made.
3. Liquidity of Funds
Because of inherent difficulties in accurately forecasting cash flow requirements, a portion of the portfolio should be continuously invested in readily available funds, such as OSTF or overnight repurchase agreements, or held in bank balances to ensure sufficient liquidity to meet ongoing obligations.
Maturity limitations will depend upon whether the funds being invested are considered short-or long-term funds. Surplus funds will be considered operating funds, except those reserved for capital projects. Except for special situations, as directed by the Investment Officer, investments will be limited to maturities not exceeding 18 months.
Short-term portfolio investment maturities for operating funds shall be scheduled to coincide with projected cash flow needs. In addition, the following maturity limits are designed to ensure liquidity in the portfolio:
Length of Maturity
Minimum % of Total Portfolio
Under 30 days 10%
Under 90 days 25%
Under 365 days 90%
Under 18 months 100%
If these maturity limits are inadvertently exceeded at the time of a specific investment, the purchase does not need to be liquidated. However, subsequent investments must not be made to longer maturity dates until the limits will be met. The investments of bond proceeds are restricted under bond covenants that may be more restrictive than the investment parameters included in this policy. Bond proceeds shall be invested in accordance with the parameters of this policy, the applicable bond covenants or applicable tax laws, whichever are most restrictive. This investment policy was submitted and approved by the OSTF Board as specified above and in accordance with ORS 294.135(1)(a).
4. Credit Ratings
Minimum credit rating levels for permissible investments are set out in ORS 294.035. The District will only recognize ratings of Moody’s, S&P, and Fitch of the available Nationally-Recognized Statistical Rating Organizations (NRSROs). These credit rating levels apply to
BOARD POLICY
CASH MANAGEMENT
8.20.010-P
Portland Public Schools Page 8 of 10 Portland, Oregon
the security at the transaction settlement date. If a security’s credit rating is subsequently down-graded below the minimum rating level for a new investment of that security, the Investment Officer shall evaluate, on a case-by-case basis, in order to determine if the security should be held or sold. The Investment Officer shall notify the CFO or his/her designee about the credit rating downgrade and whether the decision was made to sell or hold the security.
5. Securities Lending and Reverse Repurchase Agreements
The District shall not lend securities nor directly participate in a securities lending or reverse repurchase program.
6. Bids and Offers
Before any security purchase or sale is initiated, the Investment Officer shall determine the appropriateness of seeking competitive bids or offers. Information about current market interest rate levels can be obtained from various sources, including investment dealers, financial websites and publications, and other sources. Factors to consider include where the securities are held, the size of the transaction, and the term to maturity. In the event competitive bids or offers are not considered, the decision not to do so shall be documented. When required by applicable tax laws or bond covenants, competitive bids and offers shall be sought for security purchases and sales of bond funds.
VIII. Reporting
1. Methods
The Investment Officer shall prepare a quarterly report, including a management summary that provides an analysis of the status of the current investment portfolio and transactions made over the last period. This management summary will be prepared in a manner which will allow the District to ascertain whether investment activities during the reporting period have conformed to this policy. The report shall be provided to the Board at least annually in accordance with ORS 294.155 and more frequently as the Board requests. The report will include the following:
List of transactions occurring during the reporting period
List of individual securities held at the end of the reporting period.
Average weighted yield to maturity of portfolio on investments as compared to applicable benchmark(s).
List of investments by maturity date (or call date, as appropriate).
Percentage of the total portfolio that each type of investment represents along with the percentages authorized in this policy.
Performance relative to benchmark(s). 2. Performance Standards
The investment portfolio will be managed in accordance with the parameters specified within
BOARD POLICY
CASH MANAGEMENT
8.20.010-P
Portland Public Schools Page 9 of 10 Portland, Oregon
this policy. The performance of the District’s portfolio shall be measured against the perform-ance of the Oregon Short-Term Fund, 90-day agencies, and 90-day treasuries. The average monthly net yield of the District’s portfolio shall be used for such evaluation. Because bond proceeds are expected to be invested at the time they are received, and are therefore invested in the interest rate environment that exists at that point in time, that portion of the portfolio will be excluded from ongoing benchmark performance measurement.
3. Mark to Market
The market value of the portfolio shall be calculated, and a statement of the market value of the portfolio issued, at least monthly. This will ensure that review of the investment portfolio, in terms of value and price volatility, has been performed consistent with the GFOA Recom-mended Practice on “Mark to Market Practices for State and Local Government Investment Portfolios and Investment Pools.” This “Mark to Market” analysis is provided by the District’s third-party investment custodial safekeeping agent.
IX. Administration of Cash Management Program
1. Objectives. The District’s objectives are to comply with both the letter and spirit of Board policy in a manner that permits efficient use of District resources and effective management control.
2. Deposits.
All District monies from all sources, however small in amount, are to be deposited daily into the designated bank account. Arrangements shall be made to receive large amounts of money, such as bond settlements and recurring receipts, via wire/ACH transfers.
3. Payments.
All payments shall be made when approved and due, but not before they are due. Cash discounts will be analyzed to determine the cost/benefit of payment terms in relation to investment opportunities. No payments of any kind will be made from un-deposited cash.
4. Commitments.
Purchase commitments shall be made so that the time between receipt of items and services and the need for these items and services is minimized and monies are therefore not prematurely removed from investment availability.
5. Cash Flow.
A cash flow projection shall be prepared at the start of each fiscal year, indicating planned cash receipts and disbursements by month. This projection shall be approved by the CFO.
6. Daily Cash Control.
BOARD POLICY
CASH MANAGEMENT
8.20.010-P
Portland Public Schools Page 10 of 10 Portland, Oregon
The District’s staff is to account for cash balances daily by financial institution.
X. Banking Relationships
Banking services will be engaged by the District based solely on considerations of availability of required services, cost of those services, and any applicable legal requirements. Banking services will be engaged based on an open bidding process conducted at least once every ten (10) years and reviewed annually for continuing validity. The District will use one bank as its primary depository institution. The District may use different banks or financial institutions for investment purposes than those used for depository purposes.
XI. District Bank Account Administration
The CFO is the only officer with authority to direct a bank to open or close an account, and any additions of new, or deletions of existing, bank accounts will be at his / her direction. All District bank accounts will have at least two authorized signers at all times. Student Body Accounts will require two original physical signatures on all checks, while disbursements from the District’s primary accounts (Accounts Payable, Payroll, Risk Management) may be issued with electronic signature (ORS 294.120, Use of Facsimile Signatures). The CFO’s is the only authorized electronic signature.
XII. Policy Adoption and Re-Adoption This investment policy shall be reviewed on an annual basis by the Investment Officer, who shall submit the policy and proposed revisions to the OSTF if required. The policy and any revisions shall be presented annually to the Portland Public Schools Board of Education, which will review and approve the investment policy, and any revisions, annually. END OF POLICY Legal References;
ORS Chapters 244, 294 and 295


Board of Education Staff Report to the Board
Reviewed and Approved by Executive Committee Lead
Board Meeting Date: May 6, 2013 Executive Committee Lead: C. J. Sylvester Chief Operating Officer Department: Facilities & Asset Management Presenter/Staff Lead: Tony Magliano
Deputy Chief Operating Officer
BACKGROUND The Board of Education adopted the Capital Asset Renewal (CAR) Policy in January 2012. The CAR Policy directed the establishment of a Capital Asset Renewal Fund, directing the use of certain revenues for the funds, and directing the development of a Capital Asset Renewal Plan for the life-cycle renewal of major building components. In an attachment to the Staff Report to the Board of Education, staff included a representative sample of the various revenue streams that could be used to fund the CAR Fund upon adoption of the CAR Policy. The Construction Excise Tax (CET) Fund 404 was identified as one of the revenue streams for the CAR Fund. The CET provides revenue to the district for capital construction projects. The attachment (provided as “Attachment A” for reference) identified beginning balances of each revenue stream and predicted yearly revenue over a twenty year period. The portion of the beginning balance of the CET set aside for the CAR Fund was intentionally less than the total balance available in the CET Fund. The intent of not including the entire CET Fund balance into the CAR Fund was to provide the district with the ability and flexibility to meet other capital requirements that exist outside of those eligible under the CAR Policy. The purpose of the attached draft resolution is to clarify language in the current Board adopted Capital Asset Renewal (CAR) Policy. This language is consistent with the intent of the original staff report and attachment that accompanied the CAR authorizing resolution to the Board, but was not clearly articulated in the adopted policy. RELATED POLICIES / BOARD GOALS AND PRIORITIES The proposed clarifying language to the CAR Policy is consistent with: 1) The intent of the original staff report and attachment that accompanied the CAR
authorizing resolution to the Board. 2) The desire of the community to physically maintain our existing buildings.
SUBJECT: Capital Asset Renewal (CAR) Policy Clarification

CAR Clarification Page 2 of 2
3) Board Policy 8.70.042-P Dedicated Reserve for Income from Disposition of Surplus Real Properties. This Policy allows for the use of revenues from the sale or other disposition of surplus properties to be dedicated to a special reserve fund (or general fund) and used to support the district’s capital improvement needs (among several other purposes).
3) Board Policy 8.80.010-P High Performance Facility Design. This Policy calls for
the district to “plan for and seek additional sources of funds to support…preservation, high quality maintenance, renovation, or replacement of its capital stock.”
PROCESS / COMMUNITY ENGAGEMENT Staff sought input on the preliminary plan from outside financial experts including the Portland Business Alliance and the Building Owners and Managers Association. Because the current policy clarification is a capital renewal planning proposal and an internal financial procedure with expenditures subject to the annual District budget process, no general community input was sought. ALIGNMENT WITH EQUITY POLICY IMPLEMENTATION PLAN The purpose of this policy is to enhance the district’s ability to provide equitable student access to high quality, culturally relevant instruction & resources. BUDGET / RESOURCE IMPLICATIONS The acceptance of this proposed language clarification would not change the estimated revenue from the Construction Excise Tax identified as a funding source for the CAR Plan. In fact, it would give the district flexibility in addressing other capital needs in existing buildings not currently included in the CAR Plan. NEXT STEPS / TIMELINE / COMMUNICATION PLAN A first reading of the resolution is planned for May 20 2013 and second reading of the resolution is planned for June 17, 2013. QUESTIONS FOR BOARD DISCUSSION Does the Board concur with the draft language clarification? ATTACHMENTS A. 20-Year Capital Asset Renewal Plan for Rebuilt Schools B. Draft Resolution

REPRESENTATIVE EXAMPLE20-Year Capital Asset Renewal Plan for Rebuilt Schools September 3, 2011
Year End
Buildings Capital Expense CET Revenue Fund 404 (Note 1)
RZB (Note 2)
Interest Earned Lease Revenue (Note 3)
Athletic Field Revenue (Note 4)
Surplus Sales (Note 5)
Total Revenue (Note 6)
ISF Balance (Note7)
2011 2 $2,476,972 $6,083 $2,483,055 2012 1 $1,500,000 $9,097 $125,400 $2,000,000 $3,634,497 $2,483,0552013 (6,052) $1,500,000 $18,176 $125,400 $1,643,576 $6,117,5522014 2 (88,829) $1,500,000 $22,622 $125,400 $1,648,022 $7,755,0772015 4 (190,712) $1,500,000 $35,746 $125,400 $1,661,146 $9,314,2692016 1 (95,922) $1,500,000 $41,264 $215,377 $293,175 $2,049,816 $10,784,7032017 1 (844,418) $1,500,000 $46,927 $221,839 $293,175 $2,061,941 $12,738,5972018 1 (6,144) $3,000,000 $68,655 $228,494 $293,175 $3,590,324 $13,956,1202019 (509,469) $3,000,000 $83,382 $235,349 $293,175 $3,611,906 $17,540,3002020 2 (1,799,964) $3,000,000 $95,536 $242,409 $293,175 $3,631,120 $20,642,7372021 4 (4,095,327) $3,000,000 $122,120 $249,681 $293,175 $3,664,976 $22,473,8932022 1 (1,534,856) $3,000,000 $129,250 $257,172 $293,175 $3,679,597 $22,043,5422023 1 (2,659,371) $3,000,000 $1,200,000 $145,766 $264,887 $293,175 $4,903,828 $24,188,2832024 1 (2,117,247) $3,000,000 $1,200,000 $188,612 $272,834 $293,175 $4,954,621 $26,432,7402025 (3,187,077) $3,000,000 $1,200,000 $207,435 $281,019 $293,175 $4,981,629 $29,270,1142026 2 (6,930,962) $3,500,000 $1,200,000 $218,941 $289,449 $293,175 $5,501,565 $31,064,6662027 4 (6,835,954) $3,500,000 $1,200,000 $249,135 $298,133 $293,175 $5,540,443 $29,635,2692028 1 (6,472,568) $3,500,000 $1,200,000 $231,755 $307,077 $293,175 $5,532,007 $28,339,7582029 1 (13,215,080) $3,500,000 $1,200,000 $204,694 $316,280 $293,175 $5,514,149 $27,399,1982030 (20,380,810) $3,500,000 $1,200,000 $144,062 $325,778 $293,175 $5,463,015 $19,698,267Total 29 ($70,970,763) $52,976,972 $9,600,000 $2,269,260 $4,005,778 $4,899,225 $2,000,000 $75,751,235 $4,780,471
Notes1. CET: Construction Excise Tax. $1.5M years 1-7. $3M years 8-15. $3.5M years 16-20.2. Recovery Zone Bond: Energy (Utility Bill) Savings used to pay off Recovery Zone Bond debt redirected toward Capital Maintenance Program3. Lease Revenue: Revenue used for Capital Maintenance from the lease of District property. At a minimum, lease revenue would be base-lined at the FY 11/12 present day value to hold the General Fund 4. Future Athletic Field Lease Revenue Beginning 20125. Estimated Revenue from the Sale of Washington Monroe6. Sum of CET Revenue + RZB + Interest Earned + Lease Revenue + Athletic Field Revenue + Surplus Sales7. Internal Service Fund Balance = Total Revenue - Capital Expense
For more information, contact Facilities and Asset Management, Tony Magliano at 503-916-3401.
Cost Esimates from Archectural Cost Consultants (ACC), Rider Levett Bucknall (RLB) and District internal estimates.

stable.

RESOLUTION No. XXXX
Amending the Board of Education Capital Asset Renewal Funds and Plans Policy
RECITALS
A. The Board identified a need for a sustainable funding strategy to fund the life cycle renewal of major building components the District invested in over the last several years including Rosa Parks and Forest Park as well as for any newly modernized or renovated buildings in the future. Major building components include, but are not limited to, items like roof replacements, athletic field replacements, boiler upgrades, and major mechanical, electrical and plumbing upgrades.
B. The goal of this strategy extends the useful life of District facilities, ensures public capital
investments are properly preserved, and minimizes deferred maintenance costs. C. The Board adopted Resolution No. 4539 establishing the Capital Asset Renewal Funds and
Plans Policy on January 23, 2012. D. The Capital Asset Renewal Funds and Plans Policy as adopted by the Board requires clarifying
language around the use of Construction Excise Tax Fund. E. The currently adopted Capital Asset Renewal Policy language restricts use of the Construction
Excise Tax to projects that meet the criteria identified in recital A. F. Staff’s belief and intent, explicit in the original staff report and its attachments, was that any
Construction Excise Tax balances in excess of those needed to fund the Capital Access Renewal Plan could be used to fund other District capital construction projects.
RESOLUTION The Board of Education Policy on Capital Asset Renewal Funds and Plans is amended as follows (amendments in bold and redactions in strikethrough):
8.70.044 Capital Asset Renewal Funds and Plans
The Board of Education believes that all students deserve a quality learning environment. Consequently, the District should have a plan governing how all physical facilities that house and support the education programs of the District can be continuously maintained, regularly revitalized, and constructed using current best practices and methods that promote student learning. Such a plan should reflect actual funding capacity while supporting the goal of adequate funding to meet this policy goal.
The following policy provides the foundation for the implementation of a strategy designed to extend the useful life of District facilities, ensure public capital investments are properly preserved, and reduce deferred maintenance costs.
Therefore, it is Board Policy that:
1) The Superintendent shall develop a 20 year Capital Asset Renewal Plan (CAR Plan) for Board approval in FY 11-12, with updates at subsequent five year intervals, to provide for life-cycle renewal of major building components the District has invested in over the last several years including Rosa Parks and Forest Park as well as for any newly modernized or renovated buildings in the future. Major building components include, but are not limited to, items like roof replacements, athletic field replacements, boiler upgrades, and major mechanical, electrical and plumbing upgrades.
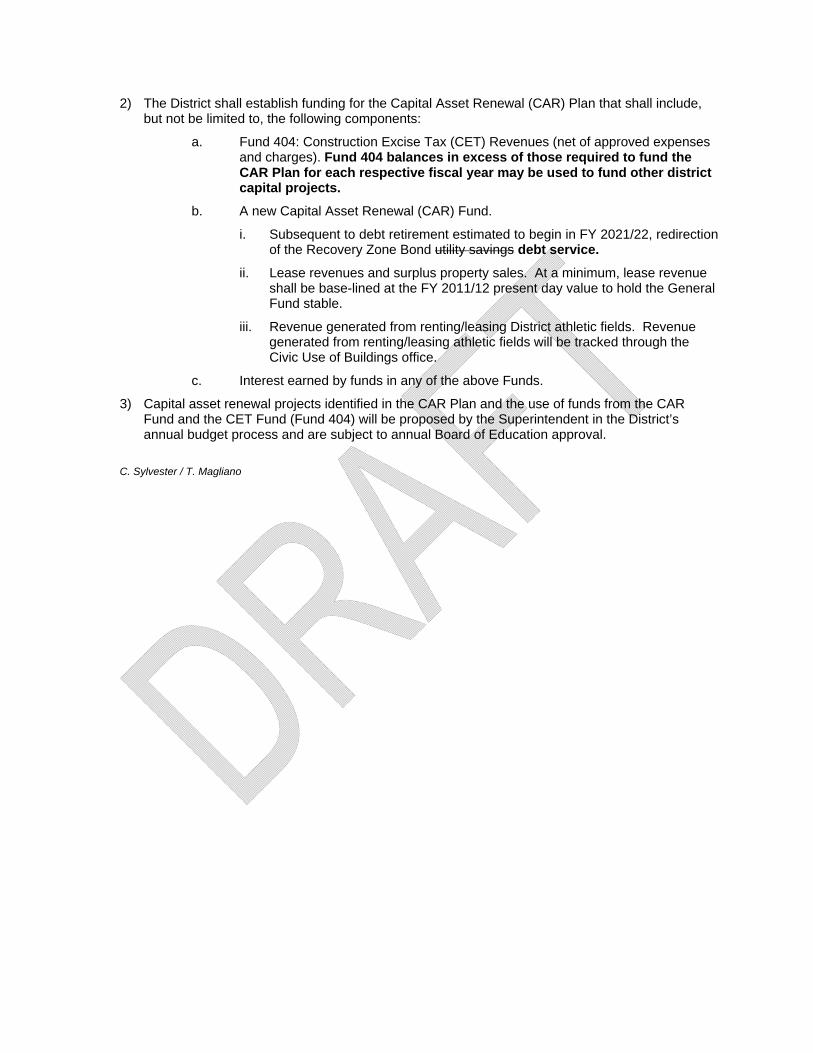
2) The District shall establish funding for the Capital Asset Renewal (CAR) Plan that shall include, but not be limited to, the following components:
a. Fund 404: Construction Excise Tax (CET) Revenues (net of approved expenses and charges). Fund 404 balances in excess of those required to fund the CAR Plan for each respective fiscal year may be used to fund other district capital projects.
b. A new Capital Asset Renewal (CAR) Fund.
i. Subsequent to debt retirement estimated to begin in FY 2021/22, redirection of the Recovery Zone Bond utility savings debt service.
ii. Lease revenues and surplus property sales. At a minimum, lease revenue shall be base-lined at the FY 2011/12 present day value to hold the General Fund stable.
iii. Revenue generated from renting/leasing District athletic fields. Revenue generated from renting/leasing athletic fields will be tracked through the Civic Use of Buildings office.
c. Interest earned by funds in any of the above Funds.
3) Capital asset renewal projects identified in the CAR Plan and the use of funds from the CAR Fund and the CET Fund (Fund 404) will be proposed by the Superintendent in the District’s annual budget process and are subject to annual Board of Education approval.
C. Sylvester / T. Magliano

BOARD OF EDUCATION SCHOOL DISTRICT NO. 1J, MULTNOMAH COUNTY, OREGON
INDEX TO THE AGENDA
REGULAR MEETING
May 6, 2013
Board Action Number Page
Purchases, Bids, Contracts
4754 Personal/Professional Services, Goods, and Services Expenditure Contracts Exceeding $150,000 for Delegation of Authority ........................................................................ 3
Other Matters Requiring Board Approval
4755 Resolution to Celebrate National Teacher Appreciation Week May 6 through 10, 2013 .......... 5

2
Purchases, Bids, Contracts The Superintendent RECOMMENDS adoption of the following item:
Number 4754
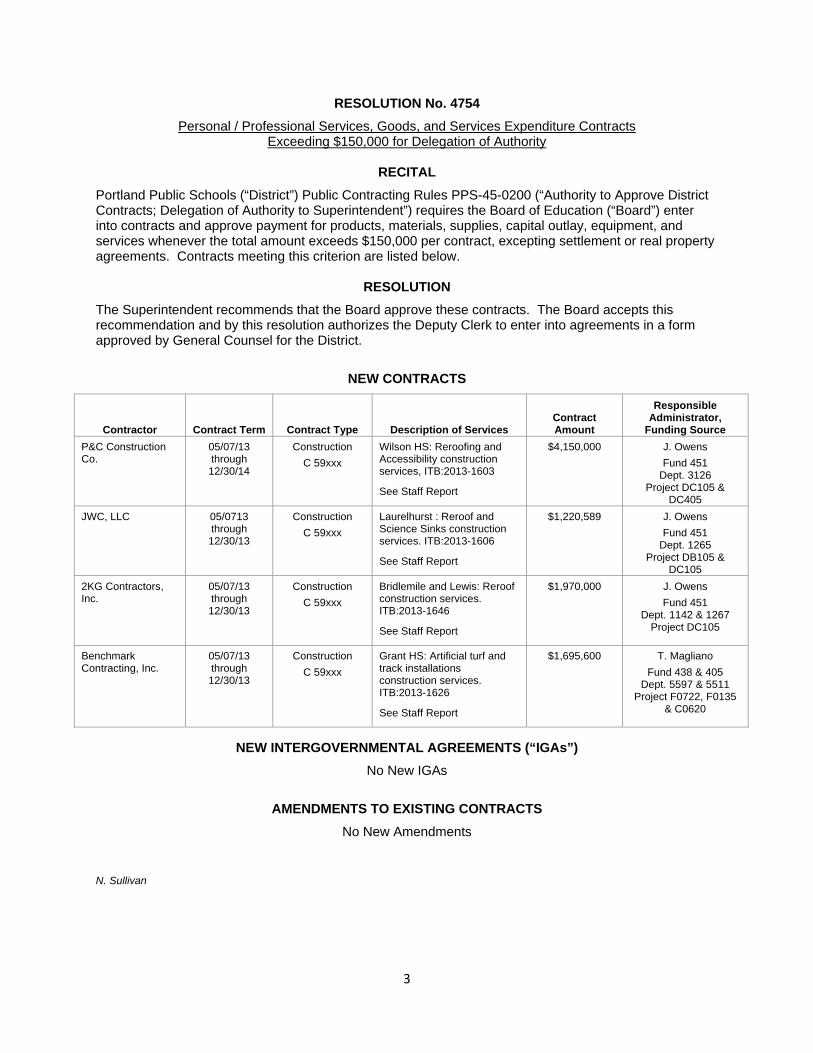
3
RESOLUTION No. 4754
Personal / Professional Services, Goods, and Services Expenditure Contracts Exceeding $150,000 for Delegation of Authority
RECITAL
Portland Public Schools (“District”) Public Contracting Rules PPS-45-0200 (“Authority to Approve District Contracts; Delegation of Authority to Superintendent”) requires the Board of Education (“Board”) enter into contracts and approve payment for products, materials, supplies, capital outlay, equipment, and services whenever the total amount exceeds $150,000 per contract, excepting settlement or real property agreements. Contracts meeting this criterion are listed below.
RESOLUTION
The Superintendent recommends that the Board approve these contracts. The Board accepts this recommendation and by this resolution authorizes the Deputy Clerk to enter into agreements in a form approved by General Counsel for the District.
NEW CONTRACTS
Contractor Contract Term Contract Type Description of Services Contract Amount
Responsible Administrator,
Funding Source
P&C Construction Co.
05/07/13 through 12/30/14
Construction
C 59xxx
Wilson HS: Reroofing and Accessibility construction services, ITB:2013-1603
See Staff Report
$4,150,000 J. Owens
Fund 451 Dept. 3126
Project DC105 & DC405
JWC, LLC 05/0713 through 12/30/13
Construction
C 59xxx
Laurelhurst : Reroof and Science Sinks construction services. ITB:2013-1606
See Staff Report
$1,220,589 J. Owens
Fund 451 Dept. 1265
Project DB105 & DC105
2KG Contractors, Inc.
05/07/13 through 12/30/13
Construction
C 59xxx
Bridlemile and Lewis: Reroof construction services. ITB:2013-1646
See Staff Report
$1,970,000 J. Owens
Fund 451 Dept. 1142 & 1267
Project DC105
Benchmark Contracting, Inc.
05/07/13 through 12/30/13
Construction
C 59xxx
Grant HS: Artificial turf and track installations construction services. ITB:2013-1626
See Staff Report
$1,695,600 T. Magliano
Fund 438 & 405 Dept. 5597 & 5511
Project F0722, F0135 & C0620
NEW INTERGOVERNMENTAL AGREEMENTS (“IGAs”)
No New IGAs
AMENDMENTS TO EXISTING CONTRACTS
No New Amendments
N. Sullivan

4
Other Matters Requiring Board Approval
The Superintendent RECOMMENDS adoption of the following item:
Number 4755

5
RESOLUTION No. 4755
Resolution to Celebrate National Teacher Appreciation Week May 6 through 10, 2013
RECITALS
A. Our 3012 professional teachers, through their expertise and determination, prepare thousands of students in Portland Public Schools each year to succeed in college and career and to become responsible members of our community.
B. The Board of Education acknowledges our teachers in Head Start, preschool, elementary, middle
and high school, special education, English as a second language and alternative education as well as our curriculum coordinators, coaches, librarians, instructional specialists, counselors, psychologists and teachers on special assignment for their commitment to excellence in education for all students of Portland Public Schools.
C. Every day, PPS teachers strive to engage all of their students by offering instruction and
curriculum that are relevant to their lives and by building strong relationships with students that give them the confidence to succeed.
D. Every day, teachers collaborate with students’ families to more deeply understand students’
needs and to nurture teamwork that supports active, engaged learners.
E. Every day, teachers reach outside the classroom to build relationships with community partners that create vibrant and productive learning environments for all students.
RESOLUTION
The Board of Education declares May 6 through 10, 2013 Teacher Appreciation Week in recognition of our teachers’ dedicated efforts to ensure the success of students in Portland Public Schools. S. Murray
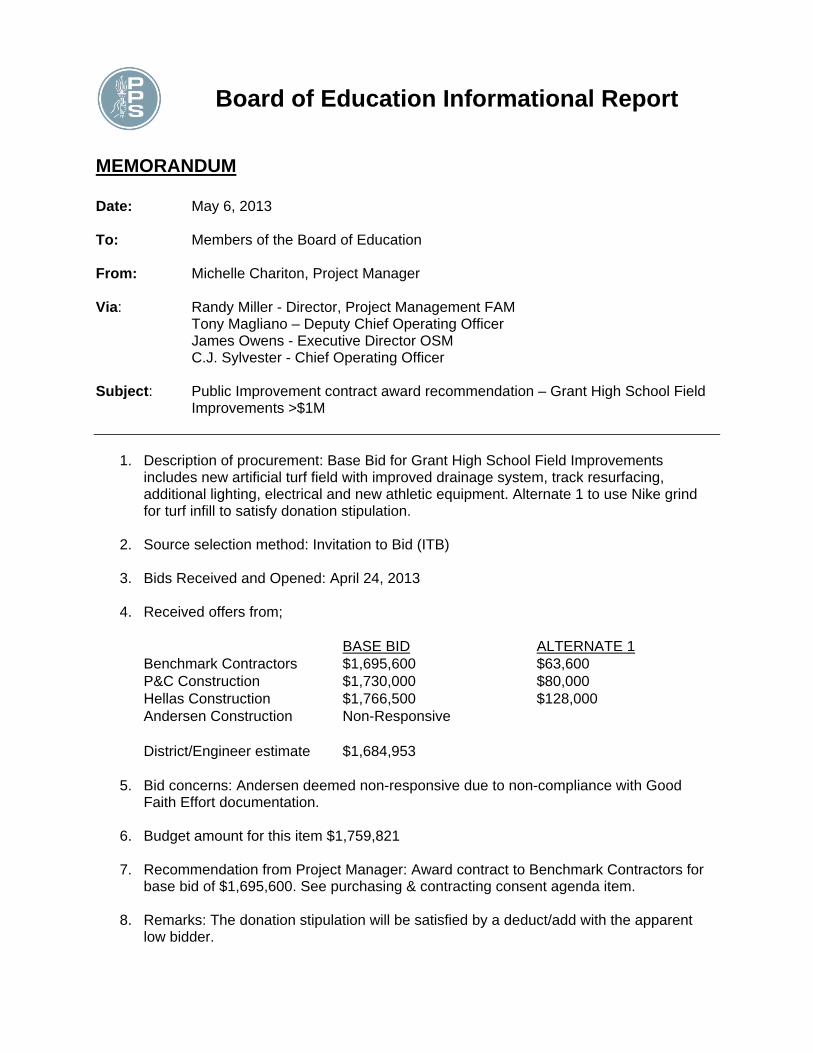
Board of Education Informational Report
MEMORANDUM Date: May 6, 2013 To: Members of the Board of Education From: Michelle Chariton, Project Manager Via: Randy Miller - Director, Project Management FAM Tony Magliano – Deputy Chief Operating Officer
James Owens - Executive Director OSM C.J. Sylvester - Chief Operating Officer
Subject: Public Improvement contract award recommendation – Grant High School Field
Improvements >$1M
1. Description of procurement: Base Bid for Grant High School Field Improvements includes new artificial turf field with improved drainage system, track resurfacing, additional lighting, electrical and new athletic equipment. Alternate 1 to use Nike grind for turf infill to satisfy donation stipulation.
2. Source selection method: Invitation to Bid (ITB)
3. Bids Received and Opened: April 24, 2013
4. Received offers from; BASE BID ALTERNATE 1 Benchmark Contractors $1,695,600 $63,600 P&C Construction $1,730,000 $80,000 Hellas Construction $1,766,500 $128,000 Andersen Construction Non-Responsive District/Engineer estimate $1,684,953
5. Bid concerns: Andersen deemed non-responsive due to non-compliance with Good
Faith Effort documentation.
6. Budget amount for this item $1,759,821
7. Recommendation from Project Manager: Award contract to Benchmark Contractors for base bid of $1,695,600. See purchasing & contracting consent agenda item.
8. Remarks: The donation stipulation will be satisfied by a deduct/add with the apparent low bidder.
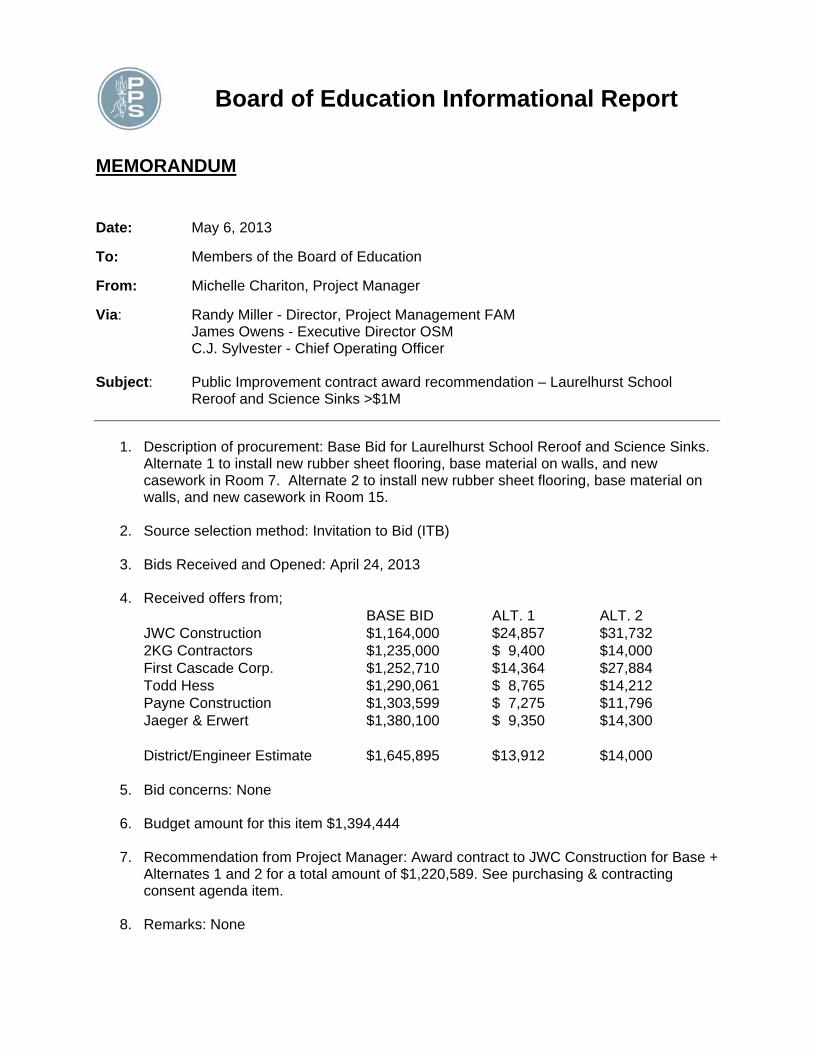
Board of Education Informational Report
MEMORANDUM Date: May 6, 2013
To: Members of the Board of Education
From: Michelle Chariton, Project Manager
Via: Randy Miller - Director, Project Management FAM James Owens - Executive Director OSM C.J. Sylvester - Chief Operating Officer
Subject: Public Improvement contract award recommendation – Laurelhurst School
Reroof and Science Sinks >$1M
1. Description of procurement: Base Bid for Laurelhurst School Reroof and Science Sinks.
Alternate 1 to install new rubber sheet flooring, base material on walls, and new casework in Room 7. Alternate 2 to install new rubber sheet flooring, base material on walls, and new casework in Room 15.
2. Source selection method: Invitation to Bid (ITB)
3. Bids Received and Opened: April 24, 2013
4. Received offers from; BASE BID ALT. 1 ALT. 2 JWC Construction $1,164,000 $24,857 $31,732 2KG Contractors $1,235,000 $ 9,400 $14,000 First Cascade Corp. $1,252,710 $14,364 $27,884 Todd Hess $1,290,061 $ 8,765 $14,212 Payne Construction $1,303,599 $ 7,275 $11,796 Jaeger & Erwert $1,380,100 $ 9,350 $14,300 District/Engineer Estimate $1,645,895 $13,912 $14,000
5. Bid concerns: None
6. Budget amount for this item $1,394,444
7. Recommendation from Project Manager: Award contract to JWC Construction for Base + Alternates 1 and 2 for a total amount of $1,220,589. See purchasing & contracting consent agenda item.
8. Remarks: None
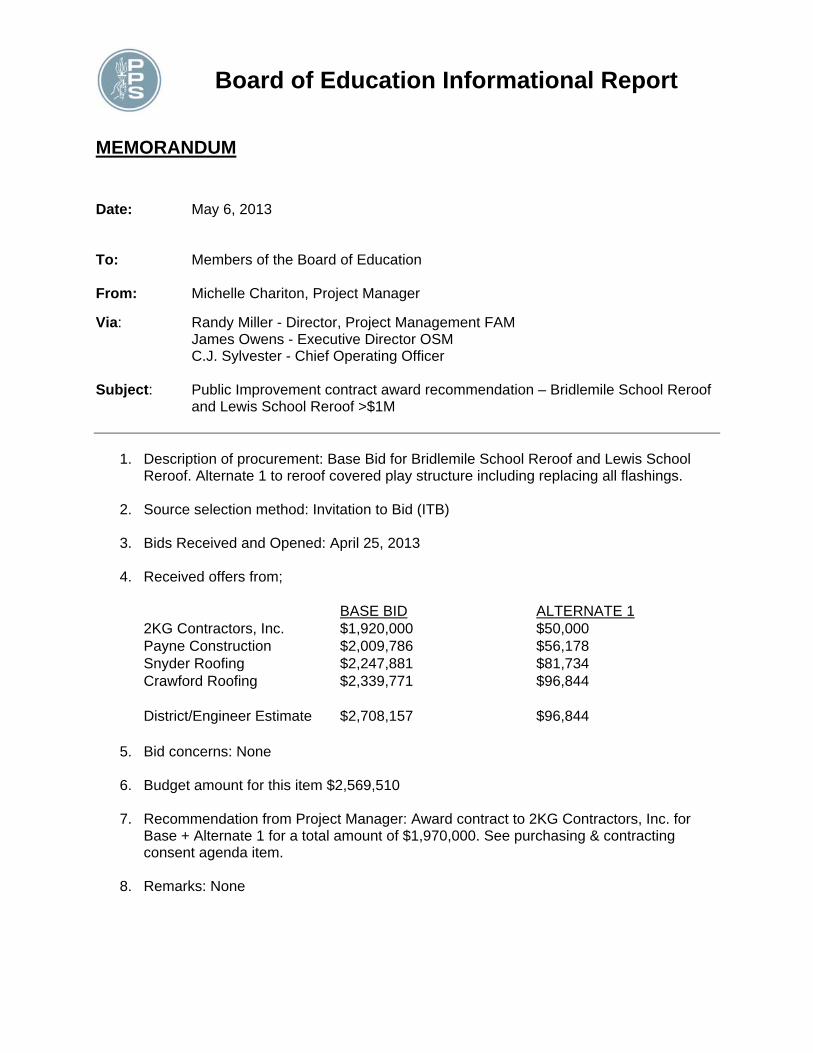
Board of Education Informational Report
MEMORANDUM Date: May 6, 2013 To: Members of the Board of Education From: Michelle Chariton, Project Manager
Via: Randy Miller - Director, Project Management FAM James Owens - Executive Director OSM C.J. Sylvester - Chief Operating Officer
Subject: Public Improvement contract award recommendation – Bridlemile School Reroof
and Lewis School Reroof >$1M
1. Description of procurement: Base Bid for Bridlemile School Reroof and Lewis School Reroof. Alternate 1 to reroof covered play structure including replacing all flashings.
2. Source selection method: Invitation to Bid (ITB)
3. Bids Received and Opened: April 25, 2013
4. Received offers from; BASE BID ALTERNATE 1 2KG Contractors, Inc. $1,920,000 $50,000 Payne Construction $2,009,786 $56,178 Snyder Roofing $2,247,881 $81,734 Crawford Roofing $2,339,771 $96,844 District/Engineer Estimate $2,708,157 $96,844
5. Bid concerns: None
6. Budget amount for this item $2,569,510
7. Recommendation from Project Manager: Award contract to 2KG Contractors, Inc. for Base + Alternate 1 for a total amount of $1,970,000. See purchasing & contracting consent agenda item.
8. Remarks: None

Board of Education Informational Report
MEMORANDUM Date: May 6, 2013 To: Members of the Board of Education From: Michelle Chariton, Project Manager
Via: Randy Miller - Director, Project Management FAM James Owens - Executive Director OSM C.J. Sylvester - Chief Operating Officer
Subject: Public Improvement contract award recommendation – Wilson High School
Reroof & Accessibility Improvements >$1M
1. Description of procurement: Base Bid for Wilson High School Reroof & Accessibility Improvements. Alternate 1 to add landscaping and hardscape to north entry area. Alternate 2 to add additional work in Life Skills Classroom 141.
2. Source selection method: Invitation to Bid (ITB)
3. Bids Received and Opened: April 24, 2013
4. Received offers from; BASE BID ALTERNATE 1 ALTERNATE 2 P&C Construction $4,029,000 $ 99,000 $22,000 Payne Construction $4,069,548 $130,193 $55,125 2KG Contractors, Inc. $4,150,000 $100,000 $30,000 JWC Construction $4,524,249 $111,629 $37,868 District/Engineer estimate $4,335,841 $ 42,398 $38,000
5. Bid concerns: None
6. Budget amount for this item $3,567,280
7. Recommendation from Project Manager: Award contract to P&C Construction, Inc. for
Base + Alternates 1 and 2 for a total amount of $4,150,000. Although the award recommendation exceeds the budgeted amount, the total construction costs for the Improvement project 2013 is well below the budget. See purchasing & contracting consent agenda item.
8. Remarks: None