Embed Size (px)
Citation preview
IOS: A modeling tool for evaluating environmental and water project effects on
salmon populations
Funded byDepartment of Water ResourcesCalifornia Urban Water Agencies
Metropolitan Water District
All Models Must Have Snappy Acronyms
Interactive Object-oriented Salmon Simulation (IOS)
Alternatives…
Object Oriented Population Simulation (OOPS)
Graphical Integrated Modeling Process (GIMP)
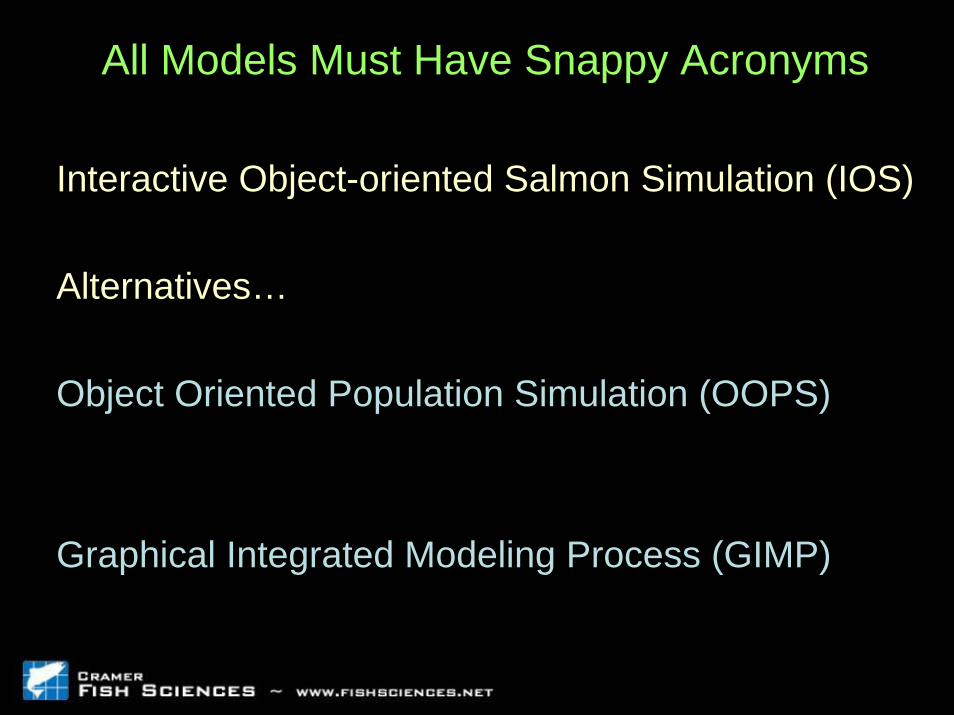
North-of-Delta-Offstream-Storage Project (NODOS)
• Increase water supply and reliability• Improve Delta water quality• Improve system flexibility• Environmental benefits
– Improve cold water reliability– Improve fish passage at RBDD– Reduce May-Sep agricultural diversions – Pulse flows
•• Increase water supply and reliabilityIncrease water supply and reliability•• Improve Delta water qualityImprove Delta water quality•• Improve system flexibilityImprove system flexibility•• Environmental benefitsEnvironmental benefits
–– Improve cold water reliabilityImprove cold water reliability–– Improve fish passage at RBDDImprove fish passage at RBDD–– Reduce MayReduce May--Sep agricultural diversions Sep agricultural diversions –– Pulse flowsPulse flows
Artist’s Conception of Sites Reservoir
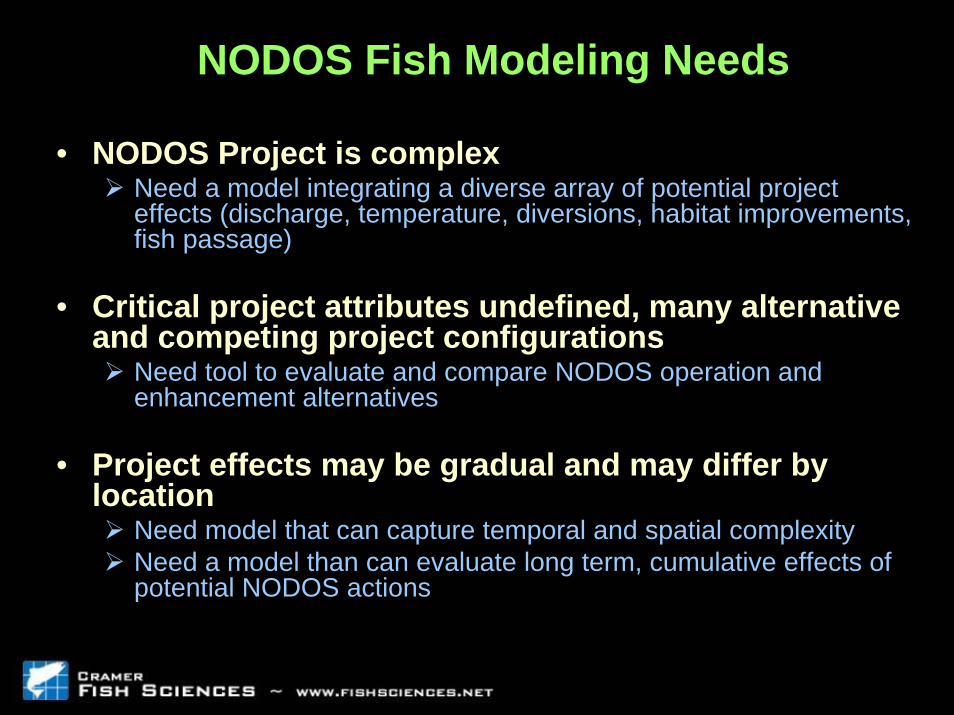
NODOS Fish Modeling Needs
• NODOS Project is complexNeed a model integrating a diverse array of potential project effects (discharge, temperature, diversions, habitat improvements, fish passage)
• Critical project attributes undefined, many alternative and competing project configurations
Need tool to evaluate and compare NODOS operation and enhancement alternatives
• Project effects may be gradual and may differ by location
Need model that can capture temporal and spatial complexityNeed a model than can evaluate long term, cumulative effects of potential NODOS actions
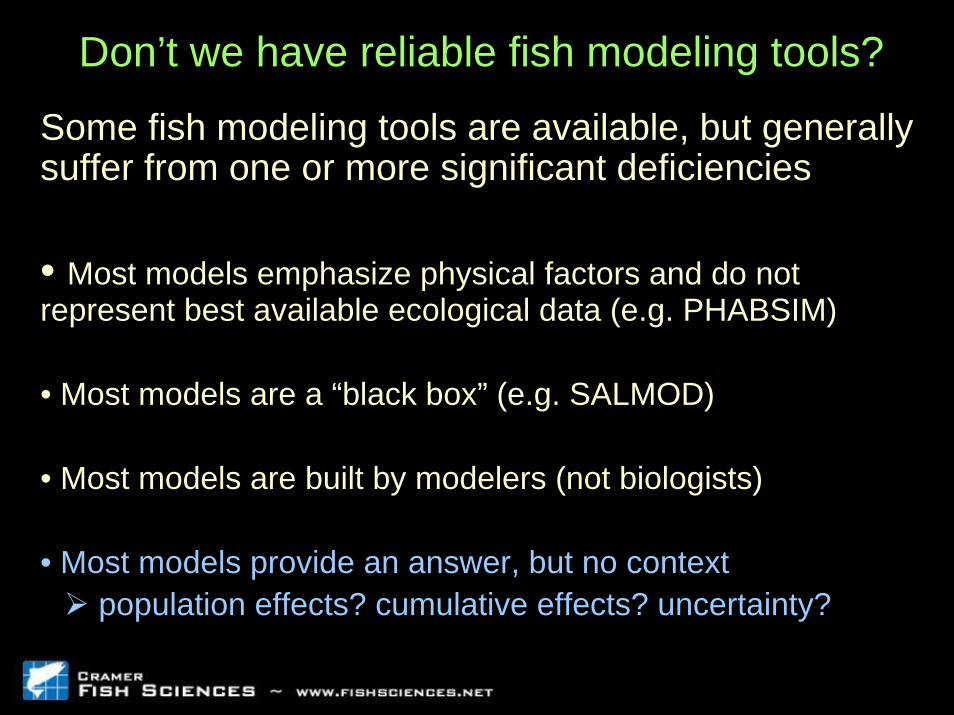
Don’t we have reliable fish modeling tools?
Some fish modeling tools are available, but generally suffer from one or more significant deficiencies
• Most models emphasize physical factors and do not represent best available ecological data (e.g. PHABSIM)
• Most models are a “black box” (e.g. SALMOD)
• Most models are built by modelers (not biologists)
• Most models provide an answer, but no context population effects? cumulative effects? uncertainty?
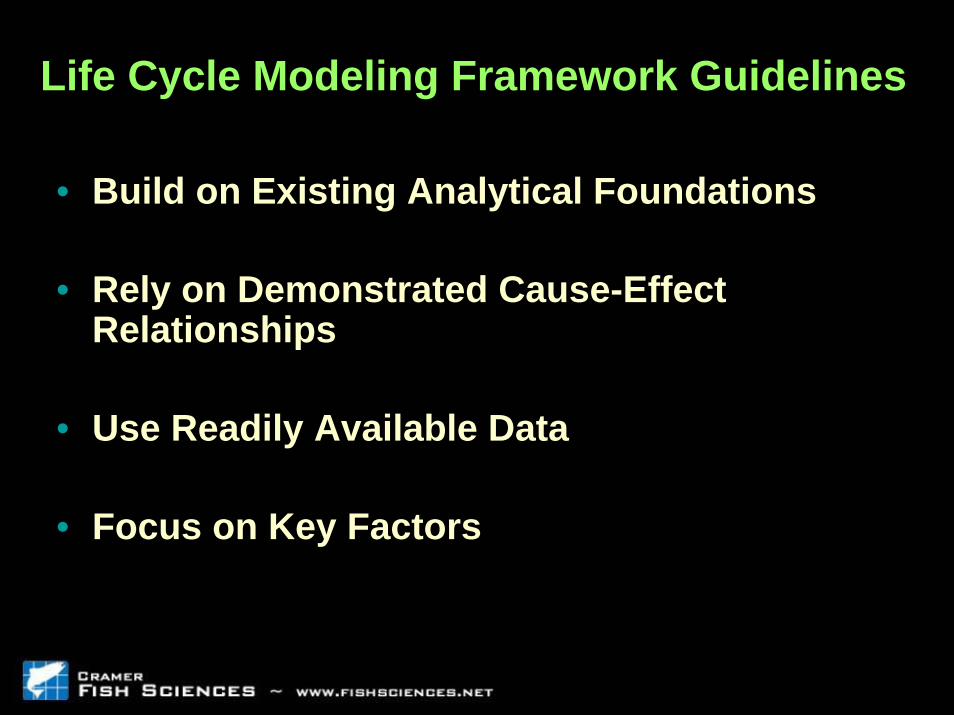
Life Cycle Modeling Framework Guidelines
• Build on Existing Analytical Foundations
• Rely on Demonstrated Cause-Effect Relationships
• Use Readily Available Data
• Focus on Key Factors
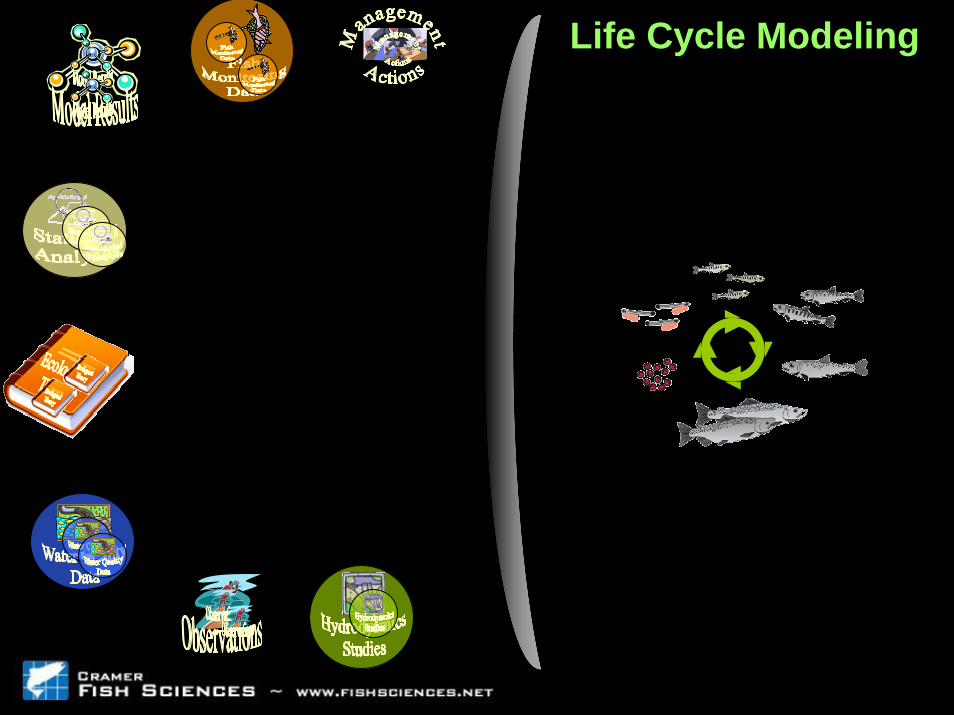
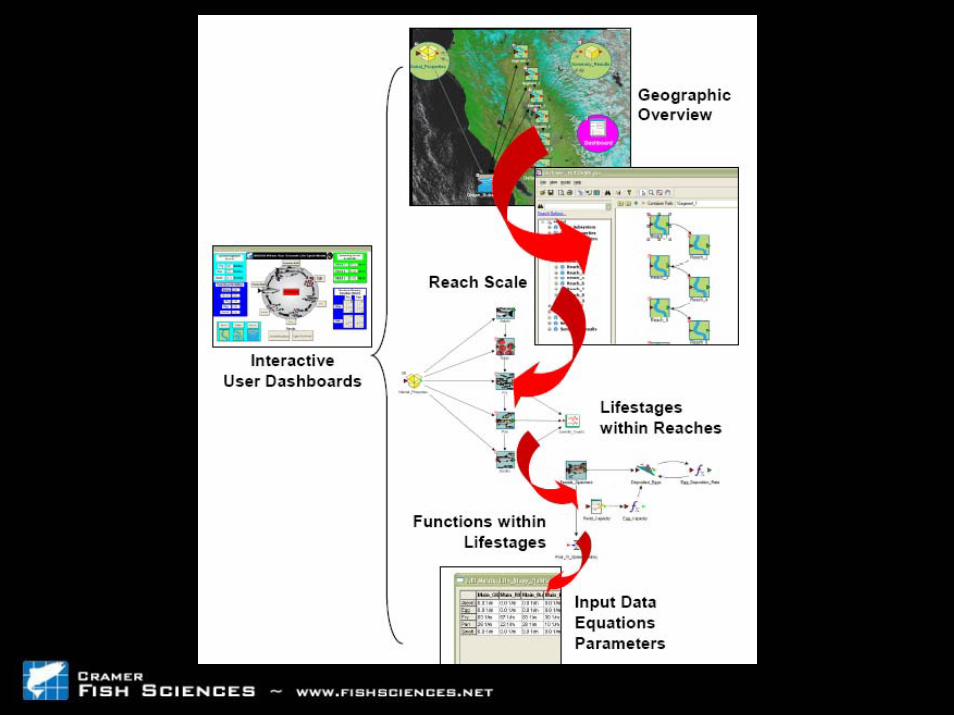
Life Cycle Modeling
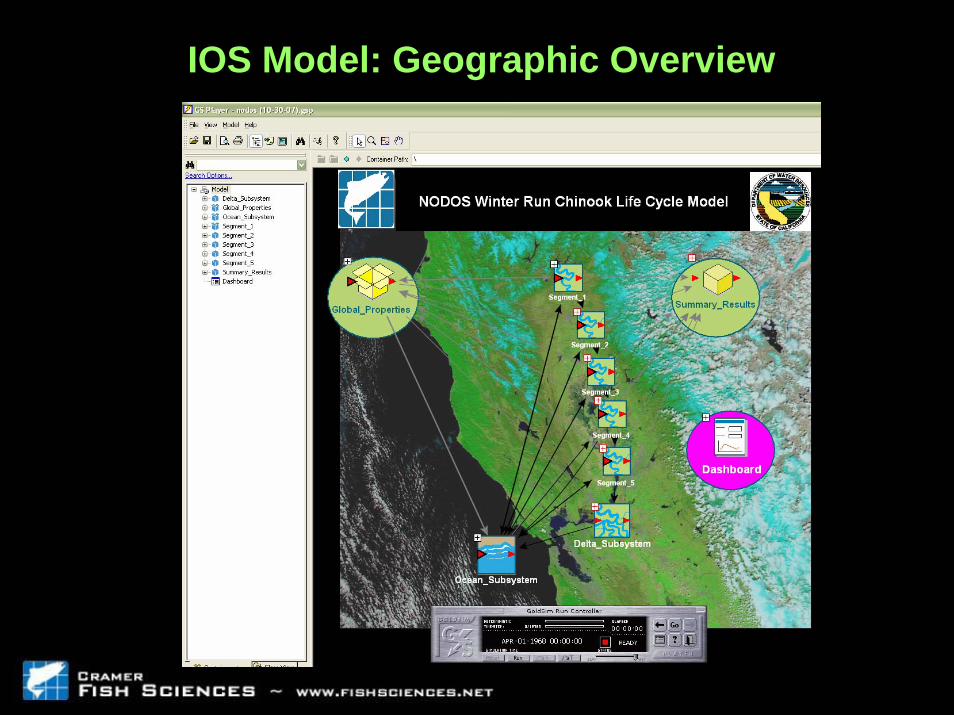
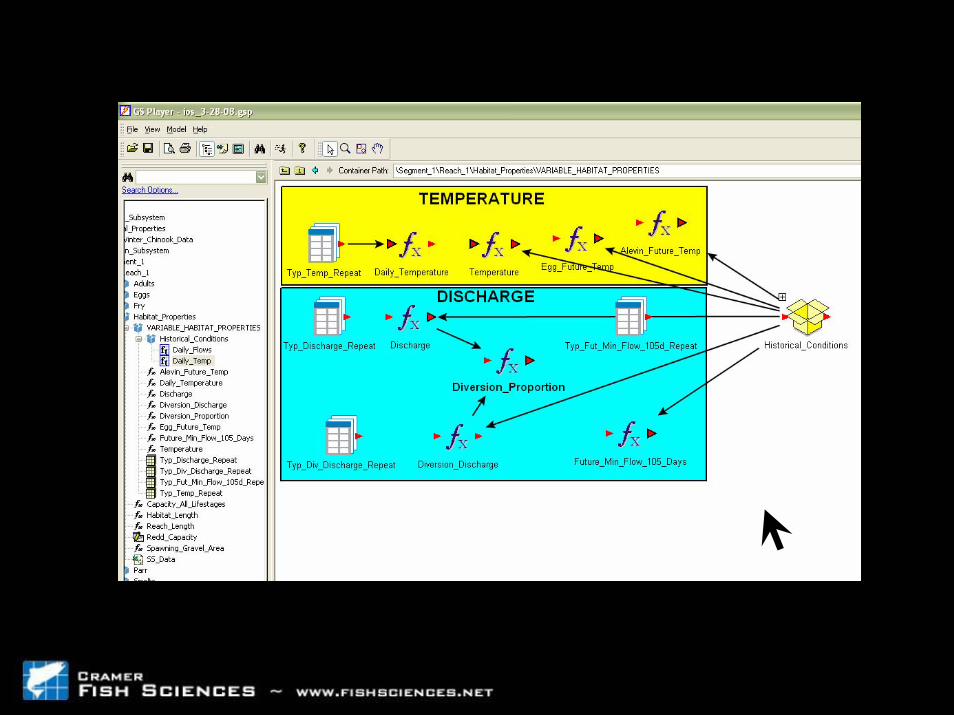
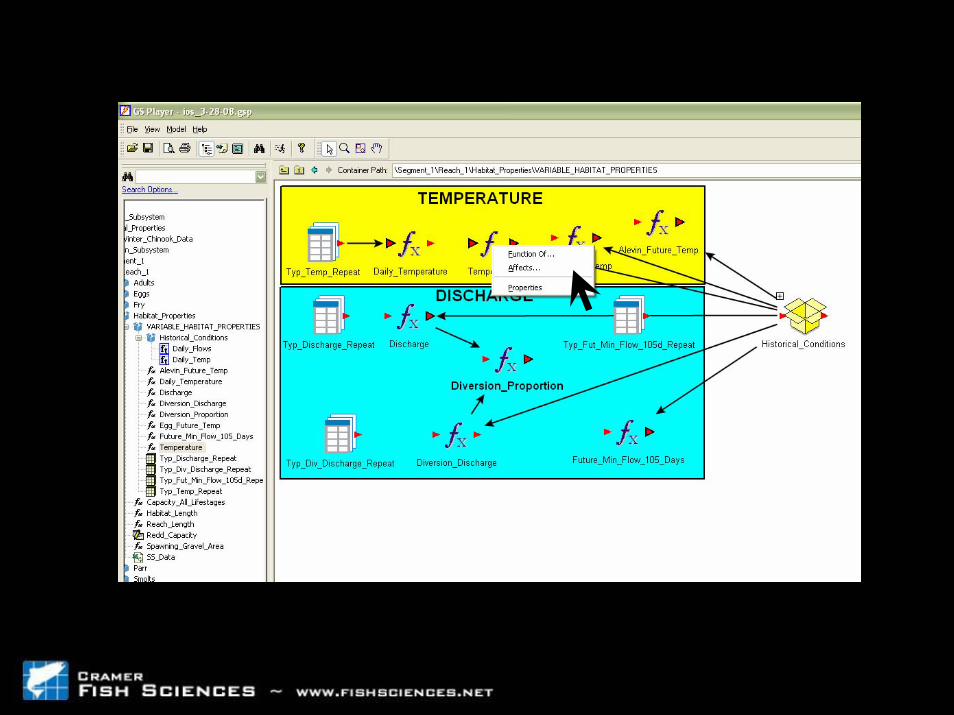
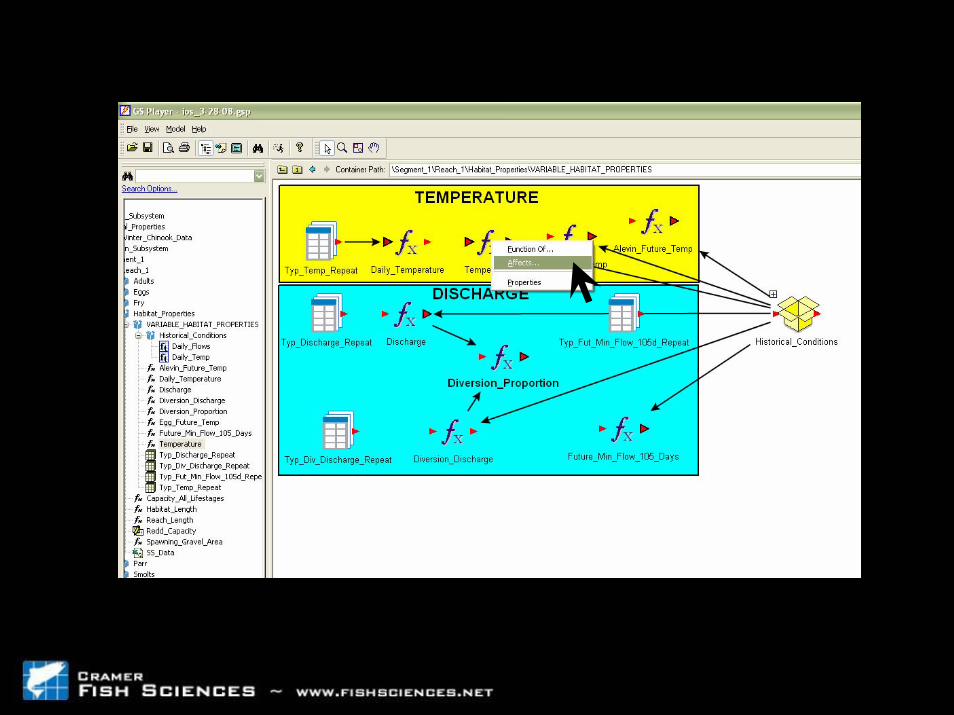
IOS Model: Geographic Overview
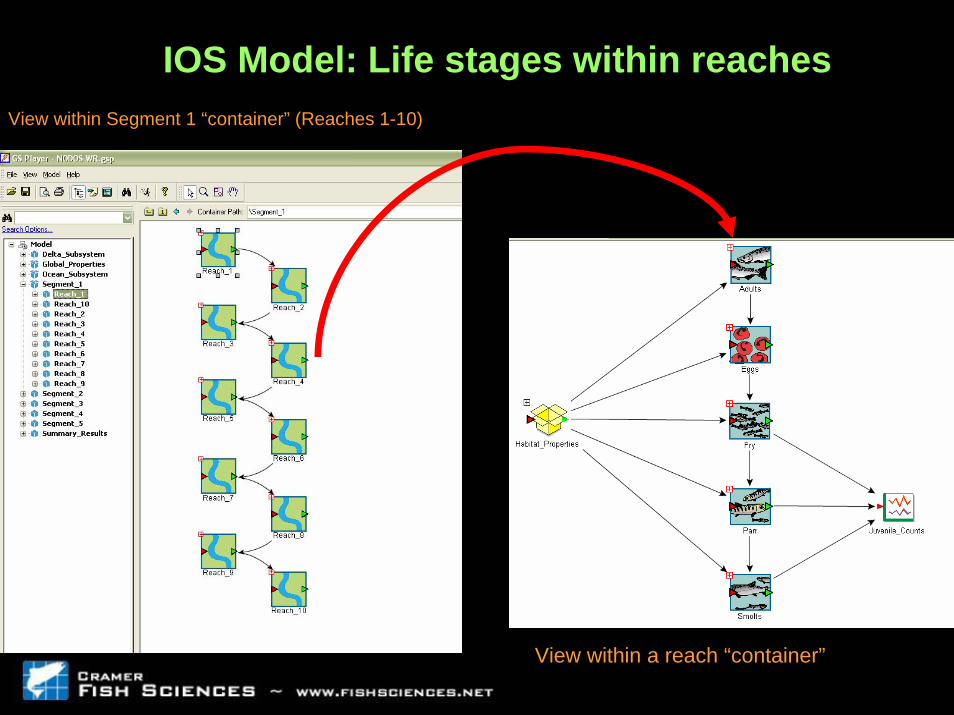
View within Segment 1 “container” (Reaches 1-10)
View within a reach “container”
IOS Model: Life stages within reaches
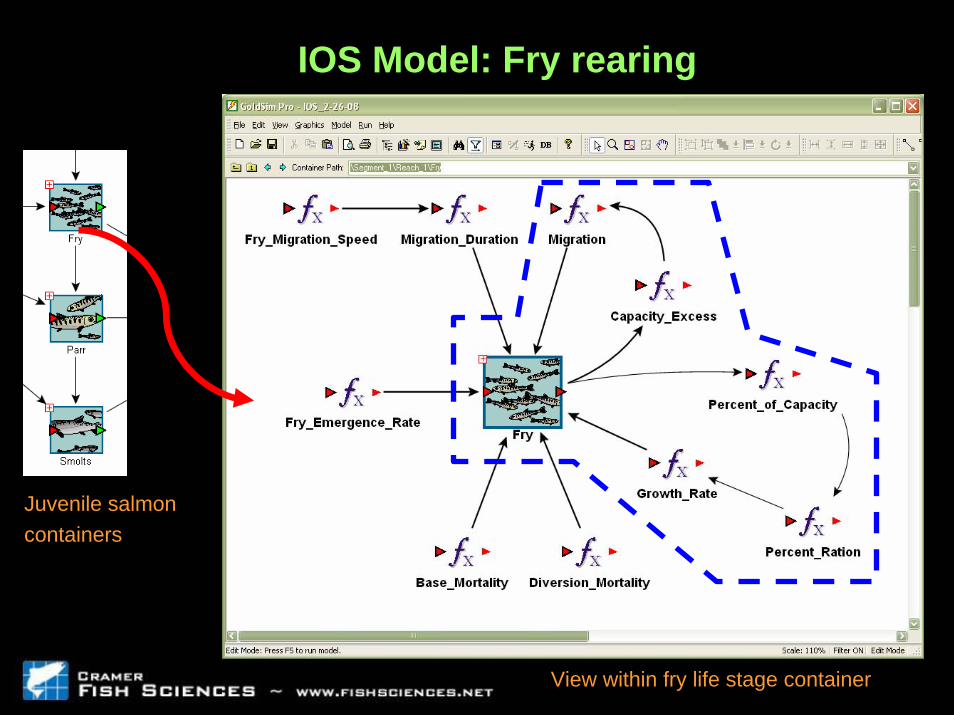
IOS Model: Fry rearing
Juvenile salmoncontainers
View within fry life stage container
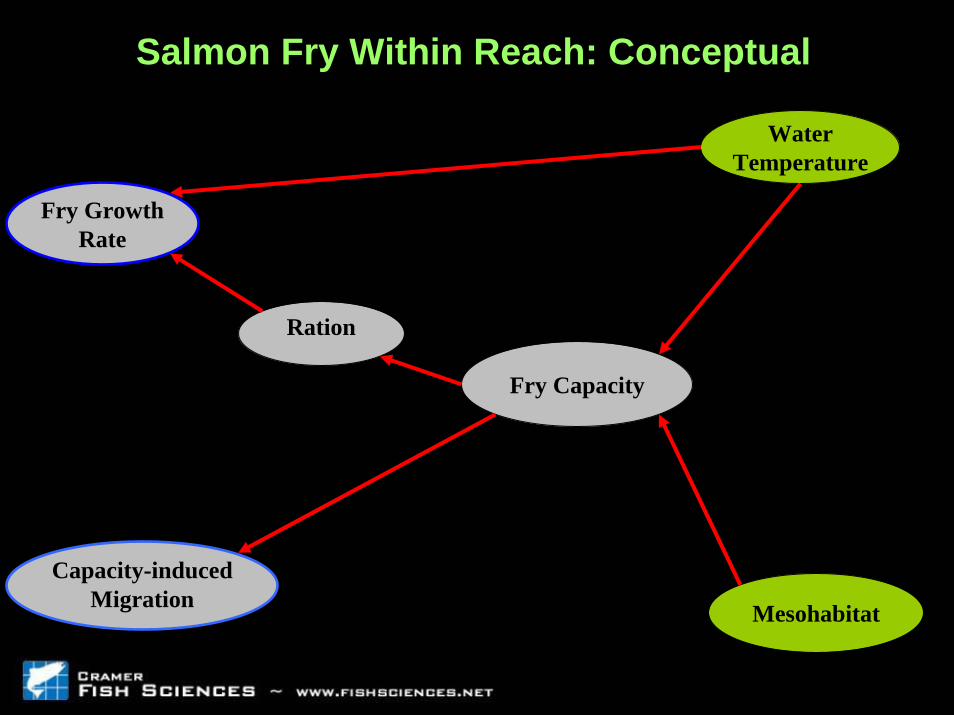
Salmon Fry Within Reach: Conceptual
Water Temperature
Fry Capacity
Mesohabitat
Ration
Capacity-induced Migration
Fry Growth Rate
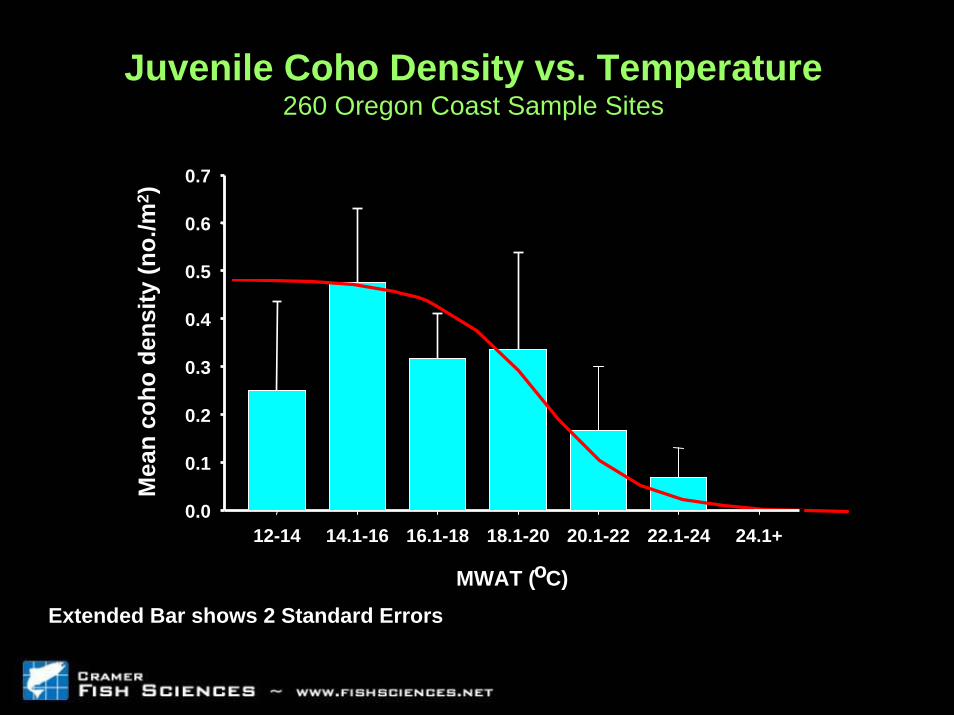
MWAT (oC)
12-14 14.1-16 16.1-18 18.1-20 20.1-22 22.1-24 24.1+
Mea
n co
ho d
ensi
ty (n
o./m
2 )
0.0
0.1
0.2
0.3
0.4
0.5
0.6
0.7
Juvenile Coho Density vs. Temperature 260 Oregon Coast Sample Sites
Extended Bar shows 2 Standard Errors
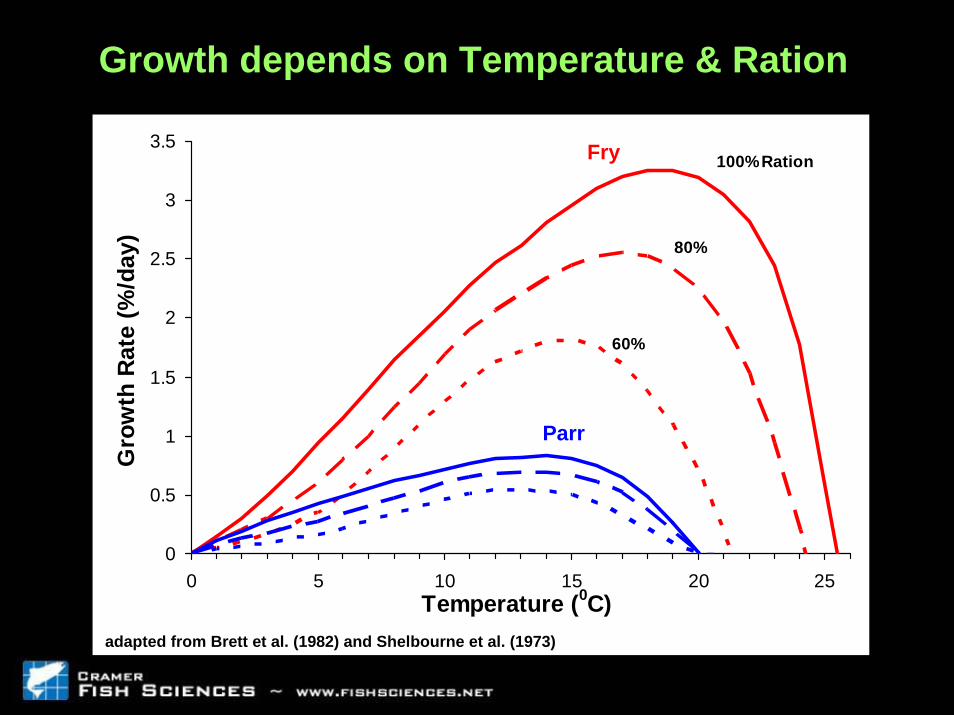
Growth depends on Temperature & Ration
0
0.5
1
1.5
2
2.5
3
3.5
0 5 10 15 20 25Temperature (0C)
Gro
wth
Rat
e (%
/day
)100% Ration
80%
60%
Fry
Parr
adapted from Brett et al. (1982) and Shelbourne et al. (1973)
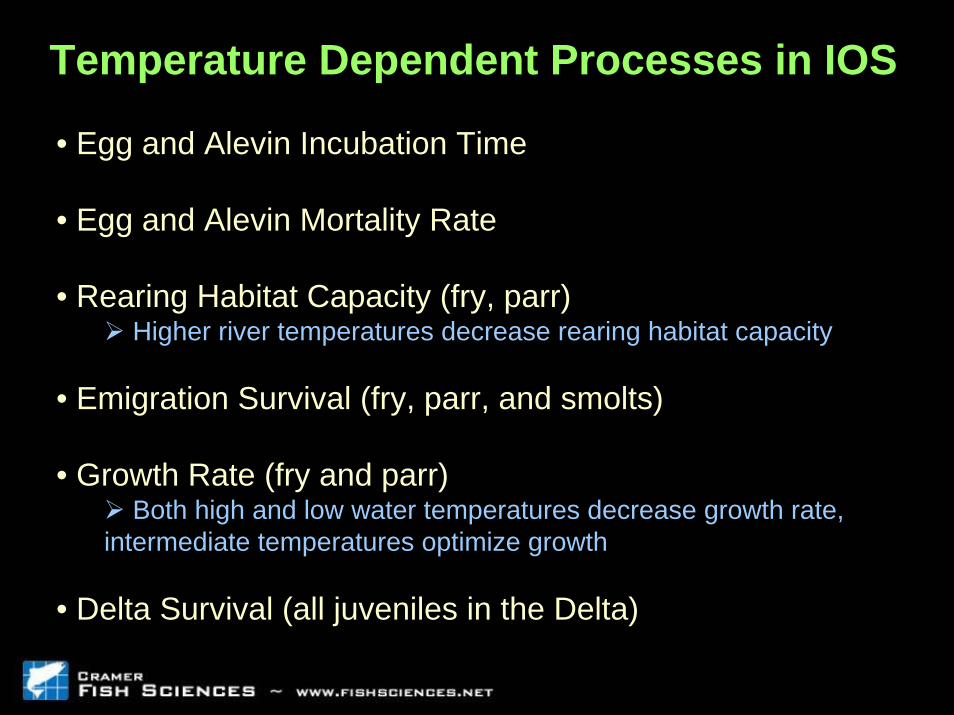
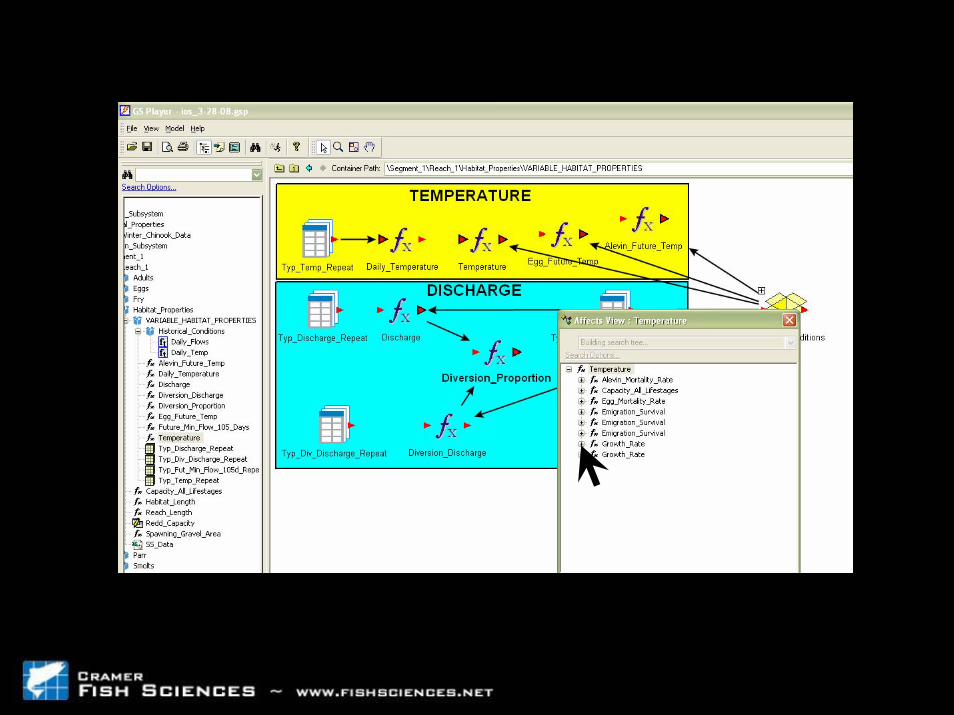
Temperature Dependent Processes in IOS
• Egg and Alevin Incubation Time
• Egg and Alevin Mortality Rate
• Rearing Habitat Capacity (fry, parr)Higher river temperatures decrease rearing habitat capacity
• Emigration Survival (fry, parr, and smolts)
• Growth Rate (fry and parr)Both high and low water temperatures decrease growth rate,
intermediate temperatures optimize growth
• Delta Survival (all juveniles in the Delta)
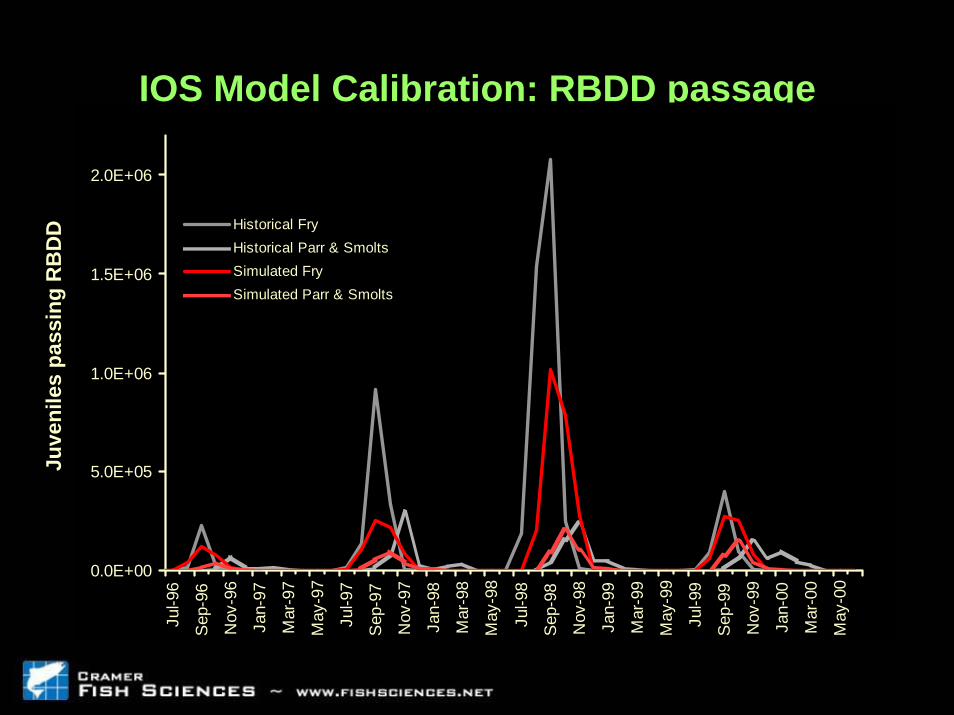
IOS Model Calibration: RBDD passageJu
veni
les
pass
ing
RB
DD
0.0E+00
5.0E+05
1.0E+06
1.5E+06
2.0E+06Ju
l-96
Sep
-96
Nov
-96
Jan-
97
Mar
-97
May
-97
Jul-9
7
Sep
-97
Nov
-97
Jan-
98
Mar
-98
May
-98
Jul-9
8
Sep
-98
Nov
-98
Jan-
99
Mar
-99
May
-99
Jul-9
9
Sep
-99
Nov
-99
Jan-
00
Mar
-00
May
-00
Historical FryHistorical Parr & SmoltsSimulated FrySimulated Parr & Smolts
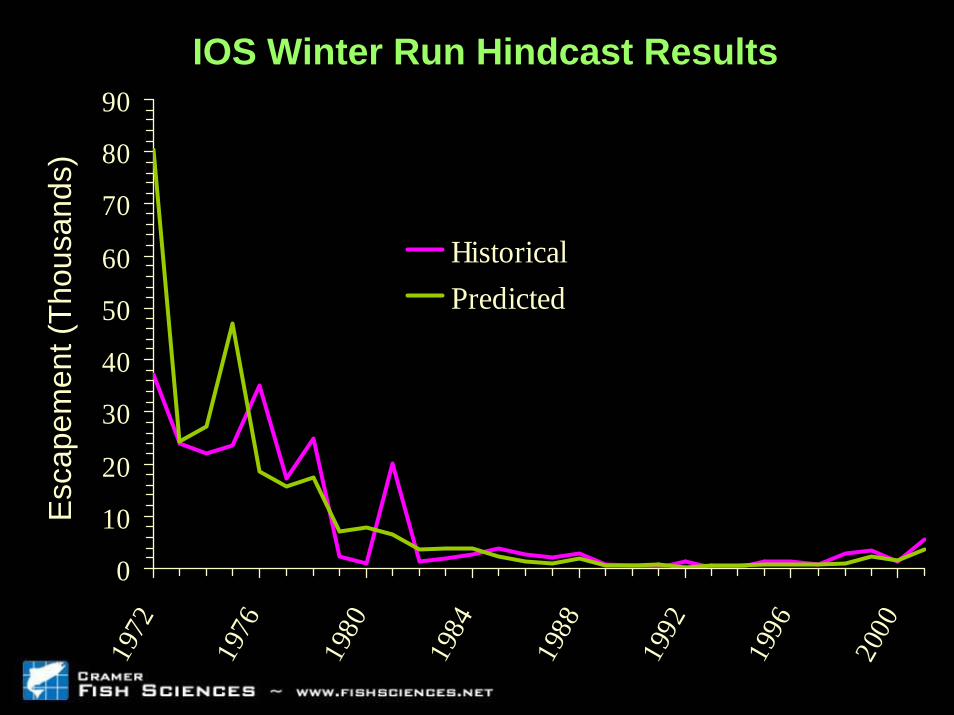
IOS Winter Run Hindcast ResultsE
scap
emen
t (Th
ousa
nds)
0
10
20
30
40
50
60
70
80
9019
72
1976
1980
1984
1988
1992
1996
2000
HistoricalPredicted
Esc
apem
ent (
Thou
sand
s)
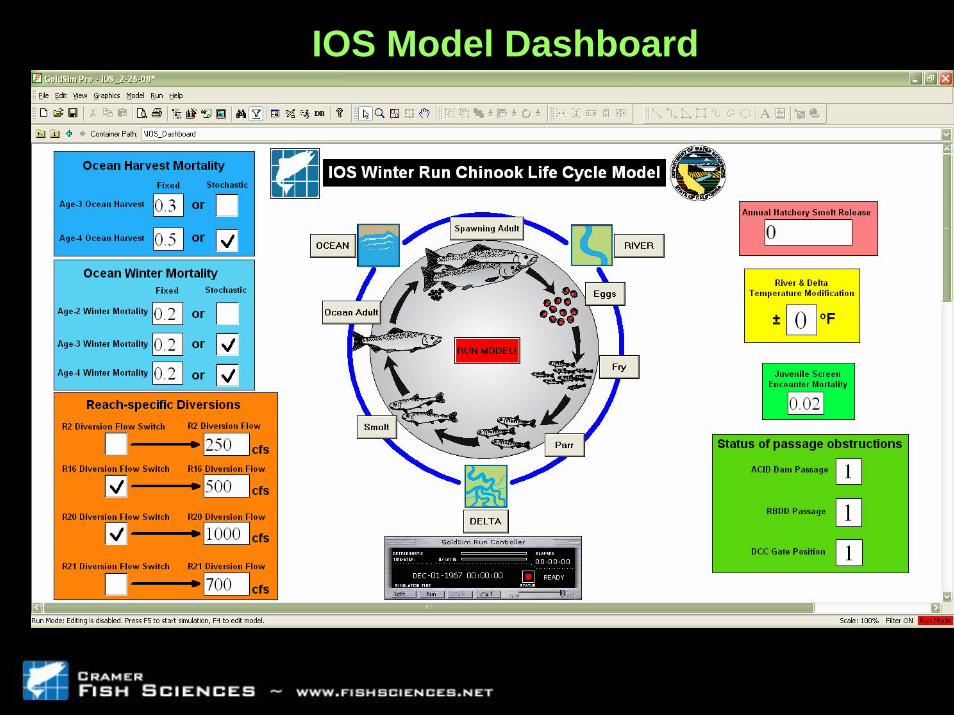
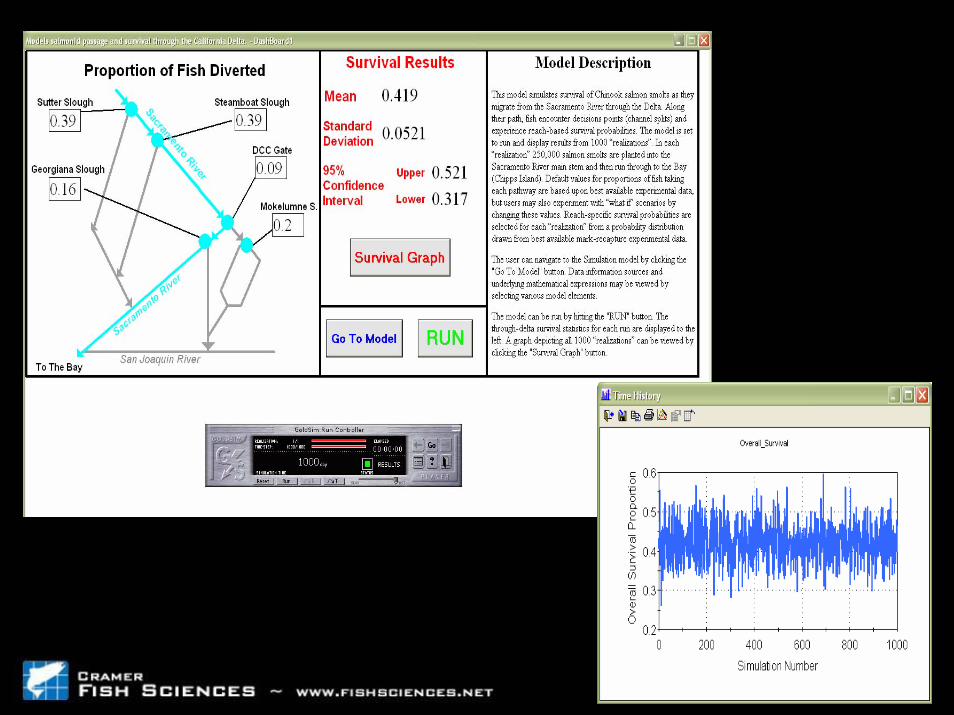
IOS Model Dashboard
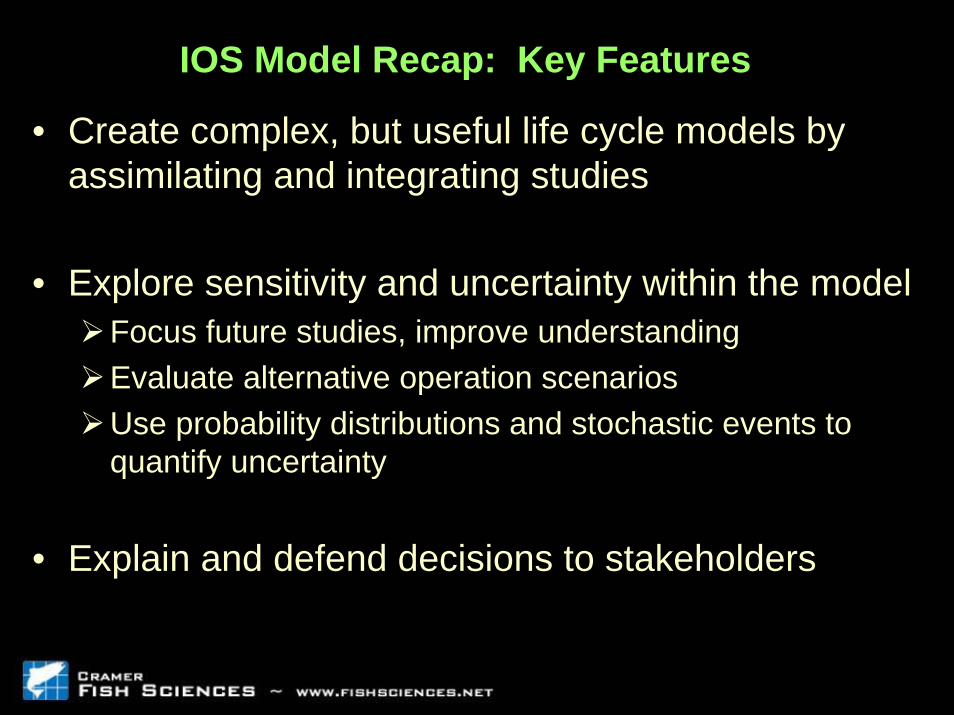
IOS Model Recap: Key Features
• Create complex, but useful life cycle models by assimilating and integrating studies
• Explore sensitivity and uncertainty within the modelFocus future studies, improve understanding Evaluate alternative operation scenariosUse probability distributions and stochastic events to quantify uncertainty
• Explain and defend decisions to stakeholders
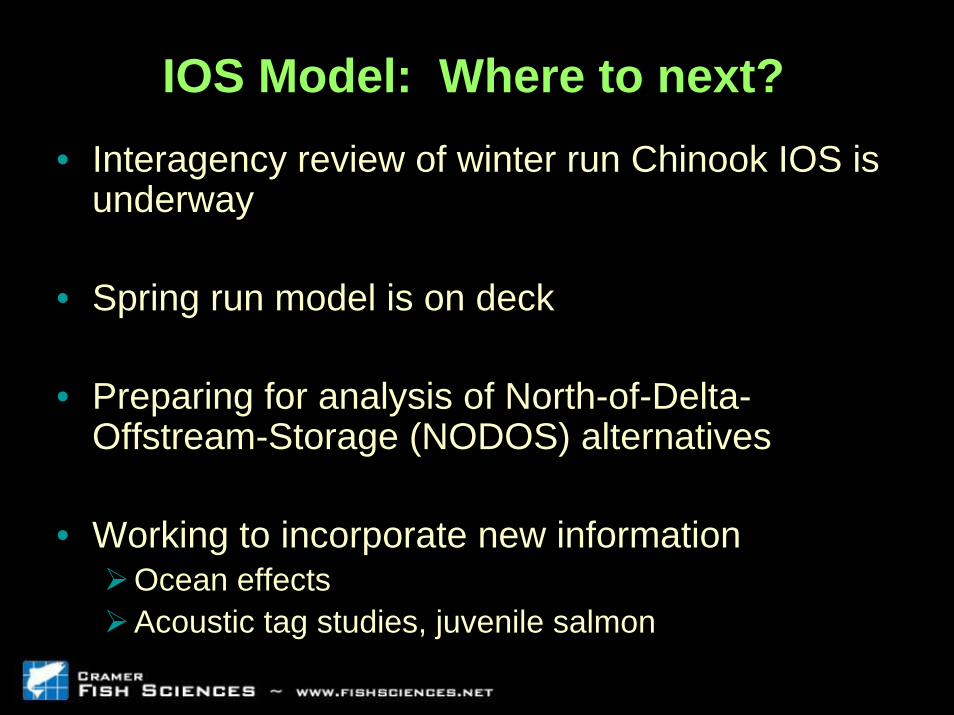
IOS Model: Where to next?• Interagency review of winter run Chinook IOS is
underway
• Spring run model is on deck
• Preparing for analysis of North-of-Delta-Offstream-Storage (NODOS) alternatives
• Working to incorporate new informationOcean effectsAcoustic tag studies, juvenile salmon

OceanEntryFlow Export
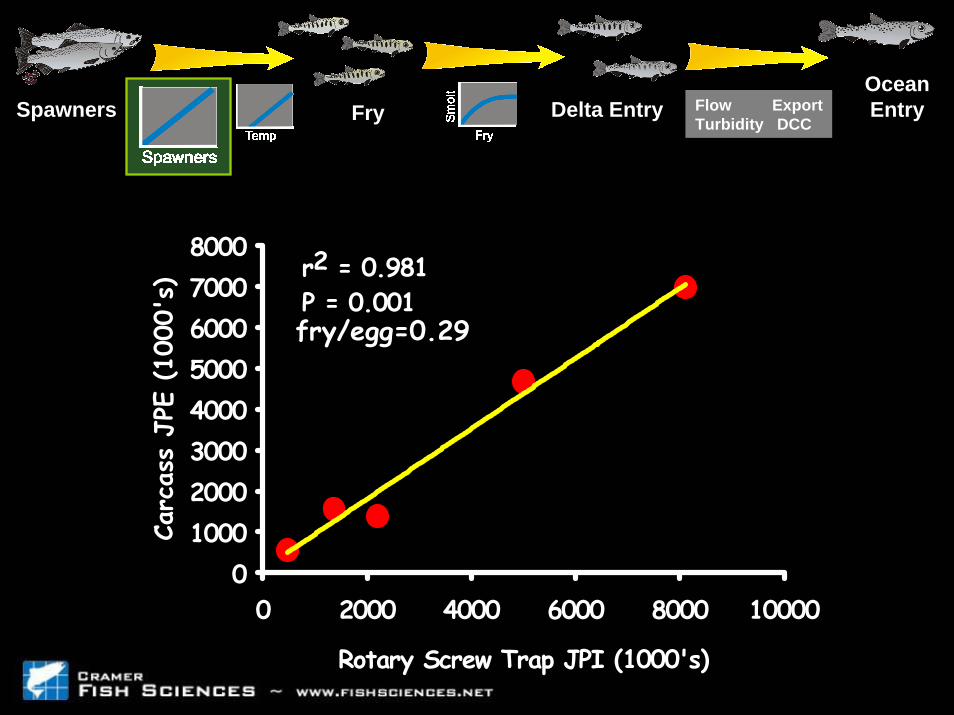
Turbidity DCCSpawners Delta EntryFry
fry/egg=0.29
Rotary Screw Trap JPI (1000's)
0 2000 4000 6000 8000 10000
Carc
ass
JPE
(100
0's)
010002000300040005000600070008000
r2 = 0.981P = 0.001
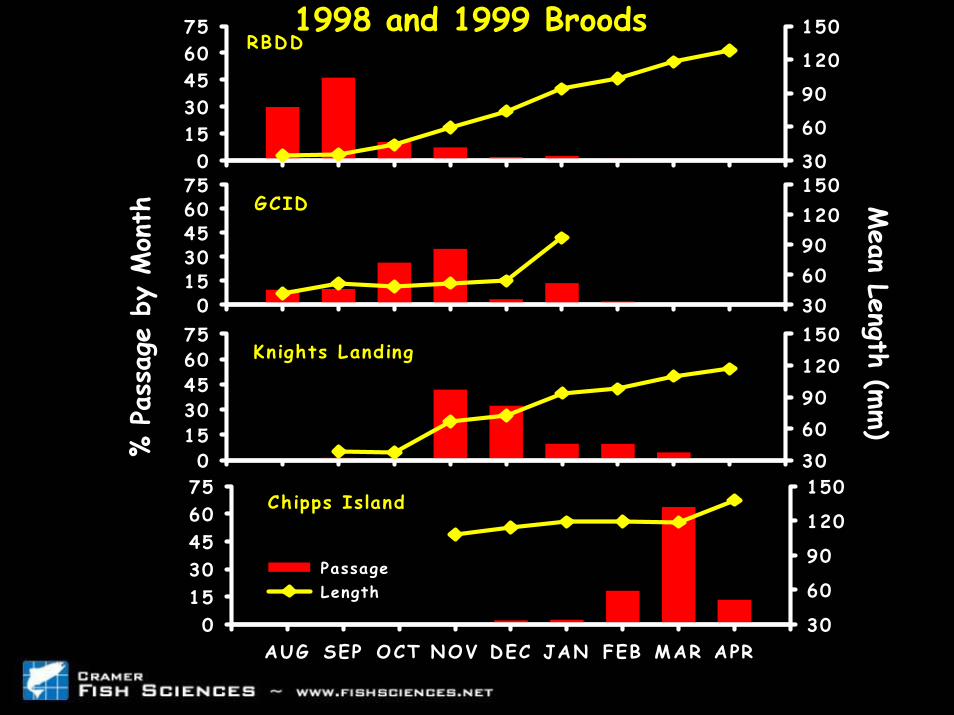
1998 and 1999 Broods
% P
assa
ge b
y M
onth
01530456075
30
60
90
120
150
PassageLength
RBDD
GCID
AUG SEP OCT NOV DEC JAN FEB MAR APR0
1530456075
30
60
90
120
150Chipps Island
01530456075
Mean Length (m
m)
306090120150
Knights Landing
01530456075
306090120150
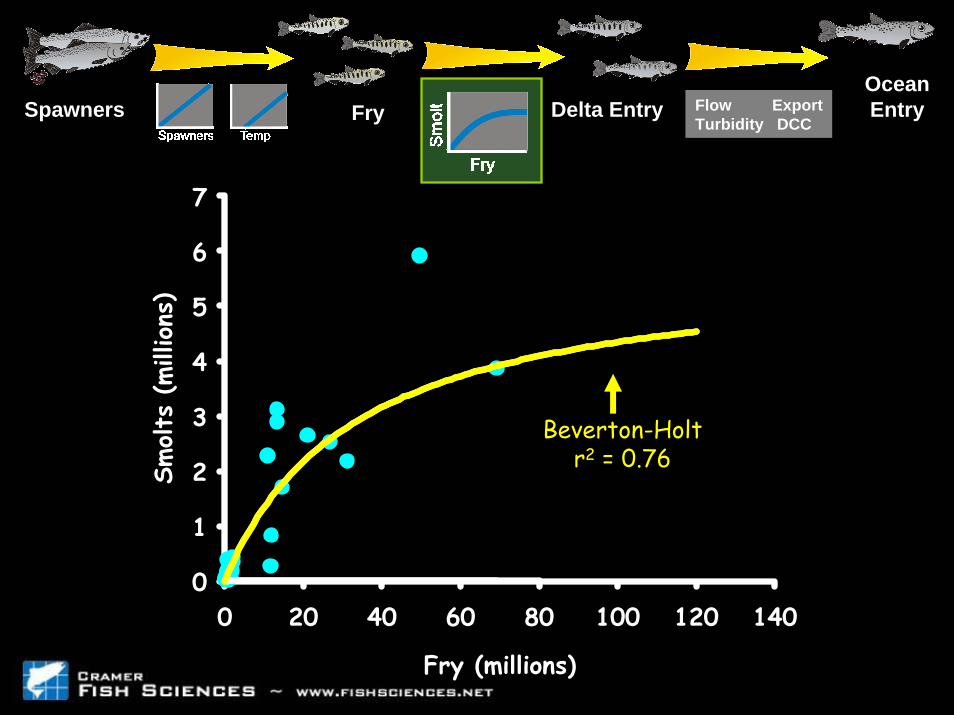
Fry Delta EntryOceanEntryFlow Export
Turbidity DCC
Fry (millions)
0 20 40 60 80 100 120 140
Smolts
(millions
)
0
1
2
3
4
5
6
7
Beverton-Holtr2 = 0.76
Spawners
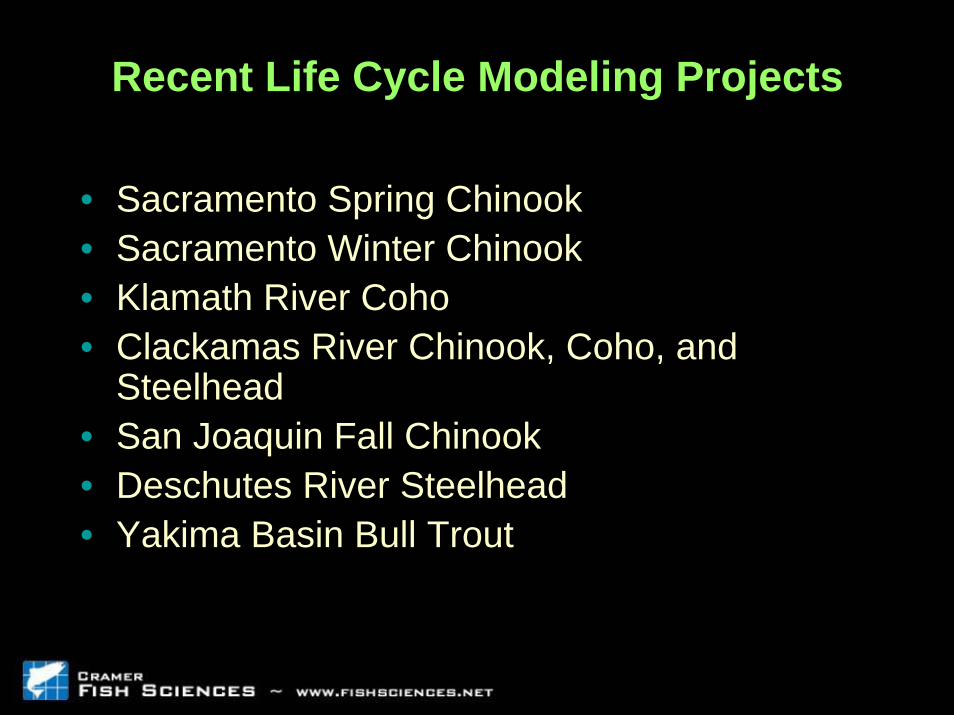
Recent Life Cycle Modeling Projects
• Sacramento Spring Chinook• Sacramento Winter Chinook• Klamath River Coho• Clackamas River Chinook, Coho, and
Steelhead• San Joaquin Fall Chinook• Deschutes River Steelhead• Yakima Basin Bull Trout
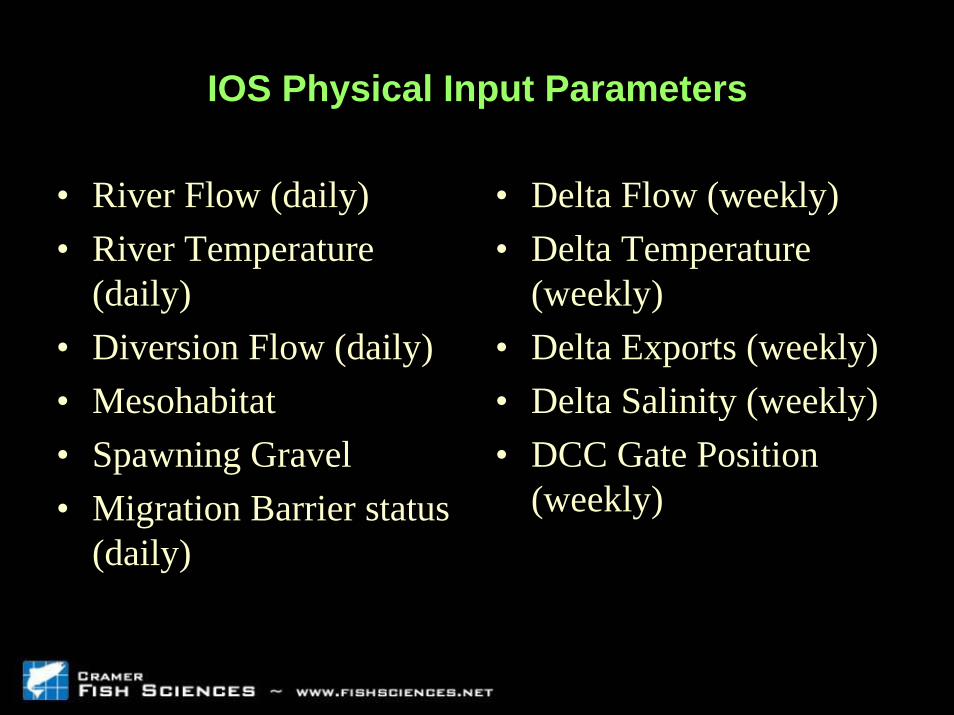
IOS Physical Input Parameters
• River Flow (daily)• River Temperature
(daily)• Diversion Flow (daily)• Mesohabitat• Spawning Gravel• Migration Barrier status
(daily)
• Delta Flow (weekly) • Delta Temperature
(weekly)• Delta Exports (weekly)• Delta Salinity (weekly)• DCC Gate Position
(weekly)
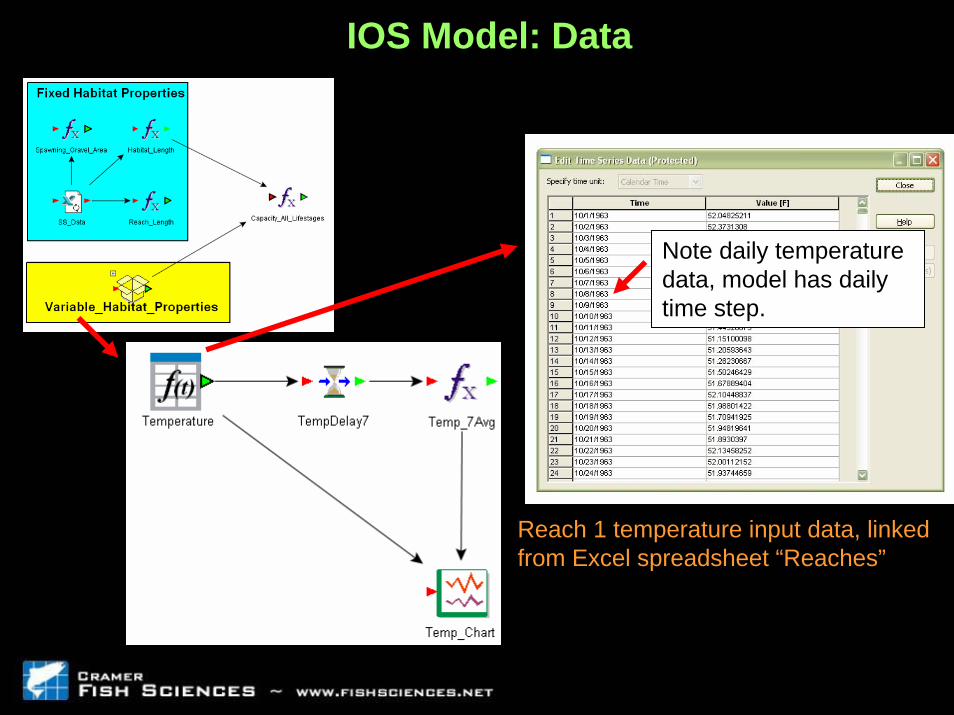
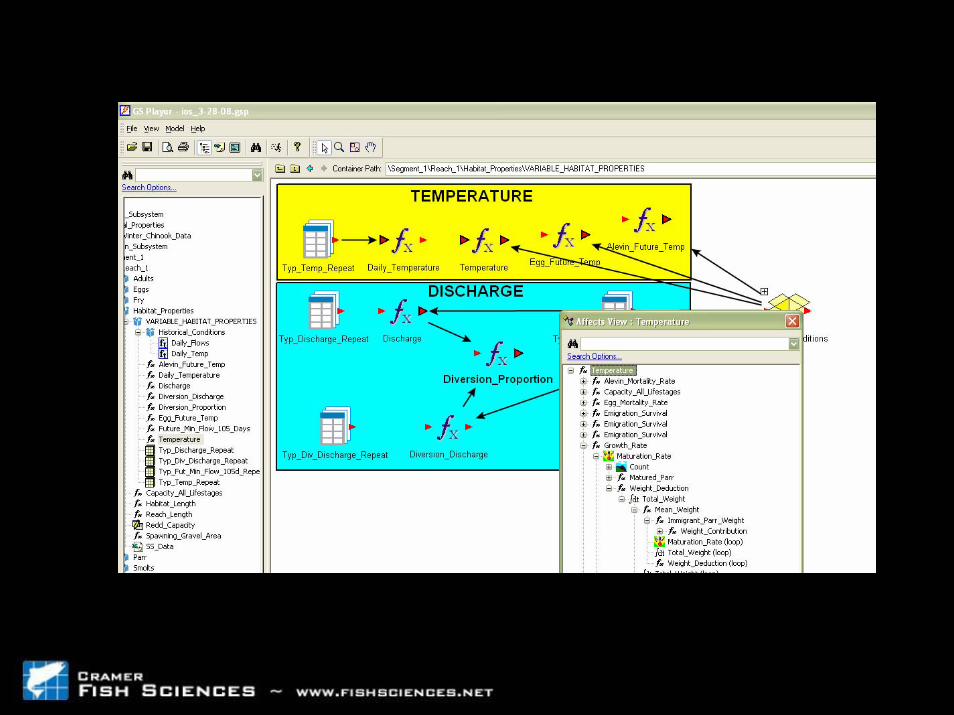
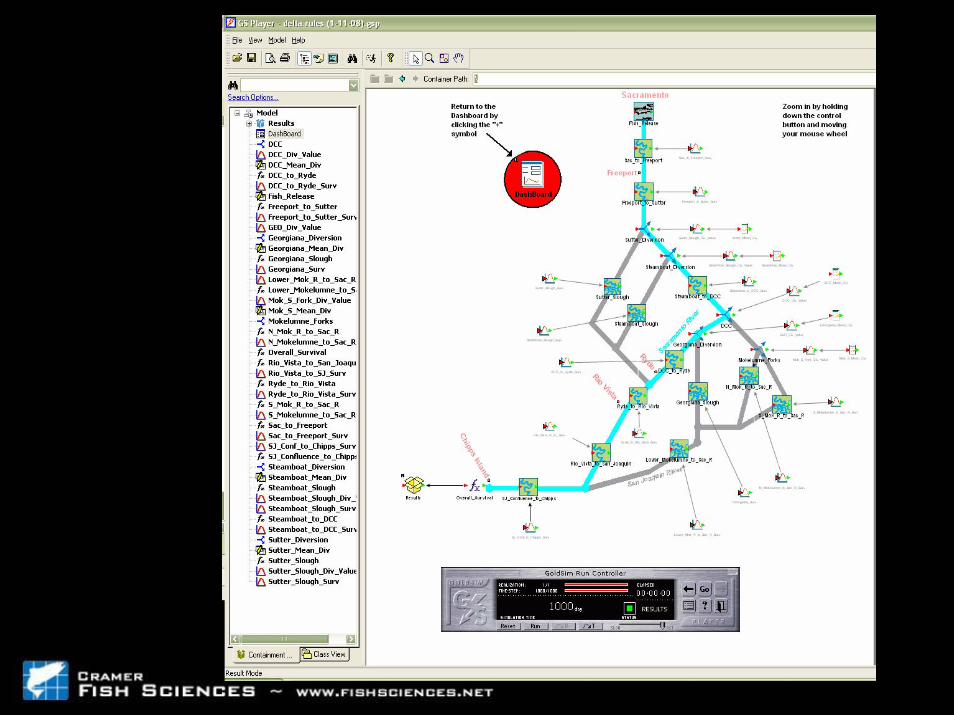
IOS Model: Data
Reach 1 temperature input data, linked from Excel spreadsheet “Reaches”
Note daily temperature data, model has daily time step.
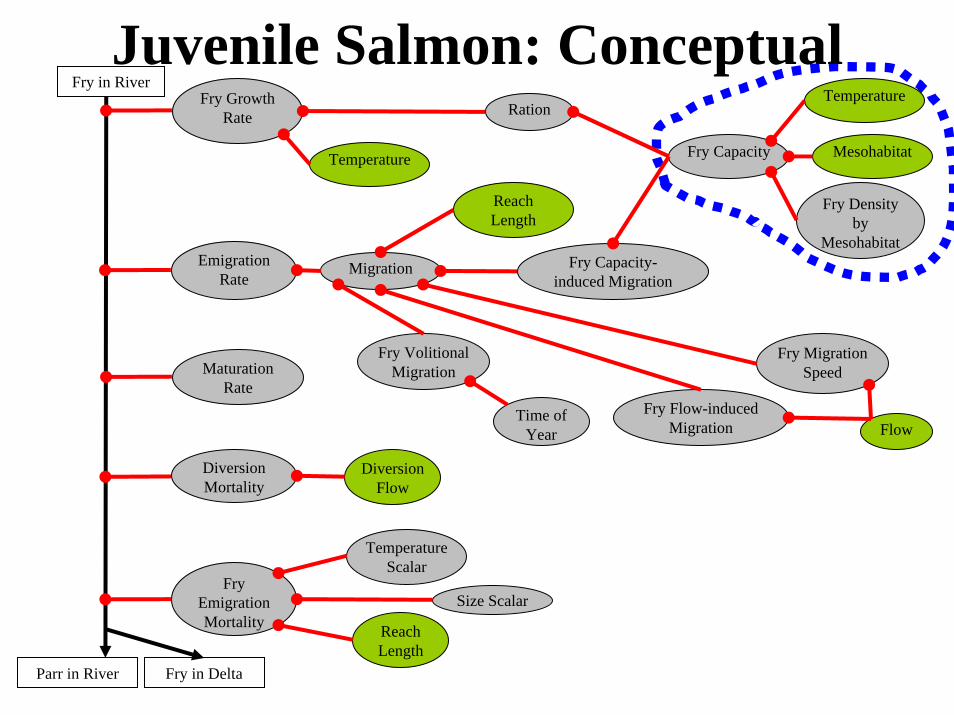
Juvenile Salmon: Conceptual
MigrationEmigration Rate
Fry Growth Rate
Maturation Rate
Diversion Mortality
Fry Emigration Mortality
Reach Length
Fry Migration Speed
Fry Capacity-induced Migration
Fry Flow-induced Migration
Fry Volitional Migration
Size Scalar
Temperature Scalar
Reach Length
Diversion Flow
Time of Year Flow
Temperature
Fry Capacity Mesohabitat
Fry Density by
Mesohabitat
Fry in Delta
Temperature
Fry in River
Parr in River
Ration
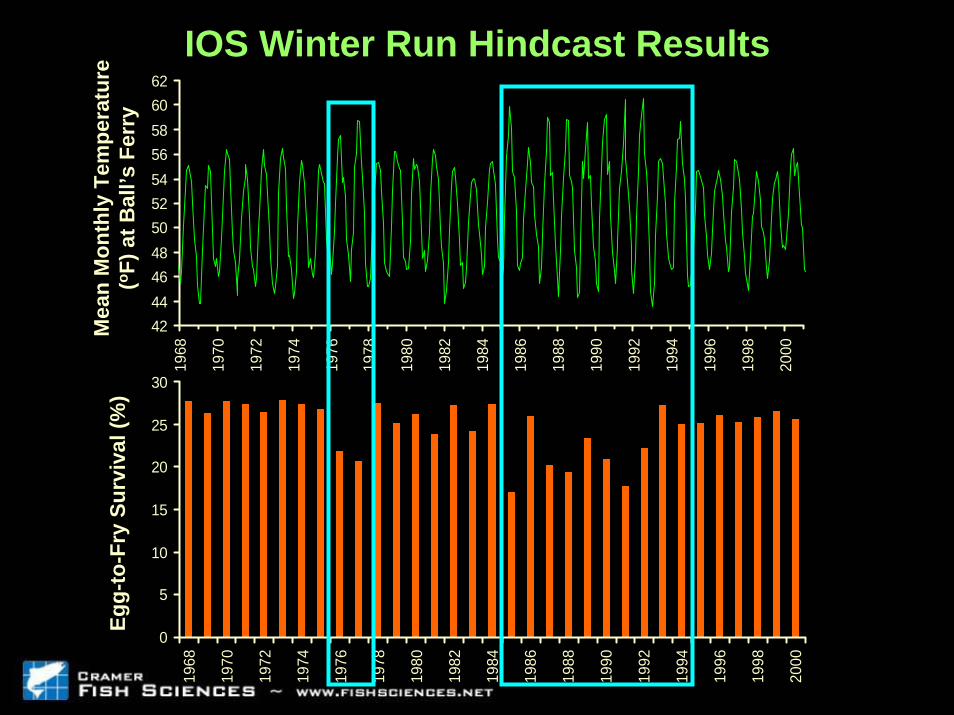
IOS Winter Run Hindcast Results
4244464850525456586062
1968
1970
1972
1974
1976
1978
1980
1982
1984
1986
1988
1990
1992
1994
1996
1998
2000
0
5
10
15
20
25
30
1968
1970
1972
1974
1976
1978
1980
1982
1984
1986
1988
1990
1992
1994
1996
1998
2000
Mea
n M
onth
ly T
empe
ratu
re
(o F) a
t Bal
l’s F
erry
Egg-
to-F
ry S
urvi
val (
%)
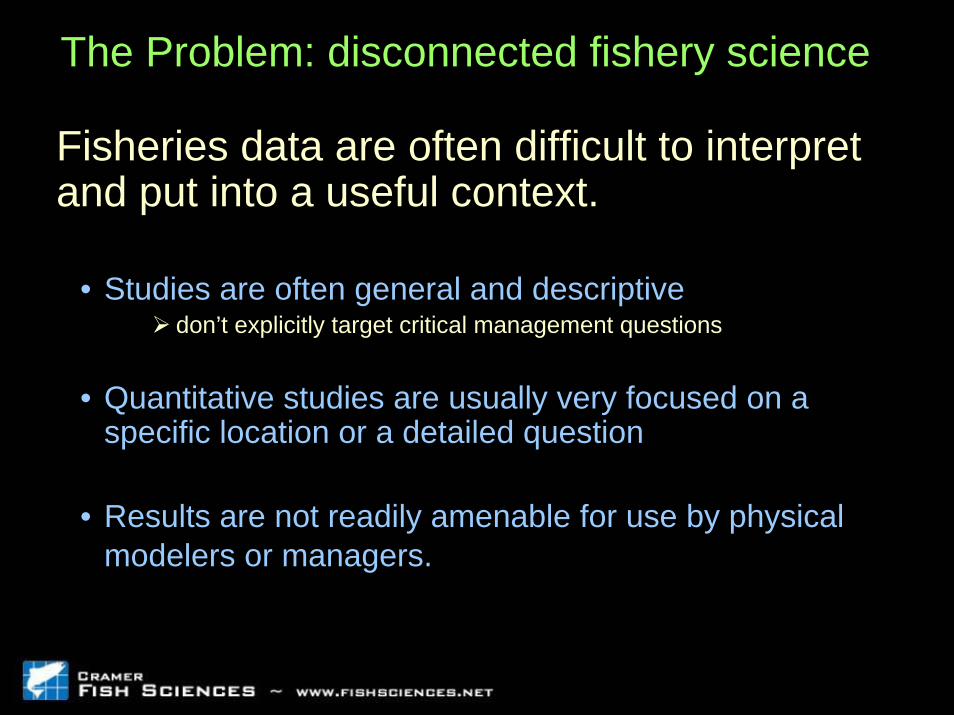
The Problem: disconnected fishery science
Fisheries data are often difficult to interpret and put into a useful context.
• Studies are often general and descriptivedon’t explicitly target critical management questions
• Quantitative studies are usually very focused on a specific location or a detailed question
• Results are not readily amenable for use by physical modelers or managers.
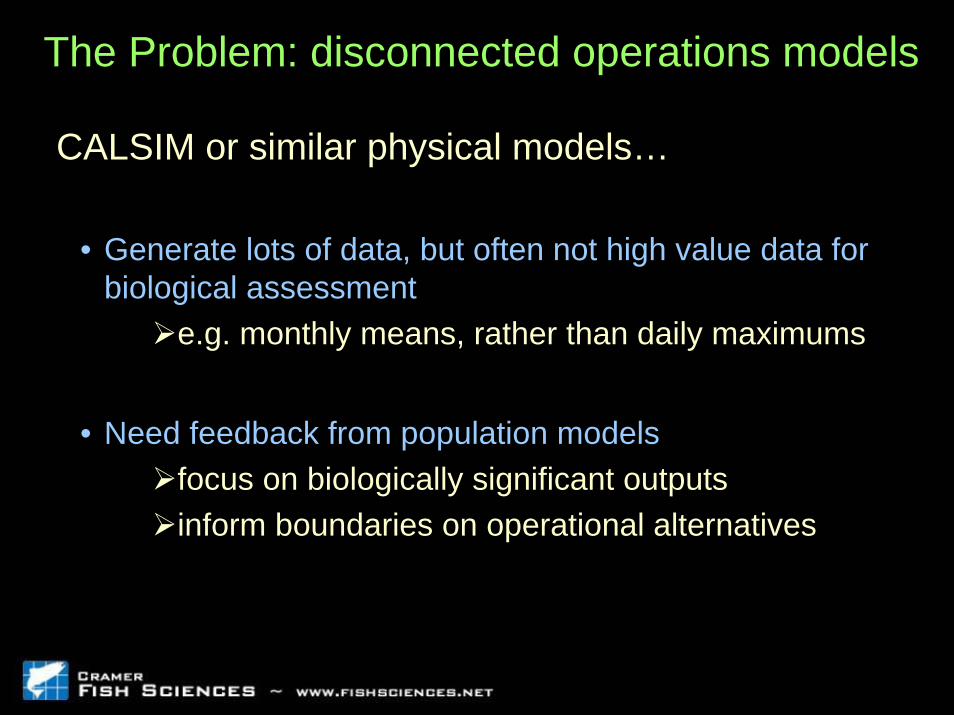
The Problem: disconnected operations models
CALSIM or similar physical models…
• Generate lots of data, but often not high value data for biological assessment
e.g. monthly means, rather than daily maximums
• Need feedback from population modelsfocus on biologically significant outputsinform boundaries on operational alternatives
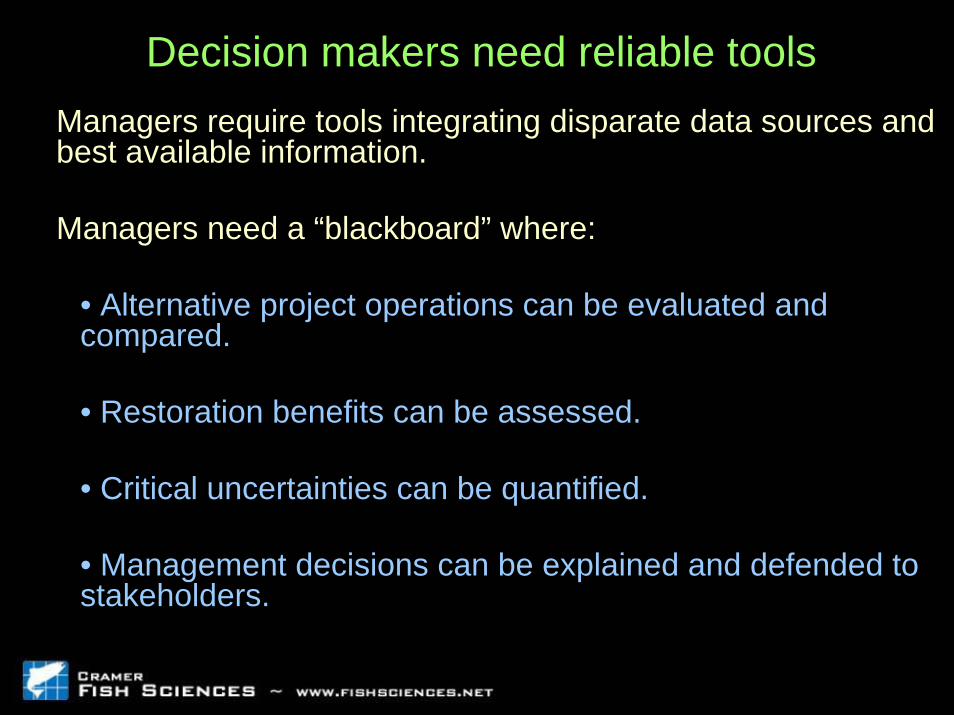
Decision makers need reliable toolsManagers require tools integrating disparate data sources and best available information.
Managers need a “blackboard” where:
• Alternative project operations can be evaluated and compared.
• Restoration benefits can be assessed.
• Critical uncertainties can be quantified.
• Management decisions can be explained and defended to stakeholders.
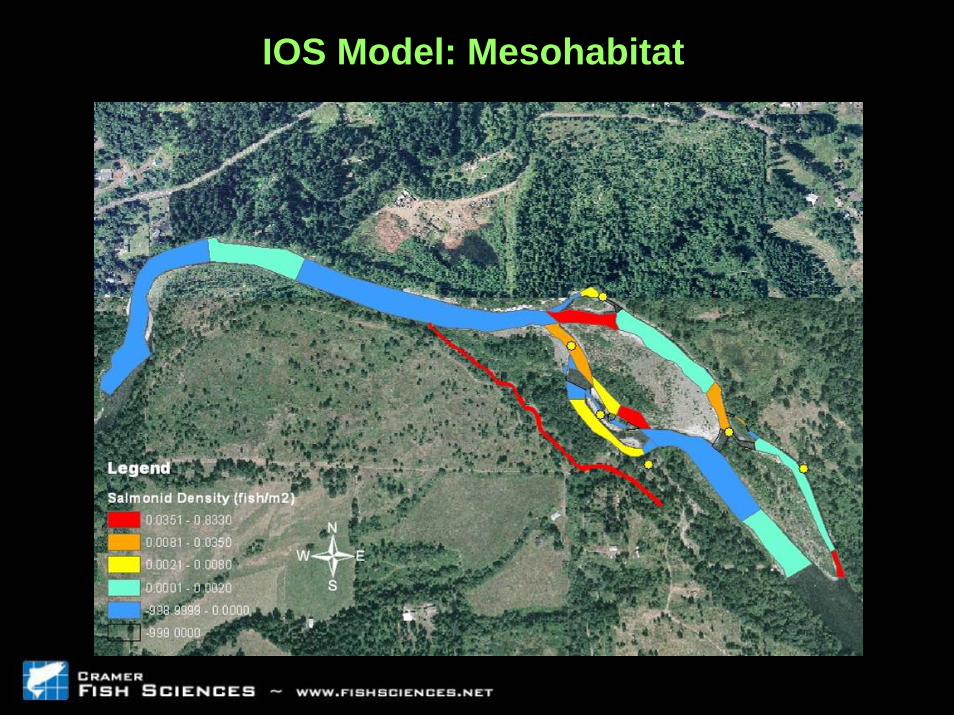
IOS Model: Mesohabitat
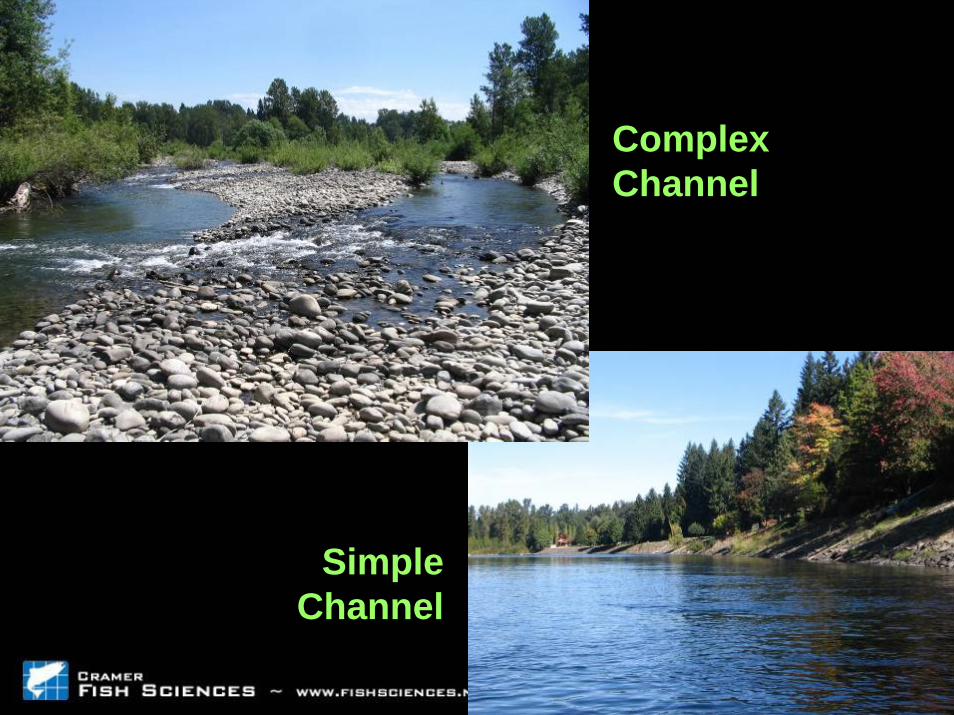
Complex Channel
Simple Channel