Embed Size (px)
Citation preview
University of South FloridaScholar Commons
Graduate Theses and Dissertations Graduate School
6-29-2016
Evaluating Video Modeling to Teach Caregivers toConduct Paired-Stimulus Preference AssessmentsCristina Diane AndersenUniversity of South Florida, [email protected]
Follow this and additional works at: http://scholarcommons.usf.edu/etd
Part of the Behavioral Disciplines and Activities Commons, and the Social and BehavioralSciences Commons
This Thesis is brought to you for free and open access by the Graduate School at Scholar Commons. It has been accepted for inclusion in GraduateTheses and Dissertations by an authorized administrator of Scholar Commons. For more information, please contact [email protected].
Scholar Commons CitationAndersen, Cristina Diane, "Evaluating Video Modeling to Teach Caregivers to Conduct Paired-Stimulus Preference Assessments"(2016). Graduate Theses and Dissertations.http://scholarcommons.usf.edu/etd/6167

Evaluating Video Modeling to Teach Caregivers to Conduct Paired-Stimulus Preference
Assessments
by
Cristina D. Andersen
A thesis submitted in partial fulfillment of the requirements for the degree of
Master of Arts Department of Child and Family Studies
College of Behavioral and Community Sciences University of South Florida
Major Professor: Raymond Miltenberger, Ph.D. Andrew Samaha, Ph.D.
Kimberly Crosland, Ph.D.
Date of Approval: July 23, 2016
Keywords: parent, training, behavior, reinforcer, stimulus
Copyright © 2016, Cristina D. Andersen

i
TABLE OF CONTENTS
List of Tables ii List of Figures iii Abstract iv Chapter One: Introduction 1 Chapter Two: Method 7 Participants and Setting 7 Materials 8 Target Behaviors 8 Assessments 9 Inter-Observer Agreement 10 Treatment Integrity 10 Social Validity 11 Experimental Design and Procedure 11 Caregiver Interview 11 Baseline 12 Training 12 Assessments 12 Booster Training 13 Follow-Up 13 Chapter Three: Results 14 Chapter Four: Discussion 20 Chapter Five: References 24 Appendices 28 Appendix A Paired Stimulus Preference Assessment Data Sheet 29 Appendix B Paired Stimulus Preference Assessment Task Analysis 30 Appendix C IOA Scoring Data Sheet 31 Appendix D Treatment Integrity Checklist 33 Appendix E Social Validity Survey 34 Appendix F Video Model Script 35 Appendix G IRB Expedited Approval for Initial Review Letter 40

ii
LIST OF TABLES
Table 1: Caregiver Predictions and Child Preferences. 16
iii
LIST OF FIGURES
Figure 1: The percentage of steps correct for each caregiver during each assessment in baseline, post training, and follow-up. 17 Figure 2: This bar graph depicts the preferences of Peter during the PS preference assessments conducted by his mother, Sarah. 18 Figure 3: This bar graph depicts the preferences of Justin during the PS preference assessments conducted by his mother, Khloe. 18 Figure 4: This bar graph depicts the preferences of James during the PS preference assessments conducted by his mother, Jennifer. 19

iv
ABSTRACT
Stimulus preference assessments have been shown to identify stimuli that are likely to
function as reinforcers for individuals with disabilities. It is important to identify these stimuli to
increase the effectiveness of interventions. The ability to conduct a stimulus preference
assessment is a skill that parents and caregivers should have. Research on training preference
assessments is limited to staff, teachers, and students. The following study evaluated the
effectiveness of video modeling to teach caregivers to conduct paired stimulus preference
assessments. The results showed that video modeling was effective and that the results
maintained during a one week follow up.

1
CHAPTER ONE: INTRODUCTION
Researchers in applied behavior analysis have taken a special interest in increasing the
accessibility of assessment and intervention procedures to nonprofessionals. When serving
individuals with disabilities, it is in their best interest to involve everyone (within the
individual’s environment) in the assessment and treatment process in order to increase the
likelihood of generalization and maintenance of skills. Specifically, evidence suggests that
involving parents and caregivers in the treatment process can increase maintenance of acquired
skills (Anderson, Avery, DiPietro, Edwards, & Christian, 1987; Christophersen, Arnold, Hill, &
Quilitch, 1972), maintain problem behavior reduction (Kelley, Embry, & Baer, 1979; Sanders &
Glynn, 1981), and enhance skill acquisition (Adubato, Adams, & Budd, 1981; Anderson et al.,
1987; Muir & Milan, 1982). Given these advantages, it is important to investigate methods to
make interventions accessible to parents, caregivers, and staff of individuals with disabilities.
The literature on parent and staff training is extensive. There have been many studies
assessing treatment packages designed to teach parents and staff to reduce problem behavior
(e.g. Anderson & McMillan, 2001; Christophersen et al., 1972; Krantz, Macduff, &
McClannahan, 1993; Seiverling, Williams, Sturmey, & Hart, 2012), teach new skills (e.g. Ben
Chaabane, Alber-Morgan, & DeBar, 2009; Crockett, Fleming, Doepke, & Stevens, 2007; Hsieh,
Wilder, & Abellon, 2011;Muir & Milan, 1982; Rinald & Mirenda, 2012) and to conduct
functional analyses (Kunnavatana, Bloom, Samaha, Lignugaris/Kraft et al., 2013; Lambert,
Bloom, & Kunnavatana, 2013).

2
The success of these studies indicates the feasibility of training parents to conduct
assessment and intervention procedures. However, practitioners agree that before implementing
any interventions, it is important to identify stimuli that serve as potential reinforcers for an
individual. Stimulus preference assessments have been shown to do that (Fisher et al., 1992). In
fact, research also suggests that the stimuli identified through preference assessments actually do
function as reinforcers when used as such (Green et al., 1988; Green, Reid, Canipe, & Gardner,
1991). It is important for parents and caregivers to acquire this skill set for a variety of reasons.
First, children with intellectual disabilities often have limited interests, as the children age their
interests have the potential to change. However due to their history of limited interests, parents
could become blind to possibility of novel reinforcers. In addition, as behavior analytic services
are faded and parents are expected to take on a larger role within treatment implementation, it is
beneficial for parents to have the ability to reassess their children’s preferences over time or with
novel stimuli. Studies have investigated ways to teach a variety of nonprofessionals to conduct
preference assessments, however, there is no research involving parents or caregivers (e.g., Graff
& Karsten, 2012; Lavie & Sturmey, 2002; Roscoe & Fisher, 2008; Weldy, Rapp, & Capocasa,
2014).
Lavie and Sturmey (2002) were the first to evaluate a method of teaching individuals to
conduct preference assessments. They used brief instructions, a video model, and rehearsal with
feedback to teach three assistant teachers to conduct a paired stimulus (PS) preference
assessment. They found that this method was effective, and all three participants scored 80% or
better immediately following training. This study set the stage by demonstrating that
nonprofessionals could be trained, and that training could be brief (80 min). Roscoe, Fisher,
Glover, and Volkert (2006), evaluated the extent to which performance feedback or

3
reinforcement (contingent money) affected the acquisition of skills. The researchers taught
trainees to conduct PS and multiple-stimulus without replacement (MSWO) preference
assessments. They found that performance only increased after feedback was implemented;
contingent money had no effect on performance. In addition, they found that written instruction
alone was not effective in increasing performance. Extending these results, Roscoe and Fisher
(2008) investigated a similar treatment package involving role playing and feedback. This
treatment package was effective in teaching newly hired behavioral technicians to conduct both
PS and MSWO preference assessments.
Although Roscoe et al. (2006) demonstrated that written instructions alone were not
effective in teaching preference assessments, additional studies attempted to identify methods of
teaching that did not involve the presence of a trainer. These methods could include modified
written instructions or video modeling. Often, the trainer is a behavior analyst or someone
otherwise qualified. This expert training could cost money and may not be an option for all
parents, staff, or agencies.
Graff and Karsten (2012) evaluated enhanced written instructions containing step-by-step
instructions, diagrams, and no technical jargon. Researchers used two groups to evaluate whether
the simple addition of a data sheet could alter the effectiveness of the original written
instructions when teaching PS and MSWO preference assessments. Group one received written
instructions derived from a methods section, followed by the enhanced written instruction
described above. Group two received the written instructions, followed by a data sheet to
accompany those instructions, and finally the enhanced written instructions. Both groups
required enhanced written instructions to meet mastery criterion. Although feedback was the
critical component in Roscoe et al. (2006), this was not the case for Graff and Karsten (2012).

4
Enhanced written instructions were sufficient in teaching all 11 participants. In addition,
teachers rated the enhanced written instructions as easier than the original instructions.
Similarly, Ramon, Yu, Martin, and Martin (2015) compared a method section to a self-
instructional training manual in teaching a MSWO preference assessment. The self-instructional
training manual was similar to the enhanced written instructions used in Graff and Karsten
(2012). Researchers used modeling to facilitate acquisition of skills for participants who did not
meet mastery criteria after initial training. Out of the nine participants, none met mastery
criterion following the methods section, four met criterion following the self-instruction training
manual, and the remaining five participants met criterion following modeling. This finding
expanded on Graff and Karsten (2012), demonstrating that self-instruction manuals may not be
effective for everyone, and that additional training may be necessary.
Another treatment package that does not require the presence of a trainer is video
modeling. Video modeling and video modeling plus other components including instructions and
feedback, has been used to teach a variety of skills to staff and parents including discrete trial
training (Catania, Almeida, Liu-Constant, & Reed, 2009; Vladescu, Carroll, Paden, & Kodak,
2012), functional analysis methodology (Moore & Fisher, 2007; Wallace, Doney, Mintz-
Resudek, & Tarbox, 2004), and stimulus preference assessments (Lavie & Sturmey, 2002;
Miljkovic, Kaminski, Yu, & Wishnowski, 2015; Weldy et al., 2014).
Weldy and colleagues (2014) demonstrated that video modeling could be an effective,
time efficient, and inexpensive method of teaching staff to implement MSWO and free operant
preference assessments. The authors used a video model that included vocal instructions, and
taught staff in a group setting. All staff met mastery criterion following one or two viewings of
the video.

5
Similarly, Miljkovic et al. (2015) evaluated video modeling and video modeling followed
by a self-instruction manual to teach students to conduct MSWO preference assessment. They
found that video modeling alone was not sufficient to train students to meet the mastery criterion
of 85%. However, it is important to note that although participants did not meet mastery
criterion, they fell just below the criterion level. There was a substantial increase in their score
following one viewing of the video model. In this study, all participants moved on to the self-
instruction manual plus video model phase. The researchers failed to evaluate whether a second
viewing of the video model would be sufficient to teach the skills.
The purpose of this study was to evaluate the effectiveness of video modeling to train
parents to conduct PS preference assessments on their children. Although video modeling alone
was not effective in Miljkovic et al. (2015), it resulted in a substantial improvement and could
have been effective following a second viewing. Video modeling has been effective in teaching a
variety of other skills, and was effective in teaching preference assessments (Weldy et al., 2014).
This study extended the literature in three ways. First, it evaluated training of preference
assessments with a novel population. The majority of the studies described above used
participants who had experience working with individuals with disabilities, or who were students
(e.g. Graff & Karsten, 2012; Lavie & Sturmey, 2002; Roscoe & Fisher, 2008; Weldy et al.,
2014). The nature of the participants could have had an effect on their ability to learn the skills. It
is necessary to evaluate if parents can learn these skills in a similar manner. Second, this study
extended the research on the effectiveness of video modeling in general, as well as video
modeling specifically to train preference assessments. Finally, this study assessed the
generalization of skills on actual individuals with disabilities rather than actors. It was

6
hypothesized that the video model would be effective in teaching parents to conduct a PS
preference assessment.

7
CHAPTER TWO: METHOD
Participants and Setting
The participants in this study included three parents and their sons; Sarah and her 22-
year-old son Peter, Khloe and her 8-year-old son Justin, and Jennifer and her 3-year-old son
James. All of the children were diagnosed with Autism Spectrum Disorder and two (Justin and
James) were receiving ABA services on a weekly basis. Although Peter was not receiving
services at the time, he received services in the past. All of the children presented with limited
verbal repertoires and cognitive impairments. They all communicated wants and needs in three to
five word sentences, but required assistance to complete daily tasks. In addition, all caregivers
reported that their sons were “picky” when it comes to toys, or “only like a handful of things.”
Children were included if they were at least 3 years old, and were diagnosed with an intellectual
disability or presented with a limited verbal repertoire. They were excluded if they exhibited
severe problem behavior such as aggression towards caregivers or self-injurious behavior, or had
physical limitations that prevented them from reaching out and grabbing an item. In addition,
parents were excluded from the study if they had experience in behavior analytic course work or
training in conducting or directly observing preference assessments. All participants were
recruited through word of mouth at agencies serving individuals with autism or a flyer posted on
social media.
All phases of the study took place in the participants’ homes at an agreed upon time. In
addition, the assessments and training took place in a room that contained at least one table and

8
two chairs. Sarah’s sessions took place in her living room that included a card table (1 m by 1 m,
.6 m tall) with three chairs pushed against a white board wall, a television, a couch, and Peter’s
academic and behavioral supports (visual supports, token boards, workbooks, etc.). Khloe’s
sessions took place in the living/dining room area of the home, at a table (1 m by 1.1 m, 1 m tall)
with four chairs, a couch, Justin’s toys, and the television. Finally, Jennifer’s sessions took place
in the dining room of the house that included a round table (.8 m tall, 1.5 m diameter) with six
chairs, a flower centerpiece, and placemats. James sat in a booster seat during sessions.
Materials
The researcher provided the stimuli needed to conduct the PS preference assessment.
Each participant required five stimuli, and stimuli varied across participants depending on the
caregiver interview (see figures 2-4 for list of stimuli). In addition, a timer, data sheets (see
Appendix A) and pencils/pens were provided to the parents during every session. An iPad or
iPhone was used to video record sessions.
Target Behaviors
Target behaviors for the PS preference assessment were adapted from the procedures
described in Fisher et al. (1992). A complete task analysis of the target behaviors can be found in
Appendix B. A brief description of the target behaviors is as follows: allow the child to sample
all items individually for up to 30s each before beginning the assessment. Then, set two stimuli
on the table in front of the child and wait for up to 30s. If the child touches an item, immediately
remove the other item and let the child interact with the chosen item for up to 30s. If the child
does not respond, prompt him/her to sample each item separately for 30s each. Then re-present
9
both items and wait 30s. If the child still does not approach the items, remove them and move on
to the next pair. If at any point the child attempts to approach both items, block this attempt.
Continue this method until all pairs have been assessed. Record on the data sheet, which item
was selected from each pair presentation.
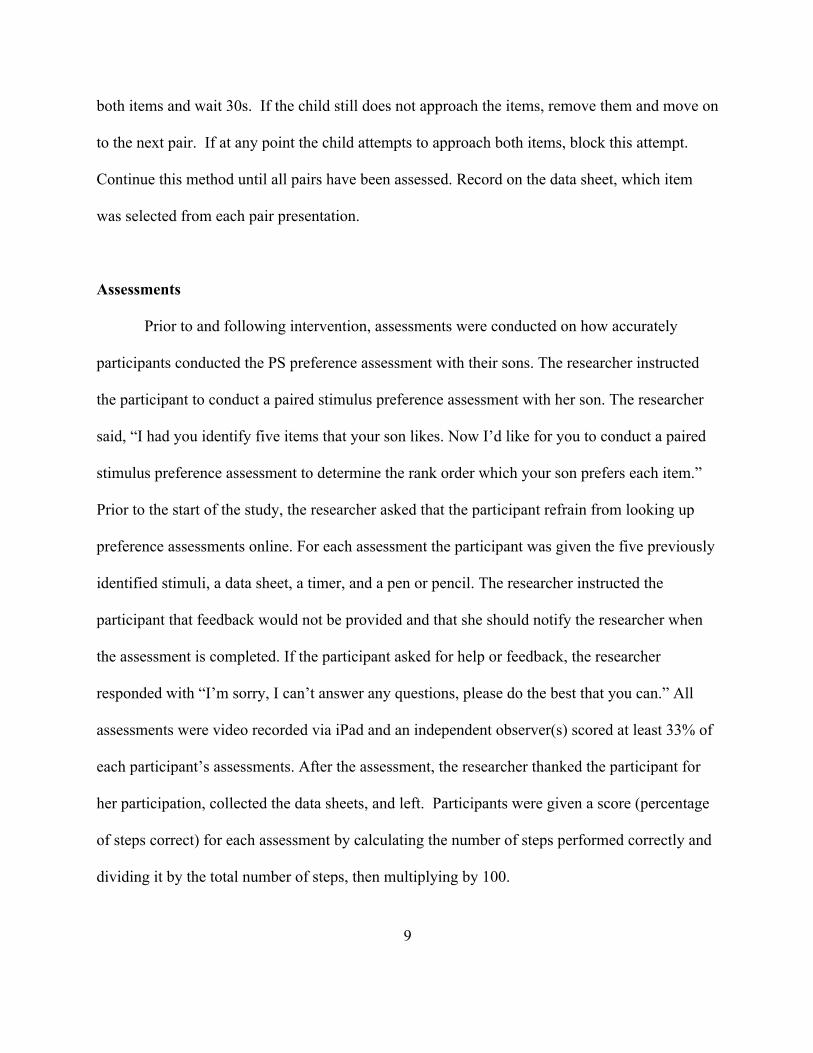
Assessments
Prior to and following intervention, assessments were conducted on how accurately
participants conducted the PS preference assessment with their sons. The researcher instructed
the participant to conduct a paired stimulus preference assessment with her son. The researcher
said, “I had you identify five items that your son likes. Now I’d like for you to conduct a paired
stimulus preference assessment to determine the rank order which your son prefers each item.”
Prior to the start of the study, the researcher asked that the participant refrain from looking up
preference assessments online. For each assessment the participant was given the five previously
identified stimuli, a data sheet, a timer, and a pen or pencil. The researcher instructed the
participant that feedback would not be provided and that she should notify the researcher when
the assessment is completed. If the participant asked for help or feedback, the researcher
responded with “I’m sorry, I can’t answer any questions, please do the best that you can.” All
assessments were video recorded via iPad and an independent observer(s) scored at least 33% of
each participant’s assessments. After the assessment, the researcher thanked the participant for
her participation, collected the data sheets, and left. Participants were given a score (percentage
of steps correct) for each assessment by calculating the number of steps performed correctly and
dividing it by the total number of steps, then multiplying by 100.

10
Inter-Observer Agreement
Inter-observer agreement (IOA) was assessed for 50% of Sarah’s sessions, 34% of
Khloe’s sessions, and 40% of Jennifer’s sessions, across all phases of the study. IOA averaged
96.2% throughout the study, 95.8% for baseline sessions, 96.2% for post training sessions, and
96.5% for follow up sessions. IOA ranged from 96.5% to 100% for Sarah, 93% to 100% for
Khloe, and 88.3% to 100% for Jennifer. The researcher video recorded all sessions using an iPad
or iPhone. During sessions in which IOA was assessed, a trained independent observer scored
the videos indicating which skills the participant performed correctly/incorrectly (see Appendix
C). IOA was calculated by dividing the number of agreements by the number of agreements plus
disagreements for each assessment, then taking the average across all assessments. An agreement
was defined as both observers scoring a step on the task analysis in the same way, either correct
or incorrect. In addition, any discrepancy in items determined as non applicable (n/a) was scored
as a disagreement. At the beginning of data collection, agreement for baseline sessions dropped
below 90% agreement, resulting in additional observer training. Following booster training, IOA
maintained above 90%.
Treatment Integrity
In addition to caregiver implementation of the preference assessment, treatment
implementation was video recorded to ensure fidelity. The researcher recorded the process of
viewing the video model; this video was viewed by an independent observer who used a
checklist to assess treatment integrity (see Appendix D). Treatment integrity remained at 100%
for all intervention sessions.

11
Social Validity
Social validity was assessed using a survey given to the parents at the conclusion of the
study. The survey inquired about their thoughts on the procedures, how well they performed, the
importance of the skills, and the likelihood that they would utilize the skills in the future (see
Appendix E).
Experimental Design and Procedure
This study used a non-concurrent multiple baseline design across participants. Prior to
beginning data collection, the researcher used BST to train two research assistants to collect IOA
data. Once the observers demonstrated mastery (at least 90% agreement with the researcher), the
study began.
Caregiver Interview
At the beginning of the study, the researcher interviewed caregivers to identify stimuli to
include in the preference assessment. The caregivers were asked to identify five different non-
edible stimuli that they believed their child might like. The stimuli were not limited to what was
available in the home. If the caregivers believed the child might like a certain item that they did
not own, the researcher obtained the item to be used in the preference assessment. Most
caregivers had some difficulty identifying five items; however Sarah reported that it was very
difficult for her to identify five items that were not edible. Following the interview, the
researcher asked the caregivers to rank the stimuli from highest to lowest preferred based on
their opinion of what the child would like. In addition, the researcher asked the caregivers to
indicate how confident they were in that ranking using a percentage.

12
Baseline
During baseline, the participant was given the necessary materials, and asked to conduct
a paired stimulus preference assessment with her son. No additional training materials were
provided. Following the conclusion of the assessment, the researcher thanked the participant for
her participation, collected the data sheets, and left.
Training
The intervention was a video model with embedded vocal instructions. The video model
showed a full demonstration of the preference assessment then broke down each step of the task
analysis, first identifying the step, and then showing a clip of the researcher demonstrating that
step. Participants were allowed to pause and rewind the video as needed however they were not
allowed to ask the researcher any questions related to the implementation of the preference
assessment. All of the information that participants received came from the video model and the
data sheet provided. In addition, participants were allowed to take notes during the training
session however they were not allowed access to those notes during the assessments or any time
after the training session. All participants chose to take notes during the training session.
Participants could view the video, as many times as they saw fit (during one session) and let the
researcher know when they finished reviewing the video. Participants did not have access to the
video model during assessments.
Assessments
Following one viewing of the video, assessments were conducted as they were in
baseline. Participants were instructed to conduct a paired stimulus preference assessment with
13
their sons. The researcher did not provide any additional instructions or answer any questions.
Data collection ended after the participant scored at 90% or above for three consecutive
assessments.
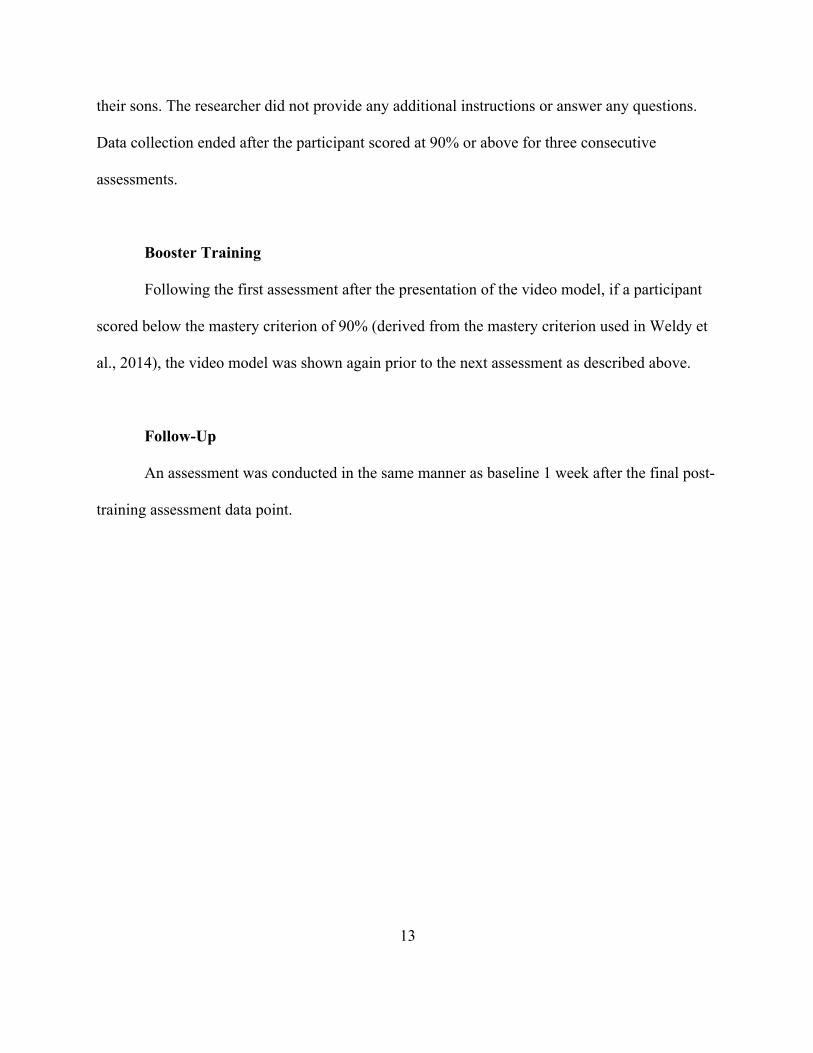
Booster Training
Following the first assessment after the presentation of the video model, if a participant
scored below the mastery criterion of 90% (derived from the mastery criterion used in Weldy et
al., 2014), the video model was shown again prior to the next assessment as described above.
Follow-Up
An assessment was conducted in the same manner as baseline 1 week after the final post-
training assessment data point.

14
CHAPTER THREE: RESULTS
Figure 1 depicts the percentage of correct steps in the task analysis each time the parents
conducted a PS preference assessment in baseline and after training. Following training, all three
participants demonstrated an increase in the percentage correct immediately. Khloe did not
achieve 90% immediately following the training, so a booster training session was conducted and
she met mastery criterion for the following two assessments. During the third assessment
following booster training, Khloe skipped a pair. She recorded the pair on the data sheet however
while conducting the assessment she skipped over it, resulting in a score of 89%. Due to her
consistent fidelity with other pairs and during other assessments as well as time constraints, the
researcher decided to continue to the follow up phase. During follow up, Khloe maintained a
score above the 90% criterion. These results indicate that a video model can be effective in
teaching parents to conduct PS preference assessments. In addition, this method resulted in skills
that maintained over 1 week.
Figures 2, 3, and 4 illustrate the results of the PS preference assessments for each child.
The researcher averaged the percentage of selections for each item across all assessments in
which parents met criterion. Table 1, organizes the results of the three PS preference assessments
in which parent’s scored the highest. It displays preferences in order of most preferred (1) to
least preferred (5). Items that have a decimal number are items the child selected with an equal
percentage. In addition, the table compares the results to the parents’ predicted rankings. The
results in table 1 show that the preferences of the children varied. Most and least preferred items

15
were somewhat consistent for all children, however items in the middle tend to vary. These
results illustrate how difficult it may be for parents to predict their children’s preferences. It also
indicates that the children’s interests are not as restricted as their parents may have believed.
These results provide further evidence for the need to teach parents this skill set.
At the conclusion of the study, parents completed a social validity survey (see Appendix
E) inquiring about their opinions of the intervention, their performance, the importance of the
skills, and the likelihood that they would utilize the skills in the future. With the exception of one
participant who indicated she “agreed” with the statement “I will use these skills again in the
future”, all participants indicated they “strongly agreed” with every item on the survey. The
video model proved to be a socially valid training method that was enjoyable to watch, effective,
and not intrusive.

16
Table 1
Caregiver Predictions and Child Preferences
Caregiver ranking Child Assessment 1 Child Assessment 2 Child Assessment 3
Sarah Peter Assessment 1 Peter Assessment 2 Peter Assessment 3
1. Music 1. Slime 1. Slime 1. Index Cards
2. Slime 2. Sand 2. Index Cards 2. Sand
3. Index Cards 3. Music 3. Sand 3.5 Slime
4. Sand 4. Bubbles 4. Music 3.5 Music
5. Bubbles 5. Index Cards 5. Bubbles 5. Bubbles
Khloe Justin Assessment 1 Justin Assessment 2 Justin Assessment 3
1. iPad 1. iPad 1.5 Truck 1. iPad
2. Small train 1.5 Phone 1.5 Small Train 2. Phone
3. Big Train 1.5 Truck 3. iPad 3. Small Train
4. Phone 4. Big Train 4.5 Phone 4.5 Truck
5. Truck 5. Small Train 4.5 Big Train 4.5 Big Train
Jennifer James Assessment 1 James Assessment 2 James Assessment 3
1. Tablet 1. Tablet 1. Tablet 1. Tablet
2. Train 2. Ball 2. Train 2.5 Ball
3. Music 3. Puzzle 3.5 Puzzle 2.5 Puzzle
4. Ball 4. Train 3.5 Ball 3.5 Train
5. Puzzle 5. Music 3.5 Music 3.5 Music
Note. This table compares each caregiver's hypothesized ranking of items to the actual preferences of their child determined by the three PS preference assessments in which parents scored the highest. Rank numbers with decimal points indicate that the items were selected at equal percentages.

17
Figure 1. The percentage of steps correct for each caregiver during each assessment in baseline, post training, and follow-up.

18
Figure 2. This bar graph depicts the preferences of Peter during the PS preference assessments conducted by his mother, Sarah.
Figure 3. This bar graph depicts the preferences of Justin during the PS preference assessments conducted by his mother, Khloe.

19
Figure 4. This bar graph depicts the preferences of James during the PS preference assessments conducted by his mother, Jennifer.

20
CHAPTER FOUR: DISCUSSION
This study provides evidence that a video model is an effective training method for
teaching parents to conduct PS preference assessments with their children. The findings extend
the literature by further demonstrating that video modeling is an effective training method when
implemented to teach individuals to conduct a PS preference assessment. In addition, this study
evaluated the feasibility of training this skill set with a novel population, parents of children with
intellectual disabilities. Finally, assessments were conducted using the participants’ children
rather than simulated clients. The findings demonstrate that assessment with actual
clients/students can be conducted immediately after training rather than testing skills in a role-
play or simulated assessment first, then on actual clients. This knowledge can save time and
money when providing this training to parents.
In addition to the findings regarding the effectiveness of the video model, this study
investigated parent’s ability to predict their children’s preferences. Results indicated that
caregivers were confident in their predictions, (confidence percentages ranged from 60%-90%)
but their predictions often varied from the results of the preference assessments and different
preference assessments differed as well. These findings suggest the caregivers had some
difficulty identifying the specific rank order of their children’s preferences and provide support
for the importance of teaching parents the skill set needed to conduct an actual preference
assessment.

21
The full video model was 9 min long. Sarah and Jennifer met mastery criterion following
one viewing of the video and neither participant paused or rewound the video, demonstrating a
total training time of 9 min. Khloe required one additional viewing of the video making the total
training time 18 min. In addition, the researcher used her computer (MacBook Pro), video
camera (Sony Camcorder), tripod, free video editing software (iMovie), and toy items to create
the video model. The researcher spent 1.5 hr creating the video (10 min preproduction, 20 min
production, and 1 hour post production). The time needed to create the video may increase or
decrease depending on the creator’s skill level with video production. However, if replicating
this study, it is not necessary that the researchers create a video. Researchers can search the
Internet for a video model that is already made. This training method appears to be both a time
and cost efficient alternative when training this skill set.
Although we do not have data to identify what features of the video model contributed to
its effectiveness, we can speculate that a number of features were important. First, according to
the participant’s opinions (strongly agree) on item 2 of the social validity survey, the video was
very easy to understand. Each step was explained thoroughly using modeling and instruction
simultaneously with the entire sequence and then each step individually. Second, the video was
short (9 min), making it likely that viewers remained focused throughout and retained the
information presented. Finally, the behavior of watching videos is one that most individuals have
experience with in comparison to reading articles/research or other forms of written instruction.
This history could have contributed to the speed with which the skills were learned, as well as
maintenance of the skills.
There were a few notable limitations of this study. The first being that the video model
failed to address how to respond to any problem behavior emitted by the child during the

22
preference assessment. Due to the fact that interventions that are implemented to decrease
problem behavior are individualized and based on functional assessment information, the
researcher chose to avoid addressing this issue in the video model. However, occasionally this
proved to be a challenge for participants. Participants seemed unsure how to respond during
instances in which their child left the table, or engaged in other disruptive behavior. On a few
occasions, the researcher had to redirect the child back to the table for the participant to finish the
assessment. The video model could have been improved by adding a few tips for managing the
typical types of disruptive behavior that can occur during preference assessments or other
assessment and teaching procedures.
In addition, due to an error by the researcher, the video model and scoring sheet did not
include one aspect of the PS preference assessment that should be included in the task analysis.
The task analysis should state that the participants should vary the presentation of the pairs so
that an item is placed on the left and the right side at least one time. The purpose of this step is to
prevent the occurrence of the child picking items based on the side that they are placed. The
researcher did not include this instruction in the video model therefore participants were not
evaluated on this aspect of the assessment. After further examination of the assessments, the
researcher determined that a side bias did not occur for any of the children (Peter picked left
51%, right 49%; Justin picked left 41%, right 59%; James picked left 55%, right 45%).
Future studies should replicate these procedures with more parents and a variety of client
populations to provide additional evidence on the effectiveness of this training method. When
replicating these procedures, researchers should address the limitations listed above. In addition,
researchers should investigate this training method to teach parents to conduct other types of
preference assessments including the multiple stimulus with and without replacement

23
assessments and free operant preference assessments. Furthermore, it would be valuable to
evaluate the generalization and maintenance of these skills by assessing parents’ ability to
conduct this assessment with new items including edibles. Finally, future studies should further
evaluate the use of video modeling to teach parents to conduct additional behavior analytic
interventions.

24
CHAPTER FIVE: REFERENCES
Adubato, S. A., Adams, M. K., & Budd, K. S. (1981). Teaching a parent to train a spouse
in child management techniques. Journal of Applied Behavior Analysis, 14, 193-205.
Anderson, C. M., & McMillan, K. (2001). Parental use of escape extinction and
differential reinforcement to treat food selectivity. Journal of Applied Behavior Analysis,
34, 511-515.
Anderson, S. R., Avery, D. L., DiPietro, E. K., Edwards, G. L., & Christian, W. P.
(1987). Intensive home-based early intervention with autistic children. Education and
Treatment of Children, 10, 352-366.
Ben Chaabane, D. B., Alber-Morgan, S. R., & DeBar, R. M. (2009). The effects of
parent-implemented pecs training on improvisation of mands by children with autism.
Journal of Applied Behavior Analysis, 42, 671-677.
Catania, C. N., Almeida, D., Liu-Constant, B., & Reed, F. D. D. (2009). Video modeling
to train staff to implement discrete-trial instruction. Journal of Applied Behavior
Analysis, 42, 387-392.
Christophersen, E. R., Arnold, C. M., Hill, D. W., & Quilitch, H. R. (1972). The home
point system: Token reinforcement procedures for application by parents of
children with behavior problems. Journal of Applied Behavior Analysis, 5 485
497.
25
Crockett, J. L., Fleming, R. K., Doepke, K. J., & Stevens, J. S. (2007). Parent training:
Acquisition and generalization of discrete trials teaching skills with parents of children
with autism. Research in Developmental Disabilities, 28, 23-36.
Fisher, W., Piazza, C. C., Bowman, L. G., Hagoplan, L. P., Owens, J. C., & Slevin, I.
(1992). A comparison of two approaches for identifying reinforcers for persons with
severe and profound disabilities. Journal of Applied Behavior Analysis, 25, 491-498.
Graff, R. B., & Karsten, A. M. (2012). Evaluation of a self-instruction package for
conducting stimulus preference assessments. Journal of Applied Behavior Analysis, 45,
69-82.
Green, C. W., Reid, D. H., Canipe, V. S., & Gardner, S. M. (1991). A comprehensive
evaluation of reinforcer identification processes for persons with profound multiple
handicaps. Journal of Applied Behavior Analysis, 24, 537-552.
Green, C. W., Reid, D. H., White, L. K., Halford, R. C., Brittain, D. P., & Gardner, S. M.
(1988). Identifying reinforcers for persons with profound handicaps: Staff opinion versus
systematic assessment of preferences. Journal of Applied Behavior Analysis, 21, 31-43.
Hsieh, H., Wilder, D. A., & Abellon, O. E. (2011). The effects of training on caregiver
implementation of incidental teaching. Journal of Applied Behavior Analysis, 44, 199-
203.
Kelley, M. L., Embry, L. H., & Baer, D. M. (1979). Skills for child management and
family support: Training parents for maintenance. Behavior Modification, 3, 373-396.
Krantz, P. J., MacDuff, M. T., & McClannahan, L. E. (1993). Programming participation
in family activities for children with autism: Parent’s use of photographic activity
schedules. Journal of Applied Behavior Analysis, 26, 137-138.

26
Kunnavatana, S. S., Bloom, S. E., Samaha, A. L., Lignugaris/Kraft, B., Dayton, E., &
Harris, S. K. (2013). Using a modified pyramidal training model to teach special
education teachers to conduct trial-based functional analyses. Teacher Education
and Special Education, 36, 267-285.
Lambert, J. M., Bloom, S. E., & Kunnavatana, S. (2013). Training residential staff to
conduct trial-based functional analyses. Journal of Applied Behavior Analysis, 46, 296-
300.
Lavie, T., & Sturmey, P. (2002). Training staff to conduct a paired-stimulus preference
assessment. Journal of Applied Behavior Analysis, 35, 209-211.
Miljkovic, M., Kaminski, L., Yu, C. T., & Wishnowski, L. (2015). Evaluation of video
modeling and self-instructional manual to teach students to conduct a preference
assessment. Journal on Developmental Disabilities, 21, 3-10.
Moore, J. W., & Fisher, W. W. (2007) The effects of videotape modeling on skill
acquisition of functional analysis methodology. Journal of Applied Behavior Analysis,
40, 197-202.
Muir, K. A., & Milan, M. A. (1982). Parent reinforcement for child achievement: The use
of a lottery to maximize parent training effects. Journal of Applied Behavior Analysis, 15,
455-460.
Ramon, D., Yu, C. T., Martin, G. L., & Martin, T. (2015). Evaluation of a self
instructional manual to teach multiple-stimulus without replacement preference
assessments. Journal of Behavioral Education, 24, 289-303.

27
Rinald, K. & Mirenda, P. (2012). Effectiveness of a modified rapid toilet training
workshop for parents of children with developmental disabilities. Research in
Developmental Disabilities, 33, 933-943.
Roscoe, E. M., & Fisher, W. W. (2008). Evaluation of an efficient method for training
staff to implement stimulus preference assessments. Journal of Applied Behavior
Analysis, 41, 249-254.
Roscoe, E. M., Fisher, W. W., Glover, A. C., & Volkert, V. M. (2006). Evaluating the
relative effects of feedback and contingent money for staff training of stimulus preference
assessments. Journal of Applied Behavior Analysis, 39, 63-77.
Sanders, M. R., & Glynn, T. (1981). Training parents in behavioral self-management: An
analysis of generalization and maintenance. Journal of Applied Behavior Analysis, 14,
223-237.
Seiverling, L., Williams, K., Sturmey, P., & Hart, S. (2012). Effects of behavioral skills
training on parental treatment of children’s food selectivity. Journal of Applied Behavior
Analysis, 45, 197-203.
Vladescu, J. C., Carroll, R., Paden, A., & Kodak, T. (2012). The effects of video
modeling with voiceover instruction on accurate implementation of discrete-trial
instruction. Journal of Applied Behavior Analysis, 45, 419-423.
Wallace, M. D., Doney, J. K., Mintz-Resudek, C. M., & Tarbox, R. S. F. (2004). Training
educators to implement functional analyses. Journal of Applied Behavior Analysis, 37,
89-92.
Weldy, C R., Rapp, J. T., & Capocasa, K. (2014). Training staff to implement brief
stimulus preference assessments. Journal of Applied Behavior Analysis, 47, 1-5.

28
APPENDICES

29
Appendix A: Paired Stimulus Preference Assessment Data Sheet
Date: _____________
Items:
A. _________________ B. _________________C. _________________
D. _________________E. _________________
Pairings:
1. _____________________ 6. _____________________
2. _____________________ 7. _____________________
3. _____________________ 8. _____________________
4. _____________________ 9. _____________________
5. _____________________ 10. _____________________
Item Selections # Presentations % Selections
A.
B.
C.
D.
E.

30
Appendix B: Paired Stimulus Preference Assessment Task Analysis
1. Randomly pair each item with all of the other items.
2. Bring child to the table
3. Present each item individually and allow the child to interact with the item for 30s each
4. Present the first pair of items
a. If the child approaches one item, remove the item that was not chosen and allow
the child to sample the chosen item for 30s.
b. If the child approaches both items, block the approach.
c. If the child does not approach either of the items, prompt the child to sample each
item individually for 30s. Then re-present both items and follow items a-b.
d. If the child still does not approach the items, move on to the next pair.
5. Record which item was selected
6. Remove the chosen item after 30s. If the child stops interacting with the item before the
30s have elapsed, remove it and begin the next pair.
7. After 30s remove the item and begin the next pairing.
8. Repeat steps 1-5 for the remainder of the pairs.
9. After all pairs have been presented, calculate the percentage of selections for each item.

31
Appendix C: IOA Scoring Data Sheet
Observer: Date: Participant #:
Assessment #:
Child is brought to the table Correct Incorrect N/A
Child is allowed to sample all 5 items
individually until the child stops interacting
with it, or 30s have elapsed.
Correct Incorrect N/A
Pair 1: (repeats for all ten pairs)
Pair 1 is presented Correct Incorrect N/A
Chosen item is sampled until the child stops
interacting with it, or 30s have elapsed
Correct Incorrect N/A
Item that was not chosen is removed Correct Incorrect N/A
Approaching both items is blocked Correct Incorrect N/A
If an item is not chosen in 30s, child is
prompted to sample both items individually for
30s
Correct Incorrect N/A
Items are represented Correct Incorrect N/A
Chosen item is sampled until the child stops
interacting with it, or 30s have elapsed
Correct Incorrect N/A
Item that was not chosen is removed Correct Incorrect N/A
Approaching both items is blocked Correct Incorrect N/A

32
If an item is not chosen, the items are removed
and the next trial begins
Correct Incorrect N/A
Chosen item is removed before next pair is
presented.
Correct Incorrect N/A
Caregiver does not provide additional attention
while child is interacting with item. – (i.e. the
only attention delivered should be related to the
instruction to chose an item)
Correct Incorrect N/A
All items are paired with other items Correct Incorrect N/A
# of selections are recorded for each item Correct Incorrect N/A
# of presentations are recorded for each
item
Correct Incorrect N/A
% selected is recorded for each item Correct Incorrect N/A
Total # correct: __________ Total possible: _____________ Score: ____________

33
Appendix D: Treatment Integrity Checklist
The participant watches the video
Video model is played entirely at least once
Yes No
Yes No
Researcher does not provide any additional
instructions
Yes No
If the participant asks for help or feedback,
the researcher responds with “I’m sorry, I
can’t answer any questions, do the best that
you can”
Yes No N/A
If the participant asks, the researchers says
yes the video can be paused, or rewound, or
viewed again
Yes No N/A
The participant verbally expresses that he
or she is done with the video
Yes No N/A

34
Appendix E: Social Validity Survey
Directions: Please circle the choice that indicates how much you agree with each statement.
1. I think it is important to know what my child likes.
�Strongly Disagree �Disagree �Neutral �Agree �Strongly Agree
2. The video was easy to understand
�Strongly Disagree �Disagree �Neutral �Agree �Strongly Agree
3. The video contained information that I consider to be useful
�Strongly Disagree �Disagree �Neutral �Agree �Strongly Agree
4. The video helped me learn the skills
�Strongly Disagree �Disagree �Neutral �Agree �Strongly Agree
5. After watching the video I felt comfortable conducting the preference assessment
�Strongly Disagree �Disagree �Neutral �Agree �Strongly Agree
6. The preference assessment helped me figure out what my child likes
�Strongly Disagree �Disagree �Neutral �Agree �Strongly Agree
7. I will use these skills again in the future
�Strongly Disagree �Disagree �Neutral �Agree �Strongly Agree

35
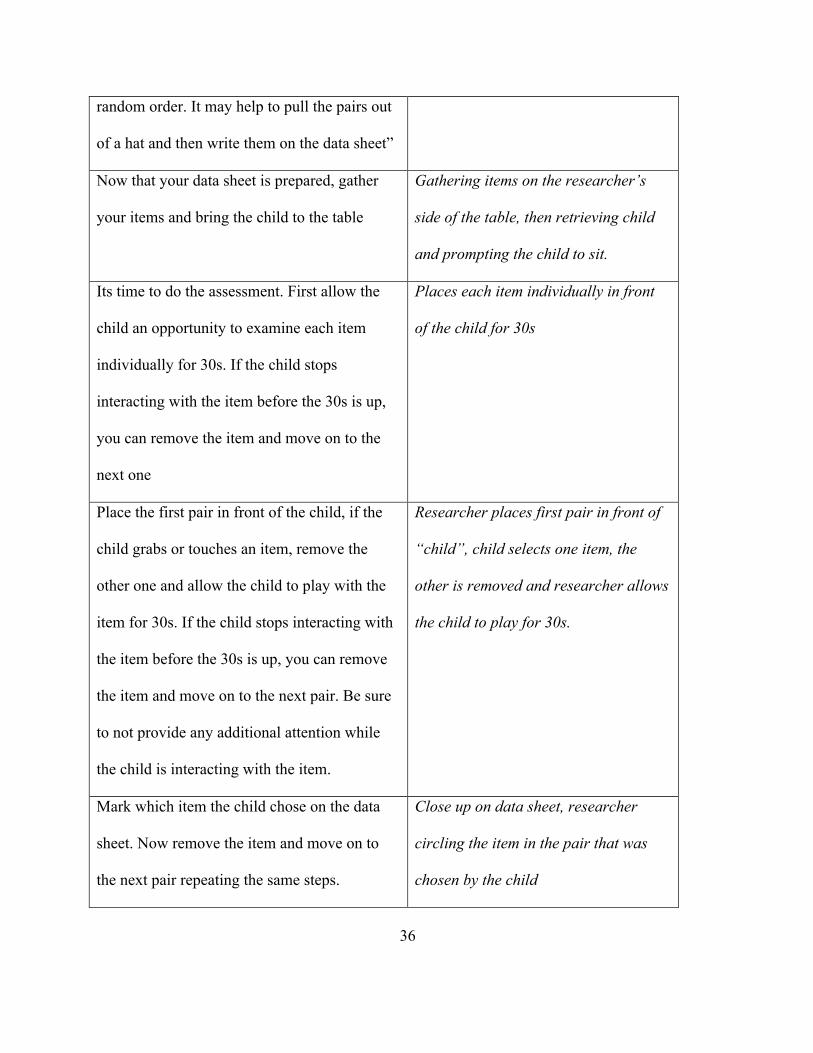
Appendix F: Video Model Script
“Today you will be watching a video showing you how to do a paired stimulus preference
assessment. The purpose of this assessment is to help identify things that your child might like.
Thank you for your participation, you can ask to pause or rewind the video at any time, however
you must watch the video in full, and the researcher cannot answer any questions. After you
watch the video you will be asked to do this assessment on your child. Please let the researcher
know when you are finished with the video. Enjoy!”
Voice Over Instruction Clip shown (Researcher acting as
parent, “child” will be played by a
research assistant)
Here is a full demonstration on how to do a
paired stimulus preference assessment. After
watching the whole thing, I will break down
each step.
Full video demonstration of preference
assessment with all pairs.
“First, make sure you have 5 different
items and write your pairings on the data sheet.
Each item should be paired with all the other
items one time. I find it easiest to pair your
first item with all the remaining ones, then the
second with the remaining and so on. Here is
an example. Make sure to present the pairs in
Close up on data sheet while
researcher pairs each items together on
sheets of paper. Pairs A to B, A to C, A
to D, A to E, then B to C, B to D etc.
Places pieces of paper in a hat/bowl
and takes them out recording the order
on the data sheet.
36
random order. It may help to pull the pairs out
of a hat and then write them on the data sheet”
Now that your data sheet is prepared, gather
your items and bring the child to the table
Gathering items on the researcher’s
side of the table, then retrieving child
and prompting the child to sit.
Its time to do the assessment. First allow the
child an opportunity to examine each item
individually for 30s. If the child stops
interacting with the item before the 30s is up,
you can remove the item and move on to the
next one
Places each item individually in front
of the child for 30s
Place the first pair in front of the child, if the
child grabs or touches an item, remove the
other one and allow the child to play with the
item for 30s. If the child stops interacting with
the item before the 30s is up, you can remove
the item and move on to the next pair. Be sure
to not provide any additional attention while
the child is interacting with the item.
Researcher places first pair in front of
“child”, child selects one item, the
other is removed and researcher allows
the child to play for 30s.
Mark which item the child chose on the data
sheet. Now remove the item and move on to
the next pair repeating the same steps.
Close up on data sheet, researcher
circling the item in the pair that was
chosen by the child

37
If the child tries to grab or touch both items,
block this effort, and prompt the child to “pick
one”.
Researcher places first pair in front of
child, child approaches both items,
researcher blocks this attempt
After presenting the pair for 30s, if the child
does not grab or touch either items, pick one
up, say the name of the item and show the
child how to play with the item, then hand it to
the child for 30s. Remove the item and repeat
with the second item.
Researcher picks up item A, and entices
the child then hands it to the child for
30s. Researcher removes item A, picks
up item B and shows the child how to
play with it then hands it to the child
for 30s.
Now, remove both items and re-present them
as you did before for 30s.
Researcher removes both items then re-
presents them for 30s
Make sure to mark down which item the child
chooses once you re-present the pair
Child selects an item, close up to data
sheet researcher marks the item
selected
If the child still does not grab or touch either
item, remove them and move on to the next
pair. Leave the data sheet blank for that pair.
Child does not select an item,
researcher removes items.
Now you can move on to the next pair and
repeat the same steps
Researcher removes items, close up to
data sheet showing next pair,
researcher presents pair.
Once you go through all the pairs and mark
which item the child chose, you can dismiss
Close up to data sheet completely filled
out, child leaving the table

38
the child.
To finish the assessment, you should write the
total number of times an item was chosen
under “item selections”
Close up to data sheet, researcher
filling out item selection column
Next, write how many times each item was
presented
Close up to data sheet, researcher
filling out # presentations column
Finally, calculate the % selections by dividing
selections by presentations and multiplying by
100%
Close up to data sheet, researcher
filling out % selections column
The item with the highest percentage is the
item that is most preferred by your child, the
number with the lowest percentage is the least
preferred item. You can repeat this assessment
over time to see if you get the same results, or
to see if your child’s preferences change. You
can also do this assessment with different items
later on.
Researcher speaking directly into
camera
Thank you for watching. If you would like to
watch the video again, or play a certain part
again, please let the researcher know. If you
are finished with the video please let the
researcher know. Now you will be asked to
Researcher speaking directly to camera

39
perform this assessment on your child. Have
fun!
40
Appendix G: IRB Expedited Approval for Initial Review Letter

41