Embed Size (px)
Citation preview

Watershed Management Tool for Evaluating BMPs : Case Studies in the Mackinaw and Upper
Sangamon River Watersheds
By
Laura Keefer 1 and Elias G. Bekele 2
1 Fluvial Geomorphologist, Illinois State Water Survey; 2 Research Hydrologist, Surface Water Hydrology and Hydraulics Section, Illinois State Water Survey, Prairie Research Institute
• Background • Watershed Monitoring • Watershed BMP Evaluation Tool
• Coupled optimization-watershed model • Watershed Case Studies • Decision support System • Summary
Outline
Background
Nine states in the Midwest (including Illinois) contribute 75% of nutrient fluxes to the Gulf of Mexico (predominantly agricultural sources)
Hypoxia in the Gulf and resulting in increased “Dead zone” - 8000 sq. mi. in 2008 (Alexander et. al, 2008)
Local impacts include impairment of drinking water supply sources, reduced habitat quality and biodiversity in rivers and streams, inefficiencies in nutrient management
Best Management Practices (BMPs) could serve as crucial control measures to reduce nutrient impacts, increase sustainable farming and be cost effective
Background (contd.)
BMPs can be either structural or non-structural conservation practices that help control loads at their source or transport to receiving water bodies
Implementation of BMPs should focus on critical source areas contributing significant loads
Selection of locations for BMPs should take into account not only ecological benefits but also associated implementation costs
This presentation discusses watershed management tools for evaluating BMPs - watershed case studies in Mackinaw and Upper Sangamon River watershed
Watershed monitoring
Watershed characterization Geology, soils, landscape, vegetative cover, land
management, urban cover/runoff, climate, etc. Hydrologic and water quality data collection
Streamgaging for continuous streamflow discharge WQ sampling throughout the year and during rainfall events Computing nutrient loading Provides:
data needed for calibration and verification to a particular watershed
relationships that can be applied to similar watersheds

Watershed BMP Evaluation Tool
Objectives optimal selection and placement of BMPs in a watershed
for maximum removal of nonpoint source pollutants such as sediment and nutrients
Striking a balance between ecological benefits and BMP implementation costs
Accomplish using Integrated Modeling Approach
Formulating the problem as multiobjective optimization Develop watershed simulation model Couple the watershed model with optimization algorithm
Selection/placement of BMPs as a function of NPS reduction and implementation costs.
Case Study: Mackinaw River Watershed
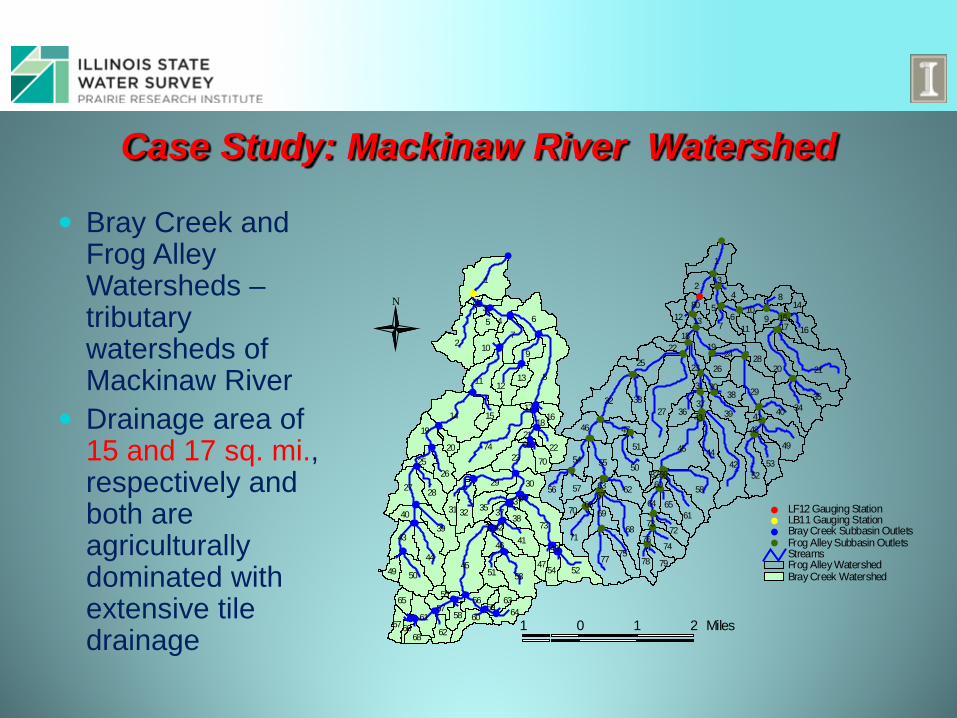
Bray Creek and Frog Alley Watersheds – tributary watersheds of Mackinaw River
Drainage area of 15 and 17 sq. mi., respectively and both are agriculturally dominated with extensive tile drainage
#
####
## ###### ###### ##
#### ## ##
#### ##
## ##
######## ##
## ####
## ############
####
## ##
##
#
#
#
#
## ####
####
##
#####
## ##
####
####
##
########
#### ##
#### # ## #
######## ######
##
#
#
#
#
# #
27
21
42
45
1
32
77
29
58
68
7
2
50
49
34
25
52
20
71
9
55
61
8
54
46
44
39
5
35
56
53
40
4
62
33
6
47
75
19
57
74
16
69
36
28
72
38
65
10
17
26
79
80
78
12
24
64
22
51
23
11
37
70
14
30
73
3
13
18
63
48
66
60
41
76
31
82
43
15
67
59
8
1
2
74
45
6
14
7
73
53
44
11
9
27
4
23
5250
39
29
19
43 41
32
28
12
5
61
2630
22
35
46
10
3
64
51
60
31
56
40
25
15
57
6762
70
47
16
54
63
38
65
49
58
68
13
20
55
37
2118
59
66
42
33
71
17
48
69
72
34
Bray Creek WatershedFrog Alley WatershedStreams
# Frog Alley Subbasin Outlets# Bray Creek Subbasin Outlets# LB11 Gauging Station# LF12 Gauging Station
1 0 1 2 Miles
N
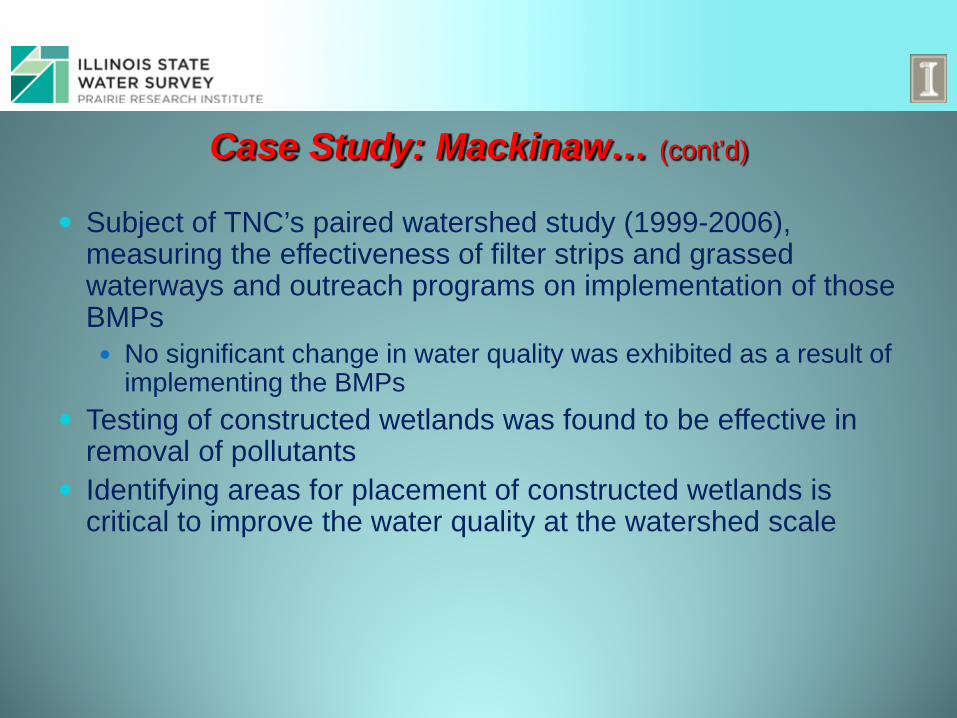
Case Study: Mackinaw… (cont’d)
Subject of TNC’s paired watershed study (1999-2006), measuring the effectiveness of filter strips and grassed waterways and outreach programs on implementation of those BMPs No significant change in water quality was exhibited as a result of
implementing the BMPs Testing of constructed wetlands was found to be effective in
removal of pollutants Identifying areas for placement of constructed wetlands is
critical to improve the water quality at the watershed scale
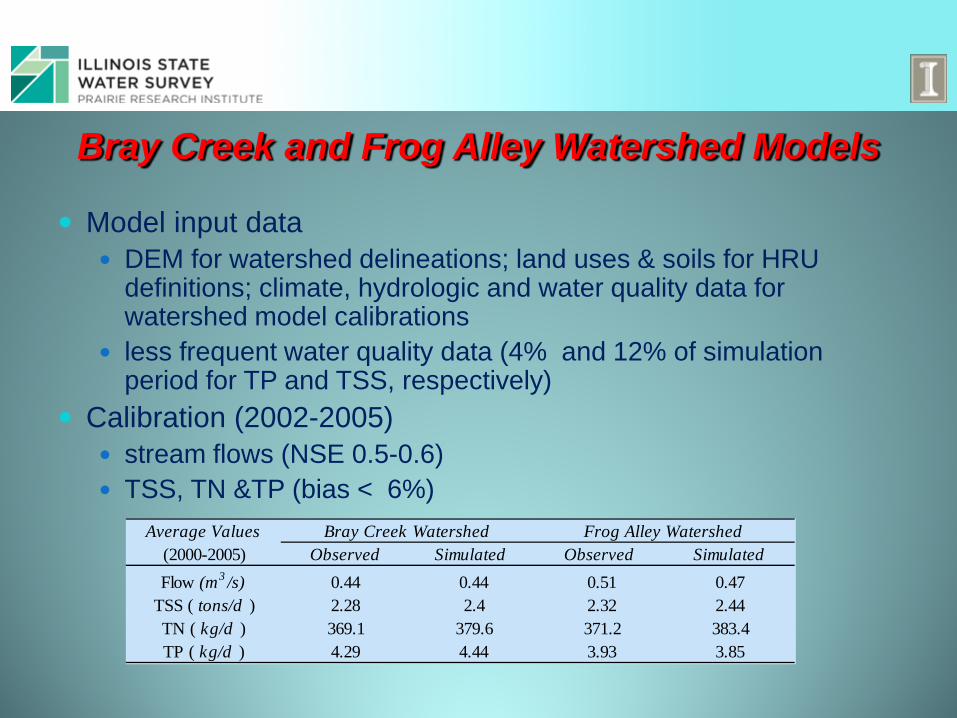
Bray Creek and Frog Alley Watershed Models
Model input data DEM for watershed delineations; land uses & soils for HRU
definitions; climate, hydrologic and water quality data for watershed model calibrations
less frequent water quality data (4% and 12% of simulation period for TP and TSS, respectively)
Calibration (2002-2005) stream flows (NSE 0.5-0.6) TSS, TN &TP (bias < 6%)
Average Values(2000-2005) Observed Simulated Observed SimulatedFlow (m3 /s) 0.44 0.44 0.51 0.47
TSS ( tons/d ) 2.28 2.4 2.32 2.44TN ( kg/d ) 369.1 379.6 371.2 383.4TP ( kg/d ) 4.29 4.44 3.93 3.85
Bray Creek Watershed Frog Alley Watershed
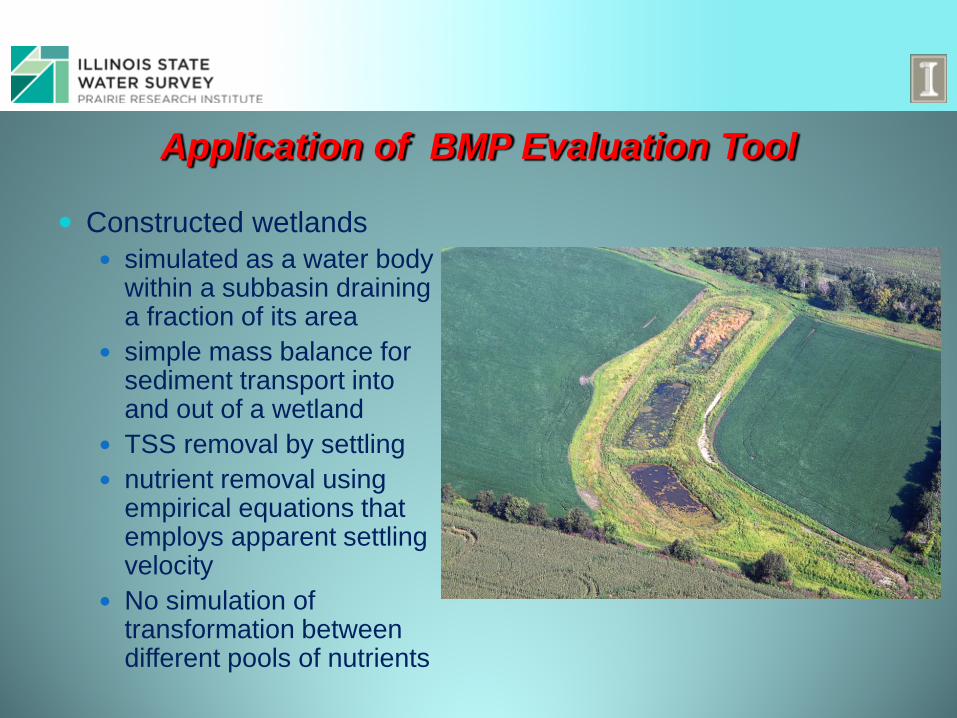
Application of BMP Evaluation Tool
Constructed wetlands simulated as a water body
within a subbasin draining a fraction of its area
simple mass balance for sediment transport into and out of a wetland
TSS removal by settling nutrient removal using
empirical equations that employs apparent settling velocity
No simulation of transformation between different pools of nutrients
Application of BMP … (cont’d)
Wetland specification including sediment and nutrient removal efficiencies are based on TNC’s study on Franklin Farm experimental watershed Ratio of wetland surface to watershed drainage area (HRU)
is 0.5 The minimum threshold wetland drainage area is fixed at 5
hectares ( 0.02 sq mi.) Implementation cost including maintenance is $3,000 per
acre excluding land value
Application Results
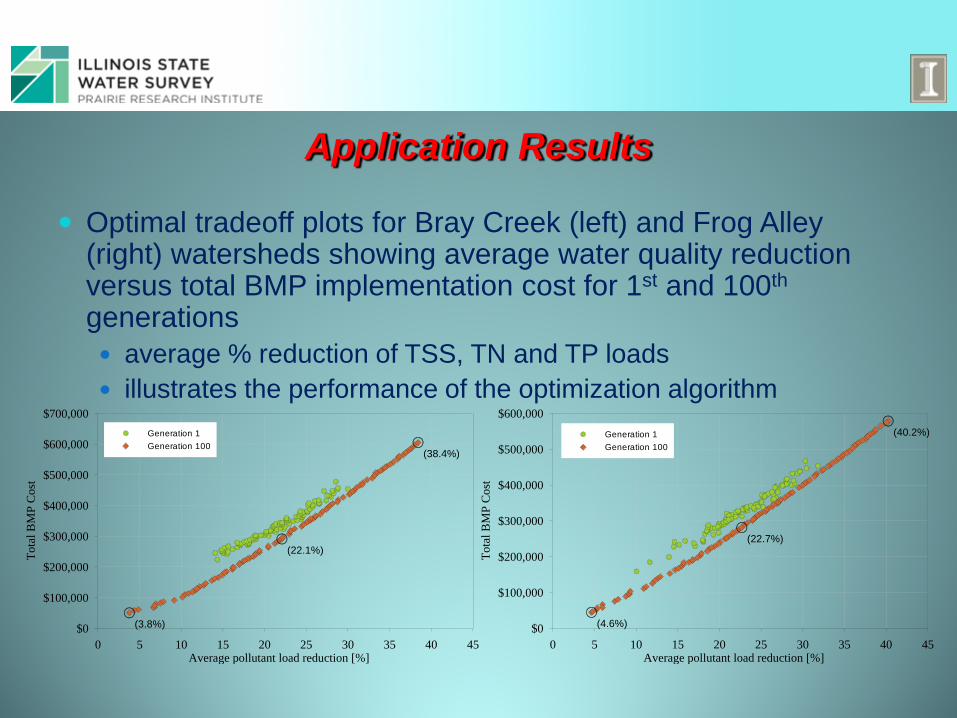
Optimal tradeoff plots for Bray Creek (left) and Frog Alley (right) watersheds showing average water quality reduction versus total BMP implementation cost for 1st and 100th generations average % reduction of TSS, TN and TP loads illustrates the performance of the optimization algorithm
0 5 10 15 20 25 30 35 40 45Average pollutant load reduction [%]
$0
$100,000
$200,000
$300,000
$400,000
$500,000
$600,000
$700,000
Tota
l BM
P C
ost
Generation 1Generation 100
(3.8%)
(22.1%)
(38.4%)
0 5 10 15 20 25 30 35 40 45Average pollutant load reduction [%]
$0
$100,000
$200,000
$300,000
$400,000
$500,000
$600,000
Tota
l BM
P C
ost
Generation 1Generation 100
(4.6%)
(22.7%)
(40.2%)
Application Results – Bray Creek Watershed
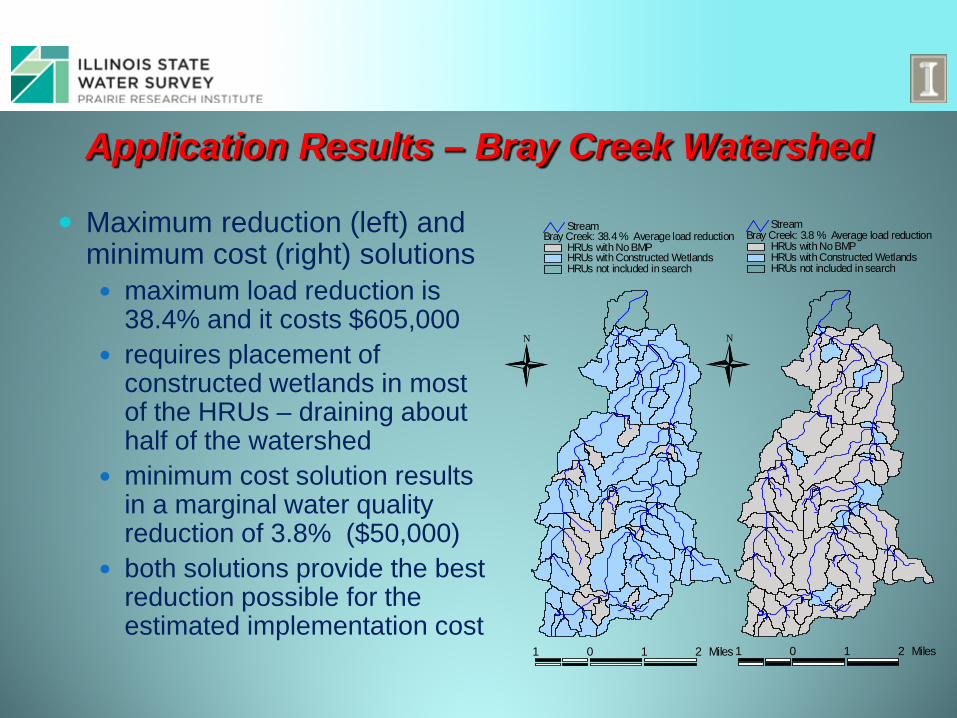
Maximum reduction (left) and minimum cost (right) solutions maximum load reduction is
38.4% and it costs $605,000 requires placement of
constructed wetlands in most of the HRUs – draining about half of the watershed
minimum cost solution results in a marginal water quality reduction of 3.8% ($50,000)
both solutions provide the best reduction possible for the estimated implementation cost
N
Bray Creek: 38.4 % Average load reductionHRUs with No BMPHRUs with Constructed WetlandsHRUs not included in search
Stream
1 0 1 2 Miles
N
Bray Creek: 3.8 % Average load reductionHRUs with No BMPHRUs with Constructed WetlandsHRUs not included in search
Stream
1 0 1 2 Miles
Application Results – Best Tradeoff
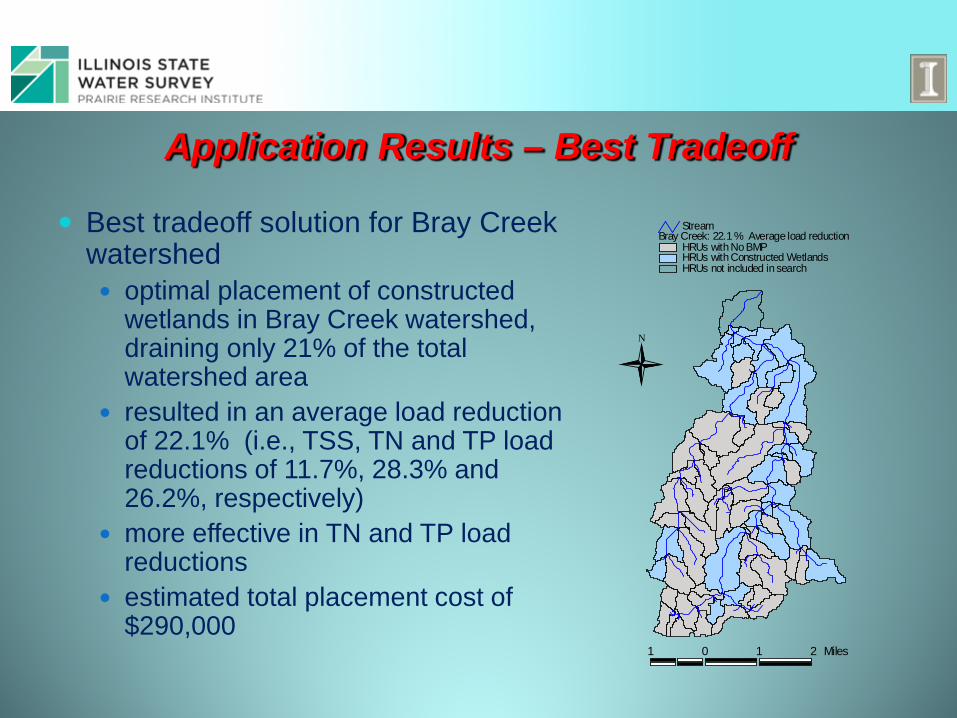
Best tradeoff solution for Bray Creek watershed optimal placement of constructed
wetlands in Bray Creek watershed, draining only 21% of the total watershed area
resulted in an average load reduction of 22.1% (i.e., TSS, TN and TP load reductions of 11.7%, 28.3% and 26.2%, respectively)
more effective in TN and TP load reductions
estimated total placement cost of $290,000
N
Bray Creek: 22.1 % Average load reductionHRUs with No BMPHRUs with Constructed WetlandsHRUs not included in search
Stream
1 0 1 2 Miles
Case Study: Upper Sangamon River Watershed
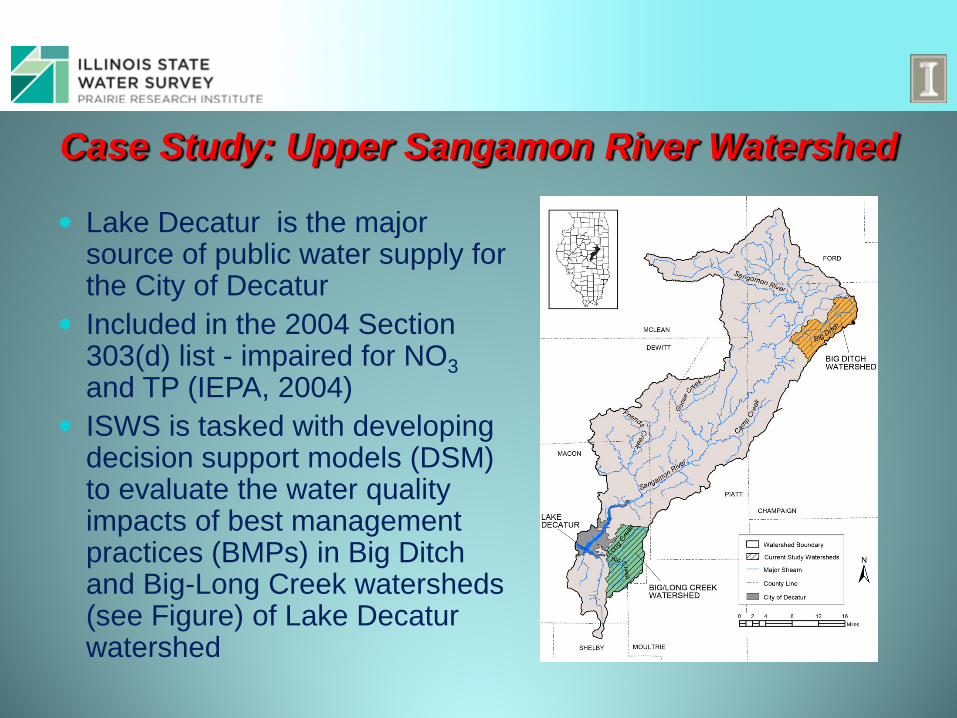
Lake Decatur is the major source of public water supply for the City of Decatur
Included in the 2004 Section 303(d) list - impaired for NO3 and TP (IEPA, 2004)
ISWS is tasked with developing decision support models (DSM) to evaluate the water quality impacts of best management practices (BMPs) in Big Ditch and Big-Long Creek watersheds (see Figure) of Lake Decatur watershed
Case Study: Upper Sangamon... (cont’d)
Big Ditch and Big-Long Creek Watersheds have drainage areas of 41 and 48 sq.mi., respectively.
Both are agriculturally dominated with 90% in corn-soybean rotation and extensive tile drainage
Unlike, Mackinaw watershed, there exists more extensive
hydrologic and nutrient data available for use in the modeling 1993 -2008 (Keefer, et al., 2010 – City of Decatur) 2005 – 2008 (Keefer and Bauer, 2010 – IEPA, AWI)
Watershed models are developed for both watersheds Hydrologic and water quality model calibration has been
completed.
Case Study: Upper Sangamon... (cont’d)
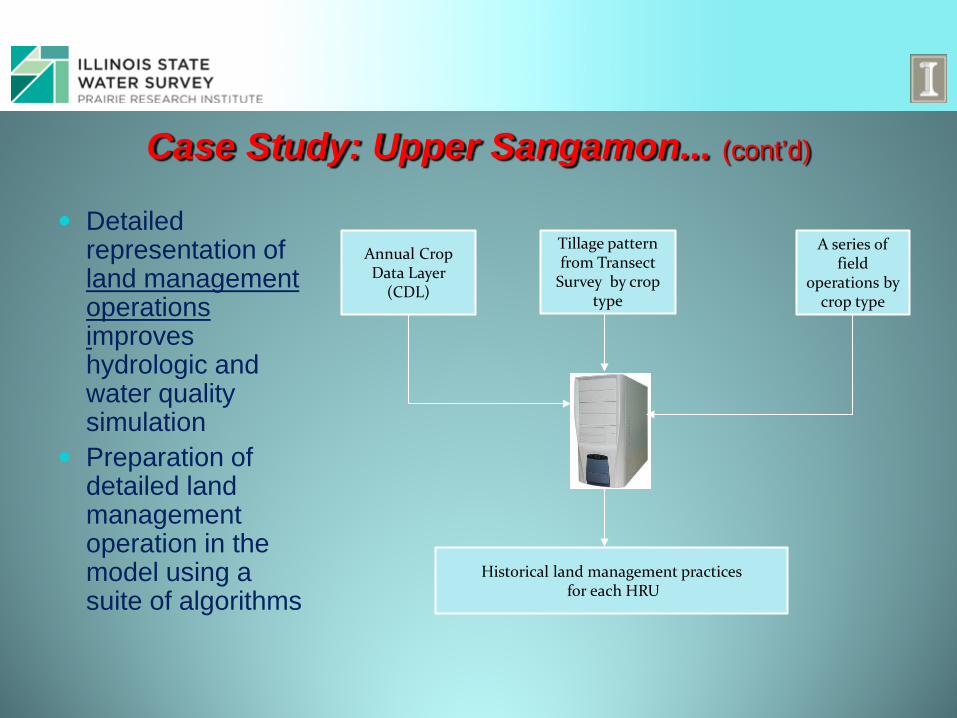
Detailed representation of land management operations improves hydrologic and water quality simulation
Preparation of detailed land management operation in the model using a suite of algorithms
Annual Crop Data Layer
(CDL)
Tillage pattern from Transect
Survey by crop type
A series of field
operations by crop type
Historical land management practices for each HRU

Summary Coupled model which locates areas for BMPs with
optimal water quality reduction and implementation costs Develop BMP efficiencies from recent studies (test novel
BMPs) Monitoring data tailors results to particular watershed for
“custom” results but Has application in other agriculturally dominated
watersheds in Illinois
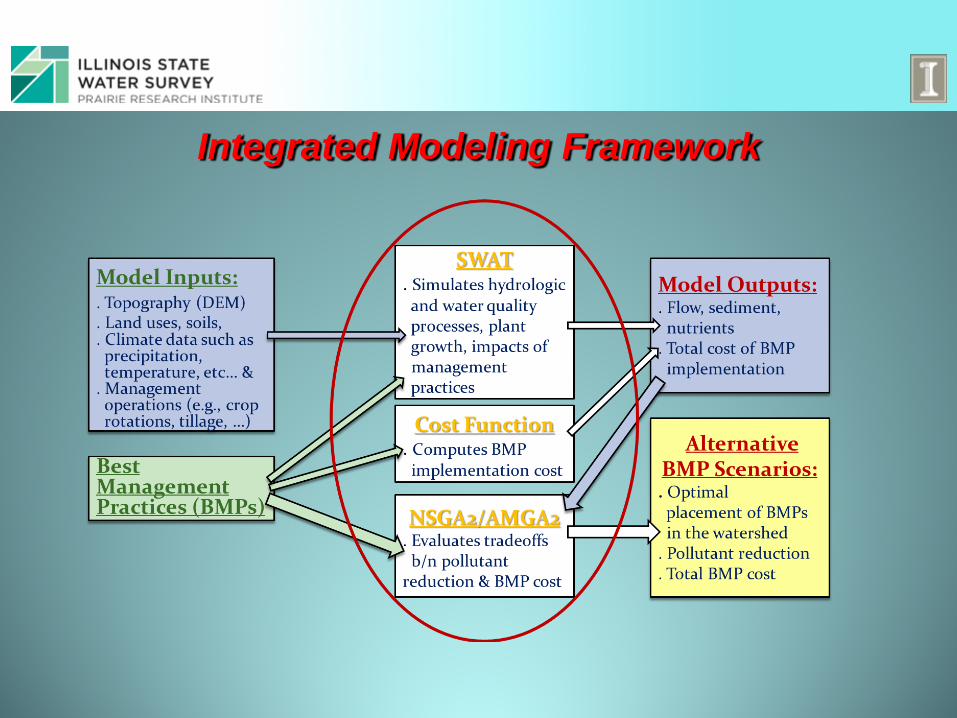
Development of DSS allows stakeholders in modeled watershed make decision for their situation