Embed Size (px)
Citation preview

INVESTOR PRESENTATION
December 2017
1Confidential
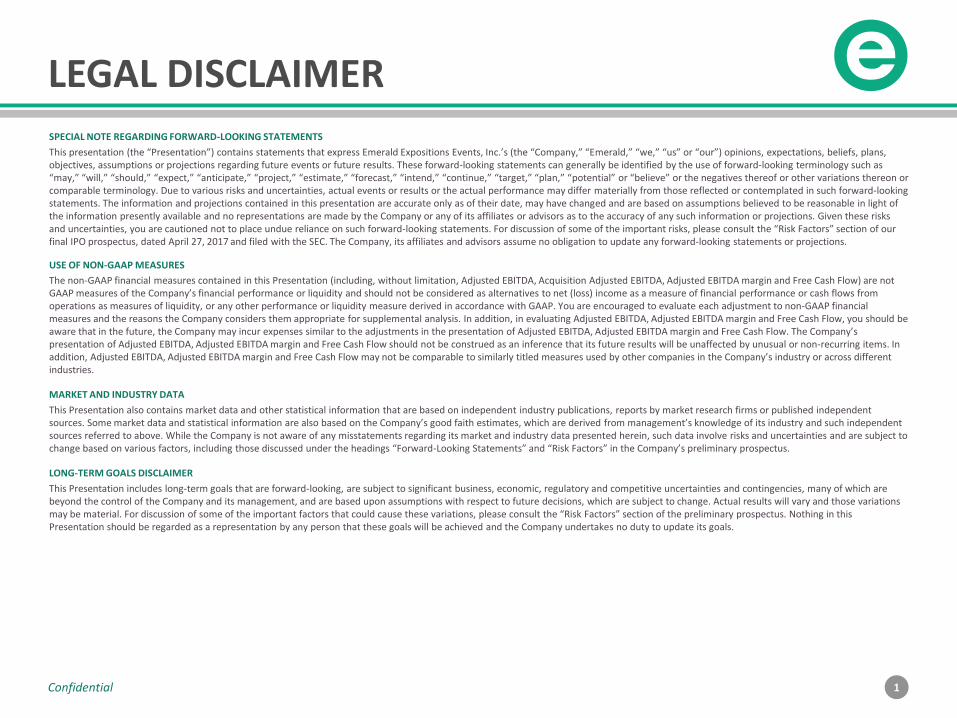
LEGAL DISCLAIMERSPECIAL NOTE REGARDING FORWARD-LOOKING STATEMENTS
This presentation (the “Presentation”) contains statements that express Emerald Expositions Events, Inc.’s (the “Company,” “Emerald,” “we,” “us” or “our”) opinions, expectations, beliefs, plans, objectives, assumptions or projections regarding future events or future results. These forward-looking statements can generally be identified by the use of forward-looking terminology such as “may,” “will,” “should,” “expect,” “anticipate,” “project,” “estimate,” “forecast,” “intend,” “continue,” “target,” “plan,” “potential” or “believe” or the negatives thereof or other variations thereon or comparable terminology. Due to various risks and uncertainties, actual events or results or the actual performance may differ materially from those reflected or contemplated in such forward-looking statements. The information and projections contained in this presentation are accurate only as of their date, may have changed and are based on assumptions believed to be reasonable in light of the information presently available and no representations are made by the Company or any of its affiliates or advisors as to the accuracy of any such information or projections. Given these risks and uncertainties, you are cautioned not to place undue reliance on such forward-looking statements. For discussion of some of the important risks, please consult the “Risk Factors” section of our final IPO prospectus, dated April 27, 2017 and filed with the SEC. The Company, its affiliates and advisors assume no obligation to update any forward-looking statements or projections.
USE OF NON-GAAP MEASURES
The non-GAAP financial measures contained in this Presentation (including, without limitation, Adjusted EBITDA, Acquisition Adjusted EBITDA, Adjusted EBITDA margin and Free Cash Flow) are not GAAP measures of the Company’s financial performance or liquidity and should not be considered as alternatives to net (loss) income as a measure of financial performance or cash flows from operations as measures of liquidity, or any other performance or liquidity measure derived in accordance with GAAP. You are encouraged to evaluate each adjustment to non-GAAP financial measures and the reasons the Company considers them appropriate for supplemental analysis. In addition, in evaluating Adjusted EBITDA, Adjusted EBITDA margin and Free Cash Flow, you should be aware that in the future, the Company may incur expenses similar to the adjustments in the presentation of Adjusted EBITDA, Adjusted EBITDA margin and Free Cash Flow. The Company’s presentation of Adjusted EBITDA, Adjusted EBITDA margin and Free Cash Flow should not be construed as an inference that its future results will be unaffected by unusual or non-recurring items. In addition, Adjusted EBITDA, Adjusted EBITDA margin and Free Cash Flow may not be comparable to similarly titled measures used by other companies in the Company’s industry or across different industries.
MARKET AND INDUSTRY DATA
This Presentation also contains market data and other statistical information that are based on independent industry publications, reports by market research firms or published independent sources. Some market data and statistical information are also based on the Company’s good faith estimates, which are derived from management’s knowledge of its industry and such independent sources referred to above. While the Company is not aware of any misstatements regarding its market and industry data presented herein, such data involve risks and uncertainties and are subject to change based on various factors, including those discussed under the headings “Forward-Looking Statements” and “Risk Factors” in the Company’s preliminary prospectus.
LONG-TERM GOALS DISCLAIMER
This Presentation includes long-term goals that are forward-looking, are subject to significant business, economic, regulatory and competitive uncertainties and contingencies, many of which are beyond the control of the Company and its management, and are based upon assumptions with respect to future decisions, which are subject to change. Actual results will vary and those variations may be material. For discussion of some of the important factors that could cause these variations, please consult the “Risk Factors” section of the preliminary prospectus. Nothing in this Presentation should be regarded as a representation by any person that these goals will be achieved and the Company undertakes no duty to update its goals.

2Confidential
Significant and Growing Market Opportunity1
2 Extensive Portfolio of Large, Market-Leading Shows
3
4
Highly Diversified Business
Multiple Organic Growth Levers
5 Long Acquisition Runway
INVESTMENT HIGHLIGHTS
HIGHLY EXPERIENCED LEADERSHIP TEAM
6 Exceptional Financial Characteristics
3Confidential
SIGNIFICANT AND GROWING MARKET OPPORTUNITY
1
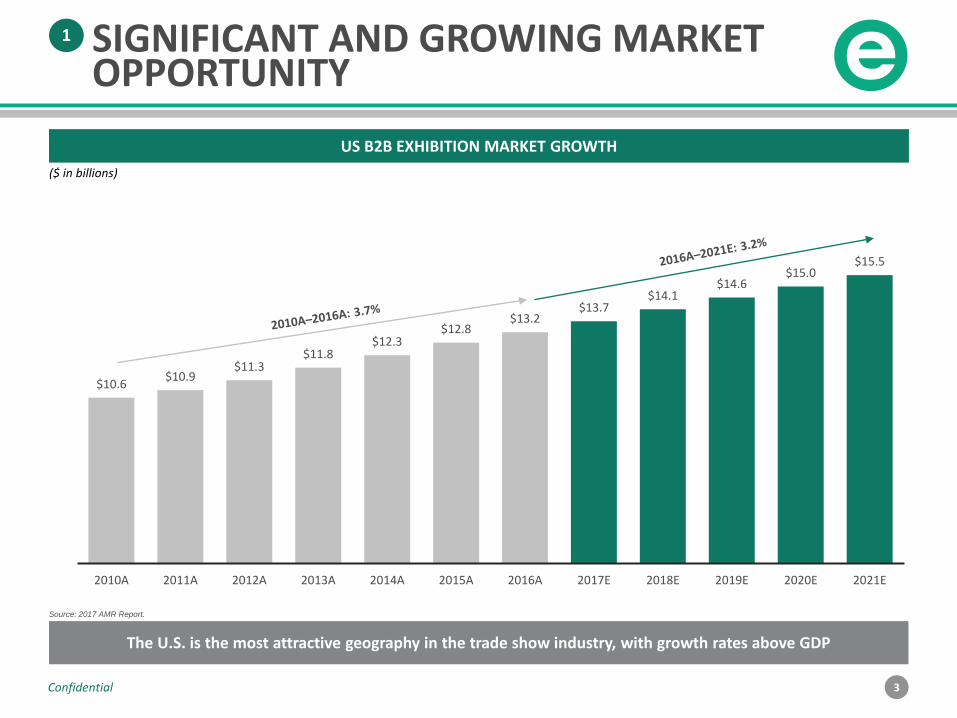
$10.6$10.9
$11.3$11.8
$12.3$12.8
$13.2$13.7
$14.1$14.6
$15.0$15.5
2010A 2011A 2012A 2013A 2014A 2015A 2016A 2017E 2018E 2019E 2020E 2021E
US B2B EXHIBITION MARKET GROWTH
The U.S. is the most attractive geography in the trade show industry, with growth rates above GDP
Source: 2017 AMR Report.
($ in billions)
4Confidential
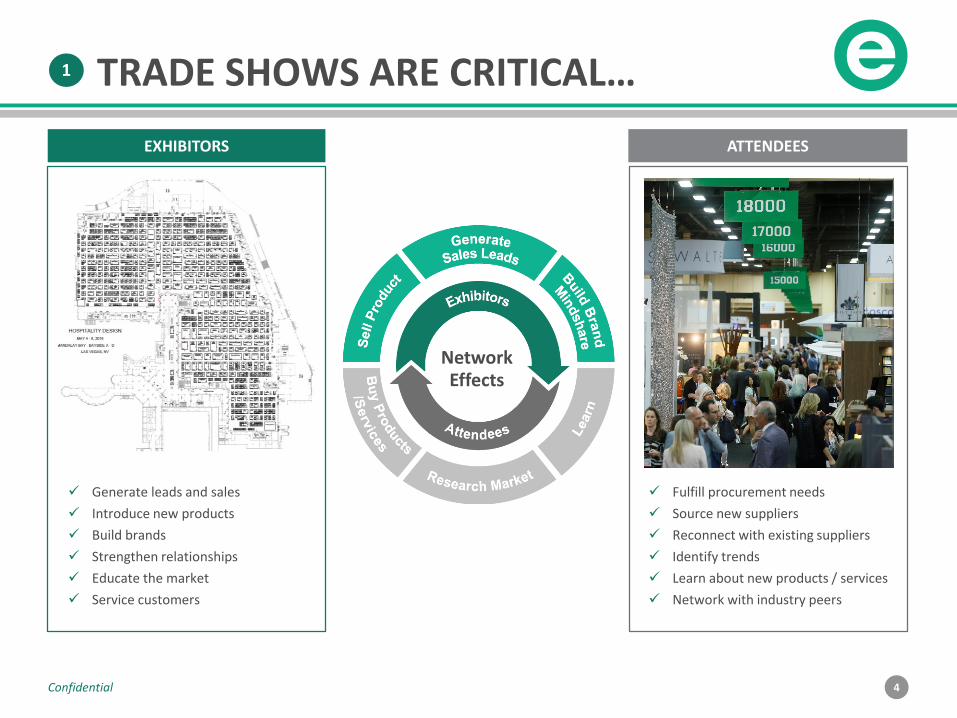
TRADE SHOWS ARE CRITICAL…
Network Effects
✓ Fulfill procurement needs
✓ Source new suppliers
✓ Reconnect with existing suppliers
✓ Identify trends
✓ Learn about new products / services
✓ Network with industry peers
ATTENDEESEXHIBITORS
✓ Generate leads and sales
✓ Introduce new products
✓ Build brands
✓ Strengthen relationships
✓ Educate the market
✓ Service customers
1
5Confidential
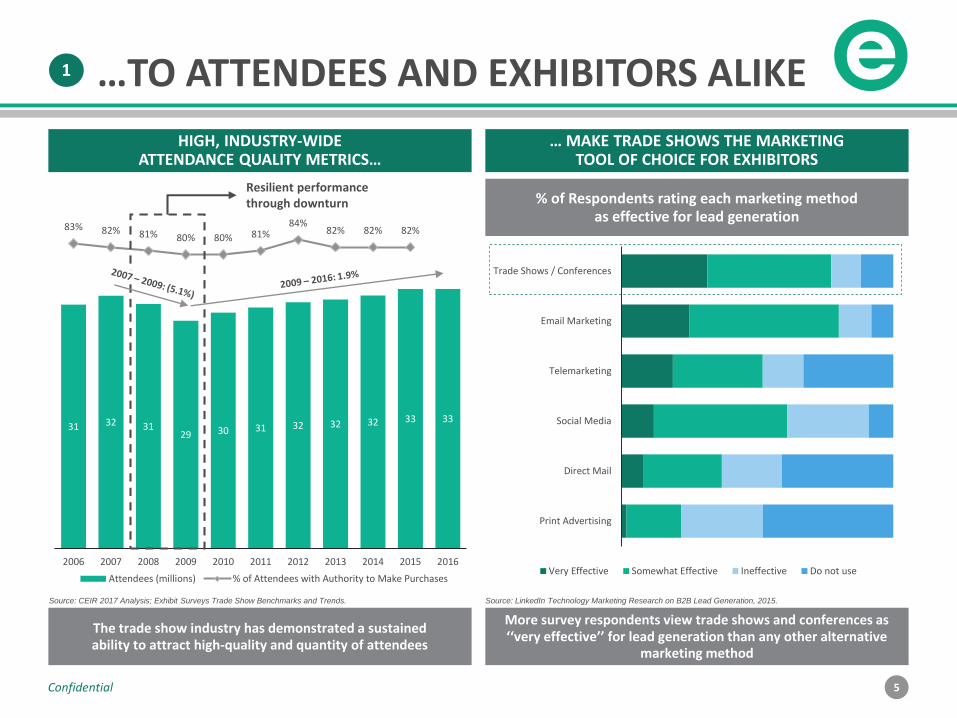
Print Advertising
Direct Mail
Social Media
Telemarketing
Email Marketing
Trade Shows / Conferences
Very Effective Somewhat Effective Ineffective Do not use
% of Respondents rating each marketing method as effective for lead generation
More survey respondents view trade shows and conferences as ‘‘very effective’’ for lead generation than any other alternative
marketing method
… MAKE TRADE SHOWS THE MARKETING TOOL OF CHOICE FOR EXHIBITORS
The trade show industry has demonstrated a sustained ability to attract high-quality and quantity of attendees
HIGH, INDUSTRY-WIDE ATTENDANCE QUALITY METRICS…
31 32 31 29 30 31 32 32 32 33 33
83% 82% 81% 80% 80% 81%84%
82% 82% 82%
2006 2007 2008 2009 2010 2011 2012 2013 2014 2015 2016
Attendees (millions) % of Attendees with Authority to Make Purchases
Resilient performance through downturn
…TO ATTENDEES AND EXHIBITORS ALIKE
Source: CEIR 2017 Analysis; Exhibit Surveys Trade Show Benchmarks and Trends. Source: LinkedIn Technology Marketing Research on B2B Lead Generation, 2015.
1
6Confidential
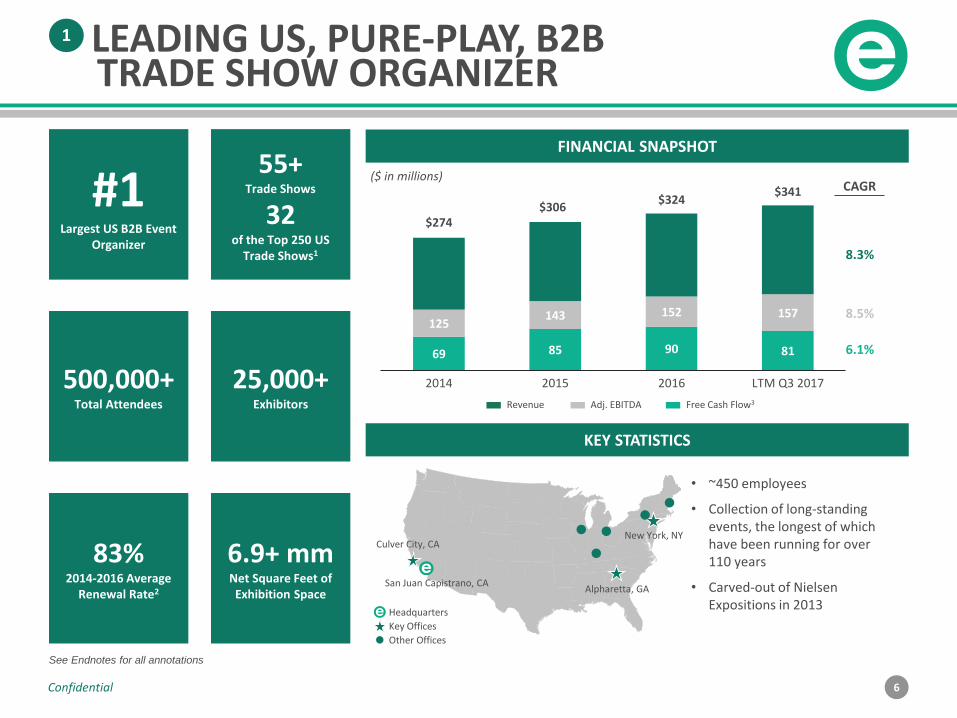
LEADING US, PURE-PLAY, B2BTRADE SHOW ORGANIZER
1
69 85 90 81
125143 152 157
$274$306
$324$341
2014 2015 2016 LTM Q3 2017
FINANCIAL SNAPSHOT
#1Largest US B2B Event
Organizer
55+Trade Shows
32of the Top 250 US
Trade Shows1
500,000+Total Attendees
25,000+Exhibitors
83%2014-2016 Average
Renewal Rate2
6.9+ mmNet Square Feet of Exhibition Space
Revenue Adj. EBITDA Free Cash Flow3
($ in millions)CAGR
8.3%
8.5%
6.1%
KEY STATISTICS
• ~450 employees
• Collection of long-standing events, the longest of which have been running for over 110 years
• Carved-out of Nielsen Expositions in 2013
Headquarters
Key Offices
Other Offices
San Juan Capistrano, CAAlpharetta, GA
New York, NYCulver City, CA
See Endnotes for all annotations
7Confidential
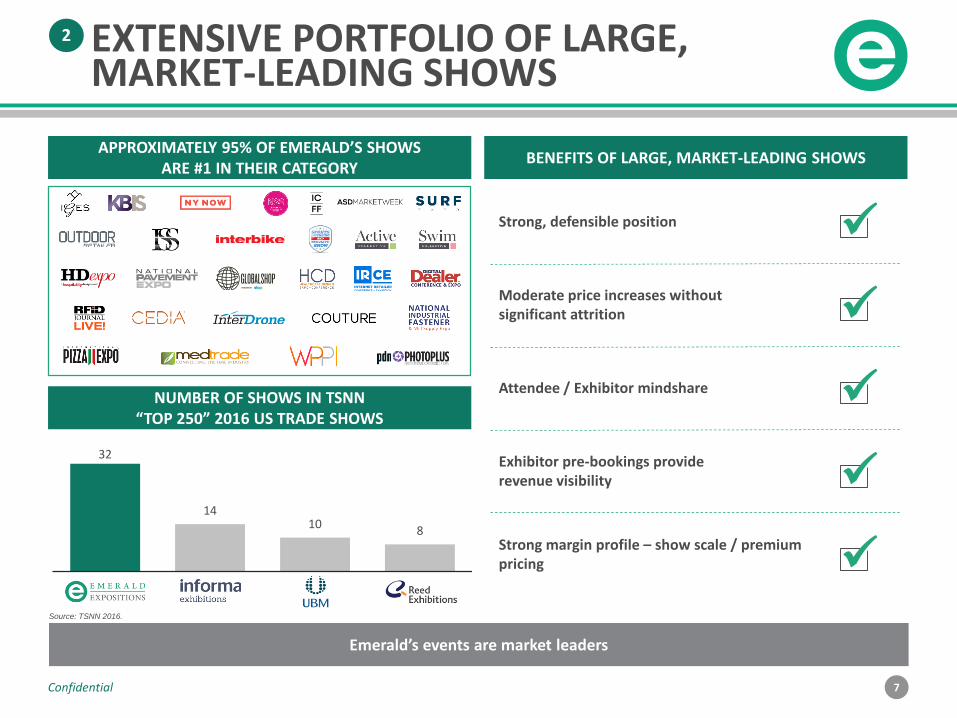
NUMBER OF SHOWS IN TSNN “TOP 250” 2016 US TRADE SHOWS
32
14 10
8
BENEFITS OF LARGE, MARKET-LEADING SHOWS
Strong, defensible position
Moderate price increases without significant attrition
Attendee / Exhibitor mindshare
Exhibitor pre-bookings provide revenue visibility
Strong margin profile – show scale / premium pricing
✓
EXTENSIVE PORTFOLIO OF LARGE, MARKET-LEADING SHOWS
APPROXIMATELY 95% OF EMERALD’S SHOWS ARE #1 IN THEIR CATEGORY
✓
✓
✓
✓
2
Source: TSNN 2016.
Emerald’s events are market leaders

8Confidential
HIGHLY DIVERSIFIED BUSINESS3
38%
19%
8%
8%
6%
8%
5%
8%
LTM SEPTEMBER 2017 REVENUE BY INDUSTRY SECTOR4
JewelryGift, Home and General Merchandise
Sports
Design & Construction
Technology
Other Trade Shows
Other Marketing Services
Other Events
Diversified across industry, show, exhibitor and attendee
Top 5 Shows36%
All Other Shows64%
YTD 2017 EVENT CONTRIBUTION TO TOTAL REVENUE
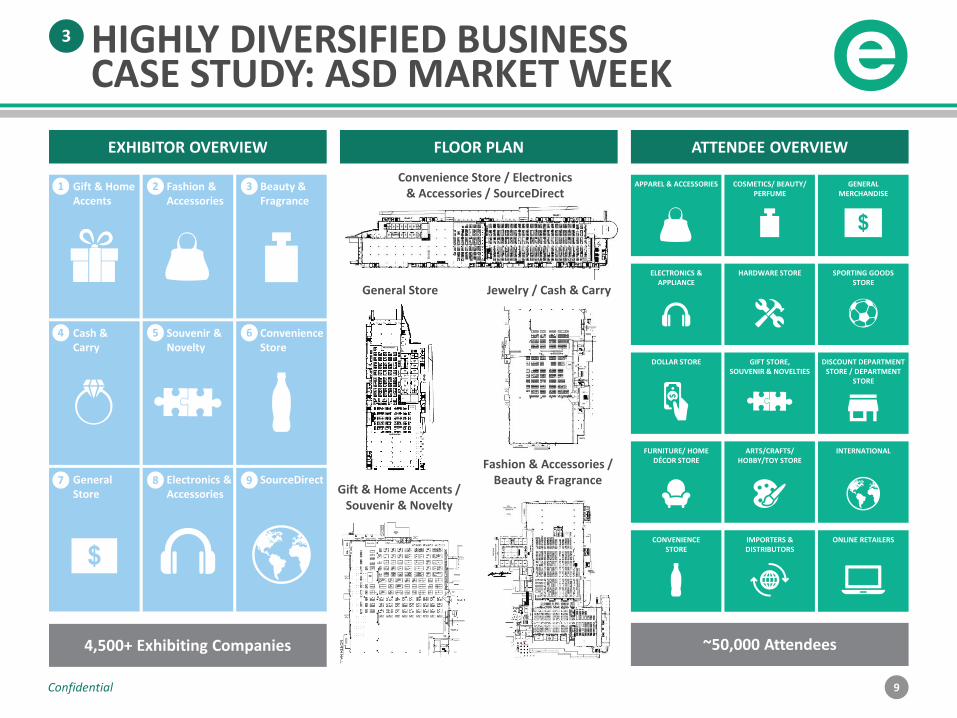
Incredibly diverse, horizontal shows representing several independent “shows within a show”
(e.g., nine separate shows within ASD Market Week – see next page)
9Confidential
HIGHLY DIVERSIFIED BUSINESS CASE STUDY: ASD MARKET WEEK
3
EXHIBITOR OVERVIEW
Gift & Home Accents
Cash & Carry
General Store
Fashion & Accessories
Souvenir & Novelty
Electronics & Accessories
Beauty & Fragrance
Convenience Store
SourceDirect
1 2 3
4 5 6
7 8 9
4,500+ Exhibiting Companies
APPAREL & ACCESSORIES COSMETICS/ BEAUTY/ PERFUME
GENERAL MERCHANDISE
ELECTRONICS & APPLIANCE
HARDWARE STORE SPORTING GOODS STORE
DOLLAR STORE GIFT STORE, SOUVENIR & NOVELTIES
DISCOUNT DEPARTMENT STORE / DEPARTMENT
STORE
FURNITURE/ HOME DÉCOR STORE
ARTS/CRAFTS/HOBBY/TOY STORE
CONVENIENCE STORE
INTERNATIONAL
IMPORTERS & DISTRIBUTORS
ONLINE RETAILERS
ATTENDEE OVERVIEW
~50,000 Attendees
FLOOR PLAN
Gift & Home Accents / Souvenir & Novelty
Fashion & Accessories / Beauty & Fragrance
Jewelry / Cash & CarryGeneral Store
Convenience Store / Electronics & Accessories / SourceDirect
10Confidential
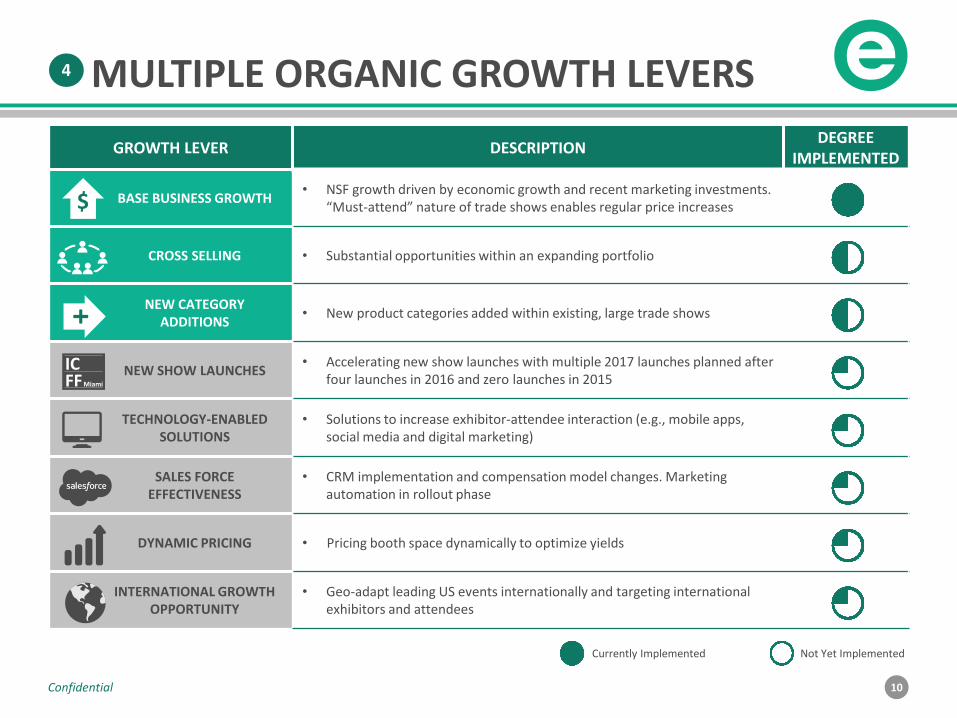
GROWTH LEVER DESCRIPTIONDEGREE
IMPLEMENTED
BASE BUSINESS GROWTH• NSF growth driven by economic growth and recent marketing investments.
“Must-attend” nature of trade shows enables regular price increases
CROSS SELLING • Substantial opportunities within an expanding portfolio
NEW CATEGORYADDITIONS
• New product categories added within existing, large trade shows
NEW SHOW LAUNCHES• Accelerating new show launches with multiple 2017 launches planned after
four launches in 2016 and zero launches in 2015
TECHNOLOGY-ENABLED SOLUTIONS
• Solutions to increase exhibitor-attendee interaction (e.g., mobile apps, social media and digital marketing)
SALES FORCEEFFECTIVENESS
• CRM implementation and compensation model changes. Marketing automation in rollout phase
DYNAMIC PRICING • Pricing booth space dynamically to optimize yields
INTERNATIONAL GROWTH OPPORTUNITY
• Geo-adapt leading US events internationally and targeting international exhibitors and attendees
+
$
MULTIPLE ORGANIC GROWTH LEVERS
Currently Implemented Not Yet Implemented
ICMiamiFF
4
11Confidential
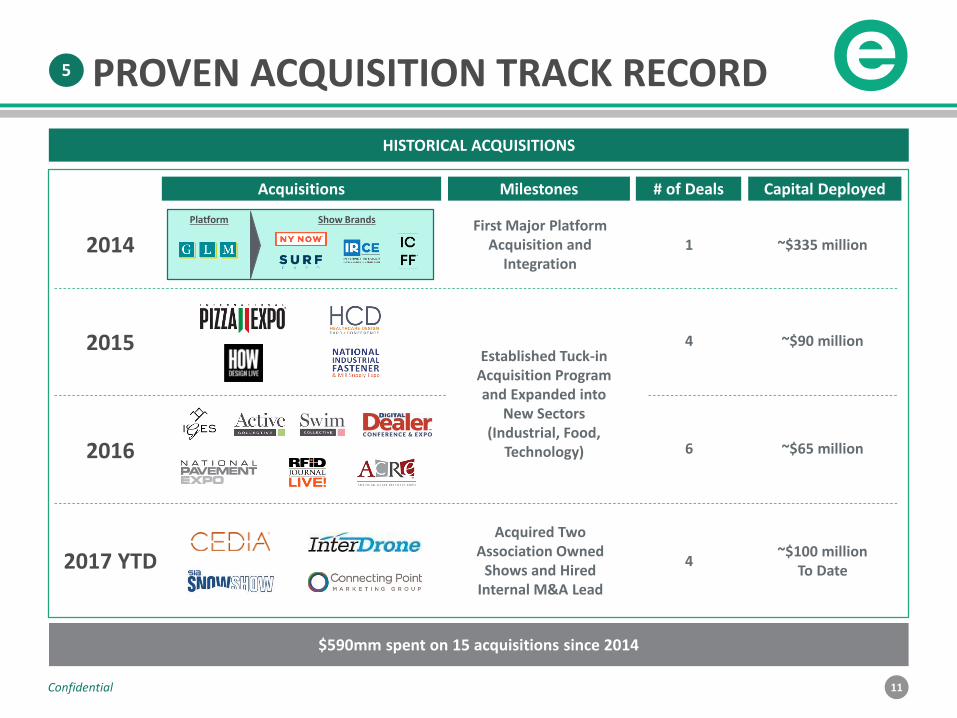
PROVEN ACQUISITION TRACK RECORD5
Milestones
First Major Platform Acquisition and
Integration
Acquired Two Association Owned
Shows and Hired Internal M&A Lead
Established Tuck-in Acquisition Program and Expanded into
New Sectors (Industrial, Food,
Technology)
Acquisitions
2015
2014
2016
2017 YTD
$590mm spent on 15 acquisitions since 2014
Platform Show Brands
HISTORICAL ACQUISITIONS
Capital Deployed
~$335 million
~$90 million
~$65 million
~$100 million To Date
# of Deals
1
4
6
4
12Confidential
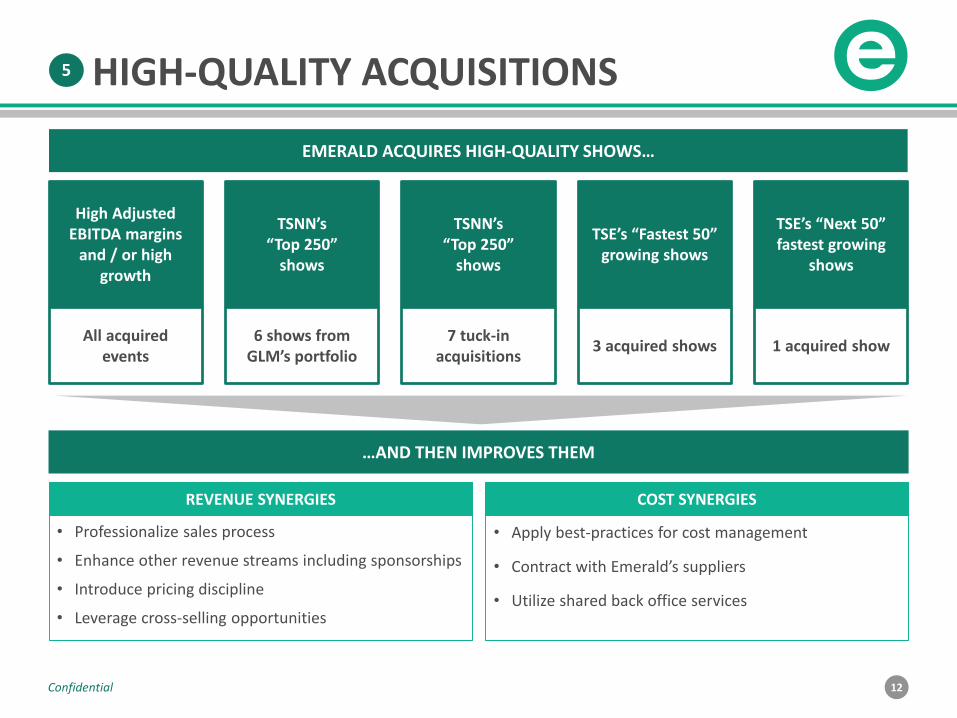
HIGH-QUALITY ACQUISITIONS
EMERALD ACQUIRES HIGH-QUALITY SHOWS…
…AND THEN IMPROVES THEM
• Professionalize sales process
• Enhance other revenue streams including sponsorships
• Introduce pricing discipline
• Leverage cross-selling opportunities
REVENUE SYNERGIES COST SYNERGIES
• Apply best-practices for cost management
• Contract with Emerald’s suppliers
• Utilize shared back office services
5
TSNN’s “Top 250”
shows
TSNN’s “Top 250”
shows
TSE’s “Fastest 50” growing shows
TSE’s “Next 50” fastest growing
shows
High Adjusted EBITDA margins
and / or high growth
6 shows from GLM’s portfolio
7 tuck-in acquisitions
3 acquired shows 1 acquired showAll acquired
events
13Confidential
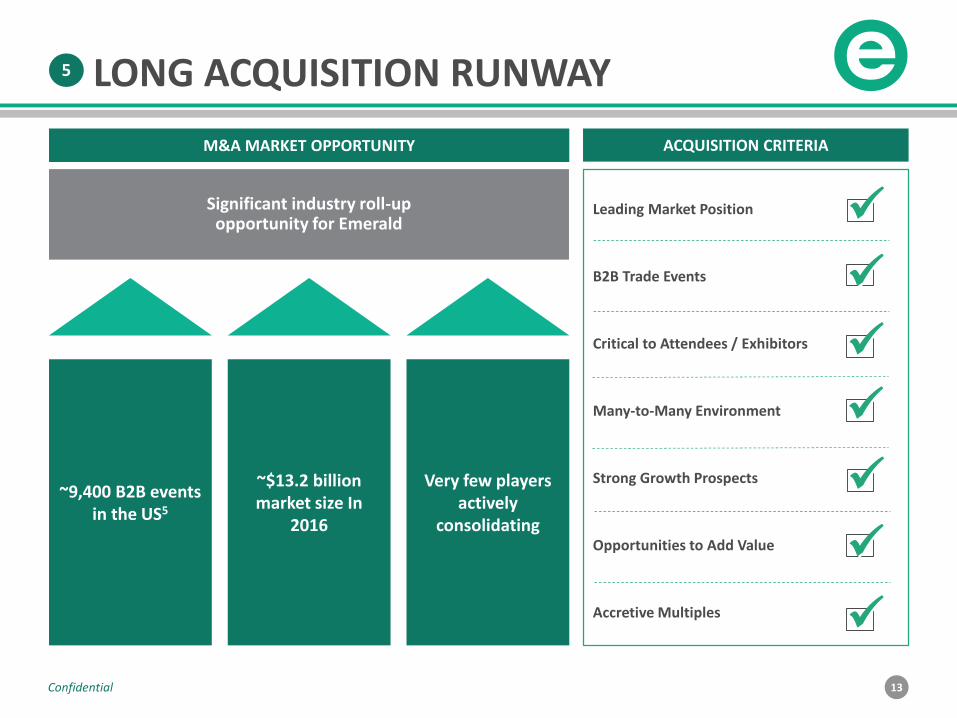
LONG ACQUISITION RUNWAY5
M&A MARKET OPPORTUNITY ACQUISITION CRITERIA
Leading Market Position
B2B Trade Events
Critical to Attendees / Exhibitors
Many-to-Many Environment
Strong Growth Prospects
Opportunities to Add Value
Accretive Multiples
~9,400 B2B events in the US5
~$13.2 billion market size In
2016
Very few players actively
consolidating
Significant industry roll-up opportunity for Emerald ✓
✓
✓
✓
✓
✓
✓
14Confidential
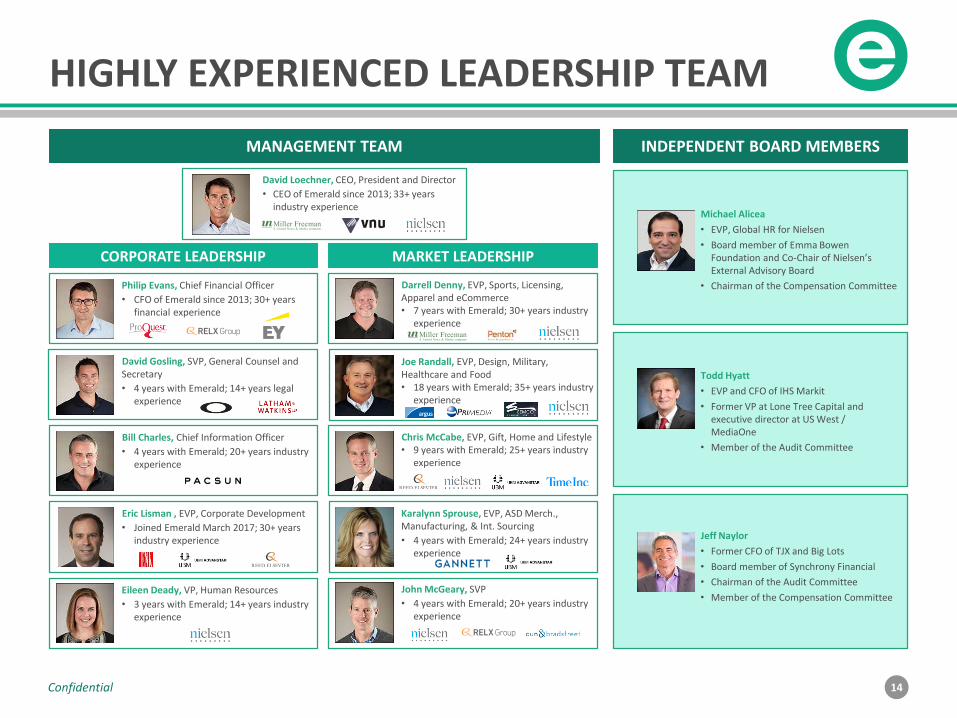
HIGHLY EXPERIENCED LEADERSHIP TEAM
MARKET LEADERSHIPCORPORATE LEADERSHIP
David Loechner, CEO, President and Director
• CEO of Emerald since 2013; 33+ years industry experience
INDEPENDENT BOARD MEMBERS
Michael Alicea
• EVP, Global HR for Nielsen
• Board member of Emma Bowen Foundation and Co-Chair of Nielsen’s External Advisory Board
• Chairman of the Compensation Committee
Todd Hyatt
• EVP and CFO of IHS Markit
• Former VP at Lone Tree Capital and executive director at US West / MediaOne
• Member of the Audit Committee
Jeff Naylor
• Former CFO of TJX and Big Lots
• Board member of Synchrony Financial
• Chairman of the Audit Committee
• Member of the Compensation Committee
MANAGEMENT TEAM
Philip Evans, Chief Financial Officer
• CFO of Emerald since 2013; 30+ years financial experience
David Gosling, SVP, General Counsel and Secretary
• 4 years with Emerald; 14+ years legal experience
Darrell Denny, EVP, Sports, Licensing, Apparel and eCommerce• 7 years with Emerald; 30+ years industry
experience
Chris McCabe, EVP, Gift, Home and Lifestyle• 9 years with Emerald; 25+ years industry
experience
John McGeary, SVP
• 4 years with Emerald; 20+ years industry experience
Bill Charles, Chief Information Officer
• 4 years with Emerald; 20+ years industry experience
Eric Lisman , EVP, Corporate Development
• Joined Emerald March 2017; 30+ years industry experience
Karalynn Sprouse, EVP, ASD Merch., Manufacturing, & Int. Sourcing
• 4 years with Emerald; 24+ years industry experience
Joe Randall, EVP, Design, Military, Healthcare and Food
• 10 years with Emerald
Joe Randall, EVP, Design, Military, Healthcare and Food• 18 years with Emerald; 35+ years industry
experience
Eileen Deady, VP, Human Resources
• 3 years with Emerald; 14+ years industry experience
15Confidential
Strong Revenue GrowthA
B
C
Highly Predictable Operating Model
Attractive Margin Profile
D Robust Free Cash Flow Conversion
FINANCIAL HIGHLIGHTS
16Confidential
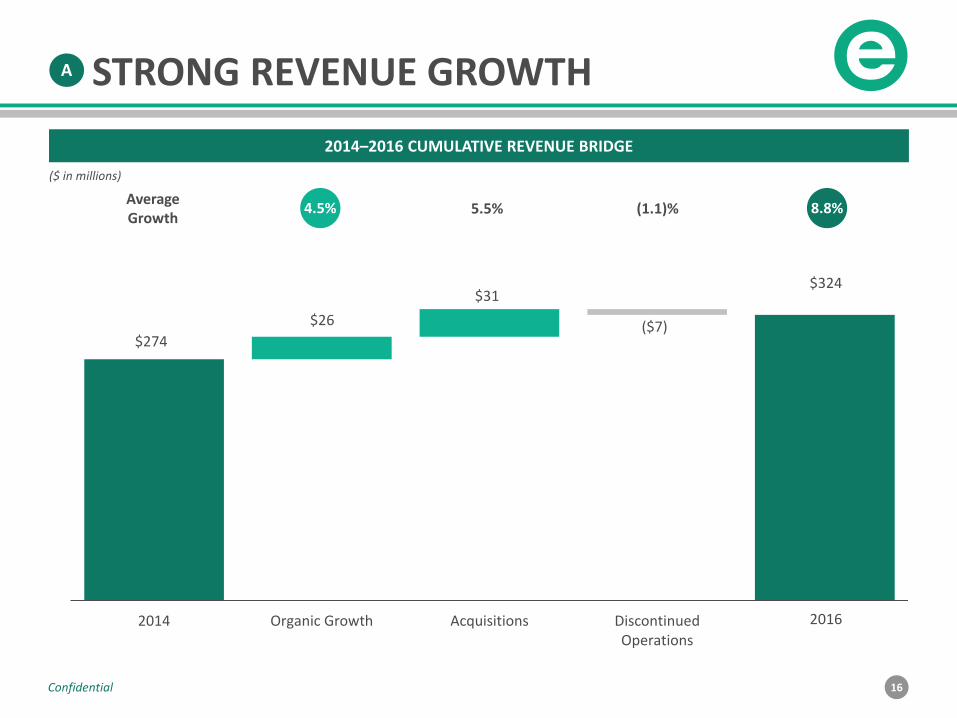
$274
$26
$31
($7)
0
100
200
300
400
2014 Organic Growth Acquisitions DiscontinuedOperations
Jul
($ in millions)
2014–2016 CUMULATIVE REVENUE BRIDGE
2016
AverageGrowth
5% 5.5% (1.1)% 9%8.8%
$324
STRONG REVENUE GROWTHA
4.5%
17Confidential
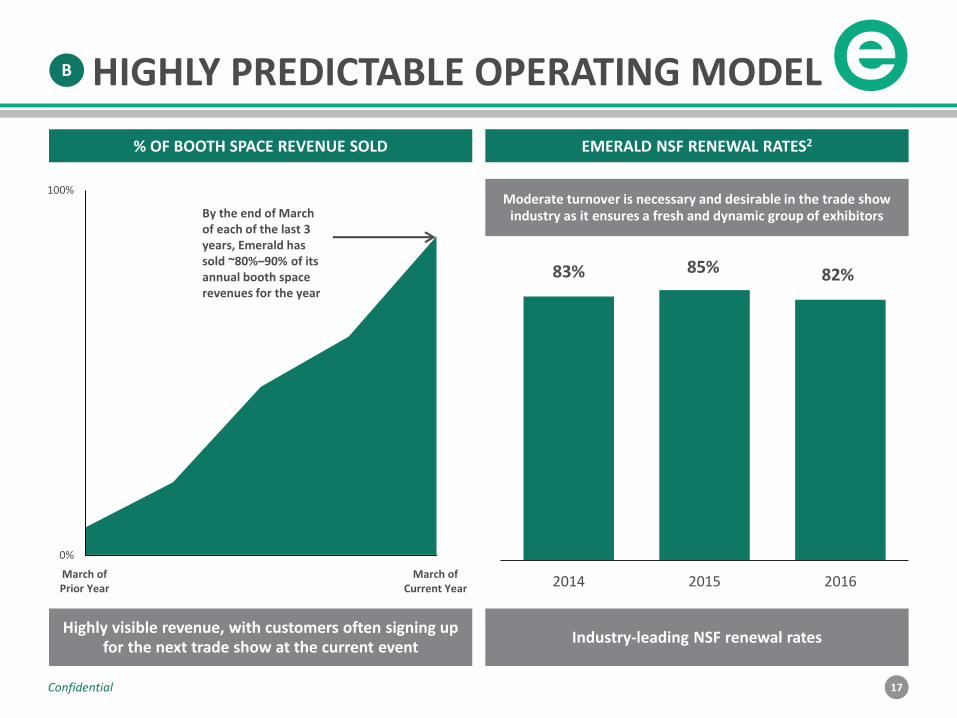
83% 85% 82%
2014 2015 2016
As of March, Emerald has sold ~80-90% of its annual booth revenues in each of the last 3 years
0%
100%
Mar-15 Mar-16March of Prior Year
March of Current Year
% OF BOOTH SPACE REVENUE SOLD EMERALD NSF RENEWAL RATES2
By the end of March of each of the last 3 years, Emerald has sold ~80%–90% of its annual booth space revenues for the year
Moderate turnover is necessary and desirable in the trade show industry as it ensures a fresh and dynamic group of exhibitors
Industry-leading NSF renewal ratesHighly visible revenue, with customers often signing up
for the next trade show at the current event
B HIGHLY PREDICTABLE OPERATING MODEL
18Confidential
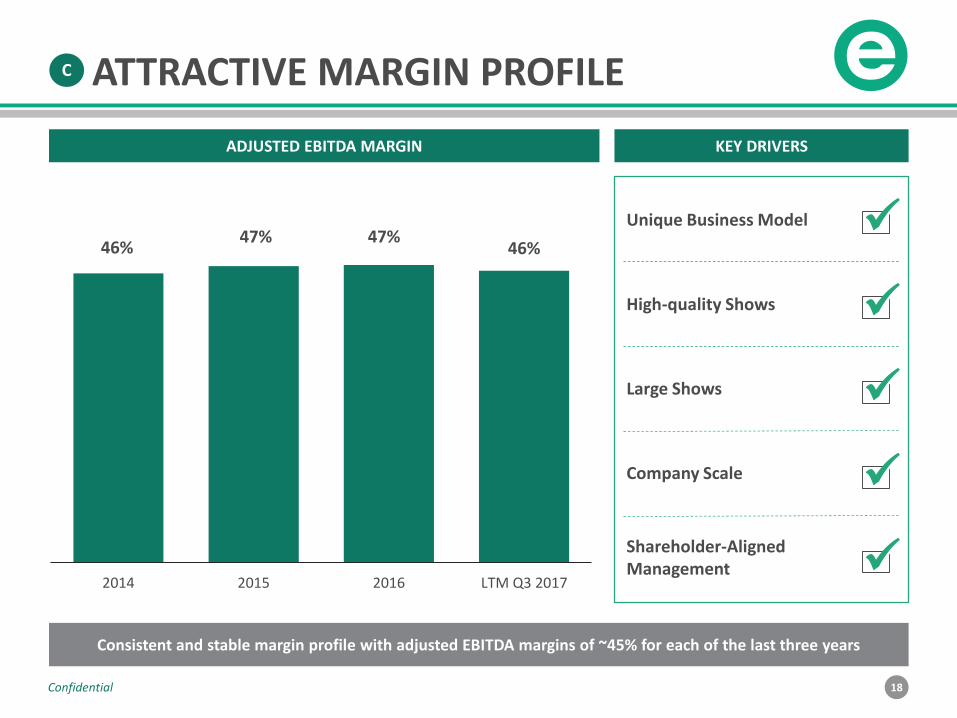
C ATTRACTIVE MARGIN PROFILE
ADJUSTED EBITDA MARGIN KEY DRIVERS
46%47% 47%
46%
2014 2015 2016 LTM Q3 2017
Unique Business Model
High-quality Shows
Large Shows
Company Scale
Shareholder-AlignedManagement
Consistent and stable margin profile with adjusted EBITDA margins of ~45% for each of the last three years
✓
✓
✓
✓
✓
19Confidential
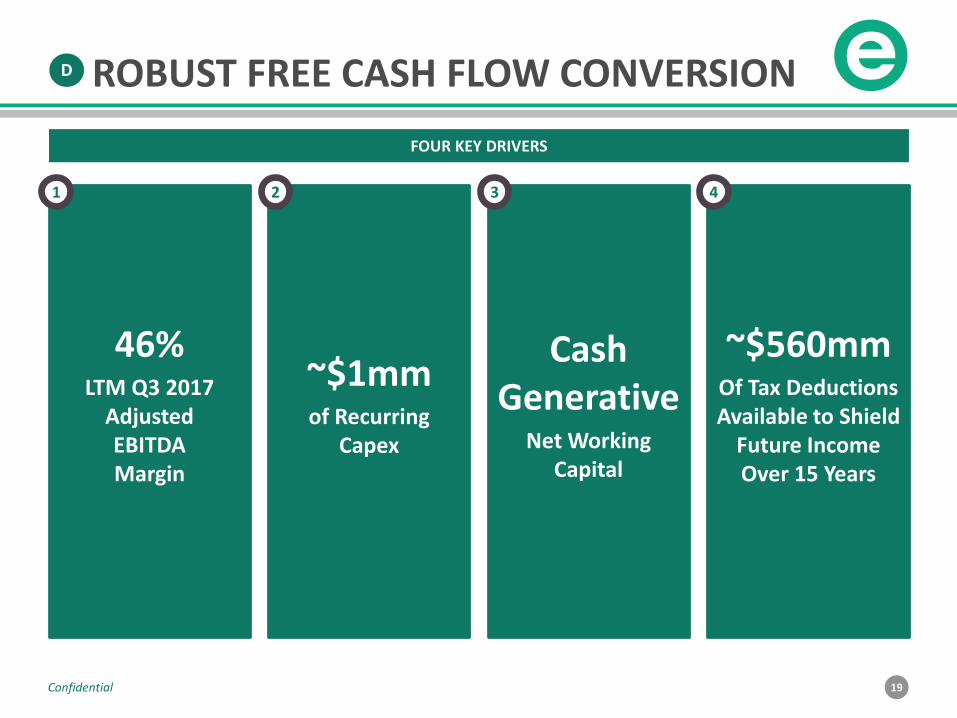
D ROBUST FREE CASH FLOW CONVERSION
FOUR KEY DRIVERS
46%LTM Q3 2017
Adjusted EBITDA Margin
~$1mmof Recurring
Capex
~$560mmOf Tax Deductions Available to Shield
Future Income Over 15 Years
Cash Generative
Net Working Capital
1 2 3 4
20Confidential
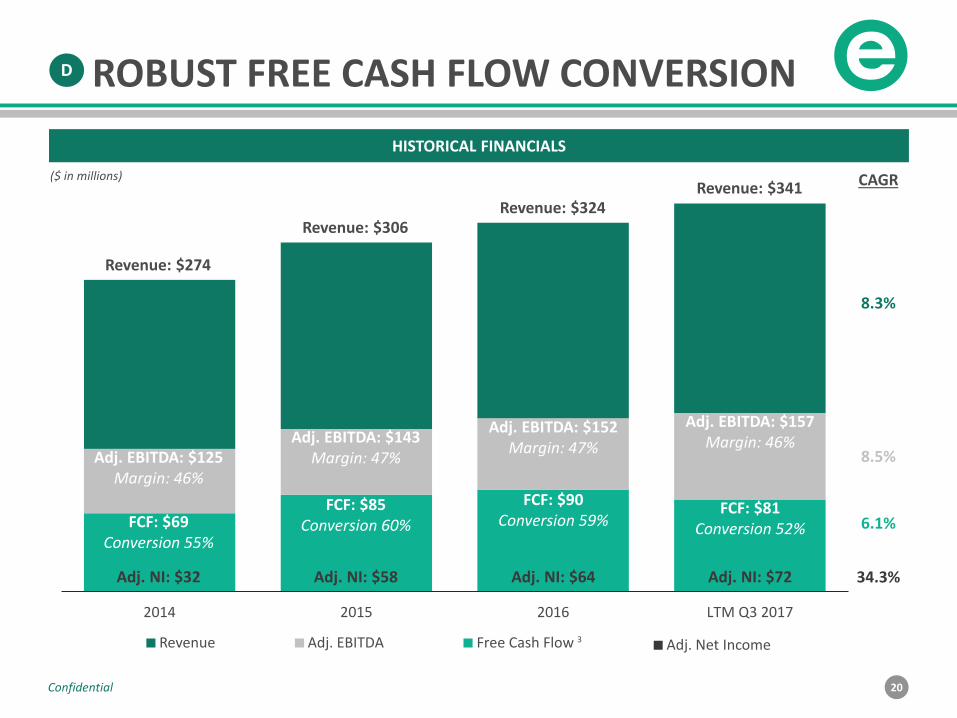
2014 2015 2016 LTM Q3 2017
Revenue: $274
Revenue: $306Revenue: $324
Adj. EBITDA: $125Margin: 46%
Adj. EBITDA: $143Margin: 47%
FCF: $85Conversion 60%
Adj. EBITDA: $152Margin: 47%
FCF: $90Conversion 59%
CAGR
8.3%
8.5%
6.1%
Free Cash FlowAdj. EBITDARevenue
D
($ in millions)
ROBUST FREE CASH FLOW CONVERSION
HISTORICAL FINANCIALS
3
Revenue: $341
Adj. EBITDA: $157Margin: 46%
FCF: $81Conversion 52%
Adj. Net Income
34.3%Adj. NI: $32 Adj. NI: $58 Adj. NI: $64 Adj. NI: $72
FCF: $69Conversion 55%
21Confidential
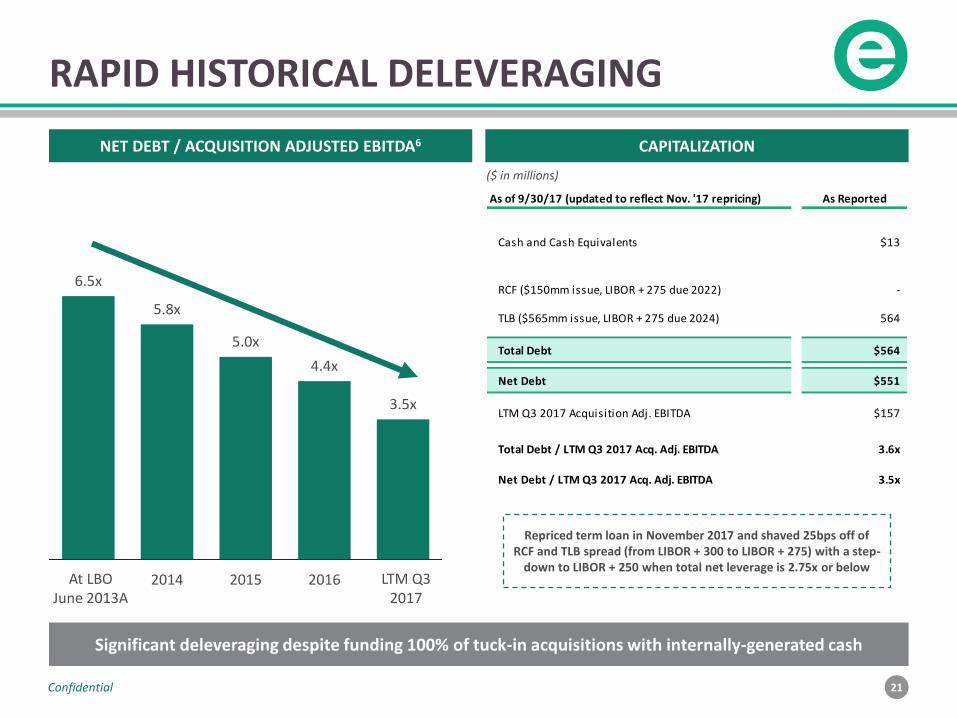
RAPID HISTORICAL DELEVERAGING
6.5x
5.8x
5.0x
4.4x
3.5x
2014 2015 2016
Significant deleveraging despite funding 100% of tuck-in acquisitions with internally-generated cash
At LBOJune 2013A
LTM Q32017
NET DEBT / ACQUISITION ADJUSTED EBITDA6 CAPITALIZATION
($ in millions)
As of 9/30/17 (updated to reflect Nov. '17 repricing) As Reported
Cash and Cash Equivalents $13
RCF ($150mm issue, LIBOR + 275 due 2022) -
TLB ($565mm issue, LIBOR + 275 due 2024) 564
Total Debt $564
Net Debt $551
LTM Q3 2017 Acquisition Adj. EBITDA $157
Total Debt / LTM Q3 2017 Acq. Adj. EBITDA 3.6x
Net Debt / LTM Q3 2017 Acq. Adj. EBITDA 3.5x
Repriced term loan in November 2017 and shaved 25bps off of RCF and TLB spread (from LIBOR + 300 to LIBOR + 275) with a step-
down to LIBOR + 250 when total net leverage is 2.75x or below
22Confidential
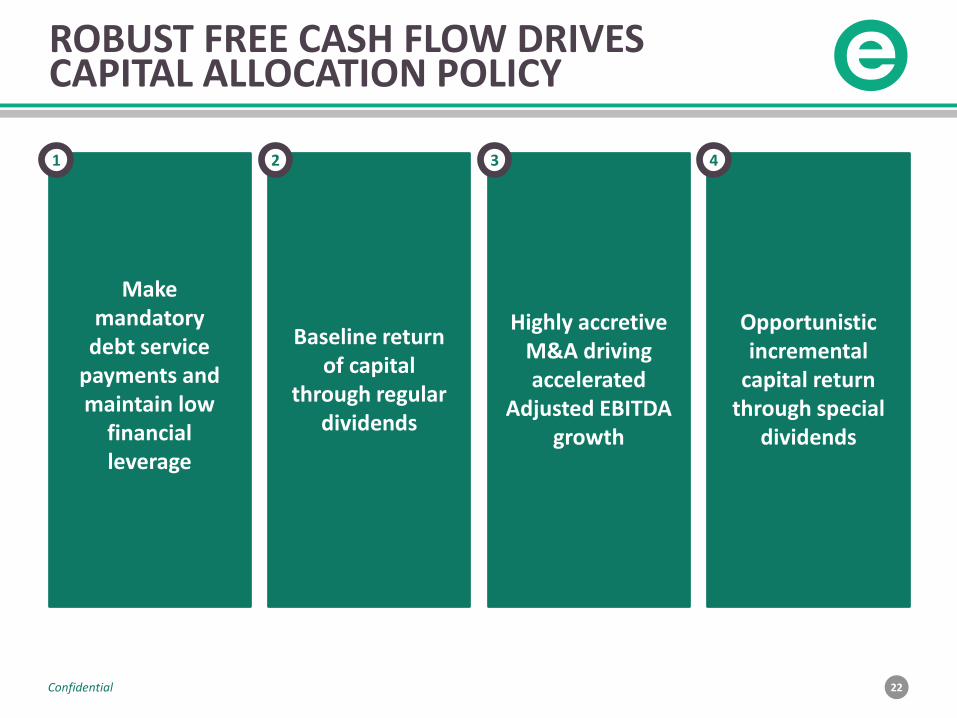
ROBUST FREE CASH FLOW DRIVES CAPITAL ALLOCATION POLICY
Make mandatory
debt service payments and maintain low
financial leverage
Baseline return of capital
through regular dividends
Opportunistic incremental
capital return through special
dividends
Highly accretive M&A driving accelerated
Adjusted EBITDA growth
1 2 3 4
23Confidential
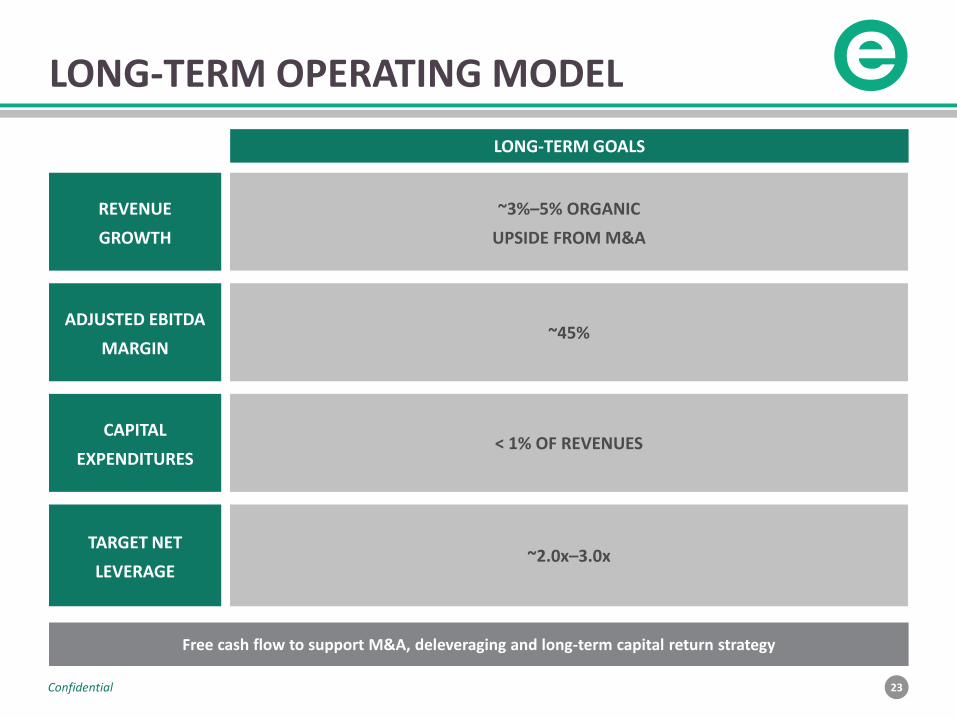
LONG-TERM OPERATING MODEL
Free cash flow to support M&A, deleveraging and long-term capital return strategy
LONG-TERM GOALS
REVENUE
GROWTH
ADJUSTED EBITDA
MARGIN
CAPITAL
EXPENDITURES
TARGET NET
LEVERAGE
~3%–5% ORGANIC
UPSIDE FROM M&A
~45%
< 1% OF REVENUES
~2.0x–3.0x
24Confidential
Significant and Growing Market Opportunity1
2 Extensive Portfolio of Large, Market-Leading Shows
3
4
Highly Diversified Business
Multiple Organic Growth Levers
5 Long Acquisition Runway
INVESTMENT HIGHLIGHTS
HIGHLY EXPERIENCED LEADERSHIP TEAM
6 Exceptional Financial Characteristics

QUARTERLY UPDATE
26Confidential
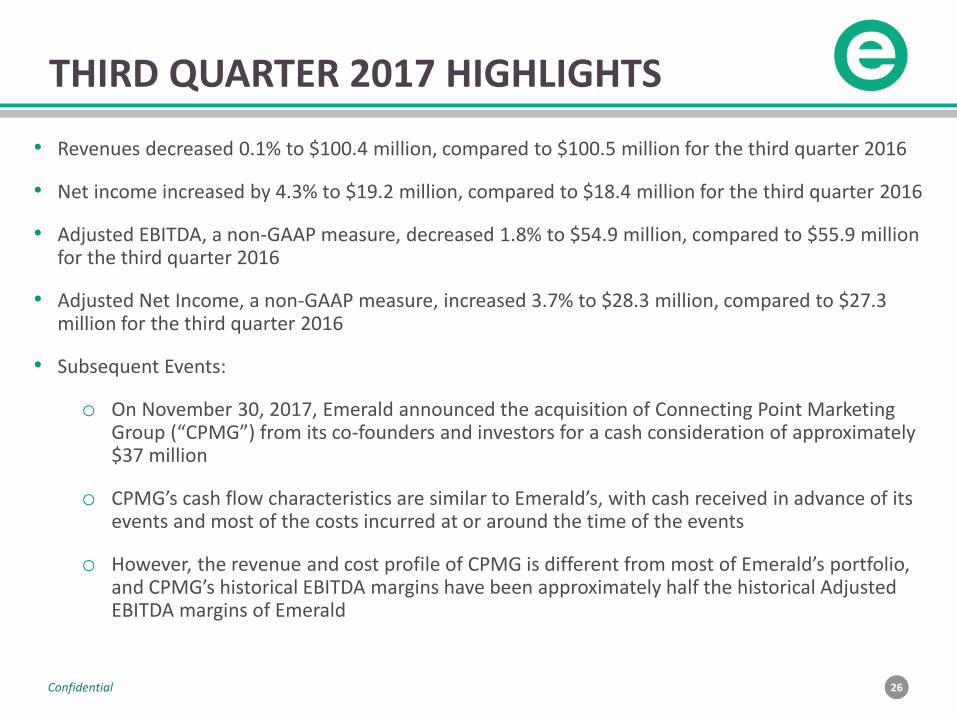
THIRD QUARTER 2017 HIGHLIGHTS
• Revenues decreased 0.1% to $100.4 million, compared to $100.5 million for the third quarter 2016
• Net income increased by 4.3% to $19.2 million, compared to $18.4 million for the third quarter 2016
• Adjusted EBITDA, a non-GAAP measure, decreased 1.8% to $54.9 million, compared to $55.9 million for the third quarter 2016
• Adjusted Net Income, a non-GAAP measure, increased 3.7% to $28.3 million, compared to $27.3 million for the third quarter 2016
• Subsequent Events:
o On November 30, 2017, Emerald announced the acquisition of Connecting Point Marketing Group (“CPMG”) from its co-founders and investors for a cash consideration of approximately $37 million
o CPMG’s cash flow characteristics are similar to Emerald’s, with cash received in advance of its events and most of the costs incurred at or around the time of the events
o However, the revenue and cost profile of CPMG is different from most of Emerald’s portfolio, and CPMG’s historical EBITDA margins have been approximately half the historical Adjusted EBITDA margins of Emerald
27Confidential
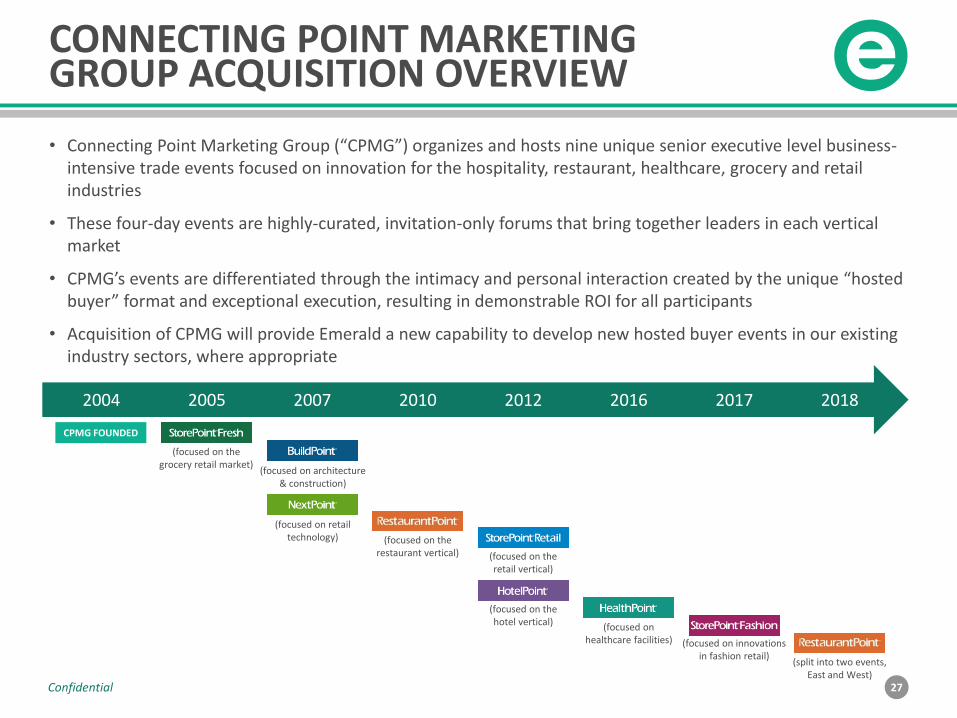
CONNECTING POINT MARKETING GROUP ACQUISITION OVERVIEW
2004
CPMG FOUNDED
2005 2016201220102007 2017
(focused on the grocery retail market)
(focused on architecture & construction)
(focused on retail technology) (focused on the
restaurant vertical) (focused on the retail vertical)
(focused on the hotel vertical) (focused on
healthcare facilities) (focused on innovations in fashion retail)
(split into two events, East and West)
2018
• Connecting Point Marketing Group (“CPMG”) organizes and hosts nine unique senior executive level business-intensive trade events focused on innovation for the hospitality, restaurant, healthcare, grocery and retail industries
• These four-day events are highly-curated, invitation-only forums that bring together leaders in each vertical market
• CPMG’s events are differentiated through the intimacy and personal interaction created by the unique “hosted buyer” format and exceptional execution, resulting in demonstrable ROI for all participants
• Acquisition of CPMG will provide Emerald a new capability to develop new hosted buyer events in our existing industry sectors, where appropriate

28Confidential
FULL YEAR GUIDANCE
EXPECT FULL YEAR 2017
TOTAL
REVENUE
TOTAL
REVENUE
GROWTH
ADJUSTED
EBITDA
ADJUSTED
EBITDA
GROWTH
IN THE RANGE OF $348 MILLION TO $355 MILLION
IN THE RANGE OF 7.5% TO 9.5% (OF WHICH 0% TO 2% IS EXPECTED TO BE ORGANIC)
IN THE RANGE OF $154 MILLION TO $160 MILLION
IN THE RANGE OF 1.2% TO 5.2%
For the full year 2017, management expects reported and organic revenues to trend towards the lower end of the guidance range, and Adjusted EBITDA to trend just below the midpoint of the guidance range

APPENDIX
30Confidential
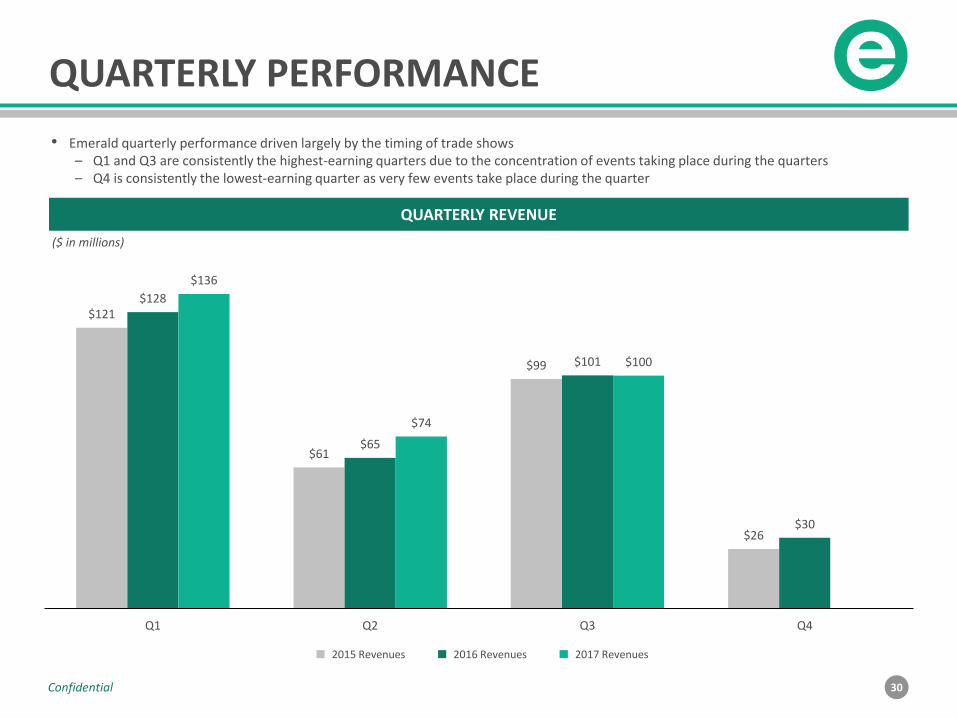
QUARTERLY PERFORMANCE
$121
$61
$99
$26
$128
$65
$101
$30
$136
$74
$100
Q1 Q2 Q3 Q4
2015 Revenues 2016 Revenues
($ in millions)
• Emerald quarterly performance driven largely by the timing of trade shows– Q1 and Q3 are consistently the highest-earning quarters due to the concentration of events taking place during the quarters– Q4 is consistently the lowest-earning quarter as very few events take place during the quarter
QUARTERLY REVENUE
2017 Revenues
31Confidential
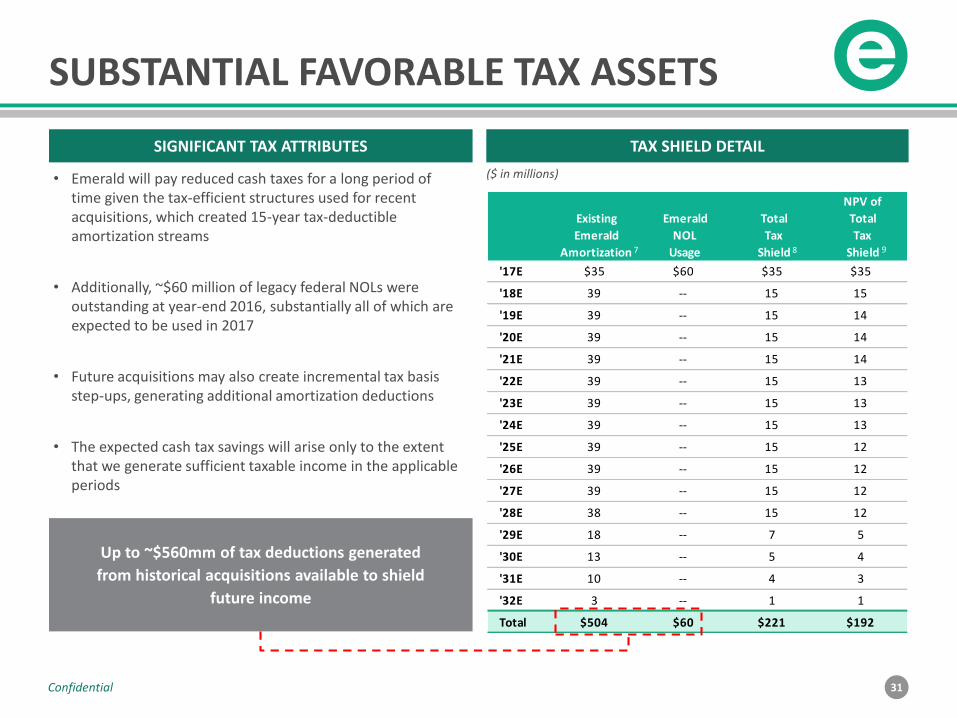
SUBSTANTIAL FAVORABLE TAX ASSETS
($ in millions)• Emerald will pay reduced cash taxes for a long period of time given the tax-efficient structures used for recent acquisitions, which created 15-year tax-deductible amortization streams
• Additionally, ~$60 million of legacy federal NOLs were outstanding at year-end 2016, substantially all of which are expected to be used in 2017
• Future acquisitions may also create incremental tax basis step-ups, generating additional amortization deductions
• The expected cash tax savings will arise only to the extent that we generate sufficient taxable income in the applicable periods
Up to ~$560mm of tax deductions generated
from historical acquisitions available to shield
future income
SIGNIFICANT TAX ATTRIBUTES TAX SHIELD DETAIL
NPV of
Existing Emerald Total Total
Emerald NOL Tax Tax
Amortization Usage Shield Shield
'17E $35 $60 $35 $35
'18E 39 -- 15 15
'19E 39 -- 15 14
'20E 39 -- 15 14
'21E 39 -- 15 14
'22E 39 -- 15 13
'23E 39 -- 15 13
'24E 39 -- 15 13
'25E 39 -- 15 12
'26E 39 -- 15 12
'27E 39 -- 15 12
'28E 38 -- 15 12
'29E 18 -- 7 5
'30E 13 -- 5 4
'31E 10 -- 4 3
'32E 3 -- 1 1
Total $504 $60 $221 $192
7 8 9
32Confidential
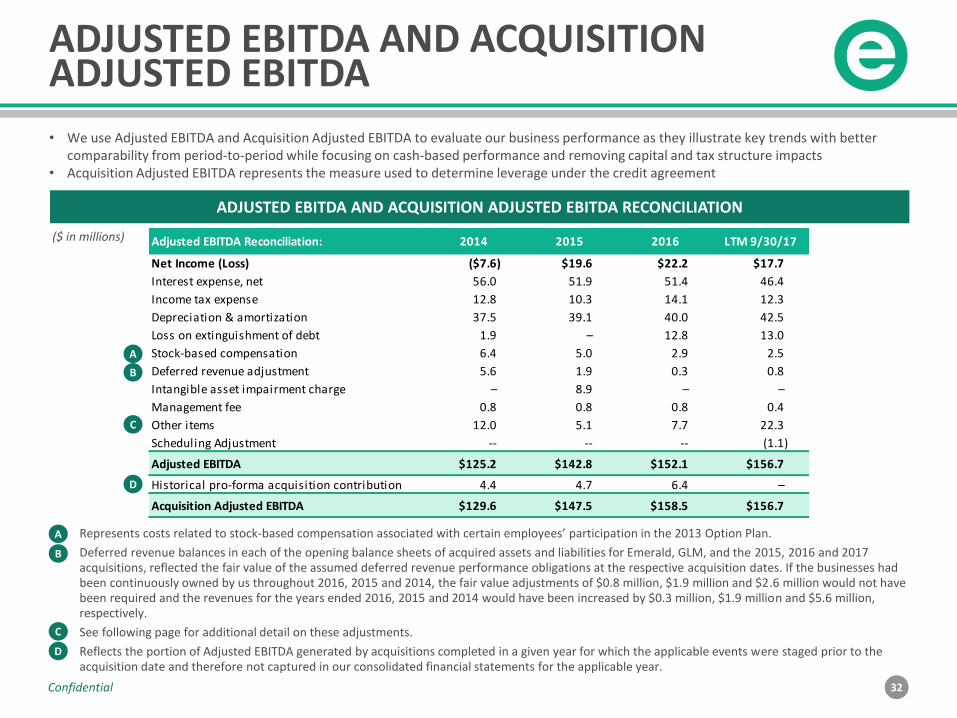
ADJUSTED EBITDA AND ACQUISITION ADJUSTED EBITDA
($ in millions)
• We use Adjusted EBITDA and Acquisition Adjusted EBITDA to evaluate our business performance as they illustrate key trends with better comparability from period-to-period while focusing on cash-based performance and removing capital and tax structure impacts
• Acquisition Adjusted EBITDA represents the measure used to determine leverage under the credit agreement
Represents costs related to stock-based compensation associated with certain employees’ participation in the 2013 Option Plan.
Deferred revenue balances in each of the opening balance sheets of acquired assets and liabilities for Emerald, GLM, and the 2015, 2016 and 2017 acquisitions, reflected the fair value of the assumed deferred revenue performance obligations at the respective acquisition dates. If the businesses had been continuously owned by us throughout 2016, 2015 and 2014, the fair value adjustments of $0.8 million, $1.9 million and $2.6 million would not have been required and the revenues for the years ended 2016, 2015 and 2014 would have been increased by $0.3 million, $1.9 million and $5.6 million, respectively.
See following page for additional detail on these adjustments.
Reflects the portion of Adjusted EBITDA generated by acquisitions completed in a given year for which the applicable events were staged prior to the acquisition date and therefore not captured in our consolidated financial statements for the applicable year.
A
B
C
D
A
B
C
D
ADJUSTED EBITDA AND ACQUISITION ADJUSTED EBITDA RECONCILIATION
Adjusted EBITDA Reconciliation: 2014 2015 2016 LTM 9/30/17
Net Income (Loss) ($7.6) $19.6 $22.2 $17.7
Interest expense, net 56.0 51.9 51.4 46.4
Income tax expense 12.8 10.3 14.1 12.3
Depreciation & amortization 37.5 39.1 40.0 42.5
Loss on extinguishment of debt 1.9 – 12.8 13.0
Stock-based compensation 6.4 5.0 2.9 2.5
Deferred revenue adjustment 5.6 1.9 0.3 0.8
Intangible asset impairment charge – 8.9 – –
Management fee 0.8 0.8 0.8 0.4
Other items 12.0 5.1 7.7 22.3
Scheduling Adjustment -- -- -- (1.1)
Adjusted EBITDA $125.2 $142.8 $152.1 $156.7
Historical pro-forma acquisition contribution 4.4 4.7 6.4 –
Acquisition Adjusted EBITDA $129.6 $147.5 $158.5 $156.7
33Confidential
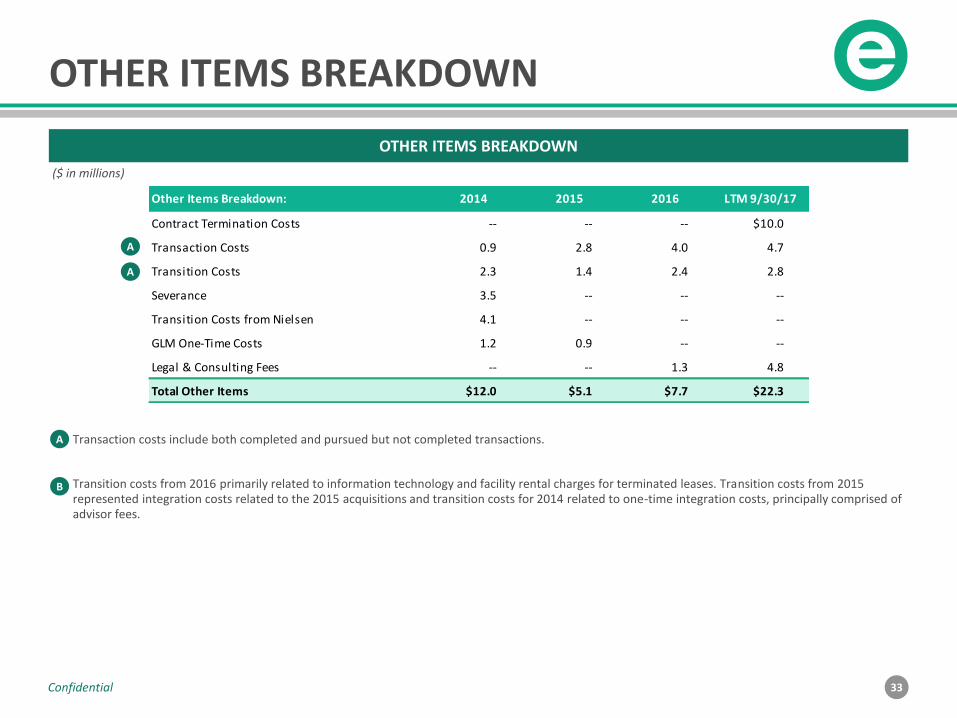
OTHER ITEMS BREAKDOWN
($ in millions)
Transaction costs include both completed and pursued but not completed transactions.
Transition costs from 2016 primarily related to information technology and facility rental charges for terminated leases. Transition costs from 2015 represented integration costs related to the 2015 acquisitions and transition costs for 2014 related to one-time integration costs, principally comprised of advisor fees.
A
B
OTHER ITEMS BREAKDOWN
A
A
Other Items Breakdown: 2014 2015 2016 LTM 9/30/17
Contract Termination Costs -- -- -- $10.0
Transaction Costs 0.9 2.8 4.0 4.7
Transition Costs 2.3 1.4 2.4 2.8
Severance 3.5 -- -- --
Transition Costs from Nielsen 4.1 -- -- --
GLM One-Time Costs 1.2 0.9 -- --
Legal & Consulting Fees -- -- 1.3 4.8
Total Other Items $12.0 $5.1 $7.7 $22.3
34Confidential
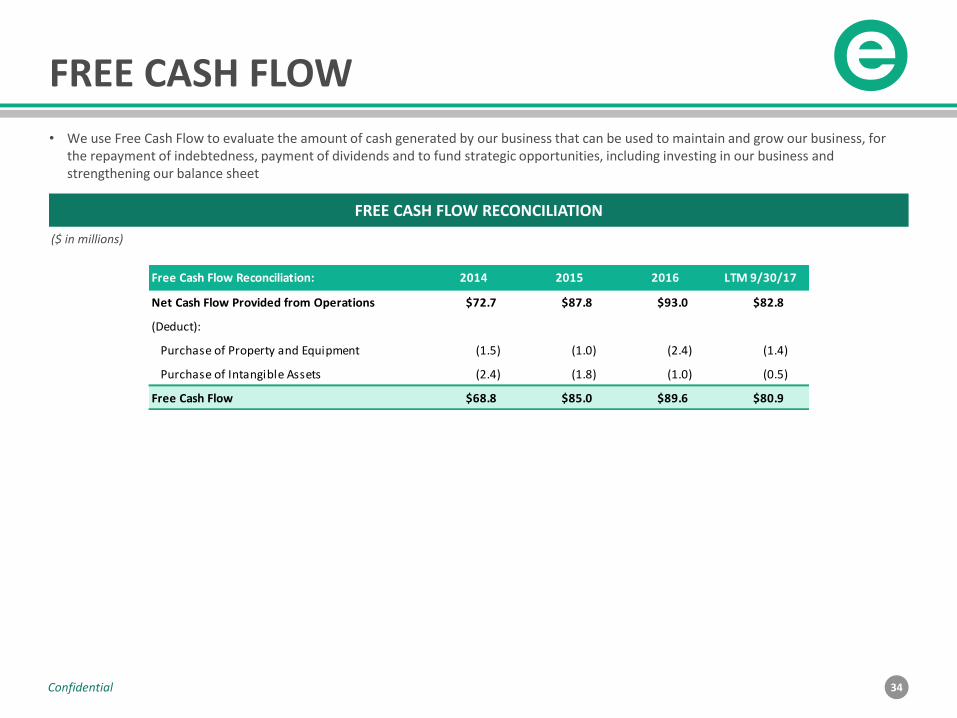
FREE CASH FLOW
• We use Free Cash Flow to evaluate the amount of cash generated by our business that can be used to maintain and grow our business, for the repayment of indebtedness, payment of dividends and to fund strategic opportunities, including investing in our business andstrengthening our balance sheet
($ in millions)
FREE CASH FLOW RECONCILIATION
Free Cash Flow Reconciliation: 2014 2015 2016 LTM 9/30/17
Net Cash Flow Provided from Operations $72.7 $87.8 $93.0 $82.8
(Deduct):
Purchase of Property and Equipment (1.5) (1.0) (2.4) (1.4)
Purchase of Intangible Assets (2.4) (1.8) (1.0) (0.5)
Free Cash Flow $68.8 $85.0 $89.6 $80.9
35Confidential
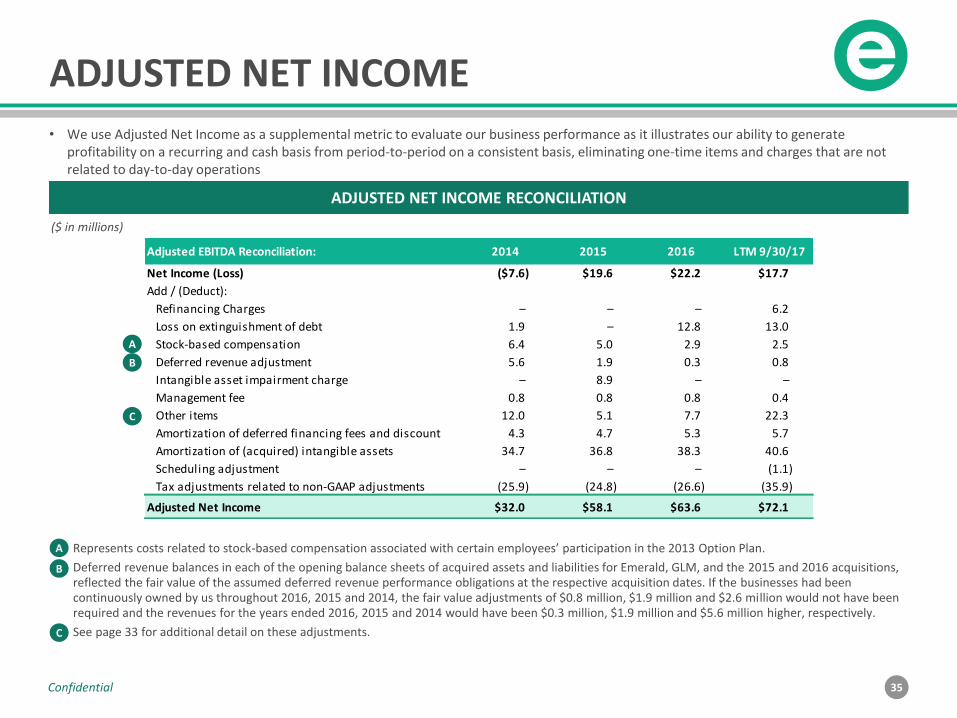
ADJUSTED NET INCOME• We use Adjusted Net Income as a supplemental metric to evaluate our business performance as it illustrates our ability to generate
profitability on a recurring and cash basis from period-to-period on a consistent basis, eliminating one-time items and charges that are not related to day-to-day operations
($ in millions)
Represents costs related to stock-based compensation associated with certain employees’ participation in the 2013 Option Plan.
Deferred revenue balances in each of the opening balance sheets of acquired assets and liabilities for Emerald, GLM, and the 2015 and 2016 acquisitions, reflected the fair value of the assumed deferred revenue performance obligations at the respective acquisition dates. If the businesses had been continuously owned by us throughout 2016, 2015 and 2014, the fair value adjustments of $0.8 million, $1.9 million and $2.6 million would not have been required and the revenues for the years ended 2016, 2015 and 2014 would have been $0.3 million, $1.9 million and $5.6 million higher, respectively.
See page 33 for additional detail on these adjustments.
A
A
B
C
B
C
ADJUSTED NET INCOME RECONCILIATION
Adjusted EBITDA Reconciliation: 2014 2015 2016 LTM 9/30/17
Net Income (Loss) ($7.6) $19.6 $22.2 $17.7
Add / (Deduct):
Refinancing Charges – – – 6.2
Loss on extinguishment of debt 1.9 – 12.8 13.0
Stock-based compensation 6.4 5.0 2.9 2.5
Deferred revenue adjustment 5.6 1.9 0.3 0.8
Intangible asset impairment charge – 8.9 – –
Management fee 0.8 0.8 0.8 0.4
Other items 12.0 5.1 7.7 22.3
Amortization of deferred financing fees and discount 4.3 4.7 5.3 5.7
Amortization of (acquired) intangible assets 34.7 36.8 38.3 40.6
Scheduling adjustment – – – (1.1)
Tax adjustments related to non-GAAP adjustments (25.9) (24.8) (26.6) (35.9)
Adjusted Net Income $32.0 $58.1 $63.6 $72.1
36Confidential
ENDNOTES
(1) TSNN 2016.
(2) Renewal rate refers to the net square footage (NSF) purchased by returning exhibitors as a percentage of the prior event’s total NSF. Returning exhibitors include ‘‘win-backs’’ or customers who did not exhibit in the immediately preceding event but who previously exhibited in the event within the past five years.
(3) Free cash flow is defined as net cash provided by operating activities less capital expenditures.
(4) Excludes discontinued revenue which represented less than 1% of total LTM September 2017 revenue.
(5) 2017 CEIR Index Report.
(6) Reflects EBITDA generated by completed acquisitions in a given year that is not captured in the GAAP financials.
(7) Represents Emerald’s amortization of existing goodwill and intangibles and amortization of purchase price from 2014, 2015, 2016 and YTD 2017 acquisitions.
(8) Amortization shields income at the combined federal and state tax rate of 39.7%.
(9) NPV of tax shield discounted at a rate of 2.5%, equal to Emerald’s current after-tax current cost of debt.