Embed Size (px)
Citation preview

INVESTOR PRESENTATIONMarch 2017

Forward Looking Statements and Cautionary Statements
2
Forward-Looking StatementsThe information in this presentation includes “forward-looking statements” that are made pursuant to the Safe Harbor Provisions of the Private Securities Litigation Reform Act of 1995. Allstatements, other than statements of historical fact included in this presentation, regarding our strategy, future operations, financial position, estimated revenues and losses, projected costs,prospects, plans and objectives of management are forward-looking statements. When used in this presentation, the words “could,” “believe,” “anticipate,” “intend,” “estimate,” “expect,”“project” and similar expressions are intended to identify forward-looking statements, although not all forward-looking statements contain such identifying words. These forward-looking statementsare based on Parsley Energy, Inc.’s (“Parsley Energy,” “Parsley,” or the “Company”) current expectations and assumptions about future events and are based on currently available information as tothe outcome and timing of future events. We caution you that these forward-looking statements are subject to all of the risks and uncertainties, most of which are difficult to predict and many ofwhich are beyond our control, incident to the exploration for and development, production, gathering and sale of oil and natural gas. These risks include, but are not limited to, commodity pricevolatility, inflation, lack of availability of drilling and production equipment and services, environmental risks, drilling and other operating risks, regulatory changes, the uncertainty inherent inestimating reserves and in projecting future rates of production, the production potential of our undeveloped acreage, cash flow and access to capital, the timing of development expenditures andthe risk factors discussed in or referenced in our filings with the United States Securities and Exchange Commission (“SEC”), including our Annual Report on Form 10-K and our subsequent QuarterlyReports on Form 10-Q and Current Reports on Form 8-K.
You are cautioned not to place undue reliance on any forward-looking statements, which speak only as of the date of this presentation. Except as otherwise required by applicable law, we disclaimany duty to update any forward-looking statements, all of which are expressly qualified by the statements in this section, to reflect events or circumstances after the date of this presentation.
Our production forecasts and expectations for future periods are dependent upon many assumptions, including estimates of production decline rates from existing wells and the undertaking andoutcome of future drilling activity, which may be affected by significant commodity price declines or cost increases.
Industry and Market DataThis presentation has been prepared by Parsley and includes market data and other statistical information from third-party sources, including independent industry publications, governmentpublications or other published independent sources. Although Parsley believes these third-party sources are reliable as of their respective dates, Parsley has not independently verified the accuracyor completeness of this information. Some data are also based on Parsley’s good faith estimates, which are derived from its review of internal sources as well as the third-party sources describedabove.
Oil & Gas ReservesThis presentation provides disclosure of Parsley’s proved reserves, which are those quantities of oil and gas, which, by analysis of geoscience and engineering data, can be estimated with reasonablecertainty to be economically producible—from a given date forward, from known reservoirs, and under existing economic conditions (using unweighted average 12-month first day of the monthprices), operating methods, and government regulations—prior to the time at which contracts providing the right to operate expire, unless evidence indicates that renewal is reasonably certain,regardless of whether deterministic or probabilistic methods are used for the estimation.
In this presentation, proved reserves attributable to Parsley as of 12/31/16 are estimated utilizing SEC reserve recognition standards and pricing assumptions based on SEC pricing, as adjusted formarket differentials, transportation fees, and quality, of $39.36 / Bbl crude, $2.23 / Mcf gas, and $15.03/ Bbl NGL. References to our estimated proved reserves as of 12/31/16 are derived from ourproved reserve report audited by Netherland, Sewell & Associates, Inc. (“NSAI”).
We may use the term “expected ultimate recoveries” (“EURs”) or other descriptions of volumes of reserves, which terms include quantities of oil and gas that may not meet the SEC’s definitions ofproved, probable and possible reserves, and which the SEC's guidelines strictly prohibit Parsley from including in filings with the SEC. Unless otherwise stated in this presentation, such estimates havebeen prepared internally by our engineers and management without review by independent engineers. These estimates are by their nature more speculative than estimates of proved, probable andpossible reserves and accordingly are subject to substantially greater risk of being actually realized, particularly in areas or zones where there has been limited or no drilling history. We include theseestimates to demonstrate what we believe to be the potential for future drilling and production by the Company. Actual locations drilled and quantities that may be ultimately recovered from ourproperties will differ substantially. In addition, we have made no commitment to drill all of the drilling locations. Ultimate recoveries will be dependent upon numerous factors including actualencountered geological conditions, the impact of future oil and gas pricing, exploration and development costs, and our future drilling decisions and budgets based upon our future evaluation of risk,returns and the availability of capital and, in many areas, the outcome of negotiation of drilling arrangements with holders of adjacent or fractional interest leases. Our estimates may changesignificantly as development of our properties provides additional data and therefore actual quantities that may ultimately be recovered will likely differ from these estimates. Our relatedexpectations for future periods are dependent upon many assumptions, including estimates of production decline rates from existing wells, the undertaking and outcome of future drilling activity andactivity that may be affected by significant commodity price declines or drilling cost increases.
Unless otherwise noted, Net Present Value (“NPV”) estimates are before taxes and assume the Company generated EUR and decline curve estimates based on Company drilling and completion costestimates that do not include facilities, land, seismic, general and administrative (“G&A”) or other corporate level costs.

Sustained Production Momentum
3
4Q16 net production up 5% versus 3Q16 and 79% Y/Y
16% compound quarterly production growth rate over eleven quarters as a public company(2)
Sharp production trajectory in 2017, culminating in estimated 4Q17 production of 75.0 – 85.0 MBoe/d
Track record of efficient growth, with leading production contribution per dollar
(1) While certain of Parsley’s previous disclosures have referenced “horizontal rigs” as only those rigs tasked to drill both the vertical and lateral portions of a horizontal well, “horizontal rigs” in the chart above represent all rigs utilized for horizontal drilling activity, some of which may be dedicated to and purposed for certain segments of the wellbore. “Spudder” rigs are excluded from the counts above. (2) Parsley completed its initial public offering on May 29, 2014; (3) Peers include CPE, CXO, EGN, FANG, LPI, PXD, and RSPP. Calculations for peers based on reported data for prior periods and Nasdaq IR Insights consensus estimates as of 2/16/2017 for 4Q16. Parsley data based on actuals for all periods. Production from reported acquisitions excluded from calculations based on estimated monthly decline of 3%
Production Momentum
Capital Efficient Production Growth(3)
0
10
20
30
40
50
0%
20%
40%
60%
80%
Peer 1 Peer 2 Peer 3 Peer 4 Peer 5 Peer 6 Peer 7 PE
4Q15-4Q16
Boe/d Added per $M
M of Capex4Q
15-4
Q16
Org
anic
Pro
duct
ion
Gro
wth
N/M
9.2
14.015.318.218.9
22.221.625.2
29.1
35.7
43.045.1
75.0 - 85.0
0
20
40
60
80
100
0
4
8
12
16
20
Net Production (M
Boe/d)
Rig
Coun
t(1)
Horizontal Rigs Vertical Rigs Net Production (MBoe/d)

Peer-leading operating costs driven by ongoing focus on infrastructure optimization and buildout
Favorable Midland D&C costs holding steady despite rising completion intensity
Favorable Cost Trends
4
Midland Basin Drilling & Completion Costs ($MM)(2)
$3.00
$4.00
$5.00
$6.00
$7.00
$8.00
$9.00
$10.00
1Q15 2Q15 3Q15 4Q15 1Q16 2Q16 3Q16 4Q16
Peers PE
LOE vs. Peers ($/Boe)(1)
(1) Peers include CPE, CXO, EGN, FANG, LPI, PXD, and RSPP. Source: company SEC filings; (2) Normalized to 7,000’ stimulated lateral
$7.0$6.5
$6.0$5.5 $5.2
$4.8 $4.7 $4.8
1Q15 2Q15 3Q15 4Q15 1Q16 2Q16 3Q16 4Q16
$3.56
Expanding Premier Midland Basin Position
5
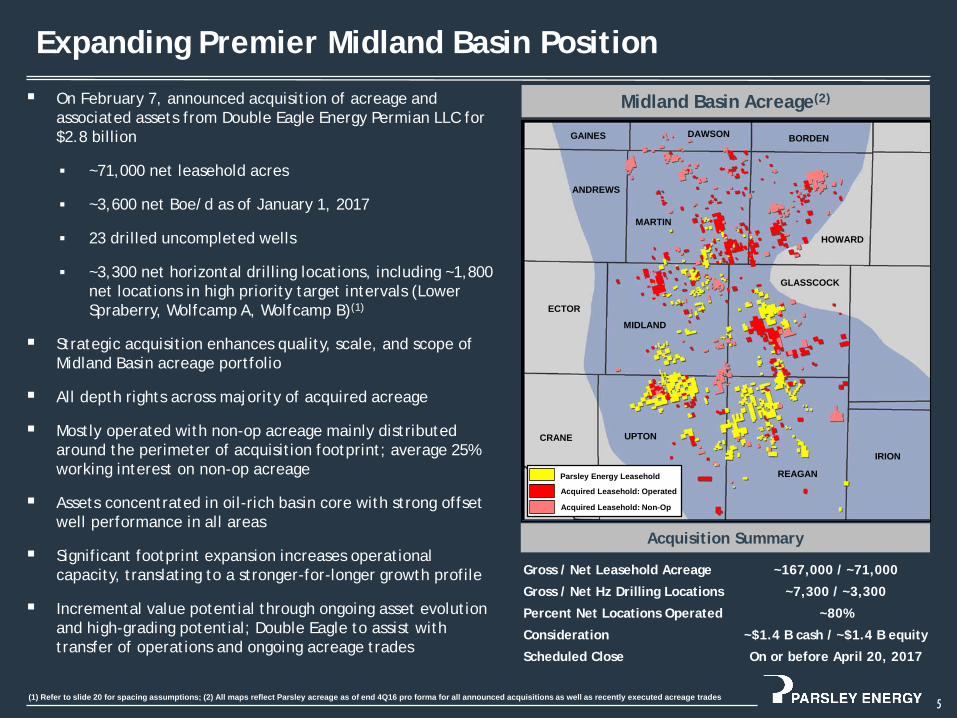
Midland Basin Acreage(2)
(1) Refer to slide 20 for spacing assumptions; (2) All maps reflect Parsley acreage as of end 4Q16 pro forma for all announced acquisitions as well as recently executed acreage trades
On February 7, announced acquisition of acreage and associated assets from Double Eagle Energy Permian LLC for $2.8 billion
~71,000 net leasehold acres
~3,600 net Boe/d as of January 1, 2017
23 drilled uncompleted wells
~3,300 net horizontal drilling locations, including ~1,800net locations in high priority target intervals (Lower Spraberry, Wolfcamp A, Wolfcamp B)(1)
Strategic acquisition enhances quality, scale, and scope of Midland Basin acreage portfolio
All depth rights across majority of acquired acreage
Mostly operated with non-op acreage mainly distributed around the perimeter of acquisition footprint; average 25% working interest on non-op acreage
Assets concentrated in oil-rich basin core with strong offset well performance in all areas
Significant footprint expansion increases operational capacity, translating to a stronger-for-longer growth profile
Incremental value potential through ongoing asset evolution and high-grading potential; Double Eagle to assist with transfer of operations and ongoing acreage trades
MIDLAND
GLASSCOCK
UPTON
REAGAN
MARTIN
HOWARD
IRION
DAWSON BORDEN
ECTOR
ANDREWS
CRANE
GAINES
Acquisition Summary
Gross / Net Leasehold Acreage ~167,000 / ~71,000
Gross / Net Hz Drilling Locations ~7,300 / ~3,300
Percent Net Locations Operated ~80%
Consideration ~$1.4 B cash / ~$1.4 B equity
Scheduled Close On or before April 20, 2017
Parsley Energy Leasehold
Acquired Leasehold: Operated
Acquired Leasehold: Non-Op

GLASSCOCK
REAGAN
UPTON
MIDLAND
MARTIN
HOWARD
Midland Basin
Big Lake Fault
Sticking to the Sweet Spot
6
Overlapping Sweet Spots
Wolfcamp Thickness
Geothermal Gradient
Degrees Fahrenheit per 1000’ Depth
Temperature Sweet Spot
Thickness Sweet Spot
Degrees Fahrenheit per 1,000’ Depth
Wolfcamp Drill Depth
Drill DepthSweet Spot
- More than 80% of Double Eagle net acreage inside sweet spot
- Operating control on 86% of acquired acreage in the sweet spot
- Acquiring more than 1,200 long lateral Lower Spraberry and Wolfcamp A & B locations in sweet spot (lateral length of at least 7,500’)
Parsley Energy Leasehold
Acquired Leasehold
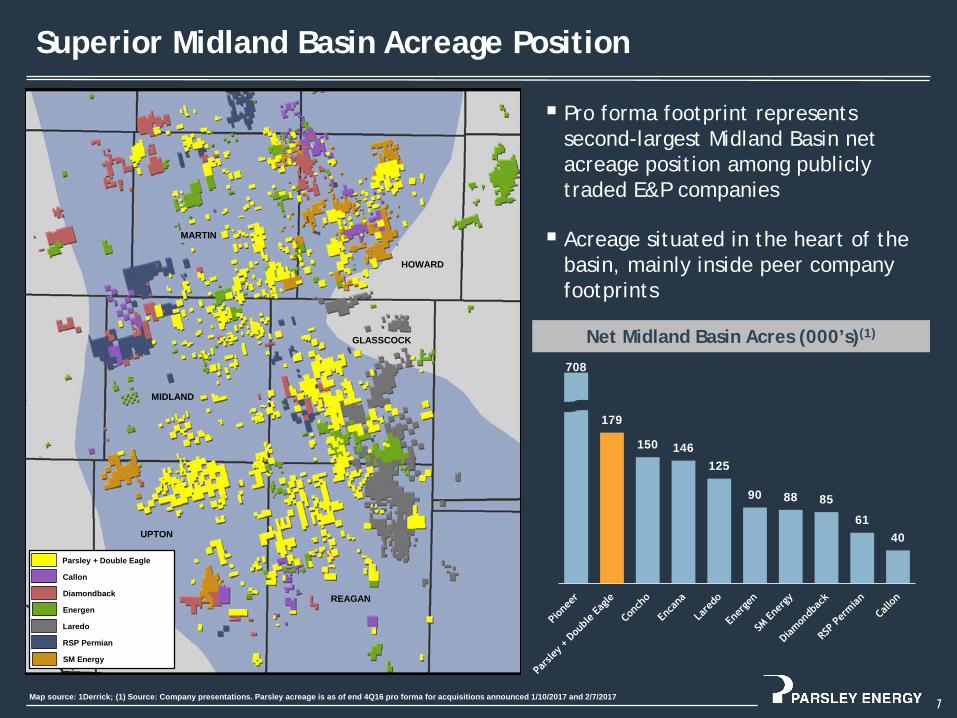
Pro forma footprint represents second-largest Midland Basin net acreage position among publicly traded E&P companies
Acreage situated in the heart of the basin, mainly inside peer company footprints
Superior Midland Basin Acreage Position
7
708
179
150 146125
90 88 85
6140
MIDLAND
UPTON
GLASSCOCK
REAGAN
HOWARD
MARTIN
Net Midland Basin Acres (000’s)(1)
Parsley + Double Eagle
Callon
Diamondback
Energen
RSP Permian
Laredo
SM Energy
Map source: 1Derrick; (1) Source: Company presentations. Parsley acreage is as of end 4Q16 pro forma for acquisitions announced 1/10/2017 and 2/7/2017
Premier Permian Portfolio
8
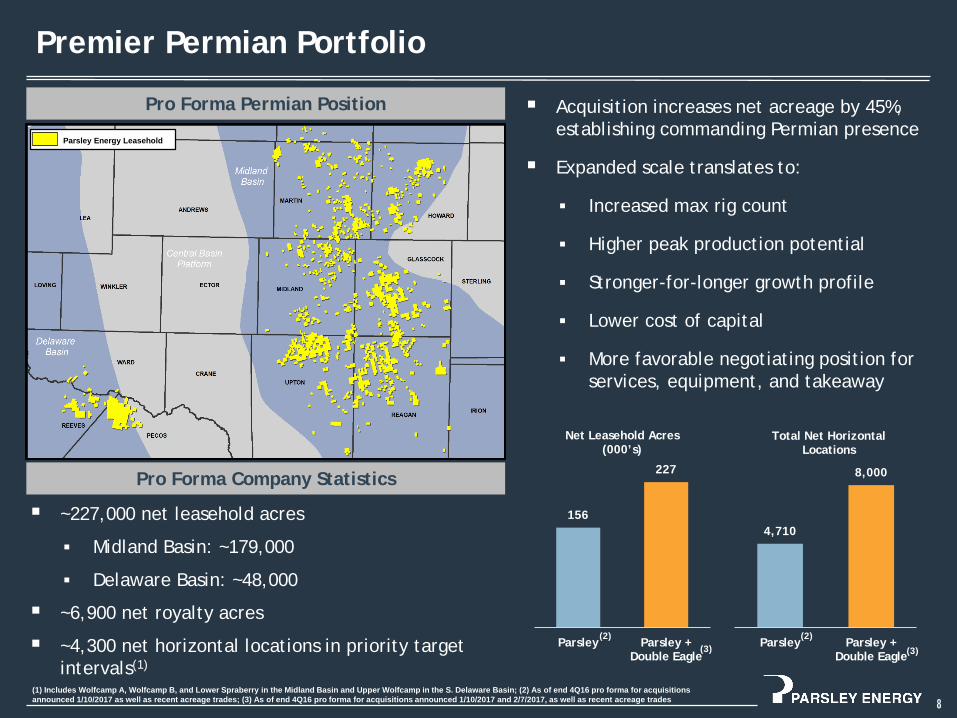
Pro Forma Permian Position
~227,000 net leasehold acres
Midland Basin: ~179,000
Delaware Basin: ~48,000
~6,900 net royalty acres
~4,300 net horizontal locations in priority target intervals(1)
Pro Forma Company Statistics
(1) Includes Wolfcamp A, Wolfcamp B, and Lower Spraberry in the Midland Basin and Upper Wolfcamp in the S. Delaware Basin; (2) As of end 4Q16 pro forma for acquisitions announced 1/10/2017 as well as recent acreage trades; (3) As of end 4Q16 pro forma for acquisitions announced 1/10/2017 and 2/7/2017, as well as recent acreage trades
Parsley Energy Leasehold
Acquisition increases net acreage by 45%, establishing commanding Permian presence
Expanded scale translates to:
Increased max rig count
Higher peak production potential
Stronger-for-longer growth profile
Lower cost of capital
More favorable negotiating position for services, equipment, and takeaway
156
227
Parsley Parsley +Double Eagle
Net Leasehold Acres (000’s)
4,710
8,000
Parsley Parsley +Double Eagle
Total Net Horizontal Locations
(2) (2)(3) (3)
0
50
100
150
200
250
0
3
6
9
12
15
1Q15 2Q15 3Q15 4Q15 1Q16 2Q16 3Q16 4Q16 1Q17E 2Q17E 3Q17E 4Q17E
Net Leasehold A
cres (000’s)A
vera
ge R
ig C
ount
Average Rig Count Net Leasehold Acres
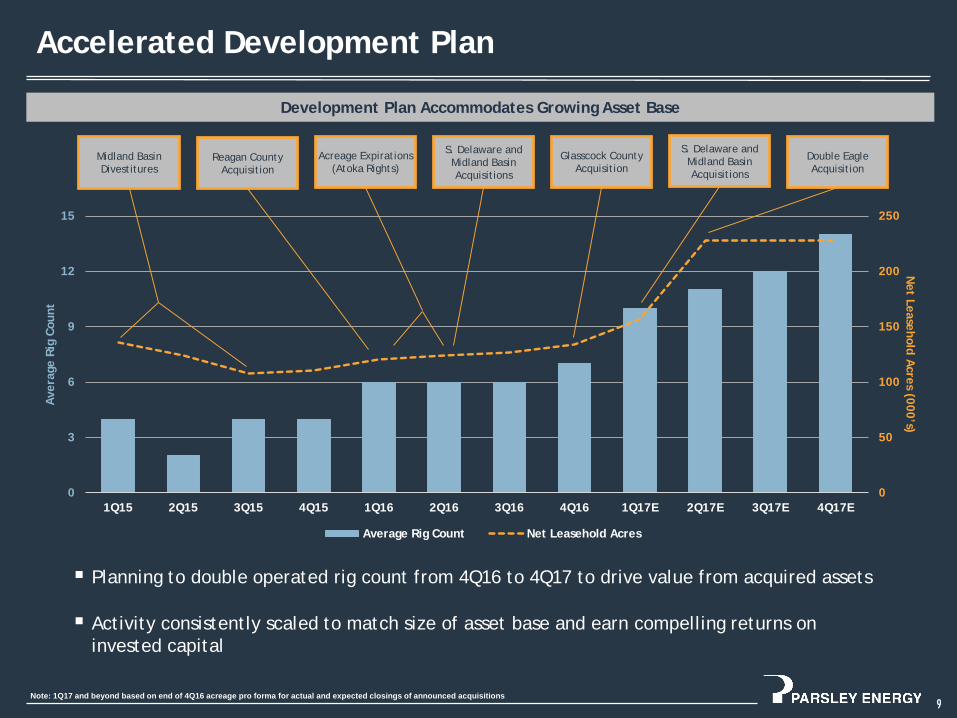
Planning to double operated rig count from 4Q16 to 4Q17 to drive value from acquired assets
Activity consistently scaled to match size of asset base and earn compelling returns on invested capital
Accelerated Development Plan
9
Development Plan Accommodates Growing Asset Base
Note: 1Q17 and beyond based on end of 4Q16 acreage pro forma for actual and expected closings of announced acquisitions
Midland Basin Divestitures
Acreage Expirations(Atoka Rights)
S. Delaware and Midland Basin Acquisitions
Glasscock County Acquisition
S. Delaware and Midland Basin Acquisitions
Double Eagle Acquisition
Reagan County Acquisition

0
25
50
75
100
125
150
175
200
225
250
0 90 180 270 360
Cum
ulat
ive
Prod
ucti
on (
MBo
e)(2
)
Days of Production
Midland Basin S. Delaware Basin
(1) Number of wells achieving a 30-day IP since 3Q16 quarterly update; 30-day IP’s are 3-stream; (2) Normalized to 7,000’ stimulated lateral and for downtime
Strong Productivity Across Asset Base
10
Midland Delaware
Wells 18 2
Average Lateral Length 8,536’ 8,385’
30-day IP (Boe/d) 1,446 1,791
30-day IP per 1,000’ (Boe/d) 172 224
% Oil 72% 70%
4Q16 Well Summary(1)
Parsley Leasehold
Parsley Producing Wolfcamp Wells
Strong, repeatable well results in both Midland and Southern Delaware Basins
Several new company records in 4Q16
Highest IP24: Taylor 45-33-4601H – 3,205 Boe/d (1st Wolfcamp C well; Reagan County)
Highest IP30: Grace 45-1-4306H -- 2,194 Boe/d (Upton County)
Highest IP30 in S. Delaware: Lincoln 4-1-4307H –-1,929 Boe/d (Reeves County)
Highest IP30 for 2-well Pad: Mary 18-18B-7-4202H & 4401H –- combined 3,386 Boe/d (Upton County)
$0
$50
$100
$150
$200
$250
$300
$350
$400
$450
Midland Basin Operators(2)
11
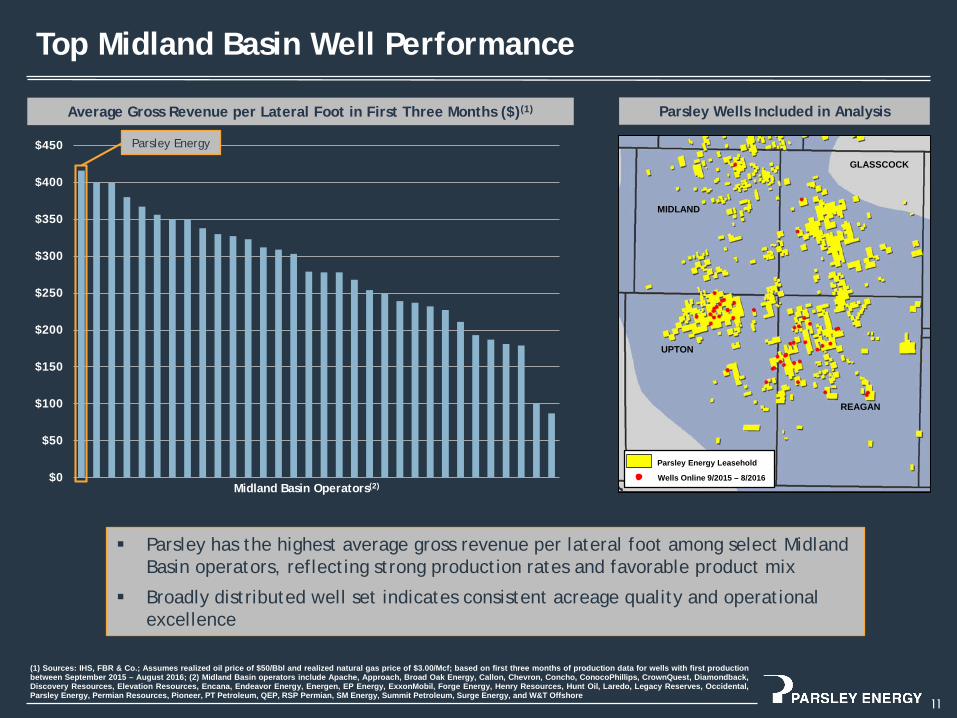
Top Midland Basin Well Performance
Average Gross Revenue per Lateral Foot in First Three Months ($)(1)
Parsley Energy
Parsley has the highest average gross revenue per lateral foot among select Midland Basin operators, reflecting strong production rates and favorable product mix
Broadly distributed well set indicates consistent acreage quality and operational excellence
(1) Sources: IHS, FBR & Co.; Assumes realized oil price of $50/Bbl and realized natural gas price of $3.00/Mcf; based on first three months of production data for wells with first productionbetween September 2015 – August 2016; (2) Midland Basin operators include Apache, Approach, Broad Oak Energy, Callon, Chevron, Concho, ConocoPhillips, CrownQuest, Diamondback,Discovery Resources, Elevation Resources, Encana, Endeavor Energy, Energen, EP Energy, ExxonMobil, Forge Energy, Henry Resources, Hunt Oil, Laredo, Legacy Reserves, Occidental,Parsley Energy, Permian Resources, Pioneer, PT Petroleum, QEP, RSP Permian, SM Energy, Summit Petroleum, Surge Energy, and W&T Offshore
Parsley Wells Included in Analysis
Parsley Energy Leasehold
Wells Online 9/2015 – 8/2016
MIDLAND
GLASSCOCK
UPTON
REAGAN

12
Unlocking Value in New Target Zones
1st Wolfcamp C Lateral
2-mile Wolfcamp C well posted company-record 30-day IP rate
Strong pressure and favorable oil cut (62%)(1) suggest compelling economic profile
(1) 3-Stream; (2) Normalized to 7,000’ stimulated lateral length
Strong Production Trend on 2-Mile Lower Spraberry Well Highest Parsley 30-Day IP Rates
2-Mile Lower Spraberry
Surpassed implied type curve cumulative production after 240 days with very shallow decline profile
Could match or exceed Wolfcamp A/B return profile given low decline and high oil cut
0
25
50
75
100
125
150
175
0 30 60 90 120 150 180 210 240 270
Cum
ulat
ive
Prod
ucti
on (
MBo
e)(1
)(2)
Days of Production
Taylor 45-33-4601H (WC C)
Dusek 45-4-2807H (L. Spby)
3,135
2,1941,932 1,908 1,883
0
500
1,000
1,500
2,000
2,500
3,000
3,500
Taylor45-33-4601H(Wolfcamp C)
Grace45-1-4306H
(Upper WCB)
Atkins14-11-4415H(Lower WCB)
Bast34-39-4412H(Lower WCB)
Atkins14-11-4202H(Wolfcamp A)
Peak
30-
Day
IP (
Boe/
d)(1
)
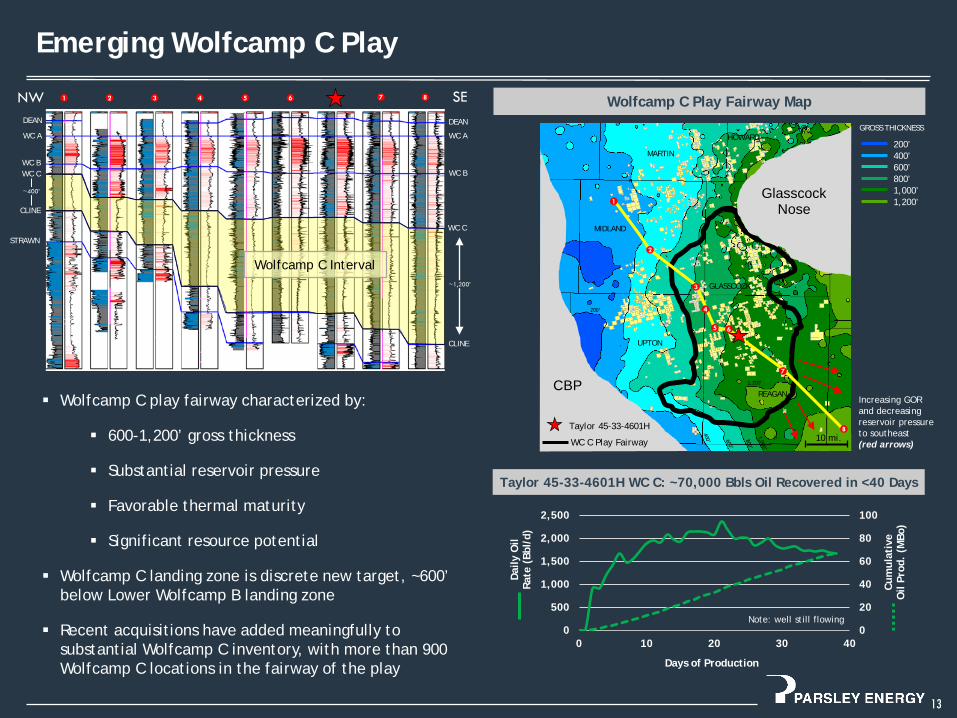
Emerging Wolfcamp C Play
13
Wolfcamp C play fairway characterized by:
600-1,200’ gross thickness
Substantial reservoir pressure
Favorable thermal maturity
Significant resource potential
Wolfcamp C landing zone is discrete new target, ~600’ below Lower Wolfcamp B landing zone
Recent acquisitions have added meaningfully to substantial Wolfcamp C inventory, with more than 900 Wolfcamp C locations in the fairway of the play
Taylor 45-33-4601H WC C: ~70,000 Bbls Oil Recovered in <40 Days
0
20
40
60
80
100
0
500
1,000
1,500
2,000
2,500
0 10 20 30 40
Cum
ulat
ive
Oil
Prod
. (M
Bo)
Dai
ly O
ilRa
te (
Bbl/
d)
Days of Production
Note: well still flowing
Wolfcamp C Play Fairway Map
1
2
3
4
5 6
7
8
NW SE
Wolfcamp C Interval
1 2 3 4 5 6 7 8
DEAN
WC A
WC BWC C
CLINE
STRAWN
DEAN
WC A
WC B
WC C
CLINE
GlasscockNose
CBPIncreasing GOR and decreasing reservoir pressure to southeast(red arrows)WC C Play Fairway
Taylor 45-33-4601H
MARTIN
MIDLAND
UPTON
HOWARD
GLASSCOCK
REAGAN
200’400’600’800’1,000’1,200’
1,200’
10 mi.
~1,200’
~400’
GROSS THICKNESS

REEVES
Record Well Results in Reeves County
14
Outstanding Reeves County well results among highest in the company, making recent acquisition even more compelling
1st drilled well, Lincoln 4-1-4307H, posted IP30 of 1,929 Boe/d, representing strongest S. Delaware and 3rd
highest company-wide IP30
2nd drilled well, Kauffman St C4-6-4307H, posted second-highest company-wide IP24 of 2,666 Boe/d
On January 10, announced acquisition of ~4,500 net leasehold acres and ~3,800 net mineral acres in Reeves county
Added ~85 net locations in Wolfcamp and Bone Spring benches with average ~9,500’ lateral length
(1) 3-Stream; normalized for downtime and to 7,000’ stimulated lateral; (2) 3-Stream
Reeves WC Wells Outperforming Type Curve by 55%
0
25
50
75
100
125
150
175
200
0 30 60 90 120 150 180
Cum
ulat
ive
Prod
ucti
on (
MBo
e)(1
)
Days of Production
Highest Parsley 24-hr IP Rates
Parsley Energy Leasehold
Acquired Leasehold
Parsley Completed Wells
3,205
2,666 2,6582,445 2,408
0
500
1,000
1,500
2,000
2,500
3,000
3,500
Taylor45-33-4601H(Wolfcamp C)
Kauffman StC4-6-4307H
(S. Del Upper WC)
Bast34-39-4412H(Lower WCB)
Grace45-1-4306H
(Upper WCB)
Robbie17-8-4403H
(Lower WCB)
Peak
24-
Hr
IP (
Boe/
d)(2
)

$26.73
$8.04
$0
$5
$10
$15
$20
$25
$30
2015 2016$
/ Bo
e
55
91
124
222
0
50
100
150
200
250
2013 2014 2015 2016
Robust Reserve Growth
15
Proved reserves up 80% Y/Y (oil up 85% Y/Y) despite writing off remaining ~18 MMBoe of vertical PUD reserves
Strong organic reserve replacement ratio of approximately 680%(1)
PD F&D down 70% Y/Y to $8.04/Boe(2)
Strong Growth in Proved Reserves
Tota
l Pro
ved
Rese
rves
(M
MBo
e)
Oil (MMBbl)
Gas(Bcf)
NGL (MMBbl)
Total (MMBoe)
PDP 59.3 121.8 23.7 103.3
PDNP 1.9 2.2 0.6 2.8
PUD 75.4 99.7 24.2 116.2
Total Proved 136.6 223.7 48.5 222.3
124
-14 -4 -7
24
99
222
-50
0
50
100
150
200
250
YE15 Prod. Rev. Divest. Acq. Adds YE16
Note: Reserve summary as of 12/31/2016 and audited by Netherland, Sewell & Associates, Inc.; Data for Parsley only; not pro forma for pending acquisitions; (1) Organic reserve replacementratio calculated as total 2016 reserves additions and revisions (technical and pricing) divided by total 2016 production; excludes acquisitions and divestitures; (2) PD F&D calculated as total2016 Capex (including Infrastructure and Other) divided by total 2016 proved developed reserves additions and revisions (technical and pricing); excludes acquisitions and divestitures
Compelling PD F&D Costs(2)
+80%+300% -70%
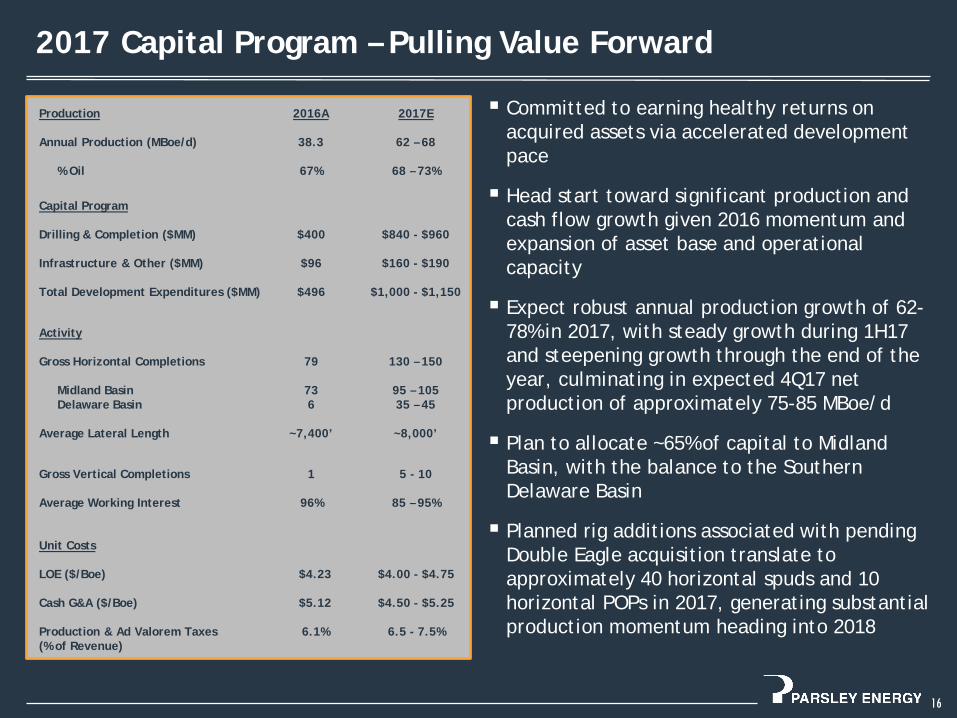
2017 Capital Program – Pulling Value Forward
16
Unit Costs
LOE ($/Boe) $4.23 $4.00 - $4.75
Cash G&A ($/Boe) $5.12 $4.50 - $5.25
Production & Ad Valorem Taxes (% of Revenue)
6.1% 6.5 - 7.5%
Capital Program
Drilling & Completion ($MM) $400 $840 - $960
Infrastructure & Other ($MM) $96 $160 - $190
Total Development Expenditures ($MM) $496 $1,000 - $1,150
Activity
Gross Horizontal Completions
Midland BasinDelaware Basin
Average Lateral Length
79
736
~7,400’
130 – 150
95 – 10535 – 45
~8,000’
Gross Vertical Completions 1 5 - 10
Average Working Interest 96% 85 – 95%
Production
Annual Production (MBoe/d)
% Oil
2016A
38.3
67%
2017E
62 – 68
68 – 73%
Committed to earning healthy returns on acquired assets via accelerated development pace
Head start toward significant production and cash flow growth given 2016 momentum and expansion of asset base and operational capacity
Expect robust annual production growth of 62-78% in 2017, with steady growth during 1H17 and steepening growth through the end of the year, culminating in expected 4Q17 net production of approximately 75-85 MBoe/d
Plan to allocate ~65% of capital to Midland Basin, with the balance to the Southern Delaware Basin
Planned rig additions associated with pending Double Eagle acquisition translate to approximately 40 horizontal spuds and 10 horizontal POPs in 2017, generating substantial production momentum heading into 2018

Liquidity Summary ($MM) First lien credit facility(1) $598 Cash on hand $765Total liquidity $1,363
Healthy financial position supports accelerated development program
$1,363 MM of liquidity
Fully undrawn borrowing base of $875 MM, with elected commitment of $600 MM
Favorable maturity schedule, with earliest notes maturity in 2024
In February, Moody’s upgraded Parsley’s Corporate Family Rating to B1 from B2
Strong Financial Position
17
Favorable Debt Maturity Schedule
$600
$650
$450 $875
$400
$1,100
0
200
400
600
800
1000
1200
2017 2018 2019 2020 2021 2022 2023 2024 2025
($M
M)
Borrowing Base Senior Notes TOTAL
Committed Amount
Borrowing Base
1H25
2H25
Note: All data as of end 4Q16 pro forma for acquisitions and equity offerings announced 1/10/2017 and 2/7/2017 and issuance of new senior notes due 2025 announced on 2/7/2017; (1) Net of$2 MM letter of credit which does not change the status of the Company’s fully undrawn borrowing base

Substantial Oil Hedge Position
18
Meaningful increase in oil hedge position in view of anticipated production growth
Position extends into 2019
Parsley to assume Double Eagle’s hedge positions upon closing of acquisition
$0
$10
$20
$30
$40
$50
$60
0
10
20
30
40
50
60
1Q17 2Q17 3Q17 4Q17 1Q18 2Q18 3Q18 4Q18 1Q19 2Q19 3Q19 4Q19
WTI ($/Bbl)M
Bbls
/d
MBbls/d Hedged Weighted Average Long Put PriceHedge positions as of 2/23/2017. Upon the closing of Parsley’s pending acquisition of Double Eagle, Parsley will assume Double Eagle’s existing hedge positions; (1) When NYMEX price isabove put price, Parsley receives NYMEX price. When NYMEX price is between the put price and the short put price, Parsley receives the put price. When NYMEX price is below the short putprice, Parsley receives the NYMEX price plus the difference between the short put price and the put price; (2) Functions similarly to put spreads except that when index price is at or above thecall price, Parsley receives the call price; (3) Premium realizations represent net premiums collected (from restructured positions) or paid (including deferred premiums), which are recognizedas income or loss in the period of settlement; (4) Parsley receives the swap price; (5) When NYMEX price is above the call price, Double Eagle receives call price. When NYMEX is below the putprice, Double Eagle receives the put price. When NYMEX is between call and put prices, Double Eagle receives the NYMEX price; (6) Double Eagle receives the strike price; (7) Includes Parsleypositions and Double Eagle positions to be assumed by Parsley; excludes WTI and basis swaps
Oil Volumes Hedged(7)
1Q17 2Q17 3Q17 4Q17 1Q18 2Q18 3Q18 4Q18 1Q19 2Q19 3Q19 4Q19
Parsley Energy:
Put Spreads (MBbls/d)1 13.8 13.6 35.7 45.5 23.3 23.1 19.6 19.6 Put Price ($/Bbl) $49.93 $49.93 $52.66 $52.80 $53.21 $52.14 $50.00 $50.00 Short Put Price ($/Bbl) $36.14 $36.14 $41.80 $41.95 $41.43 $42.14 $40.00 $40.00
Three Way Collars (MBbls/d)2 13.3 19.8 31.0 31.0 8.3 8.2 8.2 8.2 Call Price ($/Bbl) $74.38 $75.28 $75.65 $75.65 $80.40 $80.40 $80.40 $80.40 Put Price ($/Bbl) $50.00 $50.00 $50.00 $50.00 $50.00 $50.00 $50.00 $50.00 Short Put Price ($/Bbl) $40.00 $40.00 $40.00 $40.00 $40.00 $40.00 $40.00 $40.00
Premium Realization ($ MM)3 ($4.9) ($4.9) ($14.2) ($17.8) ($11.9) ($10.4) ($10.6) ($10.6) ($1.5) ($1.5) ($1.5) ($1.5)
Mid-Cush Basis Swaps (MBbls/d)4 11.3 11.3 12.2 12.2 1.0 1.0 1.0 1.0 Swap Price ($/Bbl) ($1.00) ($1.00) ($1.05) ($1.05) ($0.95) ($0.95) ($0.95) ($0.95)
Double Eagle:
Collars (MBbls/d)5 1.5 4.0 4.0 3.0 3.0 3.0 3.0
Call Price ($/Bbl) $56.15 $59.73 $59.98 $61.31 $61.31 $61.31 $61.31 Put Price ($/Bbl) $47.00 $46.75 $46.75 $45.67 $45.67 $45.67 $45.67
WTI Swaps (MBbls/d)6 1.0 0.5 0.5 0.5 0.5 0.5 0.5 Strike Price ($/Bbl) $53.42 $55.00 $55.00 $55.00 $55.00 $55.00 $55.00
Mid-Cush Basis Swaps (MBbls/d)4 4.5 4.5 3.5 3.5 3.5 3.5 Swap Price ($/Bbl) ($0.86) ($0.86) ($0.90) ($0.90) ($0.90) ($0.90)
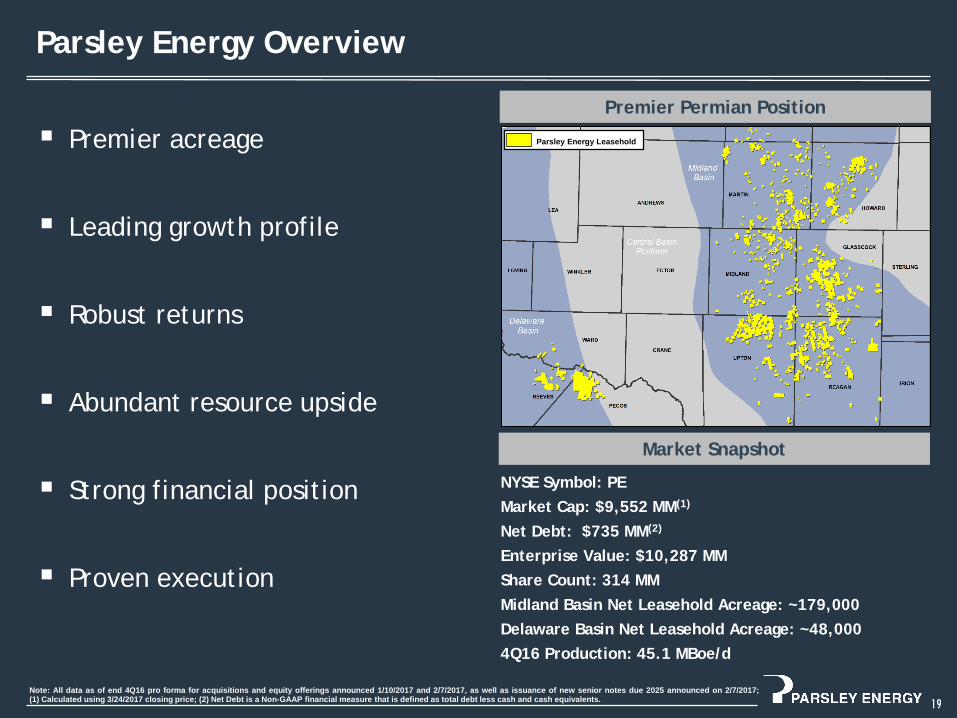
Parsley Energy Overview
19
Market Snapshot
Premier Permian Position
NYSE Symbol: PEMarket Cap: $9,552 MM(1)
Net Debt: $735 MM(2)
Enterprise Value: $10,287 MMShare Count: 314 MMMidland Basin Net Leasehold Acreage: ~179,000Delaware Basin Net Leasehold Acreage: ~48,0004Q16 Production: 45.1 MBoe/d
Note: All data as of end 4Q16 pro forma for acquisitions and equity offerings announced 1/10/2017 and 2/7/2017, as well as issuance of new senior notes due 2025 announced on 2/7/2017;(1) Calculated using 3/24/2017 closing price; (2) Net Debt is a Non-GAAP financial measure that is defined as total debt less cash and cash equivalents.
Premier acreage
Leading growth profile
Robust returns
Abundant resource upside
Strong financial position
Proven execution
Parsley Energy Leasehold

Investment Highlights
20
SUPPLEMENTARY SLIDES
Expansive, High-quality Drilling Inventory
21
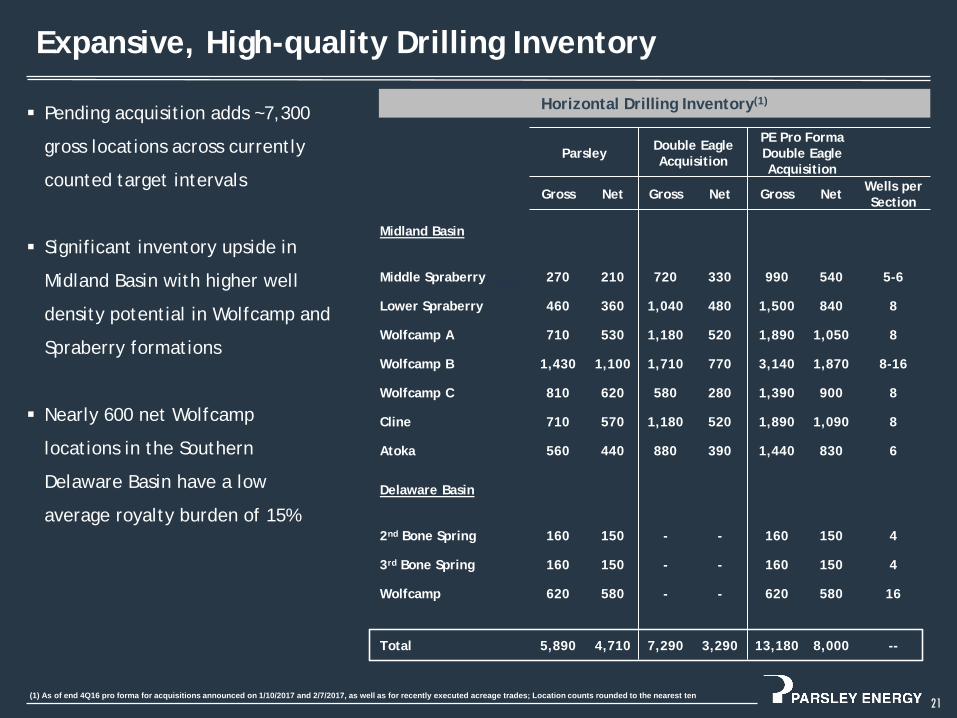
Horizontal Drilling Inventory(1)
+240’
(1) As of end 4Q16 pro forma for acquisitions announced on 1/10/2017 and 2/7/2017, as well as for recently executed acreage trades; Location counts rounded to the nearest ten
Pending acquisition adds ~7,300
gross locations across currently
counted target intervals
Significant inventory upside in
Midland Basin with higher well
density potential in Wolfcamp and
Spraberry formations
Nearly 600 net Wolfcamp
locations in the Southern
Delaware Basin have a low
average royalty burden of 15%
Parsley Double Eagle Acquisition
PE Pro Forma Double Eagle Acquisition
Gross Net Gross Net Gross Net Wells per Section
Midland Basin
Middle Spraberry 270 210 720 330 990 540 5-6
Lower Spraberry 460 360 1,040 480 1,500 840 8
Wolfcamp A 710 530 1,180 520 1,890 1,050 8
Wolfcamp B 1,430 1,100 1,710 770 3,140 1,870 8-16
Wolfcamp C 810 620 580 280 1,390 900 8
Cline 710 570 1,180 520 1,890 1,090 8
Atoka 560 440 880 390 1,440 830 6
Delaware Basin
2nd Bone Spring 160 150 - - 160 150 4
3rd Bone Spring 160 150 - - 160 150 4
Wolfcamp 620 580 - - 620 580 16
Total 5,890 4,710 7,290 3,290 13,180 8,000 --
Selected Operating Data – 4Q16
22
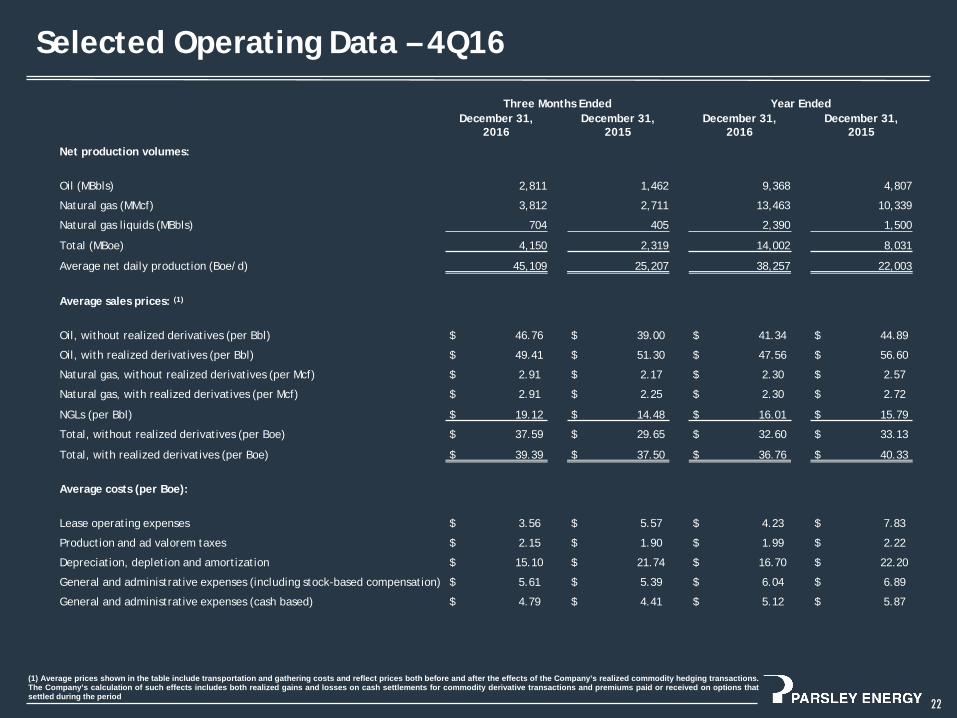
(1) Average prices shown in the table include transportation and gathering costs and reflect prices both before and after the effects of the Company’s realized commodity hedging transactions.The Company’s calculation of such effects includes both realized gains and losses on cash settlements for commodity derivative transactions and premiums paid or received on options thatsettled during the period
Three Months Ended Year EndedDecember 31,
2016December 31,
2015December 31,
2016December 31,
2015
Net production volumes:
Oil (MBbls) 2,811 1,462 9,368 4,807
Natural gas (MMcf) 3,812 2,711 13,463 10,339
Natural gas liquids (MBbls) 704 405 2,390 1,500
Total (MBoe) 4,150 2,319 14,002 8,031
Average net daily production (Boe/d) 45,109 25,207 38,257 22,003
Average sales prices: (1)
Oil, without realized derivatives (per Bbl) $ 46.76 $ 39.00 $ 41.34 $ 44.89
Oil, with realized derivatives (per Bbl) $ 49.41 $ 51.30 $ 47.56 $ 56.60
Natural gas, without realized derivatives (per Mcf) $ 2.91 $ 2.17 $ 2.30 $ 2.57
Natural gas, with realized derivatives (per Mcf) $ 2.91 $ 2.25 $ 2.30 $ 2.72
NGLs (per Bbl) $ 19.12 $ 14.48 $ 16.01 $ 15.79
Total, without realized derivatives (per Boe) $ 37.59 $ 29.65 $ 32.60 $ 33.13
Total, with realized derivatives (per Boe) $ 39.39 $ 37.50 $ 36.76 $ 40.33
Average costs (per Boe):
Lease operating expenses $ 3.56 $ 5.57 $ 4.23 $ 7.83
Production and ad valorem taxes $ 2.15 $ 1.90 $ 1.99 $ 2.22
Depreciation, depletion and amortization $ 15.10 $ 21.74 $ 16.70 $ 22.20
General and administrative expenses (including stock-based compensation) $ 5.61 $ 5.39 $ 6.04 $ 6.89
General and administrative expenses (cash based) $ 4.79 $ 4.41 $ 5.12 $ 5.87
$0
$2
$4
$6
$8
$10
$12
$14
$16
$40 $45 $50 $55 $60
NPV
($M
M)
Oil Price
0%
20%
40%
60%
80%
100%
120%
$40 $45 $50 $55 $60
Rate
of
Retu
rn (
%)
Oil Price
Strong Returns Across Portfolio
23
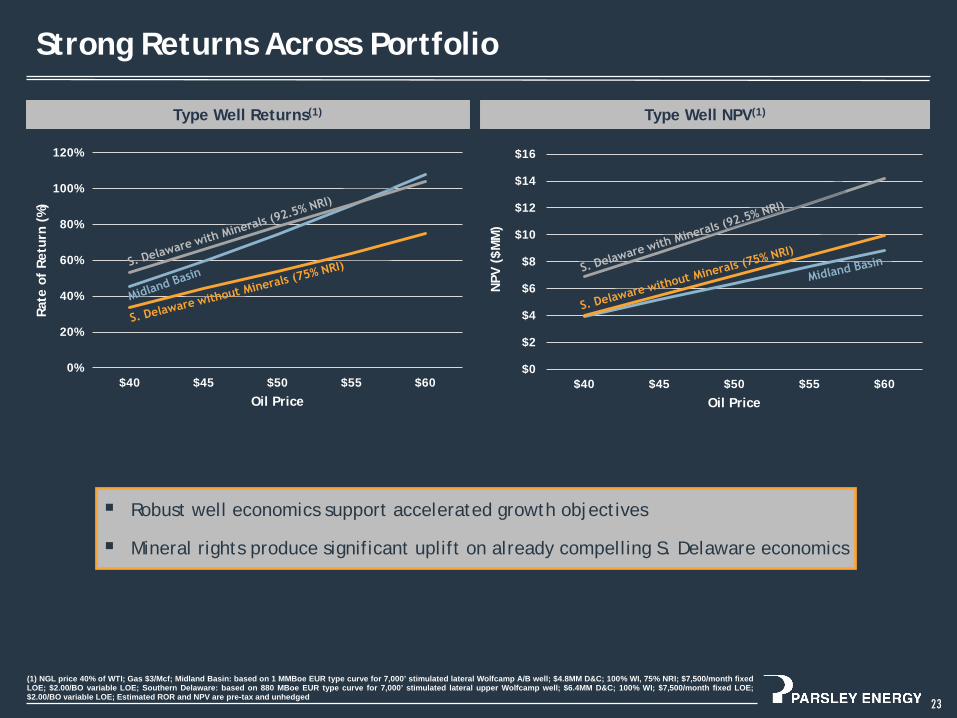
Type Well NPV(1)Type Well Returns(1)
(1) NGL price 40% of WTI; Gas $3/Mcf; Midland Basin: based on 1 MMBoe EUR type curve for 7,000’ stimulated lateral Wolfcamp A/B well; $4.8MM D&C; 100% WI, 75% NRI; $7,500/month fixedLOE; $2.00/BO variable LOE; Southern Delaware: based on 880 MBoe EUR type curve for 7,000’ stimulated lateral upper Wolfcamp well; $6.4MM D&C; 100% WI; $7,500/month fixed LOE;$2.00/BO variable LOE; Estimated ROR and NPV are pre-tax and unhedged
Robust well economics support accelerated growth objectives
Mineral rights produce significant uplift on already compelling S. Delaware economics

Double Eagle Acquisition Detail: Upton and Reagan
24
Ham B-1801HSPermian ResourcesWolfcamp ALateral Length: 8,193’30-day IP: 1,044 Boe/d (85% Oil)
Taylor 45-33-4404HParsleyWolfcamp BLateral Length: 9,802’30-day IP: 1,325 Boe/d (84% Oil) (1)
John Smoltz 33-30-4407HParsleyWolfcamp BLateral Length: 7,492’30-day IP: 1,257 Boe/d (83% Oil) (1)
Parsley Energy Leasehold
Acquired Leasehold
Pegasus 3-3911HConchoWolfcamp BLateral Length: 7,170’30-day IP: 1,347 Boe/d (80% Oil)
Dusek 45-4-2807HParsleyLower SpraberryLateral Length: 10,114’30-day IP: 1,019 Boe/d (81% Oil) (1)
Atkins 14-11-4202HParsleyWolfcamp ALateral Length: 7,774’30-day IP: 1,634 Boe/d (83% Oil) (1)
Morgan 25-26-11HParsleyWolfcamp BLateral Length: 7,209’30-day IP: 1,000 Boe/d (87% Oil) (1)
Grace 45-1-4306HParsleyWolfcamp BLateral Length: 7,802’30-day IP: 1,875 Boe/d (83% Oil) (1)
1
3
4
5
6
7
8
2
1
REAGAN
UPTON
Note: The above well results are not intended to be representative of results for all wells across this acreage and individual well results may differ materially therefrom; well data from publicsources, except as otherwise noted; 30-day IP’s and percent oil are 2-stream; (1) Company data
23
4
5
6
78
Complementary additions to well-known and prolific Parsley acreage position
Double Eagle Acquisition Detail: Midland and Glasscock
25
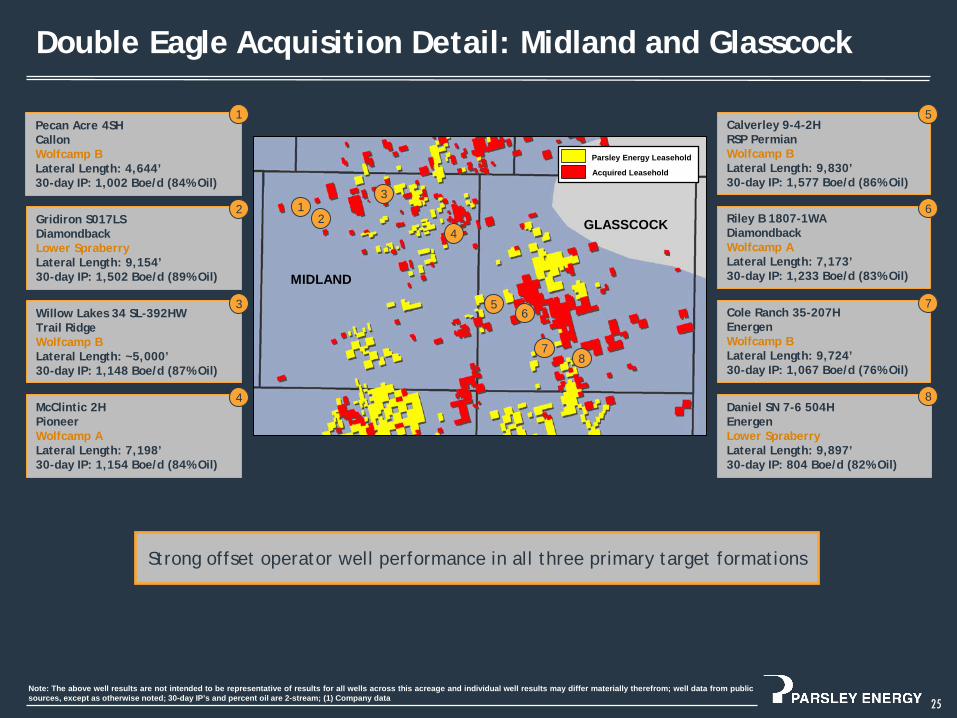
Riley B 1807-1WADiamondbackWolfcamp ALateral Length: 7,173’30-day IP: 1,233 Boe/d (83% Oil)
Cole Ranch 35-207HEnergenWolfcamp BLateral Length: 9,724’30-day IP: 1,067 Boe/d (76% Oil)
Daniel SN 7-6 504HEnergenLower SpraberryLateral Length: 9,897’30-day IP: 804 Boe/d (82% Oil)
Parsley Energy Leasehold
Acquired Leasehold
Pecan Acre 4SHCallonWolfcamp BLateral Length: 4,644’30-day IP: 1,002 Boe/d (84% Oil)
Gridiron S017LSDiamondbackLower SpraberryLateral Length: 9,154’30-day IP: 1,502 Boe/d (89% Oil)
Willow Lakes 34 SL-392HWTrail RidgeWolfcamp BLateral Length: ~5,000’30-day IP: 1,148 Boe/d (87% Oil)
McClintic 2HPioneerWolfcamp ALateral Length: 7,198’30-day IP: 1,154 Boe/d (84% Oil)
Calverley 9-4-2HRSP PermianWolfcamp BLateral Length: 9,830’30-day IP: 1,577 Boe/d (86% Oil)
1
3
4
5
6
7
8
2 1GLASSCOCK
MIDLAND
2
3
4
56
78
Strong offset operator well performance in all three primary target formations
Note: The above well results are not intended to be representative of results for all wells across this acreage and individual well results may differ materially therefrom; well data from publicsources, except as otherwise noted; 30-day IP’s and percent oil are 2-stream; (1) Company data
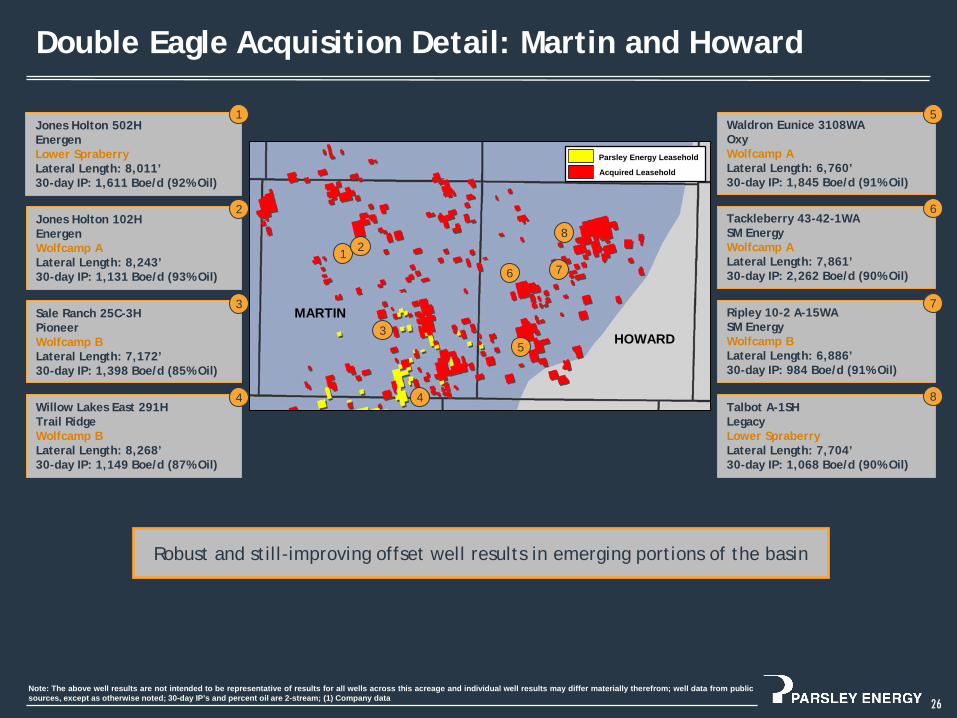
Double Eagle Acquisition Detail: Martin and Howard
26
Tackleberry 43-42-1WASM EnergyWolfcamp ALateral Length: 7,861’30-day IP: 2,262 Boe/d (90% Oil)
Ripley 10-2 A-15WASM EnergyWolfcamp BLateral Length: 6,886’30-day IP: 984 Boe/d (91% Oil)
Talbot A-1SHLegacyLower SpraberryLateral Length: 7,704’30-day IP: 1,068 Boe/d (90% Oil)
Parsley Energy Leasehold
Acquired Leasehold
Jones Holton 502HEnergenLower SpraberryLateral Length: 8,011’30-day IP: 1,611 Boe/d (92% Oil)
Jones Holton 102HEnergenWolfcamp ALateral Length: 8,243’30-day IP: 1,131 Boe/d (93% Oil)
Sale Ranch 25C-3HPioneerWolfcamp BLateral Length: 7,172’30-day IP: 1,398 Boe/d (85% Oil)
Willow Lakes East 291HTrail RidgeWolfcamp BLateral Length: 8,268’30-day IP: 1,149 Boe/d (87% Oil)
Waldron Eunice 3108WAOxyWolfcamp ALateral Length: 6,760’30-day IP: 1,845 Boe/d (91% Oil)
1
3
4
5
6
7
8
2
1
HOWARD
MARTIN
2
3
4
5
6 7
8
Robust and still-improving offset well results in emerging portions of the basin
Note: The above well results are not intended to be representative of results for all wells across this acreage and individual well results may differ materially therefrom; well data from publicsources, except as otherwise noted; 30-day IP’s and percent oil are 2-stream; (1) Company data