Embed Size (px)
Citation preview

Investor Presentation
September 2013
1
Forward-Looking Statements
2
This presentation contains forward-looking statements within the meaning of federal securities laws regarding both MPC and MPLX. These forward-looking statements relate to, among other things, MPC’s current expectations, estimates and projections concerning MPC’s and MPLX’s business and operations. You can identify forward-looking statements by words such as “anticipate,” “believe,” “estimate,” “expect,” “forecast,” “project,” “could,” “may,” “should,” “would,” “will” or other similar expressions that convey the uncertainty of future events or outcomes. Such forward-looking statements are not guarantees of future performance and are subject to risks, uncertainties and other factors, some of which are beyond the company’s control and are difficult to predict. Factors that could cause MPC’s actual results to differ materially from those in the forward-looking statements include: the availability and pricing of crude oil and other feedstocks; slower growth in domestic and Canadian crude supply; completion of pipeline capacity to areas outside the U.S. Midwest; the reliability of processing units and other equipment; MPC’s ability to successfully implement growth opportunities; MPC’s ability to successfully achieve the strategic and financial objectives related to the acquisition of the Galveston Bay refinery and related assets, including achieving the projected synergies and the acquisition being accretive to its earnings; impacts from MPC’s repurchases of its shares of common stock under its stock repurchase authorization, including the timing and amounts of any common stock repurchases; other risk factors inherent to MPC’s industry; and the factors set forth under the heading “Risk Factors” in MPC’s Annual Report on Form 10-K for the year ended December 31, 2012 filed with the SEC. Factors that could cause MPLX’s actual results to differ materially from those in the forward-looking statements include: the adequacy of MPLX’s capital resources and liquidity, including, but not limited to, availability of sufficient cash flow to pay distributions and execute its business plan; completion of pipeline capacity by MPLX’s competitors; disruptions due to equipment interruption or failure; the suspension, reduction or termination of MPC’s obligations under its commercial agreements; MPLX’s ability to successfully implement its growth strategy, whether through organic growth or acquisitions; other risk factors inherent to MPLX’s industry; and the factors set forth under the heading “Risk Factors” in MPLX’s Annual Report on Form 10-K for the year ended December 31, 2012 filed with the SEC. Factors that could cause MPC’s and MPLX’s actual results to differ materially from those in the forward-looking statements include: the timing and extent of changes in commodity prices and demand for crude oil, refined products, feedstocks or other hydrocarbon-based products; volatility in and/or degradation of market and industry conditions; consumer demand for refined products; transportation logistics; and state and federal environmental, economic, health and safety, energy and other policies and regulations, including the cost of compliance with the Renewable Fuel Standard. In addition, the forward-looking statements included herein could be affected by general domestic and international economic and political conditions. Unpredictable or unknown factors not discussed here, in MPC’s Form 10-K or in MPLX’s Form 10-K could also have material adverse effects on results.

Strategic Vision
Achieve top tier safety/environmental performance
Grow enterprise value
Expand platform for MPLX growth
Deliver top quartile refining performance
Increase Speedway and Marathon brand assured sales volumes
Deliver profitable Speedway growth
3
Goal: Top Quartile Total Shareholder Return
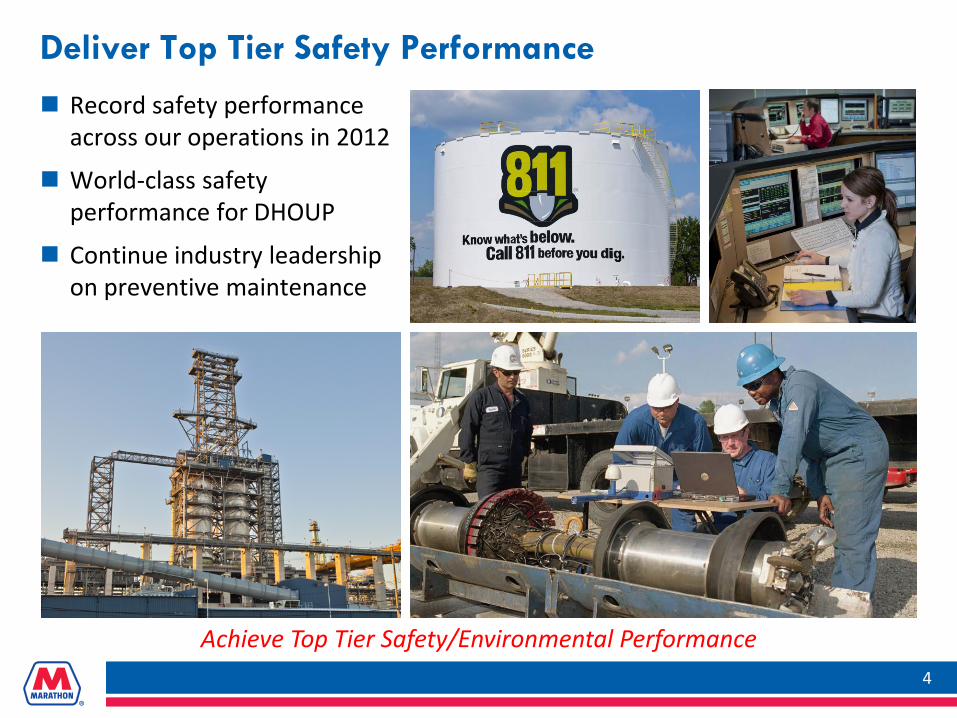
Deliver Top Tier Safety Performance
4
Record safety performance across our operations in 2012
World-class safety performance for DHOUP
Continue industry leadership on preventive maintenance
Achieve Top Tier Safety/Environmental Performance

Grow Enterprise Value
Earnings growth
Strong dividend, growing over the long term
Sustained share repurchase program
Valuation re-rate/uplift
5
Grow Enterprise Value
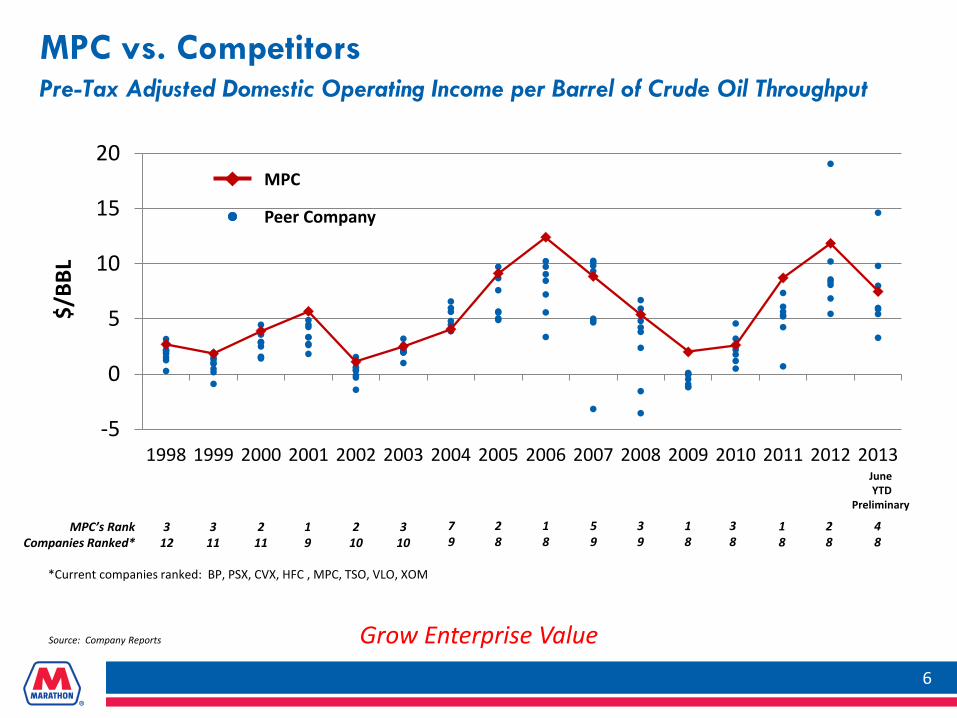
MPC vs. Competitors Pre-Tax Adjusted Domestic Operating Income per Barrel of Crude Oil Throughput
6
$/BB
L
*Current companies ranked: BP, PSX, CVX, HFC , MPC, TSO, VLO, XOM
Source: Company Reports
2 11
MPC’s Rank Companies Ranked*
3 12
3 11
1 9
2 10
7 9
2 8
5 9
3 9
1 8
3 10
1 8
3 8
1 8
2 8
-5
0
5
10
15
20
1998 1999 2000 2001 2002 2003 2004 2005 2006 2007 2008 2009 2010 2011 2012 2013
MPC
Peer Company
4 8
Grow Enterprise Value
June YTD
Preliminary

Grow Enterprise Value
Op Income and EBITDA Growth
$3.46 billion of capital returned to shareholders since 7/1/11 as of 6/30/13 $1.3 billion share repurchase authorization outstanding as of 6/30/13
Cumulative Returns to Shareholders
7
Top Quartile Shareholder Returns
1 Non-GAAP disclosure, see appendix for reconciliation to net income attributable to MPC
0
500
1,000
1,500
2,000
2,500
3,000
3,500
4,000
Q3 2011 Q4 2011 Q1 2012 Q2 2012 Q3 2012 Q4 2012 Q1 2013 Q2 2013$M
M
Dividends Share repurchases
$3.46 B
654 1,011
3,745
5,347
1,324 1,952
4,636
6,342
0
1,000
2,000
3,000
4,000
5,000
6,000
7,000
2009 2010 2011 2012
$MM
Income from Operations EBITDA(1)EBITDA1
Source: Company Report

Grow Enterprise Value Total Shareholder Return of 93% for 2012, 14% for 2013
8
31% 36%
67%
93%
43%
14%
0%
20%
40%
60%
80%
100%
Q1 2012 Q2 2012 Q3 2012 Q4 2012 Q1 2013 Q2 2013
Cumulative Total Shareholder Return by Year
Top Quartile Shareholder Returns

9
Growth Drivers

MPC has Created an Industry-Leading MLP
10
Grow MPLX
20
25
30
35
40
45
10/2
5/12
11/1
2/12
11/2
7/12
12/1
1/12
12/2
6/12
01/1
0/13
01/2
4/13
02/0
7/13
02/2
2/13
03/0
8/13
03/2
2/13
04/0
8/13
04/2
2/13
05/0
6/13
05/2
0/13
06/0
4/13
06/1
8/13
07/0
2/13
07/1
7/13
07/3
1/13
08/1
5/13
08/2
9/13
Unit Price Focus on Fee-Based Businesses
Pursue Organic Growth Opportunities
Grow Through Acquisitions and Drop-downs
Maintain Safe and Reliable Operations

Acquisition of Galveston Bay Assets
451 MBPCD (475 MBPSD) high complexity refinery, Nelson Complexity Index of 15.3
Attractive base cash purchase price of ~$598 million
Potential $700 million earnout over six year period
Closed February 1, 2013; financed with cash on hand
Estimated incremental annual EBITDA based on:
2006-2010 Prices: ~$1,200 million
2011 Prices: ~$700 million
11
Deliver Top Quartile Refining Performance

Detroit Heavy Oil Upgrade Project Increased heavy oil capacity from
20,000 BPCD to 100,000 BPCD 28,000 BPCD delayed Coker
36,000 BPCD Distillate Hydrotreater (DHT)
Crude capacity increased ~14,000 BPCD
Discounted Canadian crude
Investment: $2.2 billion* project
Estimated incremental annual EBITDA based on: 2006 -2010 Prices: ~$200 million
2011 Prices: ~$350 million
Operated at design capacity YTD 2013
*Excludes capitalized interest
Deliver Top Quartile Refining Performance 12

Garyville Major Expansion (GME) Project
Garyville, LA refinery is last grassroots refinery built in the U.S. (1976)
Base Garyville refinery, 2008 Solomon survey Best U.S. cash cost operating expense Second-best U.S. Energy Intensity Index
GME Project completed in late 2009 - significantly expanded crude oil refining capacity and improved Garyville’s overall fixed cash cost by ~20% per barrel
Garyville is the 3rd largest refinery in U.S. at 522,000 BPCD
13
Deliver Top Quartile Refining Performance

$3.9 Billion* Garyville Major Expansion
1/1/2009 256 MBPCD
Crude Capacity 190 MBPCD
Gasoline 95 MBPCD
Diesel 18th Largest
U.S. refinery
1/1/2012 490 MBPCD
Crude Capacity 305 MBPCD
Gasoline 215 MBPCD
Diesel Third Largest
U.S. refinery
*Excludes capitalized interest
14
1/1/2010 436 MBPCD
Crude Capacity 290 MBPCD
Gasoline 175 MBPCD
Diesel Fourth Largest
U.S. refinery
1/1/2011 464 MBPCD
Crude Capacity 300 MBPCD
Gasoline 185 MBPCD
Diesel Third Largest
U.S. refinery
1/1/2013 522 MBPCD
Crude Capacity 320 MBPCD
Gasoline 230 MBPCD
Diesel Third Largest
U.S. refinery
Deliver Top Quartile Refining Performance
Cumulative crude capacity increases (180 MBPCD) (208 MBPCD) (234 MBPCD) (266 MBPCD)

15
Supply Dynamics
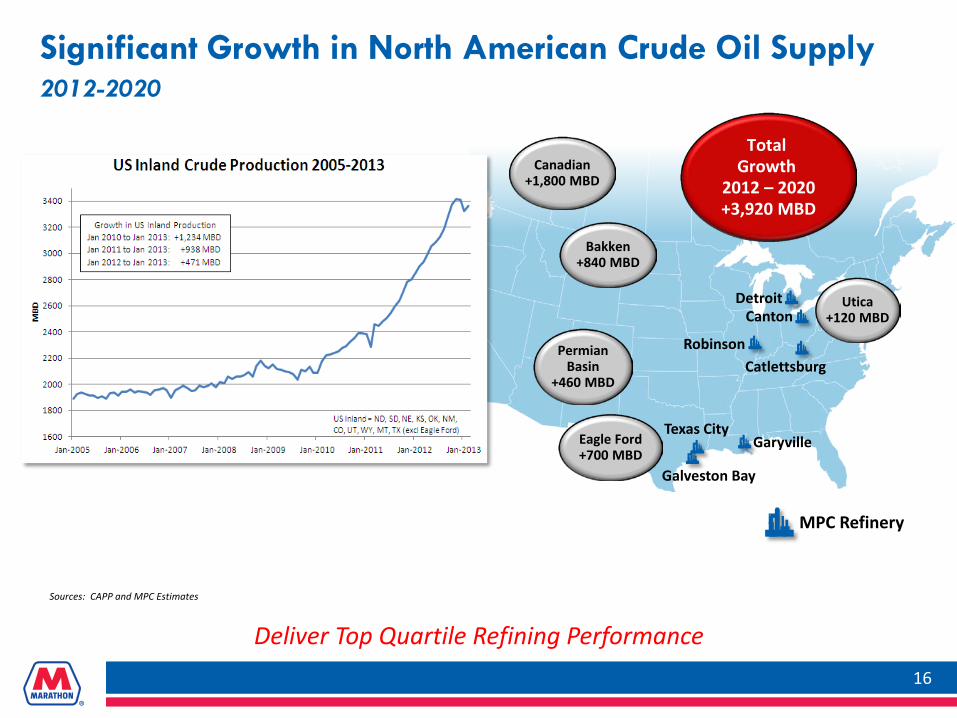
Canadian +1,800 MBD
Permian Basin
+460 MBD
Eagle Ford +700 MBD
Utica +120 MBD
Total Growth
2012 – 2020 +3,920 MBD
Bakken +840 MBD
Significant Growth in North American Crude Oil Supply 2012-2020
16
Detroit Canton
Catlettsburg Robinson
Garyville Texas City
Sources: CAPP and MPC Estimates
Deliver Top Quartile Refining Performance
Galveston Bay
MPC Refinery

Balance in Refining Network
17 17
Midwest Capacity 646,000 BPCD
Louisiana Capacity 522,000 BPCD
Texas Capacity 531,000 BPCD
Canton (Ohio) 80,000
Catlettsburg (Ky.) 240,000
Detroit (Mich.) 120,000
Robinson (Ill.) 206,000
Galveston Bay (Texas) 451,000
Texas City (Texas) 80,000
Garyville (La.) 522,000
Total 1,699,000
Source: Oil & Gas Journal
As of Feb. 1, 2013
Deliver Top Quartile Refining Performance

Port Arthur Houston
Hardisty
Chicago
Wood River
Patoka
~$7.35/BBL Hardisty to USGC
~$1.95/BBL Houston to Chicago
~$5.50/BBL Hardisty to
Detroit
Detroit Value vs. USGC Refineries for Canadian Heavy Processing
Laid-In Crude Cost
$BBL
1.85
Higher Product Value 2.20*
Total Advantage 4.05
* Includes $0.25 time value of money to ship a light product barrel from Houston to Chicago
MPC Well Positioned to Capture Oil Sands Economics
Cushing
18
St. James
Deliver Top Quartile Refining Performance

Transportation Costs Set Crude Differentials
19
Sources: MPC Estimates based on publically available information, OPIS, and Argus Media.
Bakken
St. James
Patoka
Eagle Ford
Excludes gathering and truck transportation costs (up to ~$5.25/BBL)
$4.60
$16.75
$10.35 $16.00
Deliver Top Quartile Refining Performance
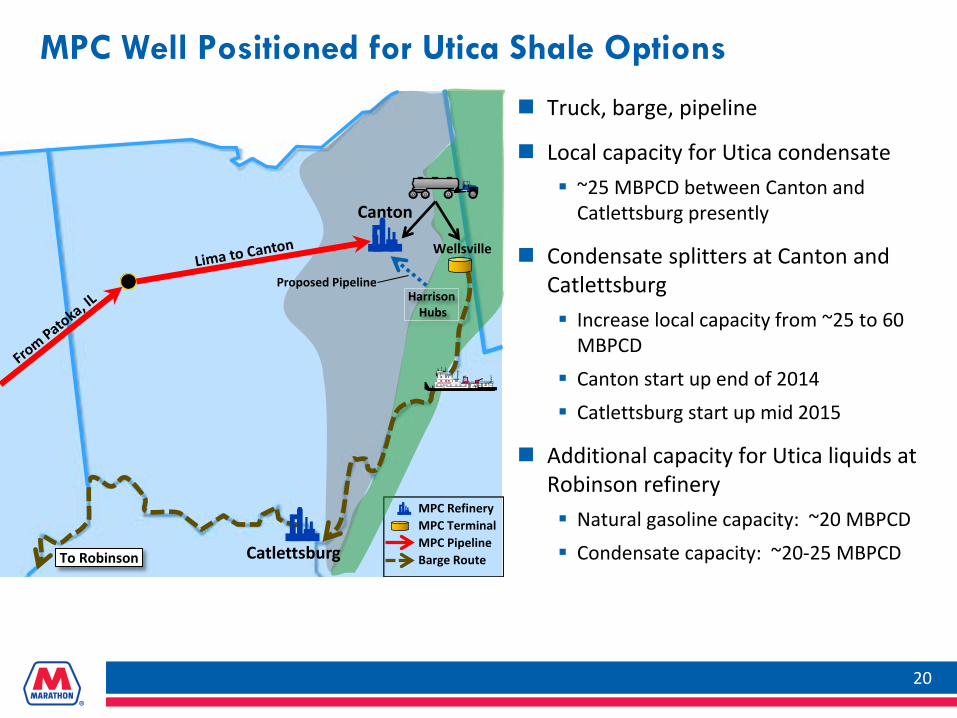
MPC Well Positioned for Utica Shale Options
Multiple Transportation Options Truck, barge, pipeline
Local capacity for Utica condensate ~25 MBPCD between Canton and
Catlettsburg presently
Condensate splitters at Canton and Catlettsburg Increase local capacity from ~25 to 60
MBPCD Canton start up end of 2014 Catlettsburg start up mid 2015
Additional capacity for Utica liquids at Robinson refinery Natural gasoline capacity: ~20 MBPCD Condensate capacity: ~20-25 MBPCD
20
To Robinson
MPC Refinery MPC Terminal MPC Pipeline Barge Route
Canton
Catlettsburg
Wellsville
Proposed Pipeline Harrison
Hubs

21
Distribution & Marketing

U.S. Distillate Exports Continue to Grow
Total U.S. distillate exports averaged 1 MMBPD in 2012 compared to 138 MBPD in 2005
~60% of the total U.S. distillate exports were to Latin America
Growing regional demand and the closing of refineries in Aruba and St. Croix, Virgin Islands, and the disarray in Venezuela’s refining have supported Latin American export demand from U.S. sources
More than 1 MMBPD of Europe’s refining capacity has closed or will be closing since 2008. This has opened up additional opportunities for U.S. exports.
22
Source: U.S. Energy Information Administration
0
200
400
600
800
1000
1200
2003
2004
2005
2006
2007
2008
2009
2010
2011
2012
Thou
sand
b/d
U.S. Distillate Exports
Central & South AmericaMexico Netherlands Other

Diesel and Gasoline Export Success Currently selling gas and diesel
export cargos via term and spot transactions
Value added relative to domestic pipeline sales Product quality premium No RIN obligation
Optimize export logistics
23
Deliver Top Quartile Refining Performance
35 76
114 145
16
0
50
100
150
200
2010 2011 2012 2013*
MBP
D
Exports
Diesel Gas *Through 6/30/13 Note: Excludes Asphalt

Extensive Retail Network Provides Assured Sales
24
Speedway Fourth largest U.S.-owned/
operated c-store chain ~1,470 stores ~2 million customers/day Located in nine states
Marathon brand Independent entrepreneurs ~5,000 branded locations Located in 17 states
481
302
307
142
107
63
60 855
779
664
581
390
78
66
138 115
45
268
273
300 194 *
139 * 128
1
As of 6/30/13
Speedway Brand
*Retail marketing assignments related to ~ 1,200 additional BP brand locations acquired February 1, 2013 primarily in these states
*
2
*
4

3.06
01234
2009 2010 2011 2012
$B
Merchandise Sales
Speedway Sales – Stable Merchandise Margin
25
Attributable to Minnesota assets sold on December 1, 2010
795
0200400600800
1,0001,2001,400
2009 2010 2011 2012 M
M$
Light Product and Merchandise Gross Margin
Merchandise Light Product
775 789 719
Profitable Speedway Growth
3.03
01234
2009 2010 2011 2012
B G
allo
ns
Light Product Volume
3.7 (1.2)
(Same Store % inside bars)
1.0 (0.9)
4.4 1.1 11.4 0.9
3.11 2.92 3.19
(Same Store % inside bars)
3.23 2.94 3.30
333 398 384 399
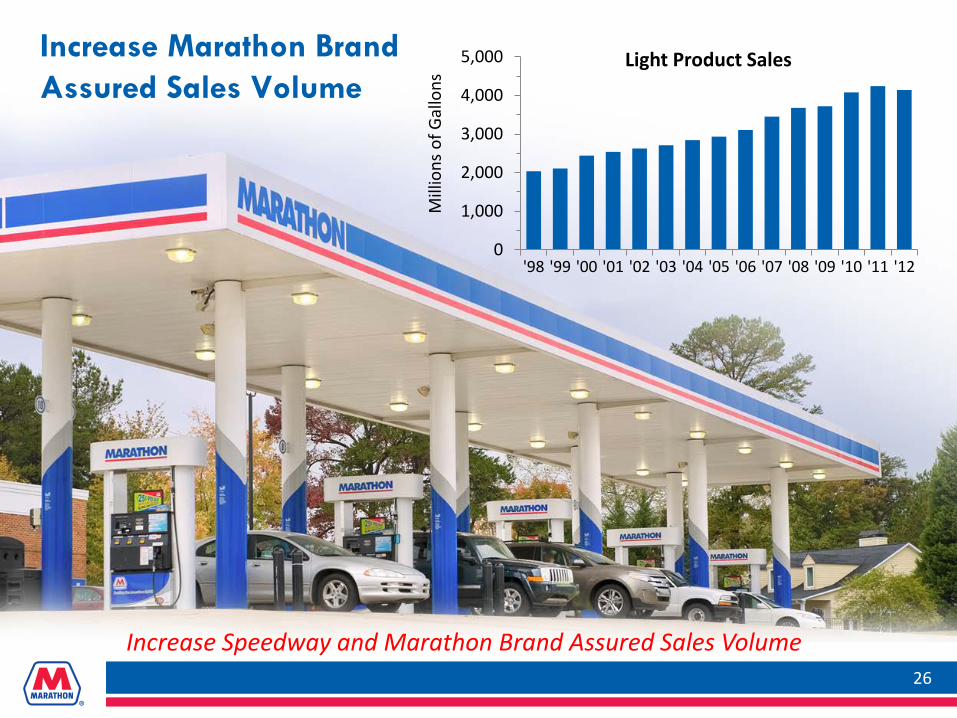
Increase Marathon Brand Assured Sales Volume
0
1,000
2,000
3,000
4,000
5,000
'98 '99 '00 '01 '02 '03 '04 '05 '06 '07 '08 '09 '10 '11 '12
Mill
ions
of G
allo
ns Light Product Sales
26
Increase Speedway and Marathon Brand Assured Sales Volume

2013 Value Drivers
Growth of MPLX
Galveston Bay refinery
Detroit Heavy Oil Upgrade Project
Profitable Speedway growth
2013 $1.6 billion capital investments*
Capital return to shareholders Strong dividend, growing over the long term Continuing share repurchases – as of June 30, 2013, $1.3 billion authorization
remaining
27
Goal: Top Quartile Total Shareholder Return *Excludes purchase price of Galveston Bay refinery and related assets

Appendix
28

MPC is a Strong Strategic Sponsor for MPLX MPC is a leading independent R&M company
Enterprise value of $23.0 billion1 and LTM EBITDA generation of $6.3 billion²
2012 revenue of $82.2 billion, Fortune 50 company
Large integrated refining, marketing and logistics system Seven refineries with crude capacity of
~1.7 MMBPCD Speedway – fourth largest U.S. C-store chain
with ~1,470 locations in nine states Marathon brand – ~5,000 outlets in 17 states Significant retained midstream assets
MPC has a strong credit profile and significant liquidity Investment grade (BBB / Baa2) – stable/
positive outlook Debt / EBITDA of 0.5x1,2 and Debt / Total Capital of 22%1,3
~$6.6 billion of liquidity4
Notes: 1 313.1 MM shares outstanding at $73.33/share at 7/31/2013, $3.07 billion cash, $3.41 billion
debt at 6/30/2013 2 See Appendix for last twelve month (LTM) EBITDA reconciliation to net income as of 6/30/2013 3 Equity of $12.197 billion at 6/30/2013 4 Includes $3.07 billion cash, undrawn $2.5 billion revolver and undrawn $1 billion trade
receivables securitization facility at 6/30/2013
29
Water Terminals
Light Product Terminals
Connecting Pipelines
Refineries
Asphalt Terminals
Marketing Area
Tank Farms
Butane Caverns
Barge Dock

Source: Company Reports
MPC has Strong Earnings and Cash Flow, Investment Grade Credit Profile
$MM 6/30/13
Actual
Cash and Cash Equivalents 3,069
Total Debt 3,410
Equity 12,197
Total Capitalization 15,607
Total Debt/LTM EBITDA(2) 0.5x
Debt to Total Capital Ratio 22%
Financial Policies Committed to Investment Grade profile
Rating Current Agency MPC Rating S&P BBB/A-2 (Stable) Moody’s Baa2/P2 (Positive)
Maintain strong access to liquidity, with cash balance, 5-year revolver and access to CP markets
Maintain prudent capitalization and leverage statistics throughout the refining cycle
Capitalization
30
(1) Non-GAAP disclosure, see appendix for reconciliation to net income attributable to MPC. (2) Based on LTM EBITDA of 6,318 MM.
Non-GAAP disclosure, see appendix for reconciliation to net income attributable to MPC.
Committed to Investment Grade Credit Profile
654 1,011
3,745
5,347
1,324
1,952
4,636
6,342
0
1,000
2,000
3,000
4,000
5,000
6,000
7,000
2009 2010 2011 2012
MM
$
Historical Financial Summary
Income from Operations EBITDA(1)EBITDA(1)

Executing on Commitment to Total Shareholder Return
Base dividend increased 110% since July 1, 2011
$2.66 billion share repurchases through June 30, 2013
Total shareholder return of 93% for 2012
31
Balanced Return
$3.46 B
0500
1,0001,5002,0002,5003,0003,5004,000
Q32011
Q42011
Q12012
Q22012
Q32012
Q42012
Q12013
Q22013
$MM
Cumulative Return of Capital
Dividends Share repurchases
31% 36%
67%
93%
0%
20%
40%
60%
80%
100%
Q1 2012 Q2 2012 Q3 2012 Q4 2012
2012 Cumulative Total Shareholder Return

Focused Return of Capital to Shareholders
$2,700
$542
$2,277
$0
$1,000
$2,000
$3,000
$4,000
$5,000
$6,000
LTM Ended 6/30/13
Mill
ions
Dividends and sharerepurchases*
Change in cash and allother
Cash capital expendituresand acquisitions
32
*$464 MM dividends plus $1,813 MM share repurchases **Cash flow provided by operations less cash capital expenditures and acquisitions
~81% of Free Cash
Flow** Free Cash Flow** $2,819
Net cash provided by operations $5,519

38%
62%
Crude Oil Refining Capacity
PADD IIPADD III
As of 2/1/13
MPC Key Strengths
33
Balanced Operations
53% 47%
Crude Slate
Sour Crude
Sweet Crude
As of 6/30/13
~54%
~46% Assured Sales
Wholesale andOther Sales
Assured Sales of Gasoline Production (Speedway + Brand + Wholesale Contract Sales)
As of 6/30/13
Balanced and Diversified Portfolio
279 252
243
192 191 175 164 163
95 89
-50
50
150
250
350
Exxo
n
Citg
o
MPC BP
Che
vron
Val
ero
Phill
ips
Shel
l
Teso
ro
HFC
2,097 1,950
1,808 1,699
981 958 955 755 665 443
0
1,000
2,000
3,000
Val
ero
Exxo
n
Phill
ips
MPC
Shel
l
BP
Che
vron
Citg
o
Teso
ro
HFC
13.4 13.0 12.1 11.7 11.6 11.4 11.1 10.9
9.9 9.5
5.0
10.0
15.0
Che
vron
Exxo
n
HFC
Citg
o
MPC
Phill
ips
Val
ero
Shel
l
BP
Teso
ro
12 11
7 7 7 6
5 5 5
3
0
5
10
15
Val
ero
Phill
ips
Exxo
n
Teso
ro
MPC
Shel
l
BP
Che
vron
HFC
Citg
o
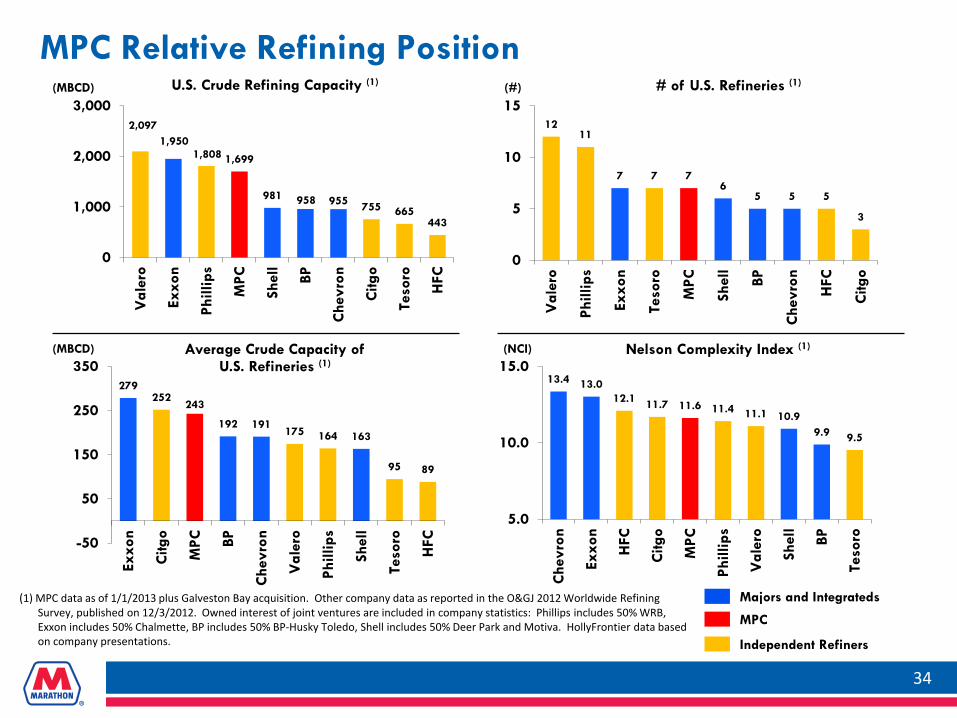
MPC Relative Refining Position
34
U.S. Crude Refining Capacity (1) # of U.S. Refineries (1)
Average Crude Capacity of U.S. Refineries (1)
Nelson Complexity Index (1)
(MBCD) (#)
(NCI)
(1) MPC data as of 1/1/2013 plus Galveston Bay acquisition. Other company data as reported in the O&GJ 2012 Worldwide Refining Survey, published on 12/3/2012. Owned interest of joint ventures are included in company statistics: Phillips includes 50% WRB, Exxon includes 50% Chalmette, BP includes 50% BP-Husky Toledo, Shell includes 50% Deer Park and Motiva. HollyFrontier data based on company presentations.
(MBCD)
Majors and Integrateds
MPC
Independent Refiners

Refinery Capacity
The Nelson Complexity Index is a construction cost-based measurement used to describe the investment cost of a refinery in terms of the process operations being conducted. It is basically the ratio of the process investment downstream of the crude unit to the investment of the crude unit itself. This index has many limitations as an indicator of value and is not necessarily a useful tool in predicting profitability. There is no consideration for operating, maintenance or energy efficiencies and no consideration of non-process assets such as tanks, docks, etc. Likewise it does not consider the ability to take advantage of market related feedstock opportunities.
BPCD NCI*
Garyville 522,000 10.8
Galveston Bay 451,000 15.3
Catlettsburg 240,000 10.3
Robinson 206,000 10.6
Detroit 120,000 9.9
Texas City 80,000 8.4
Canton 80,000 9.0
Total 1,699,000 11.6**
35
**Weighted Average NCI Source: MPC Data. Capacities as of January 1, 2013
*Nelson Complexity Index calculated per Oil and Gas Journal NCI Formula

U.S. Gulf Coast Offshore Imports
Domestic crude oil cannot be exported without a permit, therefore domestic crude oil must be priced to back out imports
Virtually all of the light sweet imports will be displaced in 2013
Other imports will be displaced as U.S. crude oil production increases
36
Rising North America Crude Oil Production Backs Out Waterborne Imports
Sources: DOE/EIA, MPC estimates
Positive Fundamentals

CAPP Western Canada Crude Oil Supply Forecast
37
Annual Growth from 2012 - 2030 MBD
Light Supply 17 Heavy Supply 241
8,000
7,000
6,000
5,000
4,000
3,000
MBD
0
2,000
1,000
Actual Forecast
June 2012 Forecast
Oil Sands Heavy*
Upgraded Light Conventional Heavy Conventional Light
*Oil Sands Heavy includes some volumes of upgraded heavy sour crude oil and bitumen blended with diluent or upgraded crude oil.
2010 2012 2014 2016 2020 2022 2024 2028 2026 2030 2018 2008 2006
Source: Canadian Association of Petroleum Producers (CAPP), June 2013
Growing Supply from America’s Largest Trading Partner
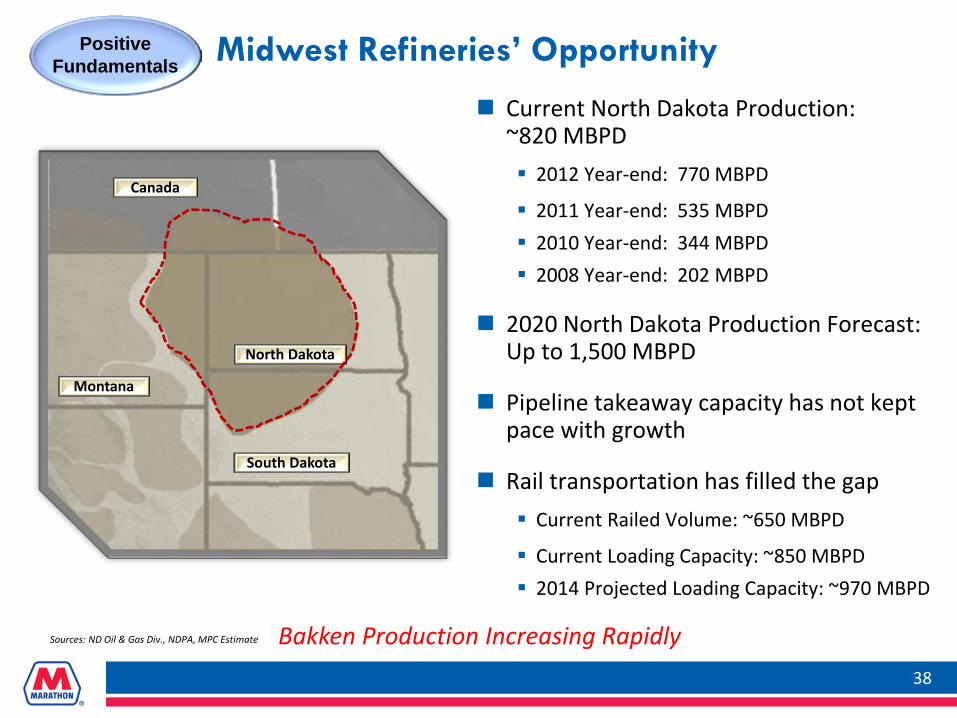
Positive Fundamentals Midwest Refineries’ Opportunity
38
Canada
South Dakota
Montana
North Dakota
Current North Dakota Production: ~820 MBPD 2012 Year-end: 770 MBPD
2011 Year-end: 535 MBPD 2010 Year-end: 344 MBPD 2008 Year-end: 202 MBPD
2020 North Dakota Production Forecast: Up to 1,500 MBPD
Pipeline takeaway capacity has not kept pace with growth
Rail transportation has filled the gap Current Railed Volume: ~650 MBPD
Current Loading Capacity: ~850 MBPD 2014 Projected Loading Capacity: ~970 MBPD
Bakken Production Increasing Rapidly Sources: ND Oil & Gas Div., NDPA, MPC Estimate

U.S. and Canadian Liquids Production Increases 45% from 2012 to 2025
Positive Industry Trends – Growing North American Production
“Resource plays” dominate U.S. output growth. Conventional production (Alaska, offshore, California, other legacy production) struggles to sustain output
NGL output growth is mostly associated with wet gas shale areas
U.S. liquid volume gains are concentrated in PADDs II - IV (mid-continent)
Canada oil sands account for all of its gains, concentrated in Alberta
New transportation investments will be required to move production to market
39
0.0
0.5
1.0
1.5
2.0
2.5
3.0
US Crude &Condensate
US NGL Canada Oil Sands,Crude &
Condensate
MM
BD
2000 - 2012 2012 - 2025
Sources: DOE/EIA, Canadian Association of Petroleum Producers, MPC Estimates

Texas City and Galveston Bay Refinery Opportunity
40
Eagle Ford is a very light (40+ API), sweet crude (0.2% sulfur)
Currently being piped to markets Dock facilities are in operation
and continue to increase utilization to market it as a “waterborne” crude to capture Brent/LLS pricing as opposed to WTI basis
Crude oil production rapidly expanding Currently: 700 MBPD
2012 Annual Average: 498 MBPD
2011 Annual Average: 206 MBPD
2010 Annual Average: 34 MBPD
2009 Annual Average: 3 MBPD
2015 (forecasted): 950 MBPD
Graph Source: EIA
Source: MPC Estimate
Eagle Ford Shale
Eagle Ford Production Increasing Rapidly

Portland
Cushing
Superior Clearbrook
Regina
Cromer
Montreal
Burnaby
Anacortes
Edmonton Trans
Mountain
Chicago Casper
Wood River
Patoka
Sarnia
Mustang SAX
Hardisty
Steele City
Seaway Houston Freeport
St James Houma Ho-Ho
MBPD Pipeline Estimated
Completion
540 Keystone Current
96 Pegasus Current
170 Platte Current
190 Spearhead Current
150 400 850
Seaway Phase 1 Seaway Phase 2 Seaway Phase 3
Current Current 2H 2014
250 360
Ho-Ho Reversal – 1 Ho-Ho Reversal – 2
Current 4Q2013
700 Keystone Gulf Coast 2H 2013
585 Gulf Coast Access 1Q2014
300 Line 9 Mid 2014
TBD SAX Early 2015
420 EGCAP Mid 2015
225-375 Sandpiper 2016
830 Keystone XL 1 H 2016
525-840 Energy East 2017
Gulf Coast Access
Flanagan
U.S./Canada Key Existing and Planned Pipelines
41
ETP
MPC Refineries
Pegasus Planned Keystone XL & GC Keystone
Spearhead Planned Seaway Expansion Planned Ho-Ho Reversal Planned Gulf Coast Access Planned ETP Planned SAX Planned Line 9 Planned Energy East Planned Sandpiper
Source: Publicly Available Information, MPC Estimates

Indicative Transportation Costs
42
Sources: MPC Estimates based on publically available information, OPIS, and Argus Media.
Indicative Rail Costs Bakken to St. James(1) $/BBL
Railcar Loading 1.50
Rail Transportation 10.00
Railcar Lease 3.00
Railcar Unloading 1.50
Total 16.00
Indicative Rail Costs Bakken to U.S. East Coast(1) $/BBL
Railcar Loading 1.50
Rail Transportation 9.00
Railcar Lease 3.00
Railcar Unloading 1.50
Barge Loading .75
Barge Transportation 1.00
Total 16.75
Indicative Shipping Costs S. Texas to U.S. East Coast $/BBL
Pipeline to Houston 1.50
Shipping Transportation 8.85
Total 10.35
Indicative Pipeline Costs Bakken to Patoka(1) $/BBL
Pipeline to Patoka 3.60
*Pipeline to MPC Refineries 1.00
Total 4.60
*Up to $1.00 additional tariff to deliver to a MPC Midwest refinery
Bakken
St. James
Patoka
Eagle Ford
(1) Excludes gathering and truck transportation costs (up to ~$5.25/BBL)

Options… Detroit Logistics
Canadian crude via multiple routes
Virtually all world crudes available via pipelines from USGC
All gasoline production sold in regional market
43
Detroit
Enbridge 2 Enbridge
Capline
Patoka
Mid Valley
Lima
Wood River
Chicago
Stockbridge
Samaria
#1 #2
#3 Platte/Keystone
#4 #5
Strategically Located for Multiple Crude Supply Routes

Attractive Midwest/PADD II
Demand exceeds refining capacity in PADD II Net imported ~13% of petroleum
demand into PADD II, primarily from PADD III in 2012 Enhances margin opportunities Transportation premium embedded
in PADD II gasoline prices Higher refinery utilization rates Relatively leaner product stocks
Access to Canadian crude
Well positioned for Utica crude
44
7% 21%
50%
4% 18%
38%
62%
0%
20%
40%
60%
80%
PADD I PADD II PADD III PADD IV PADD VIndustry Distribution MPC
Percentage of Crude Oil Capacity by PADD
Source: MPC Estimate
Largest Midwest Exposure of All Major Refining Competitors
Sources: MPC, DOE, as of 2/1/2013
PADD I PADD II
PADD III
PADD V
PADD IV

Fully Integrated Downstream Business
Ratable sales
Optimized operations Refining Pipeline Terminal
Biofuels blending base load
Supply dislocation flexibility
Reduced credit risk (Speedway)
45
Coastal Water Terminals
Inland Water Terminals
Light Product Terminals
Connecting Pipelines Refineries Speedway Marketing Area
Capturing Value MPC Well Positioned – Benefits of Retail Integration

Speedway vs. Public Peers – 2012
46
177.1
0
50
100
150
200
250
300
Casey's Couche-Tard Pantry Susser Speedway Valero Murphy Tesoro Delek WesternRefining
M G
al/S
tore
/Mon
th
Light Product Sales
Average 103.5
Average 146.9
31.2
05
10152025303540
Casey's Couche-Tard Pantry Susser Speedway Valero Murphy Tesoro Delek WesternRefining
$M/S
tore
/Mon
th
Light Product Margin
Public C-Store
Independent Refiners
Public C-Store
Independent Refiners
Average 14.7
Average 23.7
#2 in Light Product Unit Sales Volume Source: Company Reports

Speedway vs. Public Peers – 2012
47
174.7
0
50
100
150
200
Casey's Couche-Tard Pantry Susser Speedway Valero Murphy Tesoro Delek WesternRefining
$M/S
tore
/Mon
th
Merchandise Sales
Average 115.7 Average 93.5
45.5
0
10
20
30
40
50
60
Casey's Couche-Tard Pantry Susser Speedway Valero Murphy Tesoro Delek WesternRefining
$M/S
tore
/Mon
th
Merchandise Margin
Public C-Store Independent Refiners
Public C-Store
Independent Refiners Average 40.6
Average 22.2
#1 in Merchandise Unit Sales Source: Company Reports

48
0
10
20
30
40
50
60
2000 2005 2010 2015 2020 2025
Mile
s Per
Gal
lon
Adjusted On-road New Autos (Model Year) New Automobiles (Model Year)
Adjusted On-road New Light Trucks (Model Year) New Light Trucks (Model Year)
Adjusted Total On-road Vehicle Fleet
Gasoline Vehicle Fuel Efficiencies
Sources: DOT, MPC Economics

2013 Significant Capital Projects
Upgrade Galveston Bay refinery
Speedway expansion
Garyville diesel projects
Utica Shale projects Condensate splitters Wellsville terminal
Patoka to Catlettsburg pipeline upgrade
Robinson unicracker revamp
Garyville gasoline and diesel export
Catlettsburg vacuum cut-point project
49
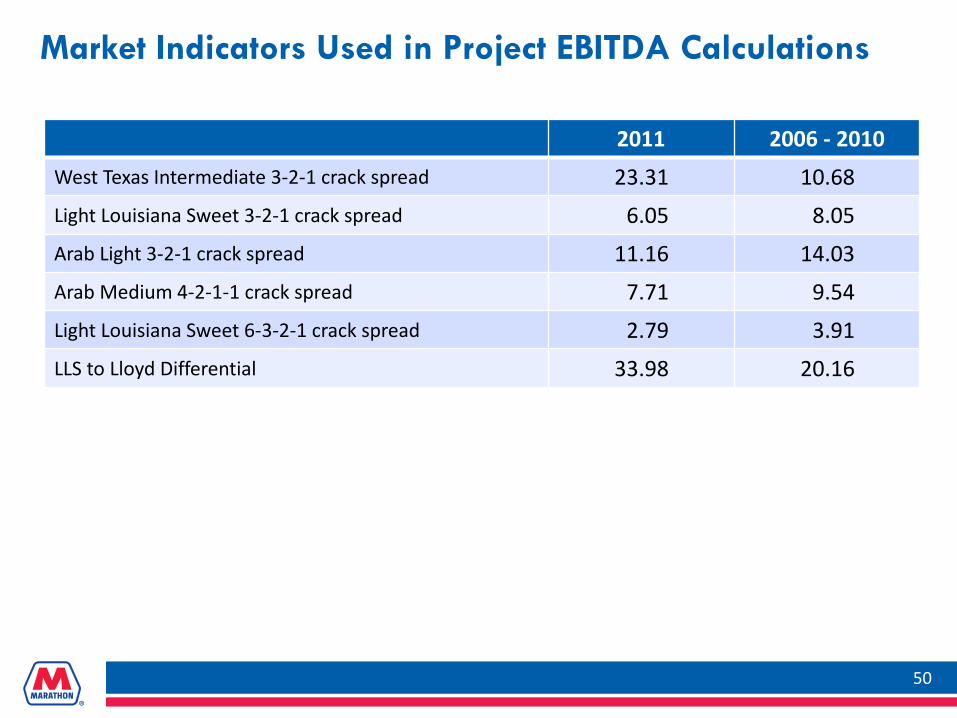
Market Indicators Used in Project EBITDA Calculations
2011 2006 - 2010 West Texas Intermediate 3-2-1 crack spread 23.31 10.68 Light Louisiana Sweet 3-2-1 crack spread 6.05 8.05 Arab Light 3-2-1 crack spread 11.16 14.03 Arab Medium 4-2-1-1 crack spread 7.71 9.54 Light Louisiana Sweet 6-3-2-1 crack spread 2.79 3.91 LLS to Lloyd Differential 33.98 20.16
50
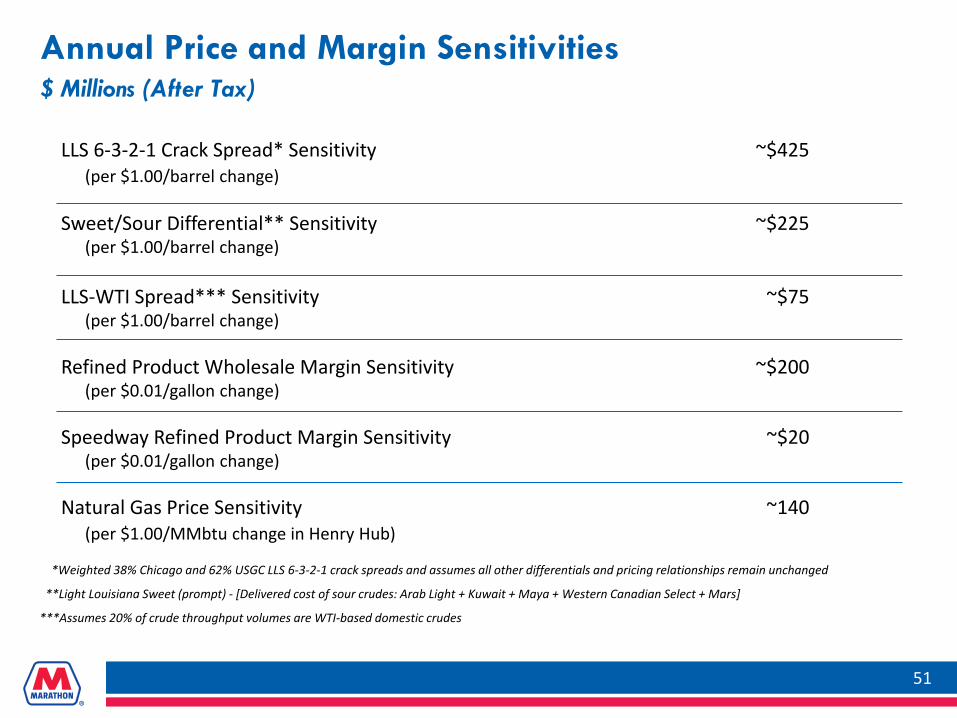
Annual Price and Margin Sensitivities $ Millions (After Tax)
51
LLS 6-3-2-1 Crack Spread* Sensitivity ~$425 (per $1.00/barrel change) Sweet/Sour Differential** Sensitivity ~$225 (per $1.00/barrel change) LLS-WTI Spread*** Sensitivity ~$75 (per $1.00/barrel change) Refined Product Wholesale Margin Sensitivity ~$200
(per $0.01/gallon change) Speedway Refined Product Margin Sensitivity ~$20
(per $0.01/gallon change) Natural Gas Price Sensitivity ~140 (per $1.00/MMbtu change in Henry Hub)
*Weighted 38% Chicago and 62% USGC LLS 6-3-2-1 crack spreads and assumes all other differentials and pricing relationships remain unchanged
**Light Louisiana Sweet (prompt) - [Delivered cost of sour crudes: Arab Light + Kuwait + Maya + Western Canadian Select + Mars]
***Assumes 20% of crude throughput volumes are WTI-based domestic crudes

Galveston Bay Complements MPC’s Integrated System
52
Refinery 451,000 BPCD (475,000 BPSD) refinery Nelson Complexity Index: 15.3 Significant recent investments Excellent crude optionality Substantial products logistics opportunities Advantageous petrochemical configuration
Cogen Facility 1040 megawatts of electrical capacity and 4.6 million
lbs/hr steam Supplies power and steam to the refinery
Light Product Terminals Nashville, TN Charlotte, NC Selma, NC Jacksonville, FL
Pipelines More than 100 miles of NGL pipelines consisting of
three intrastate systems originating at the refinery 50 MBPD gasoline shipper history on Colonial Pipeline
Retail Assignments ~61 MBPD of BP brand gasoline contracts ~1,200 locations
Connecting Pipelines
MPC Operations
Refinery Terminal Coastal Water Terminal
Inland Water Terminal
Refinery and Cogen
Light Product Terminals
Primary Retail Assignment Region
As of Feb. 1, 2013

Galveston Bay Asset Acquisition Projected Synergies and Capital Investments (Millions)
EBITDA Synergies of ~$440 MM thru 2017, ~$130 MM annually thereafter
Feedstock optimization
Florida and export optimization
Refinery processing opportunities
Total Synergy Investments of ~$170 MM
Dock upgrades
Storage tank additions and connectivity
53
Projected Synergy Capital Investments
$0
$40
$80
$120
$160
2013E 2014E 2015E 2016E
Projected Incremental Synergies EBITDA
$0
$40
$80
$120
$160
2013E 2014E 2015E 2016E 2017E+
Enhancing Earnings

Galveston Bay Projected Sustaining Capital*
54
0
100
200
300
400
500
2013E 2014E 2015E 2016E 2017E 2018E 2019E
$MM
Refinery All Other
*Excludes synergy and other value accretive investments

Galveston Bay Transaction Product Logistics Opportunities
55 55 55
Exports to Mexico/SA/Europe
Pasadena Zachary
Southeast Midwest
Florida
Flexible product placement
Domestic and export opportunities
Synergies with MPC’s Texas City and Garyville refineries and MPC logistics
Garyville
Texas City

Galveston Bay Marketing Assets and Integration
Integrated acquisition includes Assignment of branded-jobber contracts
representing ~1,200 BP retail sites ~61 MBPD of gasoline sales Locations primarily in FL, MS, TN and AL BP trademark to be used during
transition process
Strategic step in retail growth Nearly doubles branded site count in
Southeast Complementary to recent regional
growth Partnership opportunity with premier
Southeast jobbers Opportunity to expand relationship with
existing Marathon jobbers
56

Galveston Bay Assets Expected Accretive Transaction (MM unless otherwise indicated)
57
MPC Base EBITDA - analyst 2013 consensus estimates(1) $ 4,759 $ 4,759 Assets acquired EBITDA using 2006-2010 pricing(2)(4) 1,200 Assets acquired EBITDA using 2011 pricing(2)(5) 700 Total EBITDA $ 5,959 $ 5,459
Improvement 25% 15%
MPC Base Net Income - analyst 2013 consensus estimates $ 2,425 $ 2,425 Assets acquired Net Income using 2006-2010 pricing(2)(4) 650 Assets acquired Net Income using 2011 pricing(2)(5) 325
Total Net Income $ 3,075 $ 2,750
MPC Base EPS(3) $7.11 $7.11 MPC + Assets acquired EPS(3) $9.02 $8.06
Accretion 27% 13%
(1) Consensus estimates as of October 4, 2012 (2) Based on MPC 2013 operating estimates and applicable historical price information (3) Assumes 341 million shares outstanding (4) Argus Sour Crude Price Index (ASCI) 3-2-1 crack spread of $15.10 used as pricing metric for 2006-2010 (5) ASCI crack spread of $11.57 used as pricing metric for 2011

MPC 2Q 2013 Earnings*
Adjusted Earnings Adjusted Earnings per Diluted Share
1.70 2.17
2.53 1.95
3.31
2.26
$0$2$4$6$8
$10$12
2012 2013
$/Sh
are
58
2Q 2013 2Q 2012
Earnings $593 MM $814 MM
Adjusted Earnings $632 MM $867 MM
Earnings per Diluted Share $1.83 $2.38
Adjusted Earnings per Diluted Share $1.95 $2.53
596 725
867 632
1,129
760
$0
$1,000
$2,000
$3,000
$4,000
2012 2013
Mill
ions
1Q 2Q 3Q 4Q *References to Earnings refer to Net Income attributable to MPC
3,352 9.79

Adjusted Earnings* 2Q 2013 vs. 2Q 2012 Variance Analysis
59
867 (422)
16 8
169 (6) 632
$0
$100
$200
$300
$400
$500
$600
$700
$800
$900
$1,000
2Q 2012 Refining &Marketing
Speedway PipelineTransportation
IncomeTaxes
NoncontrollingInterests
2Q 2013
Mill
ions
*References to Earnings refer to Net Income attributable to MPC

Refining & Marketing Segment Income 2Q 2013 vs. 2Q 2012 Variance Analysis
60
1,325 (313)
640 (117) (101) (117)
(6) (381)
(27) 903
$0
$500
$1,000
$1,500
$2,000
$2,500
2Q 2012 *LLS6-3-2-1Crack
*Sweet/Sour Diff.
*LLS /WTISpread
*LLSPrompt vs.Delivered
*MarketStructure
DirectOperating
Costs
OtherGross
Margin
Other 2Q 2013
Mill
ions
*Based on market indicators using actual volumes

Speedway Segment Income 2Q 2013 vs. 2Q 2012 Variance Analysis
61
107
12 9 (5)
123
$0
$20
$40
$60
$80
$100
$120
$140
2Q 2012 Light Product GrossMargin
Merchandise GrossMargin
Other 2Q 2013
Mill
ions

Pipeline Transportation Segment Income 2Q 2013 vs. 2Q 2012 Variance Analysis
62
50
28 (6) (14)
58
$0
$20
$40
$60
$80
2Q 2012 Trans.Revenue
Depreciation OperatingExpenses
2Q 2013
Mill
ions
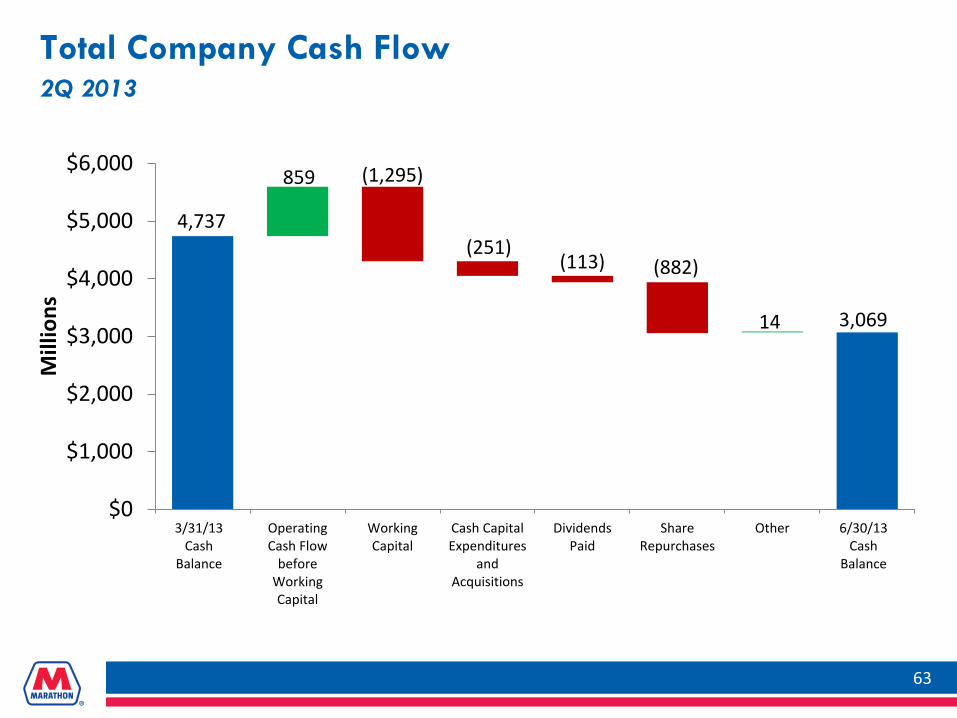
Total Company Cash Flow 2Q 2013
63
4,737
859 (1,295)
(251) (113) (882)
14 3,069
$0
$1,000
$2,000
$3,000
$4,000
$5,000
$6,000
3/31/13Cash
Balance
OperatingCash Flow
beforeWorkingCapital
WorkingCapital
Cash CapitalExpenditures
andAcquisitions
DividendsPaid
ShareRepurchases
Other 6/30/13Cash
Balance
Mill
ions

Select Balance Sheet/Cash Flow Data
($MM) 2013 2013 2012 2012 2Q 1Q 4Q 3Q
As of quarter ended:
Cash and cash equivalents 3,069 4,737 4,860 3,387
Total debt 3,410 3,416 3,361 3,349
Equity 12,197 12,412 12,105 11,467
Debt-to-total-capital ratio 22% 22% 22% 23%
Last Twelve Months (LTM) EBITDA 6,318 6,599 6,342 4,942
Debt to LTM EBITDA 0.5x 0.5x 0.5x 0.7x
Quarter to date:
Cash provided by (used in) operations (436) 2,079 2,043 1,833
Cash provided by operations before changes in working capital 859 1,046 1,124 1,320
64

3Q 2013 Outlook
Projected 3Q 2013
3Q 2012
Crude throughput 1.65 MMBD 1.19 MMBD
Total throughput 1.85 MMBD 1.35 MMBD
Percent of WTI-priced crude 22% 26%
Refinery direct operating costs in Refining & Marketing gross margin*:
Turnaround and major maintenance $1.15 $1.18
Depreciation & amortization 1.30 1.44
Other manufacturing cost** 4.15 3.16
Total $6.60 $5.78
Corporate and other unallocated items $75 million $74 million
65
*Per barrel of total throughput
**Includes utilities, labor, routine maintenance and other operating costs

Reconciliation Earnings to Adjusted Earnings*
66
($MM) 2012 2013
1Q 2Q 3Q 4Q 1Q 2Q
Earnings 596 814 1,224 755 725 593
Pension settlement expenses** 53 22 5 39
MN asset sale settlement gain** (117)
Adjusted Earnings 596 867 1,129 760 725 632
*References to Earnings refer to Net Income attributable to MPC **Net of tax

Reconciliation
67
($MM) 2012 2013 (Quarter to date) 3Q 4Q 1Q 2Q
Net cash provided by (used in) operating activities 1,833 2,043 2,079 (436)
Additions to property, plant and equipment (331) (403) (195) (229)
Acquisitions* (27) - (1,493) (22)
Free cash flow 1,475 1,640 391 (687)
Last twelve months free cash flow 2,819
Free Cash Flow to Net Cash Provided from Operations
*Represents cash paid

Income
68
($MM unless otherwise noted) 2012 2013 1Q 2Q 3Q 4Q 1Q 2Q
Refining & Marketing segment income
Speedway segment income
Pipeline Transportation segment income
943
50
42
1,325
107
50
1,691
76
52
1,139
77
72
1,105
67
51
903
123
58
Corporate and other unallocated items (79) (92) (74) (91) (67) (64)
Pension settlement expenses - (83) (33) (8) - (60)
MN asset sale settlement gain - - 183 - - -
Income from operations 956
(22)
1,307
(17)
1,895
(25)
1,189
(45)
1,156
(48)
960
(45) Net interest and other financing income (costs)
Income before income taxes 934 1,290 1,870 1,144 1,108 915
Income tax provision 338 476 646 385 378 316
Net income 596 814 1,224 759 730 599
Less net income attributable to noncontrolling interests - - - 4 5 6
Net income attributable to MPC 596 814 1,224 755 725 593
Effective tax rate 36% 37% 35% 34% 34% 35%

EBITDA Reconciliation to Net Income (Loss) Attributable to MPC
69
($MM) 2009 2010 2011 2012 2013
1Q 2Q 3Q 4Q 1Q 2Q 3Q 4Q 1Q 2Q Net Income (Loss) attributable to MPC 449 623 529 802 1,133 (75) 596 814 1,224 755 725 593
Less: Related party net interest and other financial income 45 24 17 18 - - - - 1 - - -
Less: Net interest and other financial income (costs) (14) (12) (14) (10) (15) (22) (22) (17) (26) (45) (48) (45)
Add: Net income attributable to noncontrolling interest - - - - - - - - - 4 5 6
Add: Provision (benefit) for income taxes 236 400 293 531 611 (105) 338 476 646 385 378 316
Add: Depreciation and amortization 670 941 216 218 227 230 230 236 246 283 287 302
EBITDA 1,324 1,952 1,035 1,543 1,986 72 1,186 1,543 2,141 1,472 1,443 1,262
Last Twelve Months EBITDA 4,636 4,787 4,787 4,942 6,342 6,599 6,318

Cash Provided from Operations Before Changes in Working Capital Reconciliation to Cash Provided by (Used in) Operations
70
($MM) 2012 2013
(Quarter to date) 3Q 4Q 1Q 2Q
Net cash provided by (used in) operations 1,833 2,043 2,079 (436)
Less changes in working capital:
Changes in current receivables (393) 491 (884) (655)
Changes in inventories 142 440 (517) 62
Changes in current accounts payable and accrued liabilities 862 (63) 2,491 (702)
Changes in the fair value of derivative instruments (98) 51 (57) --
Total changes in working capital 513 919 1,033 (1,295)
Cash provided from operations before changes in working capital 1,320 1,124 1,046 859

Capital Expenditures & Investments*
71
($MM) 2013 Budget 2Q 2013 2013 YTD
Refining & Marketing 1,016 134 257
Speedway 255 76 112
Pipeline Transportation 184 41 61
Corporate and Other 160 28 52
Subtotal 1,615 279 482
Capitalized Interest 43 4 8
Total Capital Expenditures & Investments 1,658 283 490
*Excludes $1.37 billion in capital expenditures and investments attributable to the acquisition of the Galveston Bay refinery and related assets

MPC Crude Slate
72
21 23 25 26 27 29 30 28 26 25 22 22
48 56 52 52 49 48 45 50 52 55
52 48
31 21 23 22 24 23 25 22 22 20 26 30
0%
10%
20%
30%
40%
50%
60%
70%
80%
90%
100%
3Q10 4Q10 1Q11 2Q11 3Q11 4Q11 1Q12 2Q12 3Q12 4Q12 1Q13 2Q13
Other Sweet
Other Sour
WTI Based
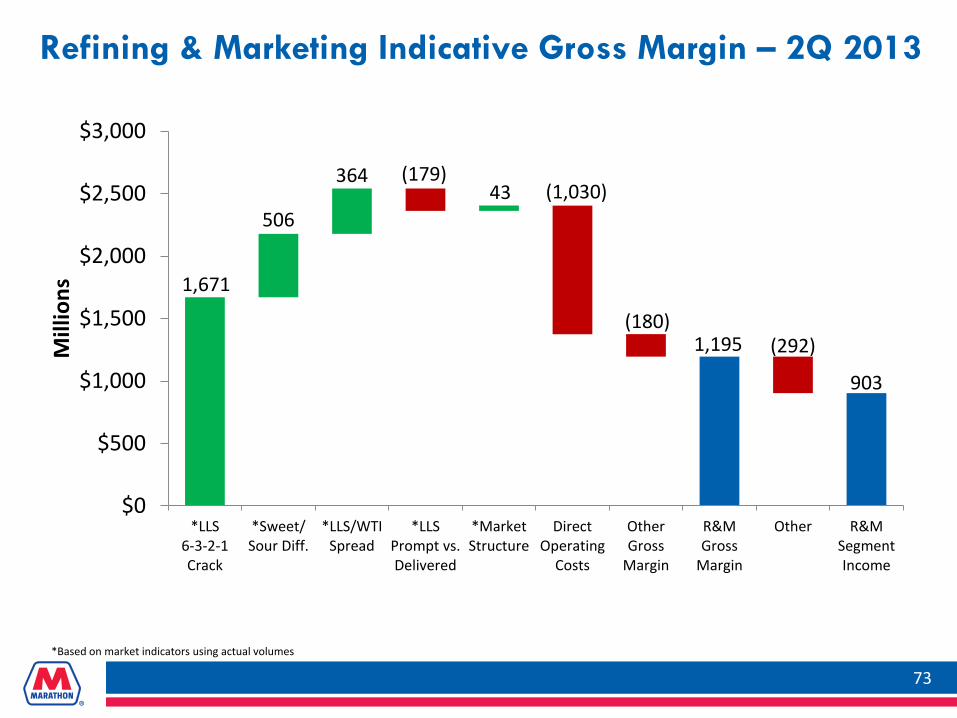
Refining & Marketing Indicative Gross Margin – 2Q 2013
73 *Based on market indicators using actual volumes
1,671
506
364 (179) 43 (1,030)
(180) 1,195 (292)
903
$0
$500
$1,000
$1,500
$2,000
$2,500
$3,000
*LLS6-3-2-1Crack
*Sweet/Sour Diff.
*LLS/WTISpread
*LLSPrompt vs.Delivered
*MarketStructure
DirectOperating
Costs
OtherGross
Margin
R&MGross
Margin
Other R&MSegmentIncome
Mill
ions
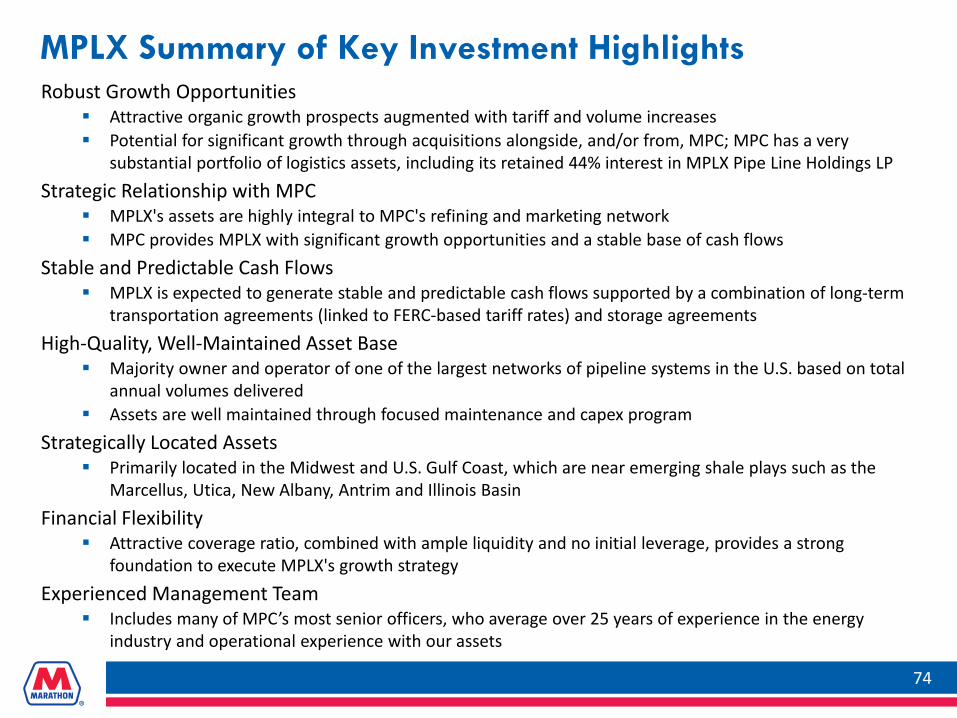
Robust Growth Opportunities Attractive organic growth prospects augmented with tariff and volume increases Potential for significant growth through acquisitions alongside, and/or from, MPC; MPC has a very
substantial portfolio of logistics assets, including its retained 44% interest in MPLX Pipe Line Holdings LP Strategic Relationship with MPC
MPLX's assets are highly integral to MPC's refining and marketing network MPC provides MPLX with significant growth opportunities and a stable base of cash flows
Stable and Predictable Cash Flows MPLX is expected to generate stable and predictable cash flows supported by a combination of long-term
transportation agreements (linked to FERC-based tariff rates) and storage agreements High-Quality, Well-Maintained Asset Base
Majority owner and operator of one of the largest networks of pipeline systems in the U.S. based on total annual volumes delivered
Assets are well maintained through focused maintenance and capex program Strategically Located Assets
Primarily located in the Midwest and U.S. Gulf Coast, which are near emerging shale plays such as the Marcellus, Utica, New Albany, Antrim and Illinois Basin
Financial Flexibility Attractive coverage ratio, combined with ample liquidity and no initial leverage, provides a strong
foundation to execute MPLX's growth strategy Experienced Management Team
Includes many of MPC’s most senior officers, who average over 25 years of experience in the energy industry and operational experience with our assets
MPLX Summary of Key Investment Highlights
74

MPLX Offering Summary
75
Issuer MPLX LP
Sponsor Marathon Petroleum Corporation
Exchange / Ticker NYSE / MPLX
Estimated Distribution Coverage 1.10x
Expected Tax Shield 80% for the period from the IPO until December 31, 2015
Use of Net Proceeds
$203 million to MPC $192 million to pre-fund certain expansion capital expenditures $10 million to MPLX for general partnership needs $33 million for underwriting discounts, financing costs and other
formation costs
Initial Offering Upsized Final Offering
Common Units Offered (with shoe) 15.0 million (17.3 million) 17.3 million (19.9 million)
Proposed Valuation Range Yield based on $1.05 annualized MQD
$19.00 - $21.00 per unit 5.00% - 5.53%
$22.00 per unit 4.77%
Offering Size (Base Offering Before Overallotment) $285 – $315 million $381 million
Offering Size (After Overallotment Exercised) $328 – $362 million $438 million
Creating Value

MPC has Created an Industry-Leading MLP
76
Focus on Fee-Based Businesses
Generate stable cash flows by providing primarily fee-based midstream services to MPC and third parties
Mitigate volatility in cash flows by entering into long-term transportation and storage agreements and by minimizing direct exposure to commodity prices
Pursue Organic Growth Opportunities
Increase pipeline systems revenue by developing organic investment opportunities through growth in: MPC’s operations Third-party activity
Grow Through Acquisitions and
Drop-downs
Acquire complementary assets from third parties, within current geographic footprint, as well as new areas
May also pursue acquisitions cooperatively with MPC
Significant drop-down potential from MPC
Maintain Safe and Reliable Operations
Provide safe, reliable and efficient services – another key to stable cash flows
Committed to maintaining and improving the reliability and efficiency of operations
MPLX’s Primary Business Strategies
Creating Value
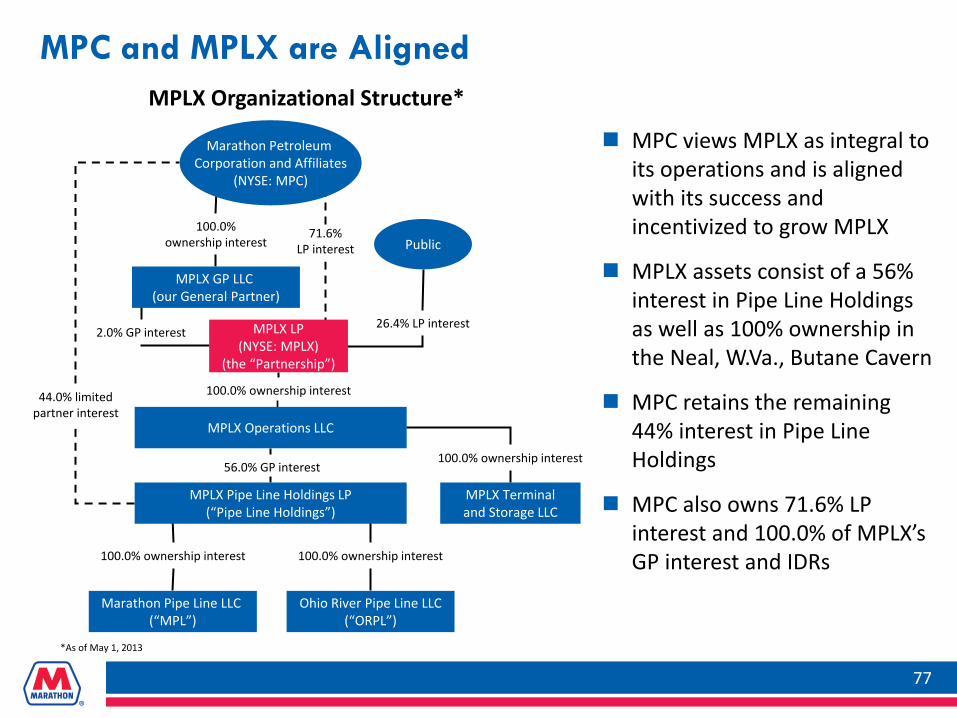
MPC views MPLX as integral to its operations and is aligned with its success and incentivized to grow MPLX
MPLX assets consist of a 56% interest in Pipe Line Holdings as well as 100% ownership in the Neal, W.Va., Butane Cavern
MPC retains the remaining 44% interest in Pipe Line Holdings
MPC also owns 71.6% LP interest and 100.0% of MPLX’s GP interest and IDRs
44.0% limited partner interest
100.0% ownership interest
100.0% ownership interest
MPLX Operations LLC
r
MPLX Terminal and Storage LLC
100.0% ownership interest Public
100.0% ownership interest
2.0% GP interest 26.4% LP interest
Marathon Pipe Line LLC (“MPL”)
56.0% GP interest
Ohio River Pipe Line LLC (“ORPL”)
MPLX GP LLC (our General Partner)
71.6% LP interest
100.0% ownership interest
MPLX LP (NYSE: MPLX)
(the “Partnership”)
MPLX Pipe Line Holdings LP (“Pipe Line Holdings”)
Marathon Petroleum Corporation and Affiliates
(NYSE: MPC)
MPLX Organizational Structure*
MPC and MPLX are Aligned
77
*As of May 1, 2013

Marathon Pipe Line LLC and Ohio River Pipe Line LLC comprise one of the largest networks of pipeline systems in the U.S. based on total volume delivered 1,004 miles of common carrier
crude oil pipelines 1,902 miles of common carrier
products pipelines Inclusive of 230 miles of long-
term leased and operated pipelines
The ~1 million barrel Neal, W.Va., butane storage cavern adjacent to MPC’s Catlettsburg refinery is wholly owned and operated by MPLX
MPLX’s Assets are Integral to MPC
78
As of Feb. 1, 2013

Owned and operated terminals: 65 light product and 20 asphalt 271 transport loading racks
Logistics infrastructure is extremely important to MPC's success.
MPC intends to use MPLX as the primary growth vehicle for its midstream logistics business.
MPLX can pursue acquisitions directly from MPC.
MPLX can pursue third-party acquisitions independently and/or in cooperation with MPC.
MPC Midstream Assets
Remaining 44% interest in MPLX's pipeline assets Over 5,000 miles of additional crude and products pipelines
Owns, leases or has an ownership interest in these pipelines
146 owned transport trucks ~ 1,970 owned or leased railcars
One of the largest private inland bulk liquid barge fleets in the U.S. consisting of 15 owned inland waterway towboats, and 177 owned and 14 leased barges
MPC Relationship Provides Robust Growth Opportunities for MPLX
79

Annual distribution growth is targeted at 15% to 20% for at least the next several years
MPLX could enter the 50% high IDR tier in 2015
2014-2016 ~$700 million to ~$1.2 billion of capital investment required to hit targeted distribution growth
80
MPLX Distribution Growth
Additional EBITDA required for target distribution growth 2014 - ~$20-$35 million 2015 - ~$25-$50 million 2016 - ~$30-$75 million
Drop-Downs
Acquisitions
Organic Growth

MPLX’s assets consist of fee-based pipeline systems and storage assets
MPC has historically accounted for over 85% of the volumes shipped on MPLX’s pipelines
MPC has entered into multiple long-term transportation and storage agreements with MPLX Terms of up to 10 years Pipeline tariffs linked to FERC-based rates Indexed storage fees
2013 EBITDA estimate represents a ~60% increase over 2011 pro forma EBITDA Increase underpinned by FERC-based tariffs
and volume growth Capital projects pre-funded and supported
by MPC
Revenue – Product / Asset Mix1
Notes: 1 Estimate for the twelve months ending December 31, 2013 from Prospectus dated October 25, 2012 2 Includes revenues generated under Transportation and Storage agreements with MPC 3 Volumes shipped under joint tariff agreements are accounted for as third party for GAAP purposes, but represent MPC barrels shipped
Revenue – Customer Mix1
MPC = 89%
MPLX Stable and Predictable Cash Flows
81
73%
16%
11%
MPC Committed² ³ MPC Additional³ Third Party
$364 MM
$81 MM
$55 MM
46%
43%
4% 3%
4%
Crude Transportation Products Transportation Tank Storage Cavern Storage Operating and Mgmt. Fees
$232 MM
$216 MM

Historical crude and product volumes have been extremely stable with low variability despite material changes in the broader commodity price environment.
Butane cavern and storage facilities generate stable and ratable (capacity based) fees.
Throughput and storage agreements with MPC provide cash flow visibility and predictability.
Throughput (MBPD)
Crude Products % MPC 82% 85% 83% 82% 79% % MPC 91% 90% 93% 94%
MPC Throughput Third-party Throughput
MPLX - Ideal Assets for an MLP
82
873 856 904 971 909 899
960 953 968 1,031 980
0
200
400
600
800
1,000
1,200
2008 2009 2010 2011 2012 6 Mo YTD2013
939
697 676 732 811 827 853
850 798
883 993 1,029
0
200
400
600
800
1,000
1,200
2008 2009 2010 2011 2012 6 Mo YTD2013
1,075
80% 93% 96%

Source: MPC
Assets are primarily located throughout the Midwest and U.S. Gulf Coast
In 2011, these regions collectively comprised ~70% of total U.S. crude distillation capacity and ~50% of finished products demand
Existing and new capability to transport Canadian crude
Marathon Petroleum Corporation 646
BP2 468
Phillips 663 346
Flint Hills Resources (Koch) 304
Valero 287
HollyFrontier 258
ExxonMobil 238
Husky Energy2 238
Notes: 1 Refiners with PADD II capacities of less than 200 MBPCD excluded from list; aggregate additional
capacity of ~955 MBPCD 2 Includes 50% share of BP / Husky Toledo’s total capacity 3 Includes 50% share of Wood River’s total capacity
*Source: Oil & Gas Journal as of 1/1/2013
PADD II Refining Capacity* (MBPCD)1
MPC has the Largest Refining Capacity in PADD II
MPLX Strategically Located Assets
83
MPC Refineries
Pegasus Planned Keystone XL & GC Keystone
Spearhead Planned Seaway Expansion Planned Ho-Ho Reversal Planned Gulf Coast Access Planned ETP Planned SAX Planned Line 9 Reversal
Source: MPC

MPLX’s assets and a large number of MPC's retained assets are in the “heart” of the Midwest infrastructure build-out
Strategically located near emerging shale plays
Marcellus, Utica, New Albany, Antrim, and Illinois Basin in Pennsylvania, Ohio, Indiana, Michigan, and Illinois
MPC is currently transporting crude oil and feedstocks from the Utica play
MPLX is continuing to evaluate growth opportunities in the Utica and other shale plays
Source: EIA
Current Plays
Prospective Plays
Basins
Shale Plays
Shallowest / Youngest
Intermediate Depth / Age
Deepest / Oldest
Stacked Plays
MPC Refineries
MPLX Strategically Located Assets (Continued)
84
Bakken
Ardmore Basin
Anadarko Basin
Barnett
Pearsall
Eagle Ford
Haynesville- Bossier
Ft. Worth Basin
TX-LA-MS Salt Basin
Tuscaloosa
Floyd-Neal
Woodford
Arkoma Basin
Fayetteville
Cherokee Platform
Excello-Mulky
Williston Basin
Forest City Basin
Illinois Basin
Michigan Basin
Antrim
Appalachian Basin
New Albany
Chattanooga
Black Warrior Basin Conasauga
Valley & Ridge Province
Devonian (Ohio)
Marcellus
Utica
Western Gulf
Mississ- ippian Lime

MPLX continually invests in the maintenance and integrity of its assets
Uses a patented integrity management program to enhance pipeline safety and reliability
Top-tier reputation and active industry involvement
2013 Capex Budget1, 2 Certifications, Initiatives and Industry Partnerships
Note: 1 Capex budget represents both MPC and MPLX portions of capital budget 2 Excludes $100 million acquisition of additional 5% interest in MPLX Pipe Line Holdings LP
Quality Assets and Top-tier Reputation
(16% of 2013E EBITDA) (16% of 2013E EBITDA)
MPLX High-Quality, Well-Maintained Asset Base
85
Expansion $109 MM
Maintenance $33 MM
(~17% of 2013E EBITDA)

MPLX Operations Deliver Top Tier Safety Performance Patented integrity
management program fully compliant with DOT regulations
State of the art in-line assessment practices
Leading control room management practices
Industry leader in helping to improve Damage Prevention practices
86

MPLX Financial Performance
87
$ in millions $ / unit
Distribution Coverage 1.37x 1.25x
$18.2
$25.1 $26.7
4Q'12 1Q'13 2Q'13
Adjusted EBITDA*
$0.2625**
$0.2725
$0.2850
4Q'12 1Q'13 2Q'13
Distribution / Unit*
3.8% Growth
$16.7
$28.0 $27.2
4Q'12 1Q'13 2Q'13
Distributable Cash Flow* $ in millions
$13.1
$17.6 $18.6
4Q'12 1Q'13 2Q'13
Net Income* $ in millions
4.5% Growth
1.27x
**Represents Minimum Quarter Distribution (MQD) for 4Q ’12, actual $0.1769 equal to MQD prorated Note: 4Q ’12 is for 10/31/2012 to 12/31/2012, not a full quarter
*Attributable to MPLX
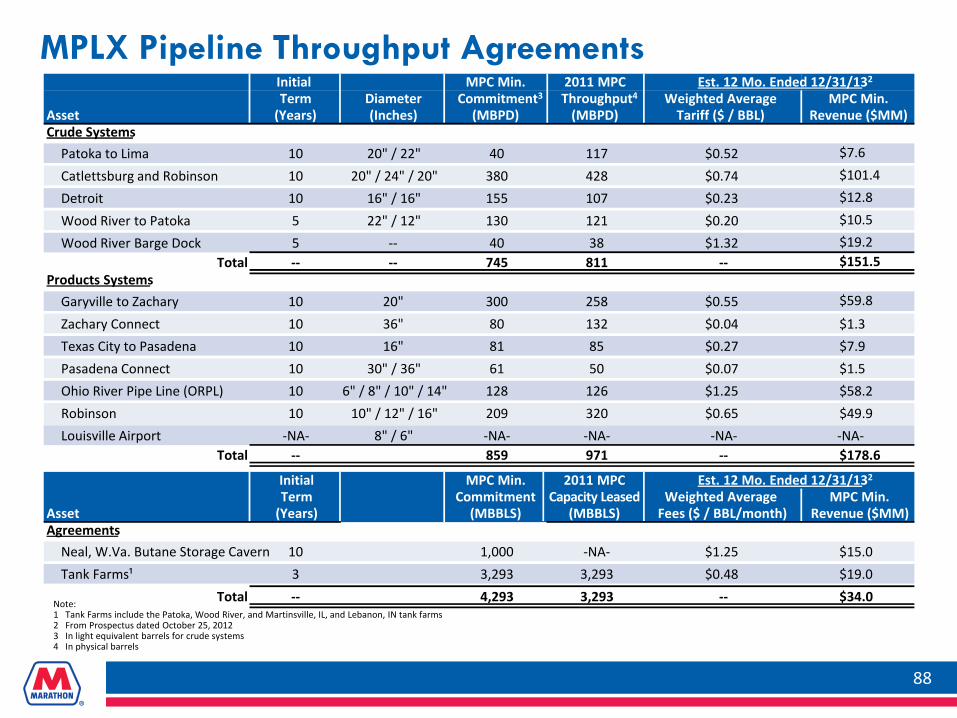
Note: 1 Tank Farms include the Patoka, Wood River, and Martinsville, IL, and Lebanon, IN tank farms 2 From Prospectus dated October 25, 2012 3 In light equivalent barrels for crude systems 4 In physical barrels
MPLX Pipeline Throughput Agreements
88
Initial MPC Min. 2011 MPC Est. 12 Mo. Ended 12/31/132 Term Diameter Commitment3 Throughput4 Weighted Average MPC Min.
Asset (Years) (Inches) (MBPD) (MBPD) Tariff ($ / BBL) Revenue ($MM) Crude Systems
Patoka to Lima 10 20" / 22" 40 117 $0.52 $7.6 Catlettsburg and Robinson 10 20" / 24" / 20" 380 428 $0.74 $101.4 Detroit 10 16" / 16" 155 107 $0.23 $12.8 Wood River to Patoka 5 22" / 12" 130 121 $0.20 $10.5 Wood River Barge Dock 5 -- 40 38 $1.32 $19.2
Total -- -- 745 811 -- $151.5 Products Systems
Garyville to Zachary 10 20" 300 258 $0.55 $59.8 Zachary Connect 10 36" 80 132 $0.04 $1.3 Texas City to Pasadena 10 16" 81 85 $0.27 $7.9 Pasadena Connect 10 30" / 36" 61 50 $0.07 $1.5 Ohio River Pipe Line (ORPL) 10 6" / 8" / 10" / 14" 128 126 $1.25 $58.2 Robinson 10 10" / 12" / 16" 209 320 $0.65 $49.9 Louisville Airport -NA- 8" / 6" -NA- -NA- -NA- -NA-
Total -- 859 971 -- $178.6
Initial MPC Min. 2011 MPC Est. 12 Mo. Ended 12/31/132
Term Commitment Capacity Leased Weighted Average MPC Min. Asset (Years) (MBBLS) (MBBLS) Fees ($ / BBL/month) Revenue ($MM) Agreements
Neal, W.Va. Butane Storage Cavern 10 1,000 -NA- $1.25 $15.0 Tank Farms¹ 3 3,293 3,293 $0.48 $19.0
Total -- 4,293 3,293 -- $34.0

Management team includes MPC executive officers with an average 25 years of experience with MPLX's assets
Position at MPC Position at MPLX Industry
Garry L. Peiffer Executive VP, Corporate Planning and Investor & Government Relations
Director and President 38 38
Donald C. Templin Senior VP and Chief Financial Officer
Director, VP and Chief Financial Officer
11 1
J. Michael Wilder VP, General Counsel and Secretary VP, General Counsel and Secretary 34 34
With MPC
Gary R. Heminger President and Chief Executive Officer
Chairman of the Board and Chief Executive Officer
37 37
Years Experience
31 31 Senior VP, Transportation and Logistics
VP and Chief Operating Officer George P. Shaffner
Craig O. Pierson President, Marathon Pipe Line LLC VP, Operations 34 34
Timothy T. Griffith VP, Finance and Treasurer VP and Treasurer 1 1
Michael G. Braddock VP and Controller 32 32 VP and Controller
Pamela K. M. Beall
16
16 VP, Investor Relations and Government & Public Affairs
VP, Investor Relations
Experienced MPLX Management Team
89
John R. Haley VP, Tax VP, Tax 31 31
As of 1/1/2013

MPLX Net Income 2Q 2013 vs. 2Q 2013 Estimated per S-1 Variance Analysis
38.6 4.0 (5.7)
1.5 (0.6) (3.0) 34.8 (16.2)
18.6
$0
$5
$10
$15
$20
$25
$30
$35
$40
$45
2Q 2013Estimateper S-1
Tariffs Volumes Other Revenueand Income
Cost ofRevenues andRelated Party
Purchases
Other 2Q 2013 MPC RetainedInterest
2Q 2013Attributable to
MPLX
Mill
ions
90

MPLX Adjusted EBITDA and Distributable Cash Flow
91
($MM) 2Q 2013 Estimated 2Q 2013*
Adjusted EBITDA 47.4 49.7
Less: Adjusted EBITDA attributable to MPC-retained interest 20.7 23.2
Adjusted EBITDA attributable to MPLX LP 26.7 26.5
Less: Cash interest paid, net - 0.3
Income taxes paid - -
Maintenance capital expenditures paid 2.3 3.4
Plus: Increase in deferred revenue for committed volume deficiencies 2.8 -
Distributable cash flow 27.2 22.8
Distribution declared
Limited partners – public 5.7
Limited partners – MPC 15.4
General partner – MPC 0.4
Total distribution declared/estimated 21.5 19.8
Coverage ratio 1.27x 1.15x
*Based on information in Prospectus

MPLX LP Adjusted EBITDA and Distributable Cash Flow Reconciliation to Net Income
92
($MM) 2Q 2013 1Q 2013 4Q 2012* Net income 34.8 35.3 26.3
Less: Net income attributable to MPC-retained interest 16.2 17.7 13.2
Net income attributable to MPLX LP 18.6 17.6 13.1
Plus: Net income attributable to MPC-retained interest 16.2 17.7 13.2
Depreciation 11.9 11.7 7.9
Provision for income taxes 0.1 - 0.1
Non-cash equity-based compensation 0.3 0.2 0.1
Net interest and other financial costs (income) 0.3 0.2 0.2
Adjusted EBITDA 47.4 47.4 34.6
Less: Adjusted EBITDA attributable to MPC-retained interest 20.7 22.3 16.4
Adjusted EBITDA attributable to MPLX LP 26.7 25.1 18.2
Less: Cash interest paid - 0.2 0.2
Income taxes paid - - -
Maintenance capital expenditures paid 2.3 1.5 3.4
Plus: Increase in deferred revenue for committed volume deficiencies 2.8 4.6 2.1
Distributable cash flow attributable to MPLX LP 27.2 28.0 16.7 *For the period 10/31/12 to 12/31/12
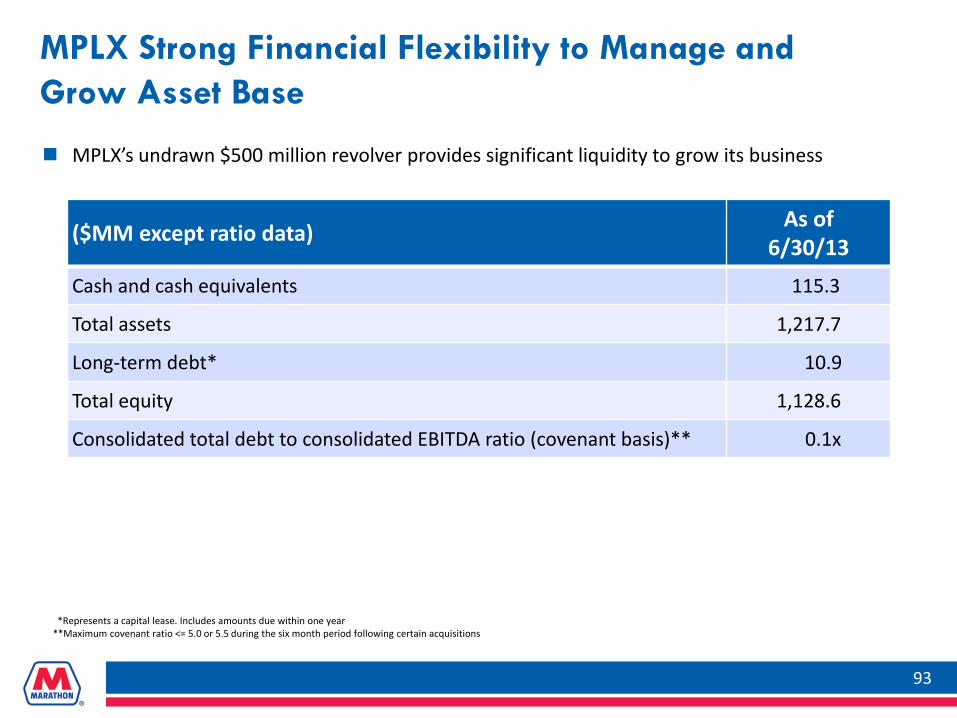
MPLX Strong Financial Flexibility to Manage and Grow Asset Base
93
($MM except ratio data) As of 6/30/13
Cash and cash equivalents 115.3
Total assets 1,217.7
Long-term debt* 10.9
Total equity 1,128.6
Consolidated total debt to consolidated EBITDA ratio (covenant basis)** 0.1x
MPLX’s undrawn $500 million revolver provides significant liquidity to grow its business
*Represents a capital lease. Includes amounts due within one year **Maximum covenant ratio <= 5.0 or 5.5 during the six month period following certain acquisitions


![LinkedIn Profile Tips That Really Work [28,000+ Connections]](https://img.pdfslide.us/doc/110x75/5442f6c0afaf9f0e118b47c7/linkedin-profile-tips-that-really-work-28000-connections.jpg)