Embed Size (px)
Citation preview
Investor PresentationJanuary 2018 TSX: CG
www.centerragold.com
Caution Regarding Forward-Looking Information
2
Information contained in this presentation which are not statements of historical facts, and the documents incorporated by reference herein, may be “forward-looking information” for the purposes of Canadian securitieslaws. Such forward-looking information involves risks, uncertainties and other factors that could cause actual results, performance, prospects and opportunities to differ materially from those expressed or implied by suchforward looking information. The words “believe”, “expect”, “anticipate”, “contemplate”, “plan”, “intends”, “continue”, “budget”, “estimate”, “may”, “will”, “schedule”, “understand” and similar expressions identify forward-looking information.
These forward-looking statements relate to, among other things: expectations regarding the assets of AMI, including pro forma financial and operational forecasts, and potential improvements to the Kemess property.Forward-looking information is necessarily based upon a number of estimates and assumptions that, while considered reasonable by Centerra, are inherently subject to significant political, business, economic andcompetitive uncertainties and contingencies. Known and unknown factors could cause actual results to differ materially from those projected in the forward looking information. Factors that could cause actual results orevents to differ materially from current expectations include, among other things: (A) changes in general economic, business and political conditions, including changes in the financial markets; changes in applicable laws;significant competition that Centerra and AMI face; (B) strategic, legal, planning and other risks, including: political risks associated with the Company’s operations in the Kyrgyz Republic and Canada; risks that any of theconditions precedent to the Strategic Agreement will not be satisfied in a timely manner or at all, particularly as the Government may not bind the General Prosecutor’s Office or the Parliament of the Kyrgyz Republic; adecision by the General Prosecutor’s Office, or its successor the Anti-Corruption Service of the State Committee for National Security, to re-open at any time civil or criminal proceedings against Centerra, its subsidiaries orother stakeholders; the failure of the Government to comply with its continuing obligations under the Strategic Agreement, including the requirement that it comply at all times with its obligations under the Kumtor ProjectAgreements, allow for the continued operation of the Kumtor Mine by KGC and KOC and not take any expropriatory action; actions by the Government or any state agency or the General Prosecutor's Office that serve torestrict or otherwise interfere with the payment of funds by KGC and KOC to Centerra; resource nationalism including the management of external stakeholder expectations; the impact of changes in, or to the moreaggressive enforcement of, laws, regulations and government practices, including with respect to the environment, in the jurisdictions in which the Company operates including any delays or refusals to grant requiredpermits and licenses, unjustified civil or criminal action against the Company, its affiliates or its current or former employees; risks that community activism may result in increased contributory demands or businessinterruptions; the impact of any actions taken by the Kyrgyz Republic Government and Parliament relating to the Kumtor Project Agreements which are inconsistent with the rights of Centerra and KGC under the KumtorProject Agreements; any impact on the purported cancellation of Kumtor’s land use rights at the Kumtor Project; the risks related to other outstanding litigation affecting the Company’s operations in the Kyrgyz Republicand elsewhere; the impact of the delay by relevant government agencies to provide required approvals, expertises and permits; potential impact on the Kumtor Project of investigations by Kyrgyz Republic instrumentalities;the terms pursuant to which the Mongolian Government will participate in, or to take a special royalty rate in, the Gatsuurt Project; the impact of constitutional changes in Turkey; the impact of any sanctions imposed byCanada, the United States or other jurisdictions against various Russian individuals and entities; the ability of the Company to successfully negotiate agreements for the development of the Gatsuurt Project; potentialdefects of title in the Company’s properties that are not known as of the date hereof; the inability of the Company and its subsidiaries to enforce their legal rights in certain circumstances; the presence of a significantshareholder that is a state-owned company of the Kyrgyz Republic; risks related to anti-corruption legislation; risks related to the concentration of assets in Central Asia; Centerra’s future exploration and developmentactivities not being successful; Centerra not being able to replace mineral reserves; Aboriginal claims and consultative issues relating to the Company’s properties which are in proximity to Aboriginal communities; andpotential risks related to kidnapping or acts of terrorism; (C) risks relating to financial matters, including: sensitivity of the Company’s business to the volatility of gold, copper and other mineral prices, the use ofprovisionally-priced sales contracts for production at Mount Milligan, reliance on a few key customers for the gold-copper concentrate at Mount Milligan, use of commodity derivatives, the imprecision of the Company’smineral reserves and resources estimates and the assumptions they rely on, the accuracy of the Company’s production and cost estimates, the impact of restrictive covenants in the Company’s credit facilities which may,among other things, restrict the Company from pursuing certain business activities or making distributions from its subsidiaries, the Company’s ability to obtain future financing, the impact of global financial conditions, theimpact of currency fluctuations, the effect of market conditions on the Company’s short-term investments, the Company’s ability to make payments including any payments of principal and interest on the Company’s debtfacilities depends on the cash flow of its subsidiaries; and (D) risks related to operational matters and geotechnical issues and the Company’s continued ability to successfully manage such matters, including the movementof the Davidov Glacier, waste and ice movement and continued performance of the buttress at the Kumtor Project; the occurrence of further ground movements at the Kumtor Project and mechanical availability; the abilityof the Company to successfully ramp-up to design criteria of the secondary crusher at Mount Milligan; the success of the Company’s future exploration and development activities, including the financial and political risksinherent in carrying out exploration activities; inherent risks associated with the use of sodium cyanide in the mining operations; the adequacy of the Company’s insurance to mitigate operational risks; mechanicalbreakdowns; the Company’s ability to replace its mineral reserves; the occurrence of any labour unrest or disturbance and the ability of the Company to successfully re-negotiate collective agreements when required; therisk that Centerra’s workforce may be exposed to widespread epidemic; seismic activity in the vicinity of the Company’s properties; long lead times required for equipment and supplies given the remote location of some ofthe Company’s operating properties; reliance on a limited number of suppliers for certain consumables, equipment and components; illegal mining on the Company’s Mongolian properties; the Company’s ability toaccurately predict decommissioning and reclamation costs; the Company’s ability to attract and retain qualified personnel; competition for mineral acquisition opportunities; and risks associated with the conduct of jointventures/partnerships; the Company’s ability to manage its projects effectively and to mitigate the potential lack of availability of contractors, budget and timing overruns and project resources. See section titled “Risks thatcan affect our business” in Centerra’s 2016 Annual Information Form available on SEDAR at www.sedar.com.
Furthermore, market price fluctuations in gold and copper, as well as increased capital or production costs or reduced recovery rates may render ore reserves containing lower grades of mineralization uneconomic and mayultimately result in a restatement of reserves. The extent to which resources may ultimately be reclassified as proven or probable reserves is dependent upon the demonstration of their profitable recovery. Economic andtechnological factors which may change over time always influence the evaluation of reserves or resources. Centerra has not adjusted mineral resource figures in consideration of these risks and, therefore, Centerra cangive no assurances that any mineral resource estimate will ultimately be reclassified as proven and probable reserves. There can be no assurances that forward-looking information will prove to be accurate, as many factorsand future events, both known and unknown could cause actual results, performance or achievements to vary or differ materially, from the results, performance or achievements that are or may be expressed or implied bysuch forward-looking statements contained herein or incorporated by reference. Accordingly, all such factors should be considered carefully when making decisions with respect to Centerra, and prospective investorsshould not place undue reliance on forward looking information. Forward-looking information is as of January 12, 2018. Centerra assumes no obligation to update or revise forward looking information to reflect changes inassumptions, changes in circumstances or any other events affecting such forward-looking information, except as required by applicable law. Except as otherwise noted herein, Gordon Reid, Professional Engineer andCenterra’s Vice President and Chief Operating Officer, has reviewed and approved the scientific and technical information contained in this presentation. Mr. Reid is a Qualified Person within the meaning of NI 43-101. Formore information, please refer to the properties technical reports, which are available on SEDAR. All figures are in United States dollars unless otherwise stated.January 2018
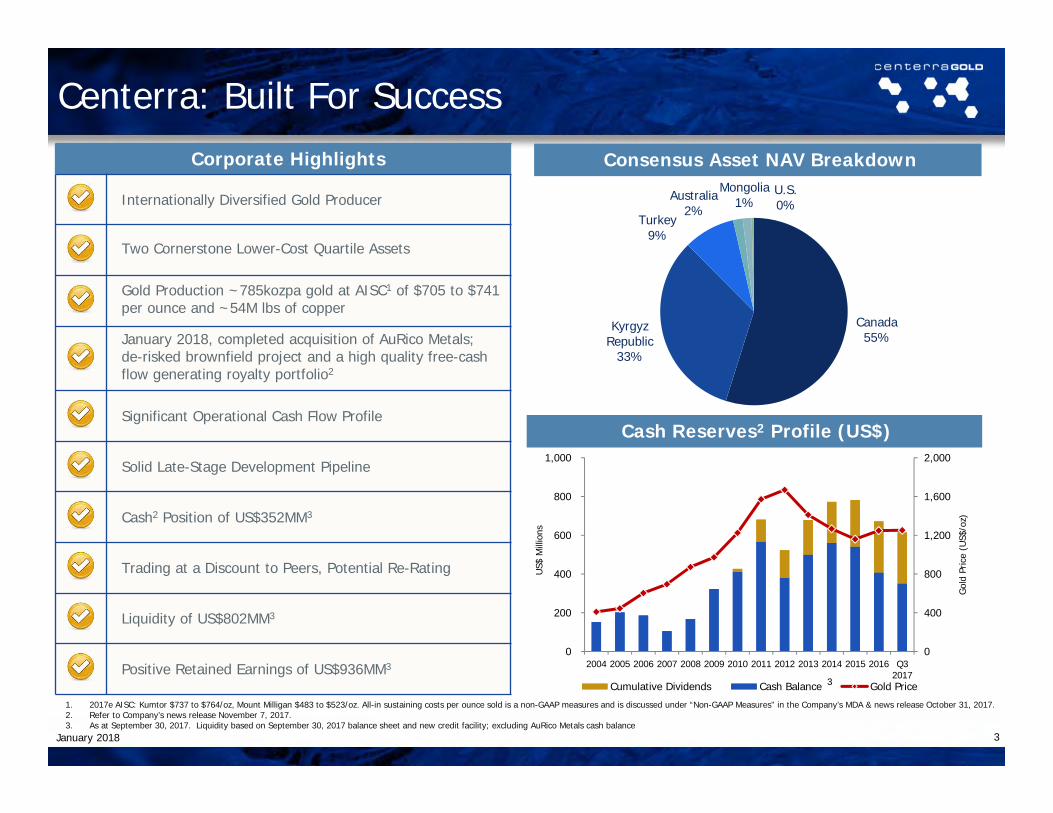
1. 2017e AISC: Kumtor $737 to $764/oz, Mount Milligan $483 to $523/oz. All-in sustaining costs per ounce sold is a non-GAAP measures and is discussed under “Non-GAAP Measures” in the Company’s MDA & news release October 31, 2017.2. Refer to Company’s news release November 7, 2017.3. As at September 30, 2017. Liquidity based on September 30, 2017 balance sheet and new credit facility; excluding AuRico Metals cash balance
Corporate Highlights
Internationally Diversified Gold Producer
Two Cornerstone Lower-Cost Quartile Assets
Gold Production ~785kozpa gold at AISC1 of $705 to $741 per ounce and ~54M lbs of copper
January 2018, completed acquisition of AuRico Metals;de-risked brownfield project and a high quality free-cash flow generating royalty portfolio2
Significant Operational Cash Flow Profile
Solid Late-Stage Development Pipeline
Cash2 Position of US$352MM3
Trading at a Discount to Peers, Potential Re-Rating
Liquidity of US$802MM3
Positive Retained Earnings of US$936MM3
3
Cash Reserves2 Profile (US$)
Consensus Asset NAV Breakdown
Centerra: Built For Success
0
400
800
1,200
1,600
2,000
0
200
400
600
800
1,000
2004 2005 2006 2007 2008 2009 2010 2011 2012 2013 2014 2015 2016 Q32017
Gol
d Pr
ice
(US$
/oz)
US$
Mill
ions
Cumulative Dividends Cash Balance Gold Price3
January 2018
Canada55%
Kyrgyz Republic
33%
Turkey9%
Australia2%
Mongolia1%
U.S.0%
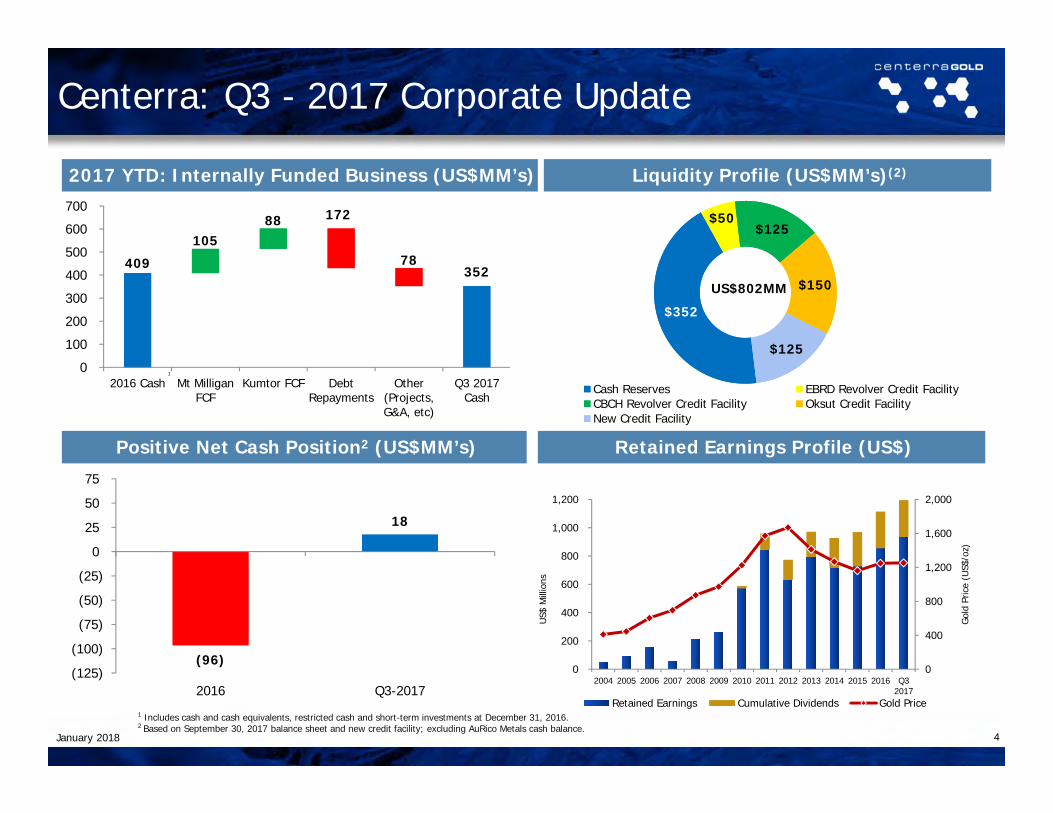
$352
$50 $125
$150
$125
Cash Reserves EBRD Revolver Credit FacilityCBCH Revolver Credit Facility Oksut Credit FacilityNew Credit Facility
US$802MM
4
Cash$542MM
Liquidity Profile (US$MM’s)(2)
Positive Net Cash Position2 (US$MM’s)
2017 YTD: Internally Funded Business (US$MM’s)
Retained Earnings Profile (US$)
0
400
800
1,200
1,600
2,000
0
200
400
600
800
1,000
1,200
2004 2005 2006 2007 2008 2009 2010 2011 2012 2013 2014 2015 2016 Q32017
Gol
d Pr
ice
(US$
/oz)
US$
Mill
ions
Retained Earnings Cumulative Dividends Gold Price
Centerra: Q3 - 2017 Corporate Update
409
105 88 172
78 352
0
100
200
300
400
500
600
700
2016 Cash Mt MilliganFCF
Kumtor FCF DebtRepayments
Other(Projects,G&A, etc)
Q3 2017Cash
(96)
18
(125)
(100)
(75)
(50)
(25)
0
25
50
75
2016 Q3-2017
1 Includes cash and cash equivalents, restricted cash and short-term investments at December 31, 2016.2 Based on September 30, 2017 balance sheet and new credit facility; excluding AuRico Metals cash balance.
January 2018
1
5
Mount Milligan
Kumtor
Royalty Portfolio
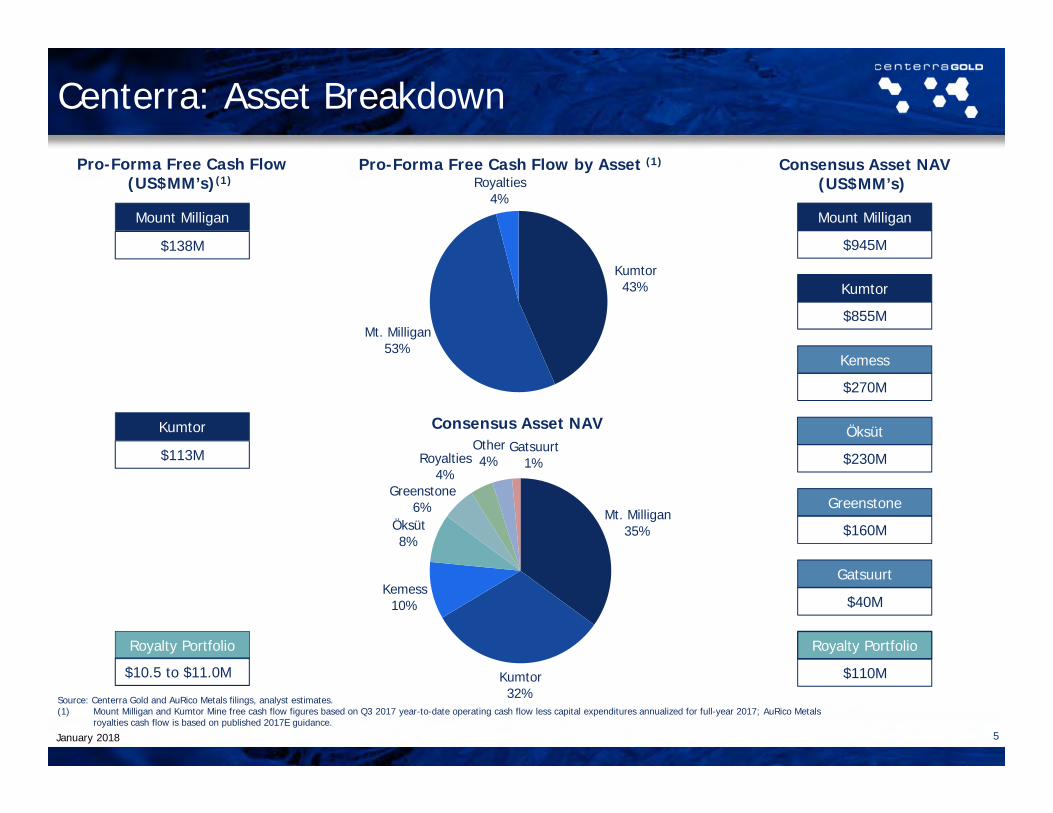
Pro-Forma Free Cash Flow(US$MM’s)(1)
Consensus Asset NAV(US$MM’s)
Mount Milligan
Kumtor
Öksüt
Gatsuurt
Greenstone
Royalty Portfolio
Kemess
Consensus Asset NAV
$138M
$113M
$10.5 to $11.0M
$945M
$855M
$230M
$160M
$270M
$110M
Mt. Milligan35%
Kumtor32%
Kemess10%
Öksüt8%
Greenstone6%
Royalties4%
Other4%
Gatsuurt1%
$40M
Pro-Forma Free Cash Flow by Asset (1)
Source: Centerra Gold and AuRico Metals filings, analyst estimates.(1) Mount Milligan and Kumtor Mine free cash flow figures based on Q3 2017 year-to-date operating cash flow less capital expenditures annualized for full-year 2017; AuRico Metals
royalties cash flow is based on published 2017E guidance.
Centerra: Asset Breakdown
Kumtor 43%
Mt. Milligan53%
Royalties4%
January 2018
6
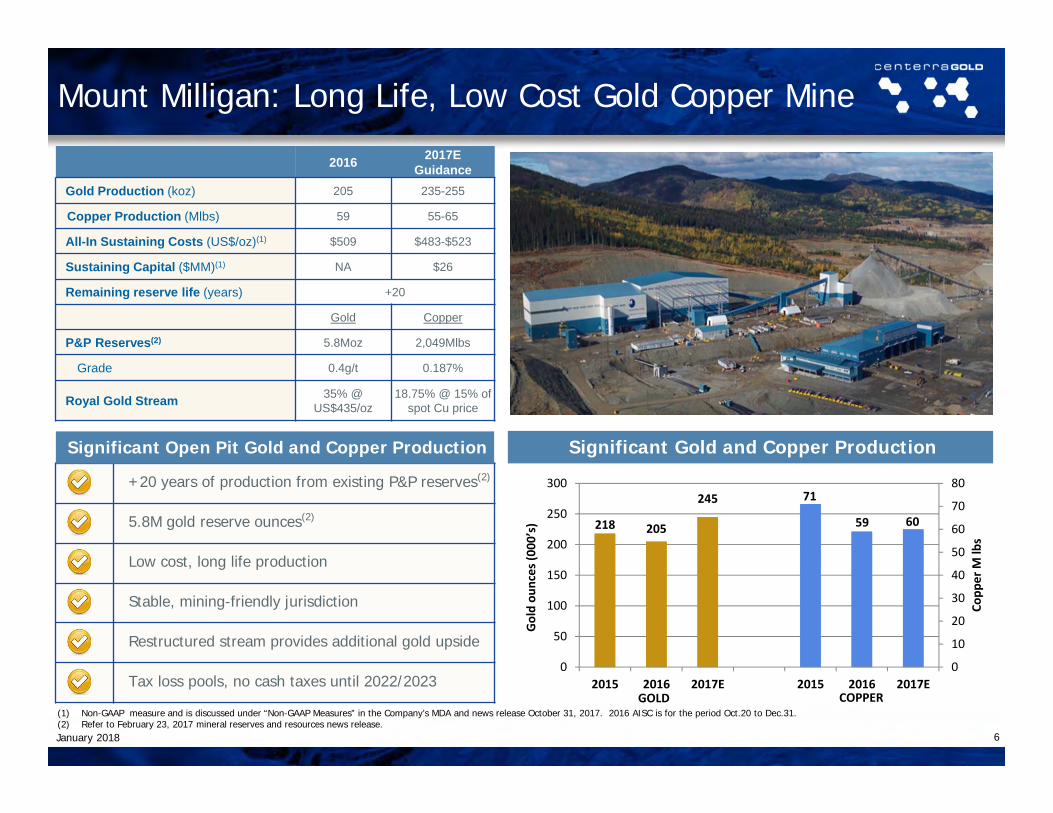
2016 2017E Guidance
Gold Production (koz) 205 235-255
Copper Production (Mlbs) 59 55-65
All-In Sustaining Costs (US$/oz)(1) $509 $483-$523
Sustaining Capital ($MM)(1) NA $26
Remaining reserve life (years) +20
Gold Copper
P&P Reserves(2) 5.8Moz 2,049Mlbs
Grade 0.4g/t 0.187%
Royal Gold Stream 35% @ US$435/oz
18.75% @ 15% of spot Cu price
+20 years of production from existing P&P reserves(2)
5.8M gold reserve ounces(2)
Low cost, long life production
Stable, mining-friendly jurisdiction
Restructured stream provides additional gold upside
Tax loss pools, no cash taxes until 2022/2023
January 2018
Mount Milligan: Long Life, Low Cost Gold Copper Mine
Significant Gold and Copper ProductionSignificant Open Pit Gold and Copper Production
218
245
59
71
60205
0
10
20
30
40
50
60
70
80
0
50
100
150
200
250
300
2015 2016 2017E 2015 2016 2017ECOPPER
Copp
er M
lbs
Gold ou
nces (0
00’s)
GOLD(1) Non-GAAP measure and is discussed under “Non-GAAP Measures” in the Company’s MDA and news release October 31, 2017. 2016 AISC is for the period Oct.20 to Dec.31.(2) Refer to February 23, 2017 mineral reserves and resources news release.
170U/G miners
207U/G miners
240U/G miners
240U/G miners
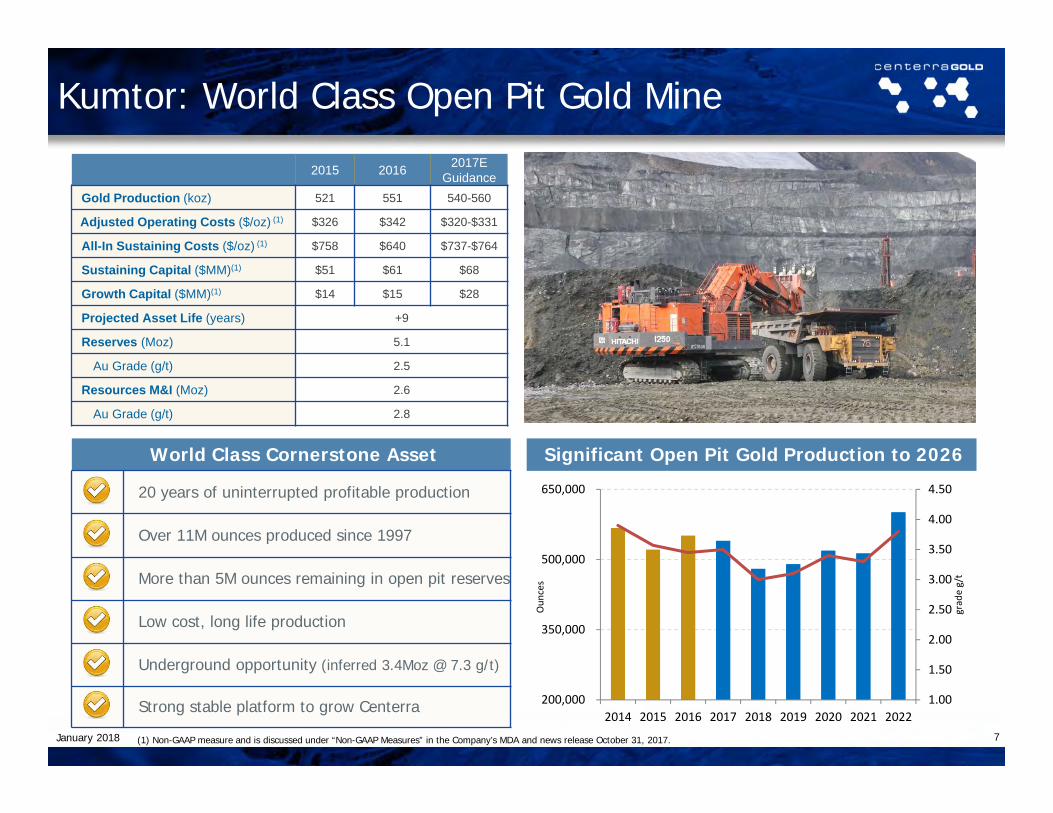
2015 2016 2017EGuidance
Gold Production (koz) 521 551 540-560
Adjusted Operating Costs ($/oz) (1) $326 $342 $320-$331
All-In Sustaining Costs ($/oz) (1) $758 $640 $737-$764
Sustaining Capital ($MM)(1) $51 $61 $68
Growth Capital ($MM)(1) $14 $15 $28
Projected Asset Life (years) +9
Reserves (Moz) 5.1
Au Grade (g/t) 2.5
Resources M&I (Moz) 2.6
Au Grade (g/t) 2.8
World Class Cornerstone Asset Significant Open Pit Gold Production to 2026
YE target of 4,000tpd
20 years of uninterrupted profitable production
Over 11M ounces produced since 1997
More than 5M ounces remaining in open pit reserves
Low cost, long life production
Underground opportunity (inferred 3.4Moz @ 7.3 g/t)
Strong stable platform to grow Centerra
7January 2018
Kumtor: World Class Open Pit Gold Mine
(1) Non-GAAP measure and is discussed under “Non-GAAP Measures” in the Company’s MDA and news release October 31, 2017.
1.00
1.50
2.00
2.50
3.00
3.50
4.00
4.50
200,000
350,000
500,000
650,000
2014 2015 2016 2017 2018 2019 2020 2021 2022
grade g/t
Oun
ces
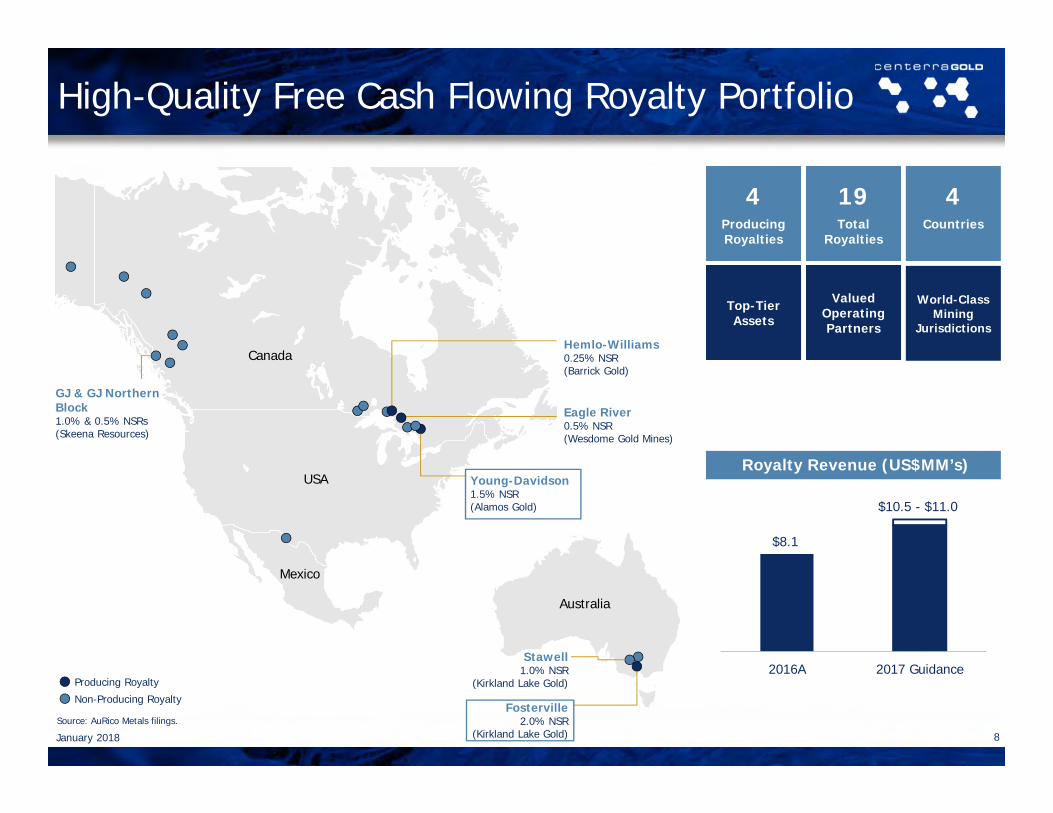
High-Quality Free Cash Flowing Royalty Portfolio
Producing Royalty
Non-Producing Royalty
Canada
USA
Mexico
Australia
Fosterville2.0% NSR
(Kirkland Lake Gold)
Young-Davidson1.5% NSR(Alamos Gold)
Hemlo-Williams0.25% NSR(Barrick Gold)
Eagle River0.5% NSR(Wesdome Gold Mines)
Stawell1.0% NSR
(Kirkland Lake Gold)
GJ & GJ NorthernBlock1.0% & 0.5% NSRs(Skeena Resources)
4Producing Royalties
19Total
Royalties
4Countries
Top-Tier Assets
World-Class Mining
Jurisdictions
Valued Operating Partners
8
Source: AuRico Metals filings.
Royalty Revenue (US$MM’s)
2016A 2017 Guidance
$8.1
$10.5 - $11.0
January 2018
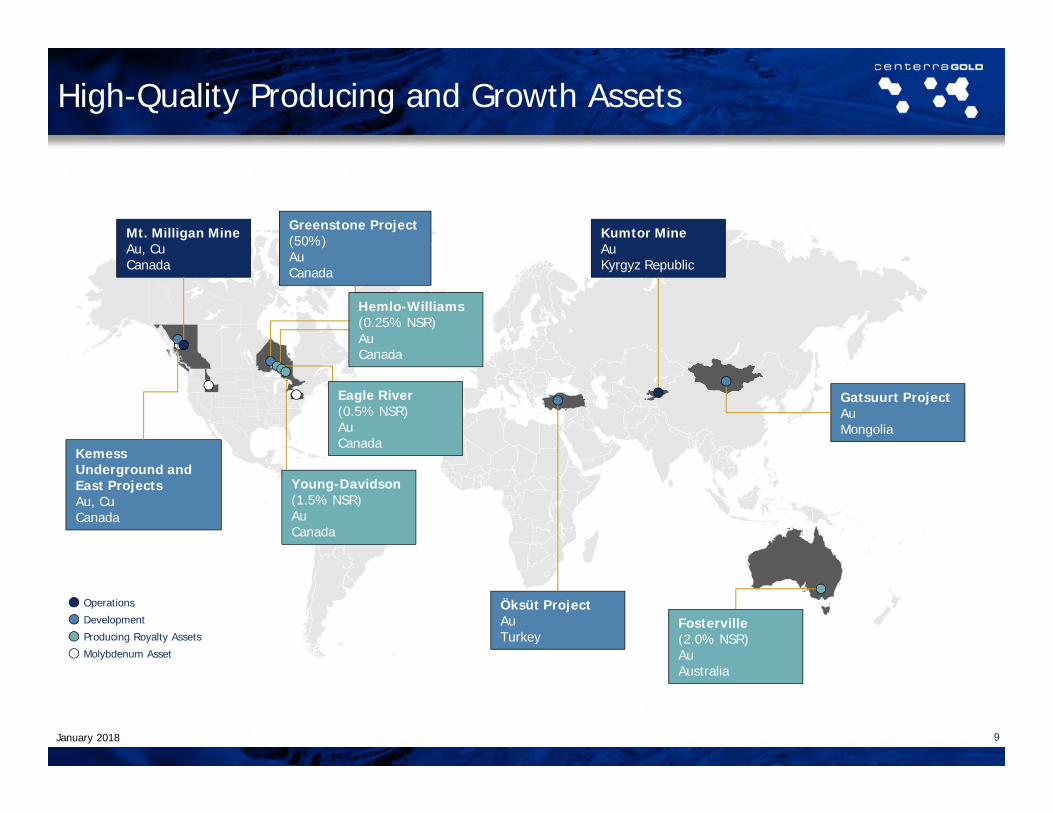
9
Mt. Milligan MineAu, CuCanada
Kumtor MineAuKyrgyz Republic
Greenstone Project (50%)AuCanada
Öksüt ProjectAuTurkey
Gatsuurt ProjectAuMongolia
Kemess Underground and East ProjectsAu, CuCanada
Operations
Development
Molybdenum Asset
Producing Royalty AssetsFosterville(2.0% NSR)AuAustralia
Hemlo-Williams(0.25% NSR)AuCanada
Eagle River (0.5% NSR)AuCanada
Young-Davidson (1.5% NSR)AuCanada
High-Quality Producing and Growth Assets
January 2018
10
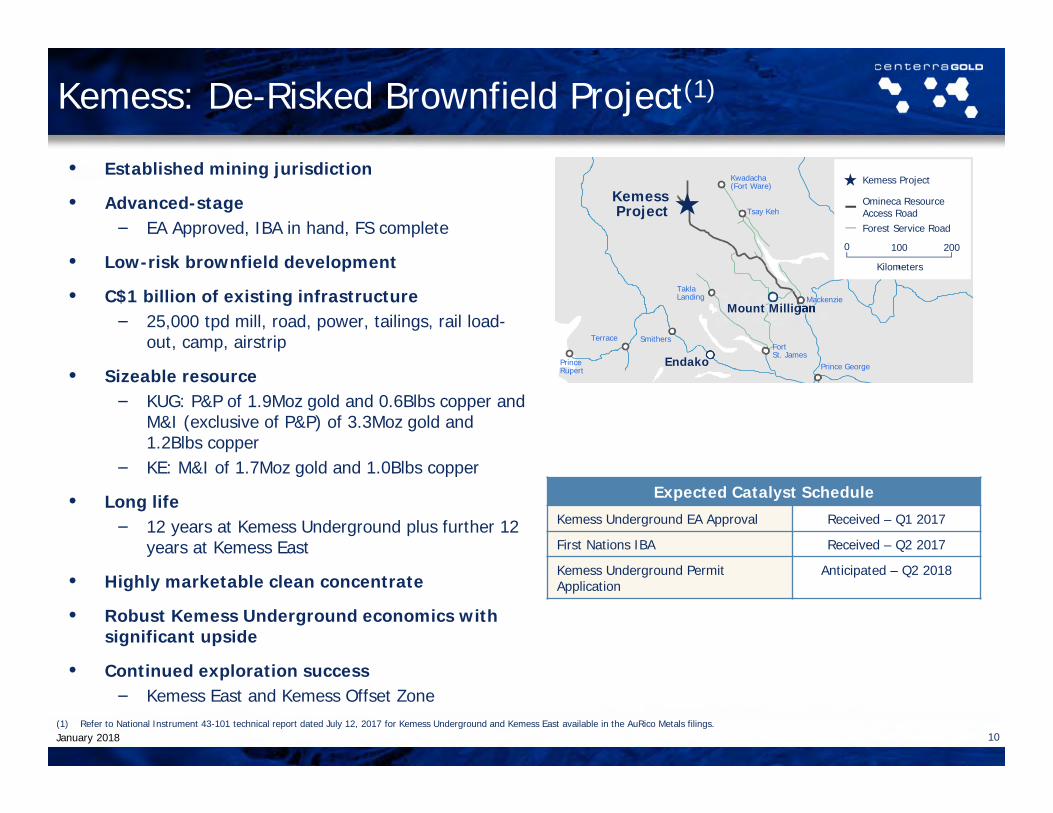
Expected Catalyst Schedule
Kemess Underground EA Approval Received – Q1 2017
First Nations IBA Received – Q2 2017
Kemess Underground Permit Application
Anticipated – Q2 2018
Mount Milligan
KemessProject Tsay Keh
Kwadacha(Fort Ware)
Dawson Creek
Prince GeorgePrinceRupert
Terrace SmithersFort St. James
TaklaLanding Mackenzie
Kemess Project
Omineca Resource Access RoadForest Service Road
Kemess: De-Risked Brownfield Project(1)
0 200
Kilometers
100
Endako
• Established mining jurisdiction
• Advanced-stage− EA Approved, IBA in hand, FS complete
• Low-risk brownfield development
• C$1 billion of existing infrastructure− 25,000 tpd mill, road, power, tailings, rail load-
out, camp, airstrip
• Sizeable resource− KUG: P&P of 1.9Moz gold and 0.6Blbs copper and
M&I (exclusive of P&P) of 3.3Moz gold and 1.2Blbs copper
− KE: M&I of 1.7Moz gold and 1.0Blbs copper
• Long life − 12 years at Kemess Underground plus further 12
years at Kemess East
• Highly marketable clean concentrate
• Robust Kemess Underground economics with significant upside
• Continued exploration success− Kemess East and Kemess Offset Zone
January 2018(1) Refer to National Instrument 43-101 technical report dated July 12, 2017 for Kemess Underground and Kemess East available in the AuRico Metals filings.
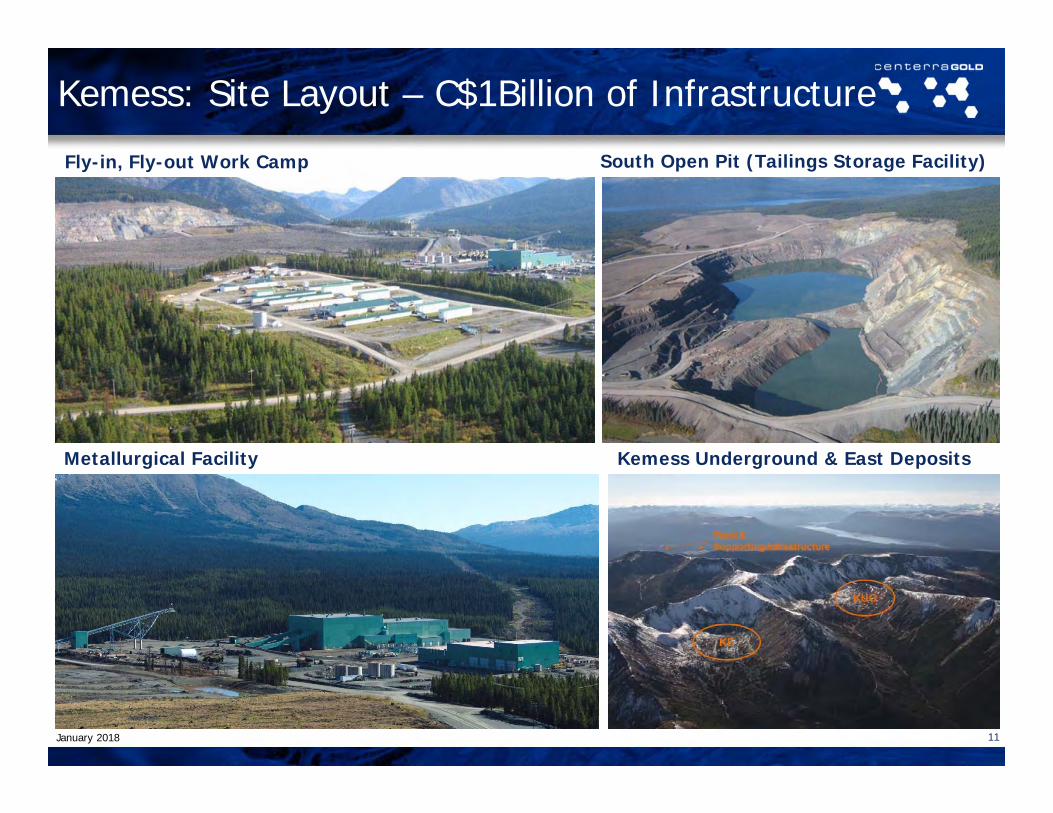
Kemess: Site Layout – C$1Billion of Infrastructure
Fly-in, Fly-out Work Camp South Open Pit (Tailings Storage Facility)
Metallurgical Facility Kemess Underground & East Deposits
11January 2018
12
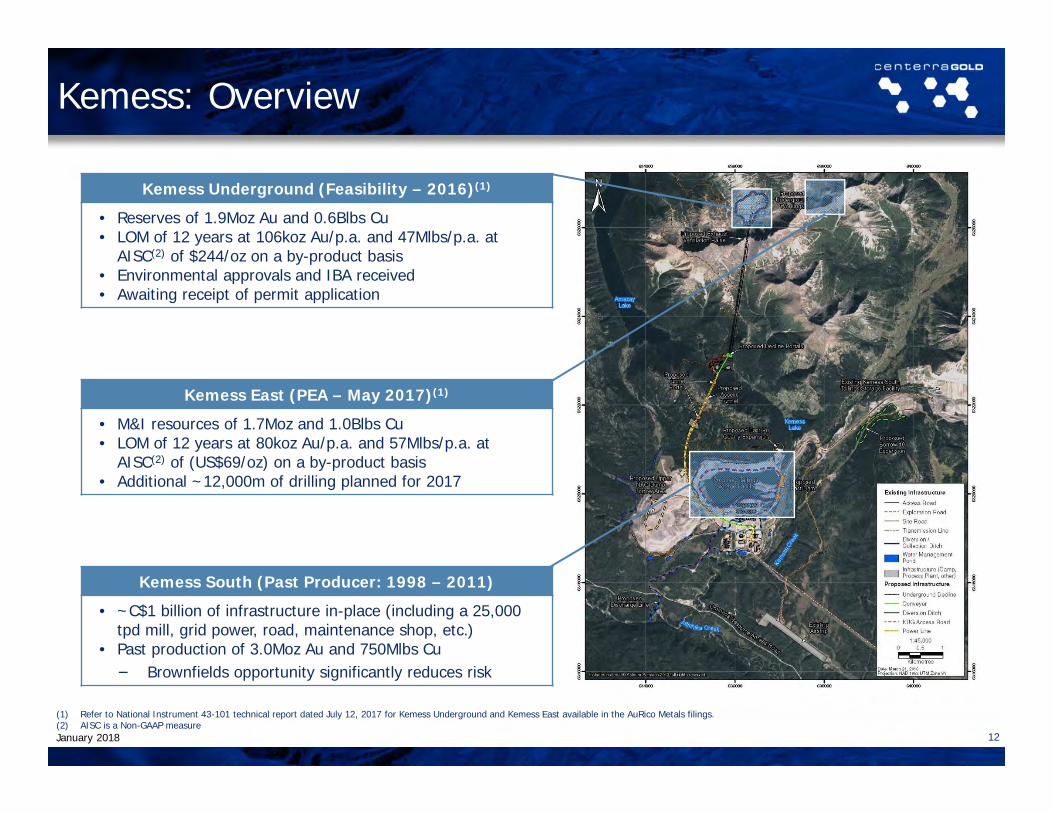
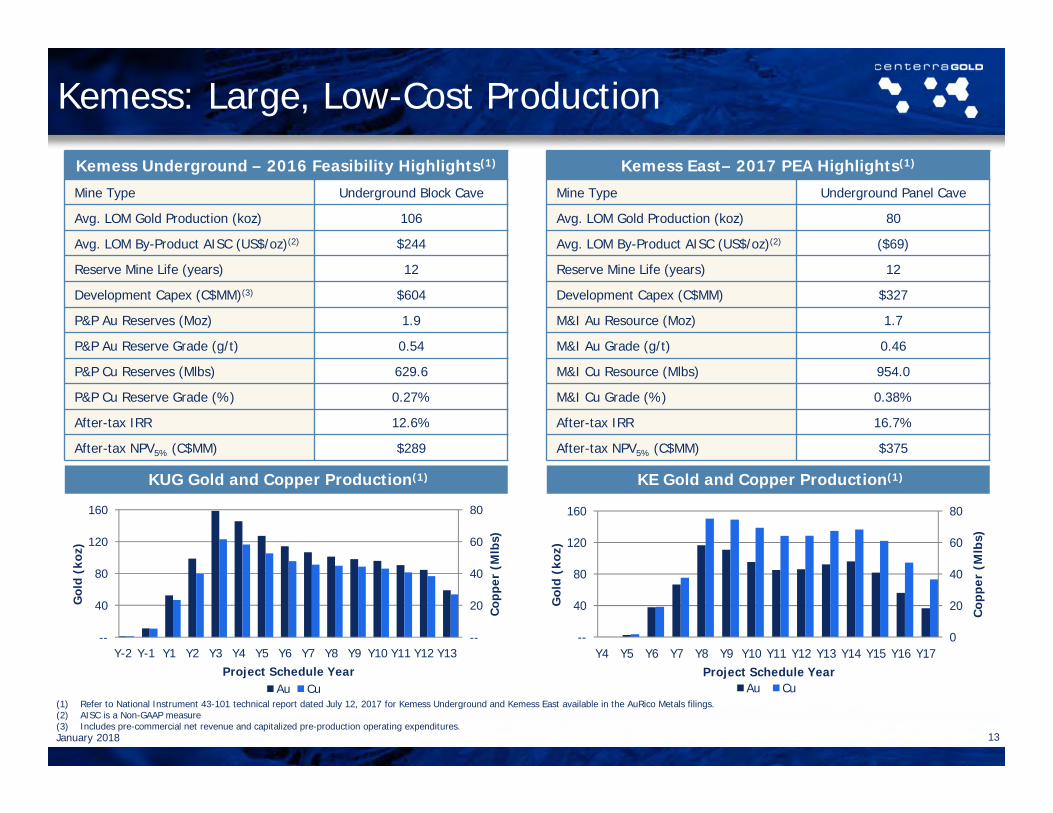
Kemess Underground (Feasibility – 2016)(1)
• Reserves of 1.9Moz Au and 0.6Blbs Cu• LOM of 12 years at 106koz Au/p.a. and 47Mlbs/p.a. at
AISC(2) of $244/oz on a by-product basis • Environmental approvals and IBA received• Awaiting receipt of permit application
Kemess East (PEA – May 2017)(1)
• M&I resources of 1.7Moz and 1.0Blbs Cu• LOM of 12 years at 80koz Au/p.a. and 57Mlbs/p.a. at
AISC(2) of (US$69/oz) on a by-product basis• Additional ~12,000m of drilling planned for 2017
Kemess South (Past Producer: 1998 – 2011)
• ~C$1 billion of infrastructure in-place (including a 25,000 tpd mill, grid power, road, maintenance shop, etc.)
• Past production of 3.0Moz Au and 750Mlbs Cu− Brownfields opportunity significantly reduces risk
(1) Refer to National Instrument 43-101 technical report dated July 12, 2017 for Kemess Underground and Kemess East available in the AuRico Metals filings.(2) AISC is a Non-GAAP measure
Kemess: Overview
January 2018
13
Kemess Underground – 2016 Feasibility Highlights(1)
Mine Type Underground Block Cave
Avg. LOM Gold Production (koz) 106
Avg. LOM By-Product AISC (US$/oz)(2) $244
Reserve Mine Life (years) 12
Development Capex (C$MM)(3) $604
P&P Au Reserves (Moz) 1.9
P&P Au Reserve Grade (g/t) 0.54
P&P Cu Reserves (Mlbs) 629.6
P&P Cu Reserve Grade (%) 0.27%
After-tax IRR 12.6%
After-tax NPV5% (C$MM) $289
Kemess East– 2017 PEA Highlights(1)
Mine Type Underground Panel Cave
Avg. LOM Gold Production (koz) 80
Avg. LOM By-Product AISC (US$/oz)(2) ($69)
Reserve Mine Life (years) 12
Development Capex (C$MM) $327
M&I Au Resource (Moz) 1.7
M&I Au Grade (g/t) 0.46
M&I Cu Resource (Mlbs) 954.0
M&I Cu Grade (%) 0.38%
After-tax IRR 16.7%
After-tax NPV5% (C$MM) $375
Kemess: Large, Low-Cost Production
KE Gold and Copper Production(1)KUG Gold and Copper Production(1)
January 2018
--
20
40
60
80
--
40
80
120
160
Y-2 Y-1 Y1 Y2 Y3 Y4 Y5 Y6 Y7 Y8 Y9 Y10 Y11 Y12 Y13
Cop
per
(Mlb
s)
Gol
d (k
oz)
Project Schedule YearAu Cu
0
20
40
60
80
--
40
80
120
160
Y4 Y5 Y6 Y7 Y8 Y9 Y10 Y11 Y12 Y13 Y14 Y15 Y16 Y17
Cop
per
(M
lbs)
Gol
d (
koz)
Project Schedule YearAu Cu
(1) Refer to National Instrument 43-101 technical report dated July 12, 2017 for Kemess Underground and Kemess East available in the AuRico Metals filings.(2) AISC is a Non-GAAP measure(3) Includes pre-commercial net revenue and capitalized pre-production operating expenditures.
14
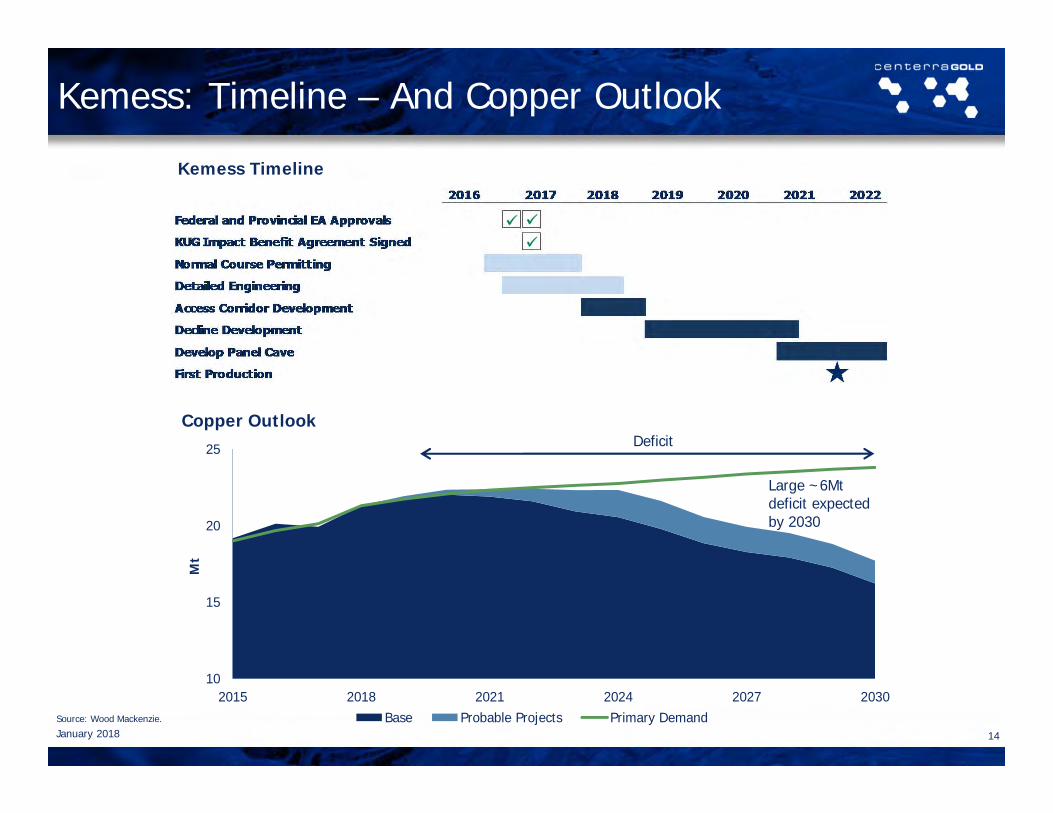
Kemess Timeline
Copper Outlook
10
15
20
25
2015 2018 2021 2024 2027 2030
Mt
Base Probable Projects Primary Demand
Large ~6Mtdeficit expected by 2030
Deficit
Source: Wood Mackenzie.
Kemess: Timeline – And Copper Outlook
January 2018
$0
$250
$500
$750
$1,000
$1,250
$1,500
$1,750
$2,000
$2,250
$2,500
730 9,100 16,008 23,666 30,082 36,417 39,898 42,962
AIS
C, n
et (
US$
/oz
Au)
Cumulative Gold Production (koz Au)
75%
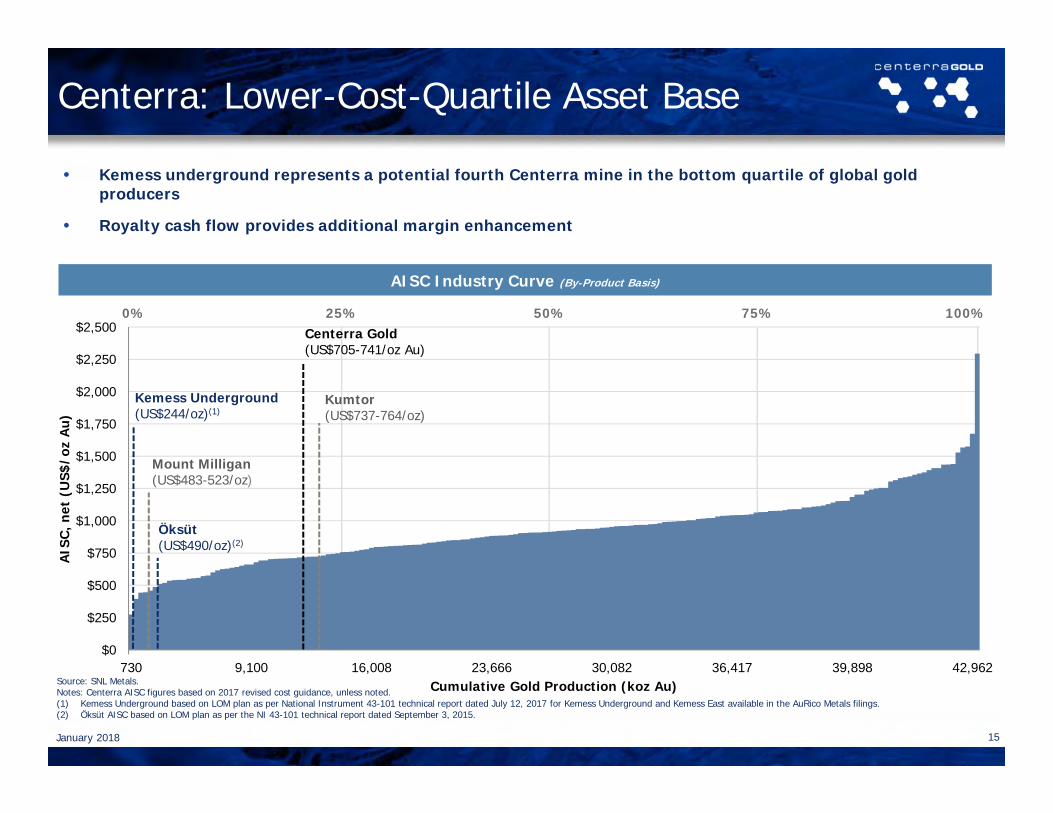
Centerra: Lower-Cost-Quartile Asset Base
15
AISC Industry Curve (By-Product Basis)
100%50%25%0%
Kumtor(US$737-764/oz)
Centerra Gold(US$705-741/oz Au)
• Kemess underground represents a potential fourth Centerra mine in the bottom quartile of global gold producers
• Royalty cash flow provides additional margin enhancement
Source: SNL Metals.Notes: Centerra AISC figures based on 2017 revised cost guidance, unless noted.(1) Kemess Underground based on LOM plan as per National Instrument 43-101 technical report dated July 12, 2017 for Kemess Underground and Kemess East available in the AuRico Metals filings.(2) Öksüt AISC based on LOM plan as per the NI 43-101 technical report dated September 3, 2015.
Mount Milligan(US$483-523/oz)
Öksüt(US$490/oz)(2)
Kemess Underground(US$244/oz)(1)
January 2018
16
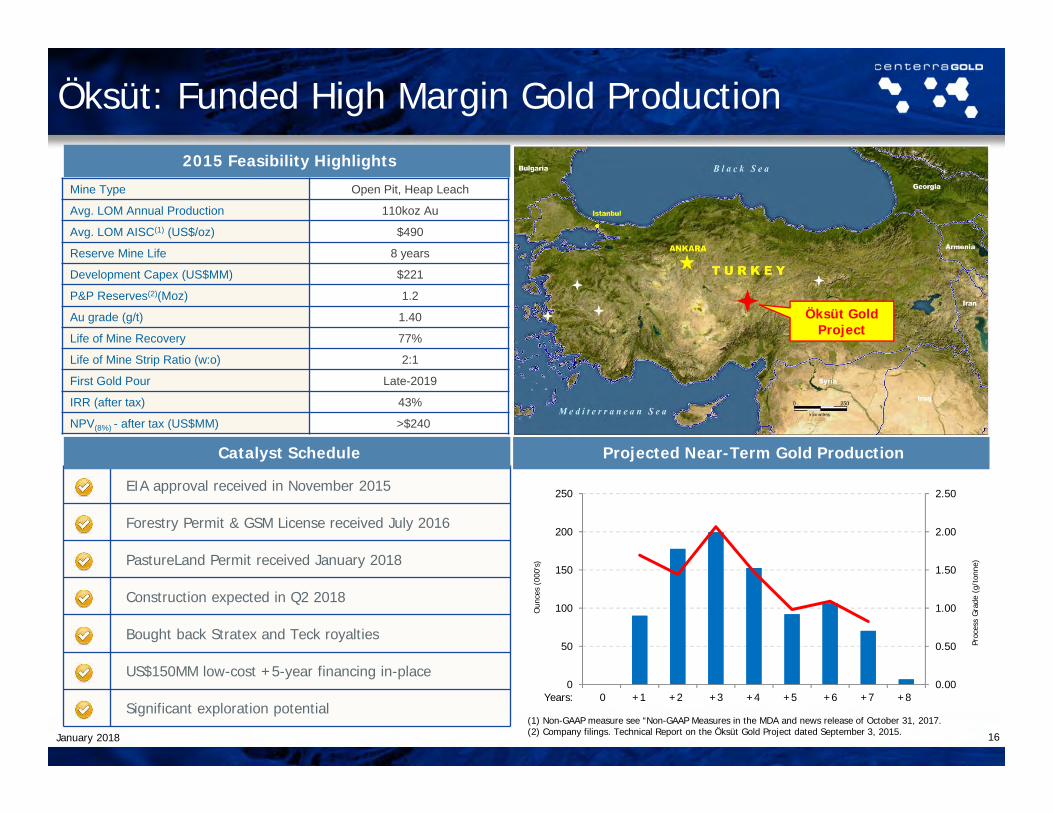
Mine Type Open Pit, Heap Leach
Avg. LOM Annual Production 110koz Au
Avg. LOM AISC(1) (US$/oz) $490
Reserve Mine Life 8 years
Development Capex (US$MM) $221
P&P Reserves(2)(Moz) 1.2
Au grade (g/t) 1.40
Life of Mine Recovery 77%
Life of Mine Strip Ratio (w:o) 2:1
First Gold Pour Late-2019
IRR (after tax) 43%
NPV(8%) - after tax (US$MM) >$240
2015 Feasibility Highlights
EIA approval received in November 2015
Forestry Permit & GSM License received July 2016
PastureLand Permit received January 2018
Construction expected in Q2 2018
Bought back Stratex and Teck royalties
US$150MM low-cost +5-year financing in-place
Significant exploration potential
Projected Near-Term Gold Production
0.00
0.50
1.00
1.50
2.00
2.50
0
50
100
150
200
250
2016 2017 2018 2019 2020 2021 2022 2023 2024
Proc
ess
Gra
de (
g/to
nne)
Oun
ces
(000
's)
Catalyst Schedule
Öksüt Gold Project
(1) Non-GAAP measure see “Non-GAAP Measures in the MDA and news release of October 31, 2017.(2) Company filings. Technical Report on the Öksüt Gold Project dated September 3, 2015.
0 +1 +2 +3 +4 +5 +6 +7 +8Years:
January 2018
Öksüt: Funded High Margin Gold Production
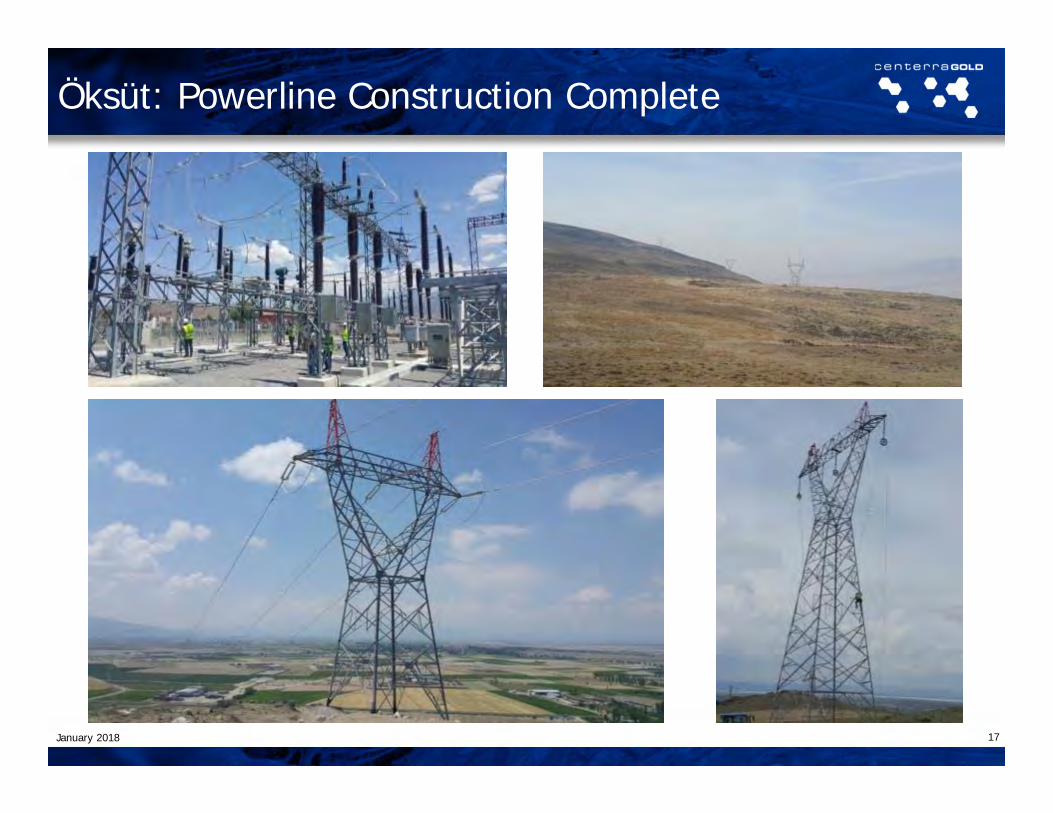
Öksüt: Powerline Construction Complete
17January 2018
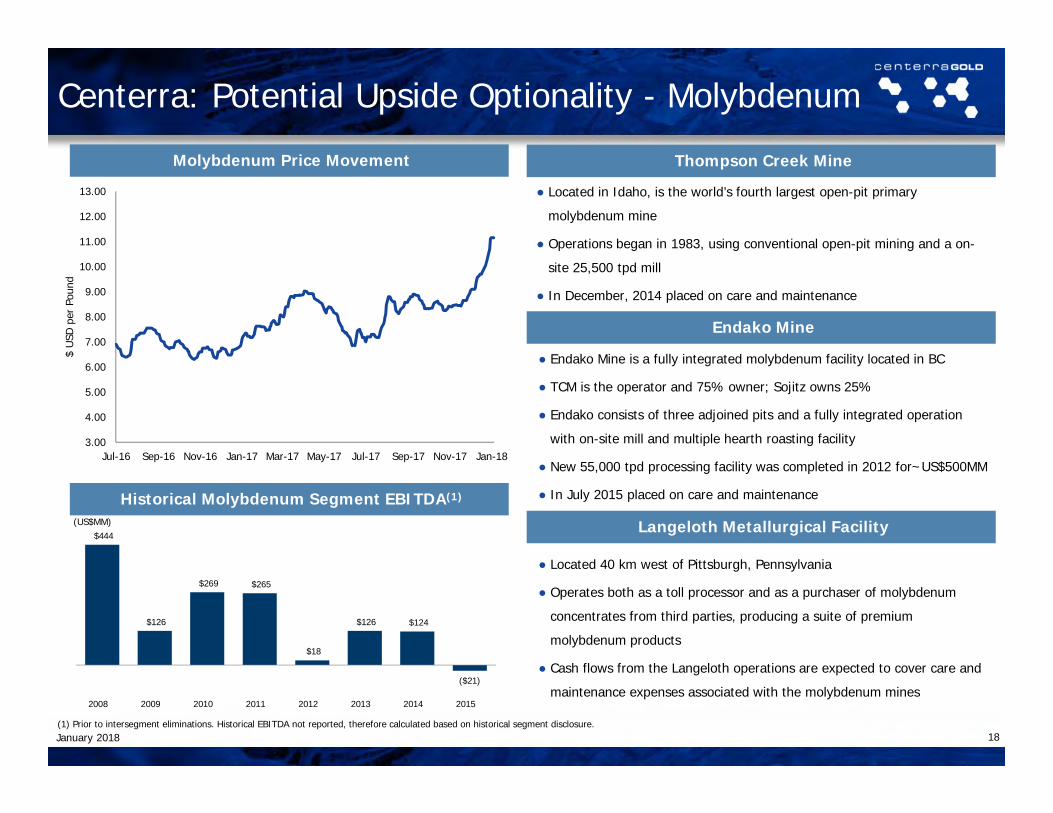
Centerra: Potential Upside Optionality - Molybdenum
18
Molybdenum Price Movement Thompson Creek Mine
Endako Mine
● Located in Idaho, is the world’s fourth largest open-pit primary
molybdenum mine
● Operations began in 1983, using conventional open-pit mining and a on-
site 25,500 tpd mill
● In December, 2014 placed on care and maintenance
● Endako Mine is a fully integrated molybdenum facility located in BC
● TCM is the operator and 75% owner; Sojitz owns 25%
● Endako consists of three adjoined pits and a fully integrated operation
with on-site mill and multiple hearth roasting facility
● New 55,000 tpd processing facility was completed in 2012 for~US$500MM
● In July 2015 placed on care and maintenance
Langeloth Metallurgical Facility
● Located 40 km west of Pittsburgh, Pennsylvania
● Operates both as a toll processor and as a purchaser of molybdenum
concentrates from third parties, producing a suite of premium
molybdenum products
● Cash flows from the Langeloth operations are expected to cover care and
maintenance expenses associated with the molybdenum mines
Historical Molybdenum Segment EBITDA(1)
$444
$126
$269 $265
$18
$126 $124
($21)
2008 2009 2010 2011 2012 2013 2014 2015
(US$MM)
(1) Prior to intersegment eliminations. Historical EBITDA not reported, therefore calculated based on historical segment disclosure.January 2018
3.00
4.00
5.00
6.00
7.00
8.00
9.00
10.00
11.00
12.00
13.00
Jul-16 Sep-16 Nov-16 Jan-17 Mar-17 May-17 Jul-17 Sep-17 Nov-17 Jan-18
$ U
SD p
er P
ound
TSX: CGwww.centerragold.com
Appendices
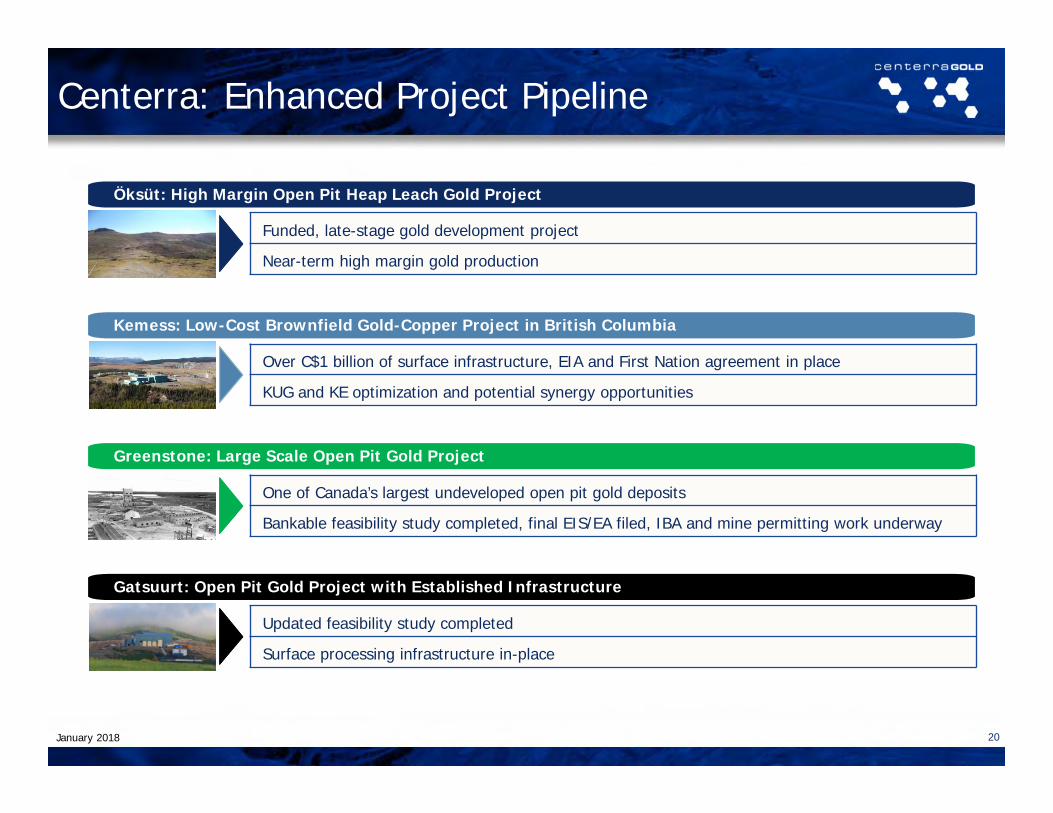
Kemess: Low-Cost Brownfield Gold-Copper Project in British Columbia
Greenstone: Large Scale Open Pit Gold Project
Over C$1 billion of surface infrastructure, EIA and First Nation agreement in place
KUG and KE optimization and potential synergy opportunities
One of Canada’s largest undeveloped open pit gold deposits
Bankable feasibility study completed, final EIS/EA filed, IBA and mine permitting work underway
20
Öksüt: High Margin Open Pit Heap Leach Gold Project
Funded, late-stage gold development project
Near-term high margin gold production
Gatsuurt: Open Pit Gold Project with Established Infrastructure
Updated feasibility study completed
Surface processing infrastructure in-place
Centerra: Enhanced Project Pipeline
January 2018
21
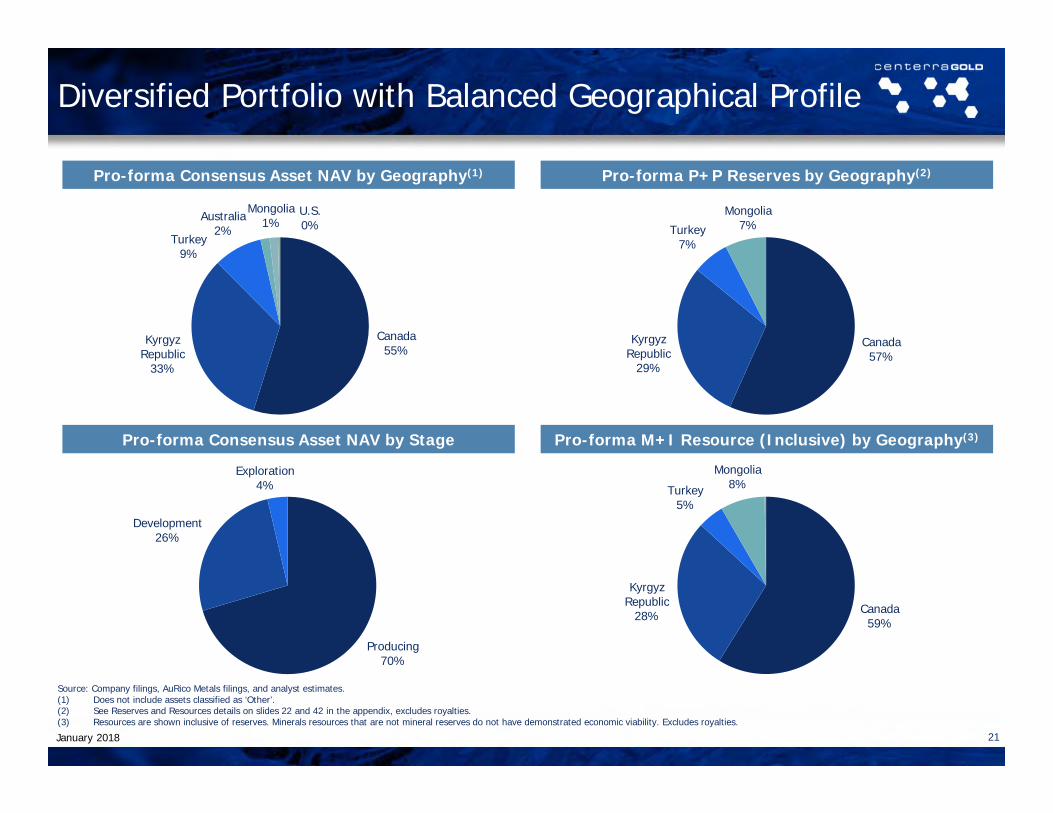
Pro-forma Consensus Asset NAV by Geography(1)
Pro-forma M+I Resource (Inclusive) by Geography(3)Pro-forma Consensus Asset NAV by Stage
Pro-forma P+P Reserves by Geography(2)
Source: Company filings, AuRico Metals filings, and analyst estimates.(1) Does not include assets classified as ‘Other’.(2) See Reserves and Resources details on slides 22 and 42 in the appendix, excludes royalties.(3) Resources are shown inclusive of reserves. Minerals resources that are not mineral reserves do not have demonstrated economic viability. Excludes royalties.
Canada55%
Kyrgyz Republic
33%
Turkey9%
Australia2%
Mongolia1%
U.S.0%
Producing70%
Development26%
Exploration4%
Canada57%
Kyrgyz Republic
29%
Turkey7%
Mongolia7%
Canada59%
Kyrgyz Republic
28%
Turkey5%
Mongolia8%
Diversified Portfolio with Balanced Geographical Profile
January 2018
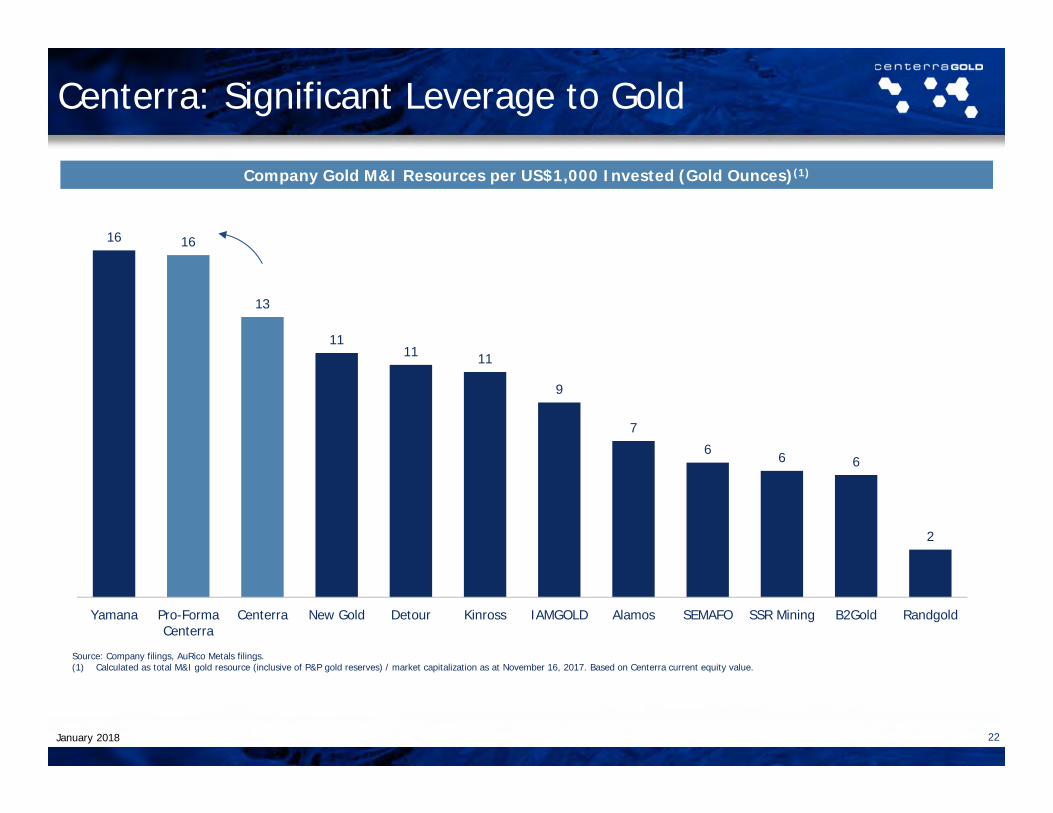
16 16
13
1111 11
9
7
6 6 6
2
Yamana Pro-FormaCenterra
Centerra New Gold Detour Kinross IAMGOLD Alamos SEMAFO SSR Mining B2Gold Randgold
22
Company Gold M&I Resources per US$1,000 Invested (Gold Ounces)(1)
Source: Company filings, AuRico Metals filings.(1) Calculated as total M&I gold resource (inclusive of P&P gold reserves) / market capitalization as at November 16, 2017. Based on Centerra current equity value.
Centerra: Significant Leverage to Gold
January 2018
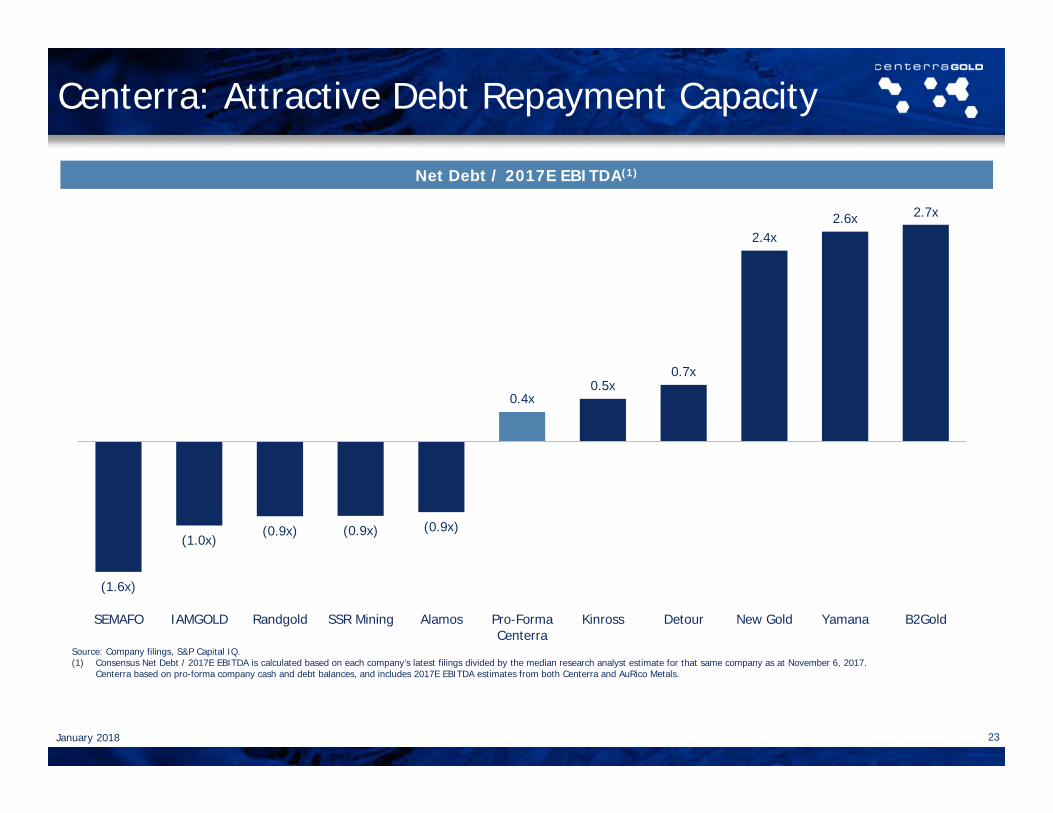
23
Net Debt / 2017E EBITDA(1)
Source: Company filings, S&P Capital IQ.(1) Consensus Net Debt / 2017E EBITDA is calculated based on each company’s latest filings divided by the median research analyst estimate for that same company as at November 6, 2017.
Centerra based on pro-forma company cash and debt balances, and includes 2017E EBITDA estimates from both Centerra and AuRico Metals.
Centerra: Attractive Debt Repayment Capacity
2.7x2.6x2.4x
0.7x0.5x
0.4x
(0.9x)(0.9x)(0.9x)(1.0x)
(1.6x)
B2GoldYamanaNew GoldDetourKinrossPro-FormaCenterra
AlamosSSR MiningRandgoldIAMGOLDSEMAFO
January 2018
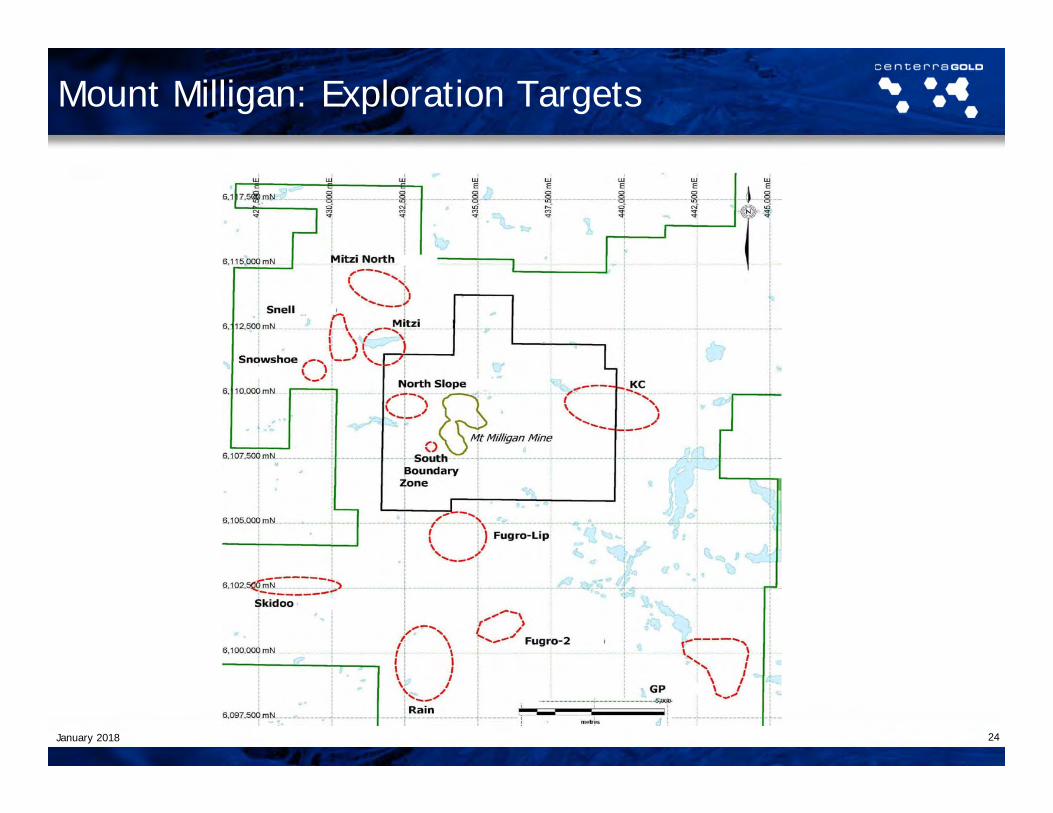
Mount Milligan: Exploration Targets
24January 2018
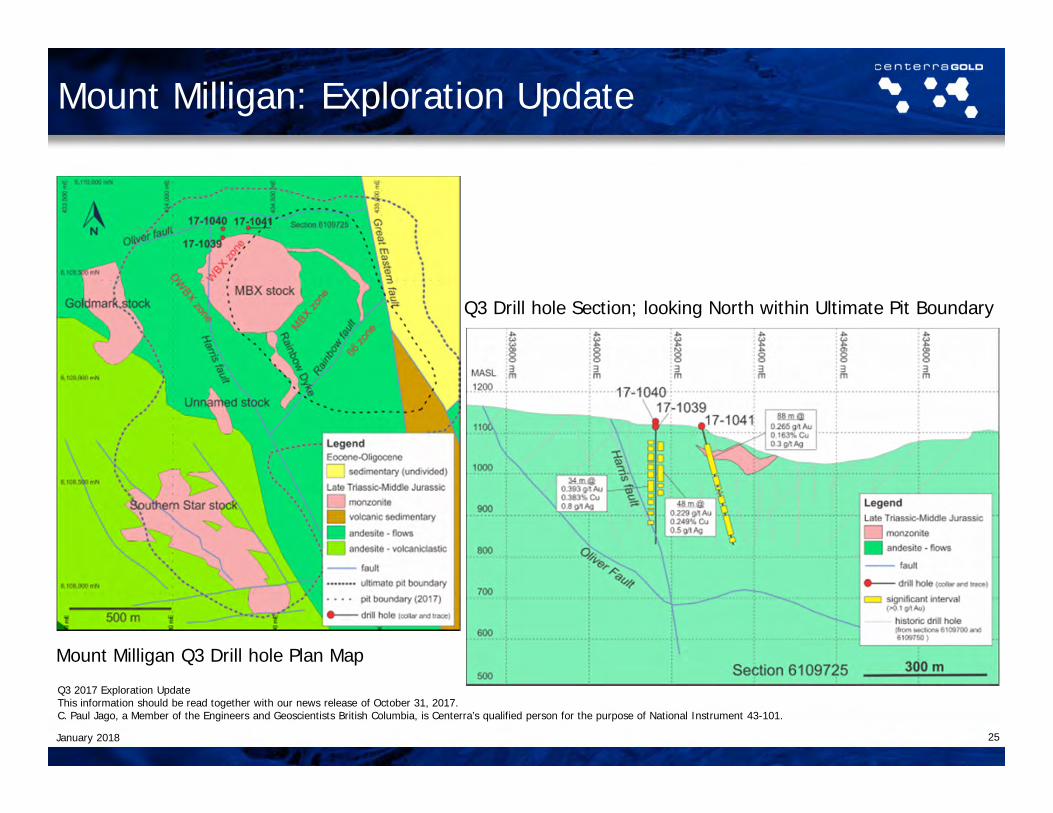
Mount Milligan Q3 Drill hole Plan Map
Q3 Drill hole Section; looking North within Ultimate Pit Boundary
Mount Milligan: Exploration Update
25January 2018
Q3 2017 Exploration UpdateThis information should be read together with our news release of October 31, 2017.C. Paul Jago, a Member of the Engineers and Geoscientists British Columbia, is Centerra’s qualified person for the purpose of National Instrument 43-101.
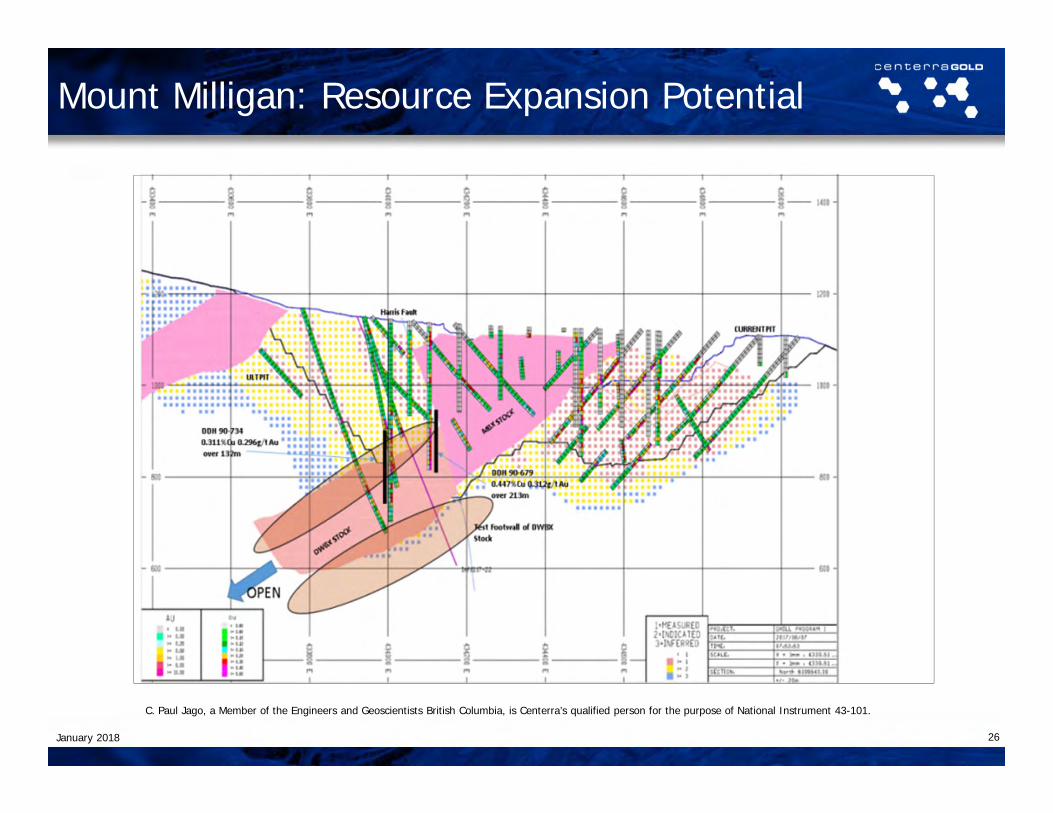
Mount Milligan: Resource Expansion Potential
January 2018
C. Paul Jago, a Member of the Engineers and Geoscientists British Columbia, is Centerra’s qualified person for the purpose of National Instrument 43-101.
26
Centerra: AuRico Metals Transaction1 Rationale
Acquired a de-risked brownfield project in British Columbia and cash flowing royalty portfolio
• Enhances Centerra’s high-quality asset base in a world-class jurisdiction
− Kemess can be a future cornerstone asset that will further bolster Centerra’s strong development pipeline
− Cash flowing royalty portfolio underpinned by the high-quality Fosterville and Young-Davidson mines
• Near-term de-risked growth
− Over C$1 billion of surface infrastructure, EIA and first nation agreements in place
• Numerous value creation upside opportunities at Kemess
− Integration of Kemess Underground (“KUG”) and Kemess East (“KE”) has the potential to become a 20+ year mining operation through optimization studies and potential synergy opportunities
• High-quality, free cash flowing royalty portfolio
− Acquisition of a high-quality, free-cash flow generating royalties provides immediate incremental cash flow and potential for long-term upside from high-quality underlying assets
• Accretive to NAV, reserves and resources
• Strong balance sheet maintained
− Centerra holds in excess of US$350 million in cash to fund the acquisition and has secured a new US$125 million acquisition facility
− Positioned to build out Centerra’s pipeline of development projects
− Centerra plans to restructure its current debt facilities upon close of this transaction
27January 2018
1. Refer to Company’s news release November 7, 2017 and January 8, 2018.
28
Transaction Summary
• Total transaction value of C$310 million
Consideration
• Each existing AuRico share outstanding at closing will be exchanged for C$1.80 in cash pursuant to a plan of arrangement
• 38% premium to AuRico’s closing price on November 6, 2017 and a 37% premium based on AuRico’s 20-day volume-weighted average price
Financing of Acquisition
• Cash on hand
• New US$125 million acquisition credit facility
Conditions• AuRico shareholder approval (66⅔% of shareholder votes cast)
• Customary regulatory and court approvals
Other
• Unanimous support from AuRico’s Board of Directors (subject to abstentions)
• AuRico’s Officers, AuRico’s Board of Directors and Alamos Gold, collectively representing 11.4% of common shares outstanding, have entered into voting support agreements
• Customary non-solicitation covenants and a C$12 million termination fee is payable in customary circumstances
Anticipated Timeline
• AuRico shareholder meeting in December 2017
• Expected to close in January 2018
Centerra: AuRico Metals Transaction1 Summary
January 2018
1. Refer to Company’s news release November 7, 2017.
29
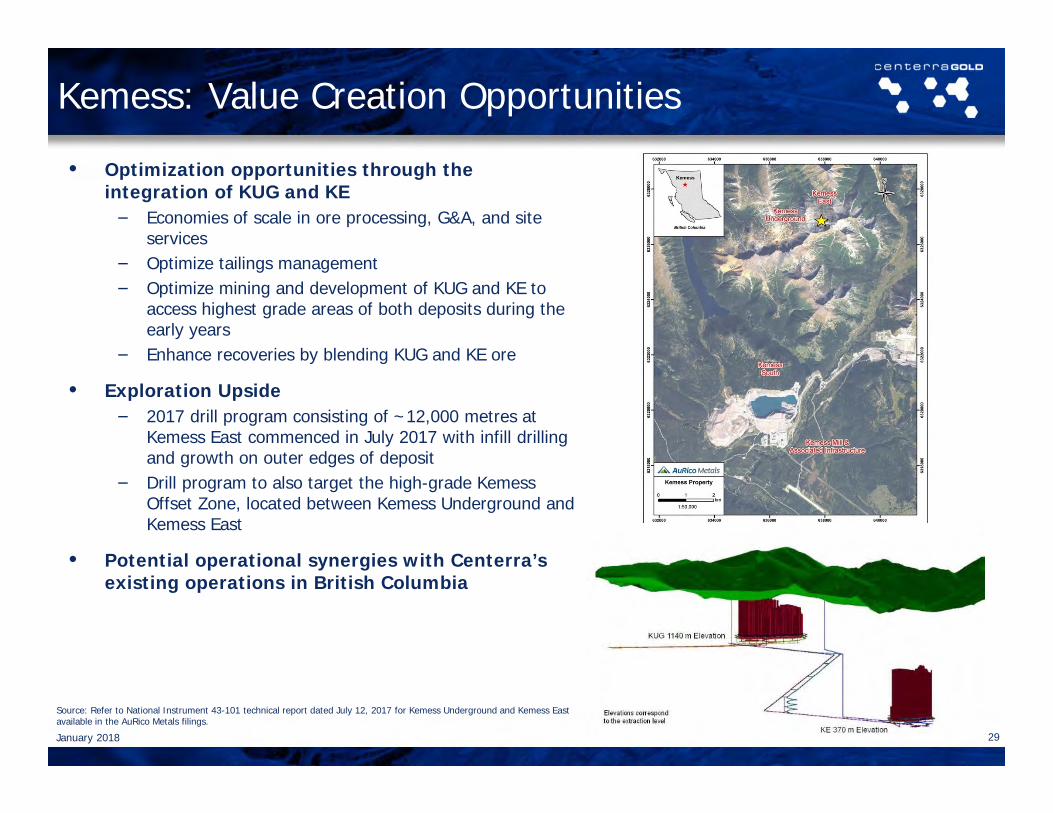
• Optimization opportunities through the integration of KUG and KE− Economies of scale in ore processing, G&A, and site
services− Optimize tailings management− Optimize mining and development of KUG and KE to
access highest grade areas of both deposits during the early years
− Enhance recoveries by blending KUG and KE ore
• Exploration Upside− 2017 drill program consisting of ~12,000 metres at
Kemess East commenced in July 2017 with infill drilling and growth on outer edges of deposit
− Drill program to also target the high-grade Kemess Offset Zone, located between Kemess Underground and Kemess East
• Potential operational synergies with Centerra’s existing operations in British Columbia
Kemess: Value Creation Opportunities
January 2018
Source: Refer to National Instrument 43-101 technical report dated July 12, 2017 for Kemess Underground and Kemess East available in the AuRico Metals filings.
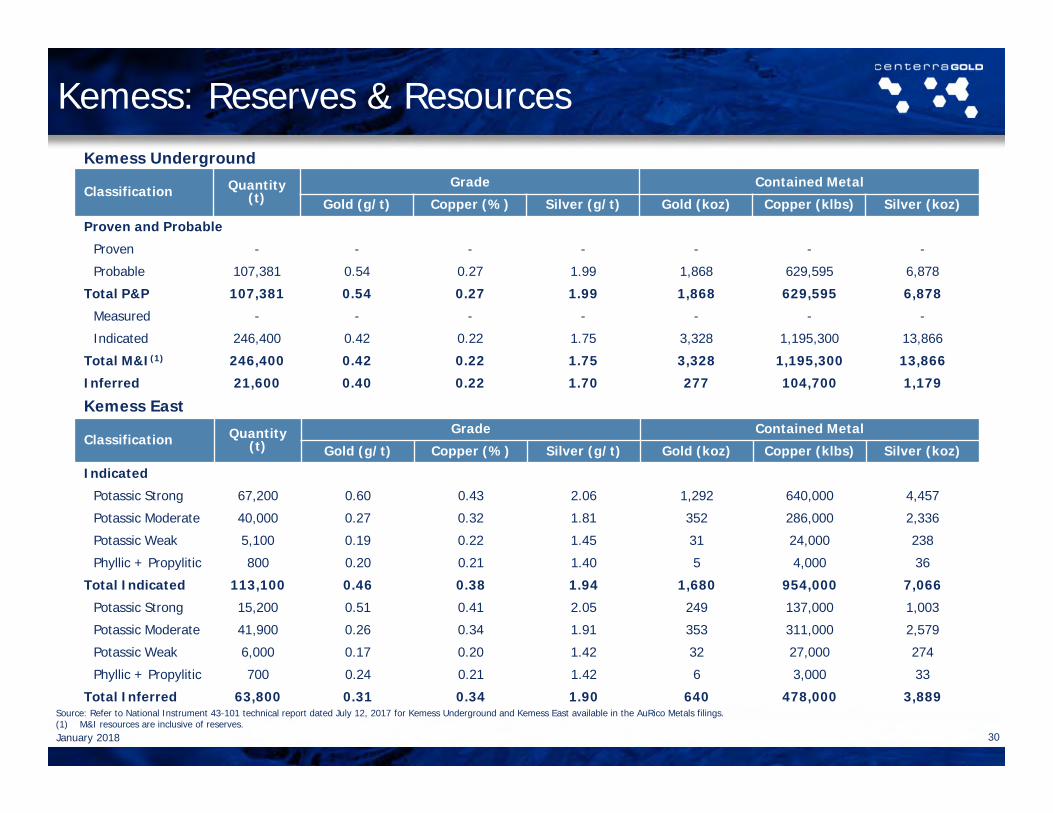
Classification Quantity(t)
Grade Contained Metal
Gold (g/t) Copper (%) Silver (g/t) Gold (koz) Copper (klbs) Silver (koz)
Proven and Probable
Proven - - - - - - -
Probable 107,381 0.54 0.27 1.99 1,868 629,595 6,878
Total P&P 107,381 0.54 0.27 1.99 1,868 629,595 6,878
Measured - - - - - - -
Indicated 246,400 0.42 0.22 1.75 3,328 1,195,300 13,866
Total M&I(1) 246,400 0.42 0.22 1.75 3,328 1,195,300 13,866
Inferred 21,600 0.40 0.22 1.70 277 104,700 1,179
Classification Quantity(t)
Grade Contained Metal
Gold (g/t) Copper (%) Silver (g/t) Gold (koz) Copper (klbs) Silver (koz)
Indicated
Potassic Strong 67,200 0.60 0.43 2.06 1,292 640,000 4,457
Potassic Moderate 40,000 0.27 0.32 1.81 352 286,000 2,336
Potassic Weak 5,100 0.19 0.22 1.45 31 24,000 238
Phyllic + Propylitic 800 0.20 0.21 1.40 5 4,000 36
Total Indicated 113,100 0.46 0.38 1.94 1,680 954,000 7,066
Potassic Strong 15,200 0.51 0.41 2.05 249 137,000 1,003
Potassic Moderate 41,900 0.26 0.34 1.91 353 311,000 2,579
Potassic Weak 6,000 0.17 0.20 1.42 32 27,000 274
Phyllic + Propylitic 700 0.24 0.21 1.42 6 3,000 33
Total Inferred 63,800 0.31 0.34 1.90 640 478,000 3,889
Kemess Underground
Kemess East
Source: Refer to National Instrument 43-101 technical report dated July 12, 2017 for Kemess Underground and Kemess East available in the AuRico Metals filings.(1) M&I resources are inclusive of reserves.
30
Kemess: Reserves & Resources
January 2018
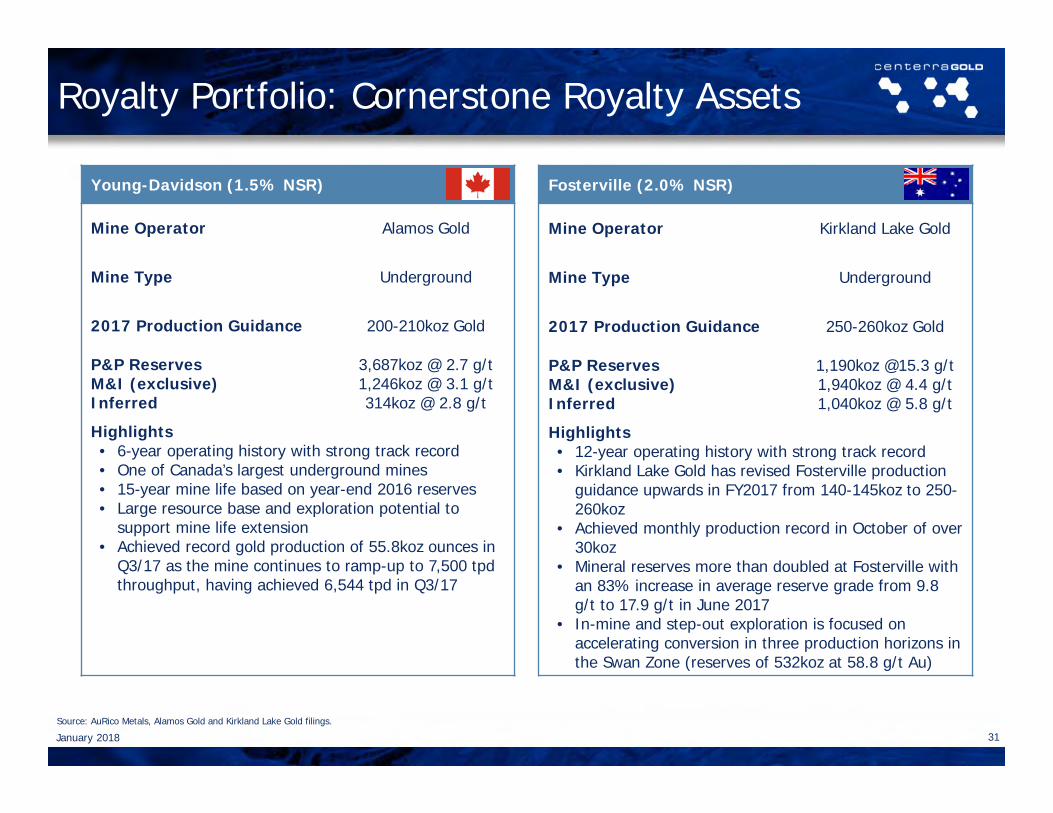
Fosterville (2.0% NSR)
Mine Operator Kirkland Lake Gold
Mine Type Underground
2017 Production Guidance 250-260koz Gold
P&P ReservesM&I (exclusive)Inferred
1,190koz @15.3 g/t1,940koz @ 4.4 g/t1,040koz @ 5.8 g/t
Highlights• 12-year operating history with strong track record• Kirkland Lake Gold has revised Fosterville production
guidance upwards in FY2017 from 140-145koz to 250-260koz
• Achieved monthly production record in October of over 30koz
• Mineral reserves more than doubled at Fosterville with an 83% increase in average reserve grade from 9.8 g/t to 17.9 g/t in June 2017
• In-mine and step-out exploration is focused on accelerating conversion in three production horizons in the Swan Zone (reserves of 532koz at 58.8 g/t Au)
31Source: AuRico Metals, Alamos Gold and Kirkland Lake Gold filings.
Young-Davidson (1.5% NSR)
Mine Operator Alamos Gold
Mine Type Underground
2017 Production Guidance 200-210koz Gold
P&P ReservesM&I (exclusive)Inferred
3,687koz @ 2.7 g/t1,246koz @ 3.1 g/t314koz @ 2.8 g/t
Highlights• 6-year operating history with strong track record• One of Canada’s largest underground mines• 15-year mine life based on year-end 2016 reserves• Large resource base and exploration potential to
support mine life extension• Achieved record gold production of 55.8koz ounces in
Q3/17 as the mine continues to ramp-up to 7,500 tpdthroughput, having achieved 6,544 tpd in Q3/17
Royalty Portfolio: Cornerstone Royalty Assets
January 2018
32
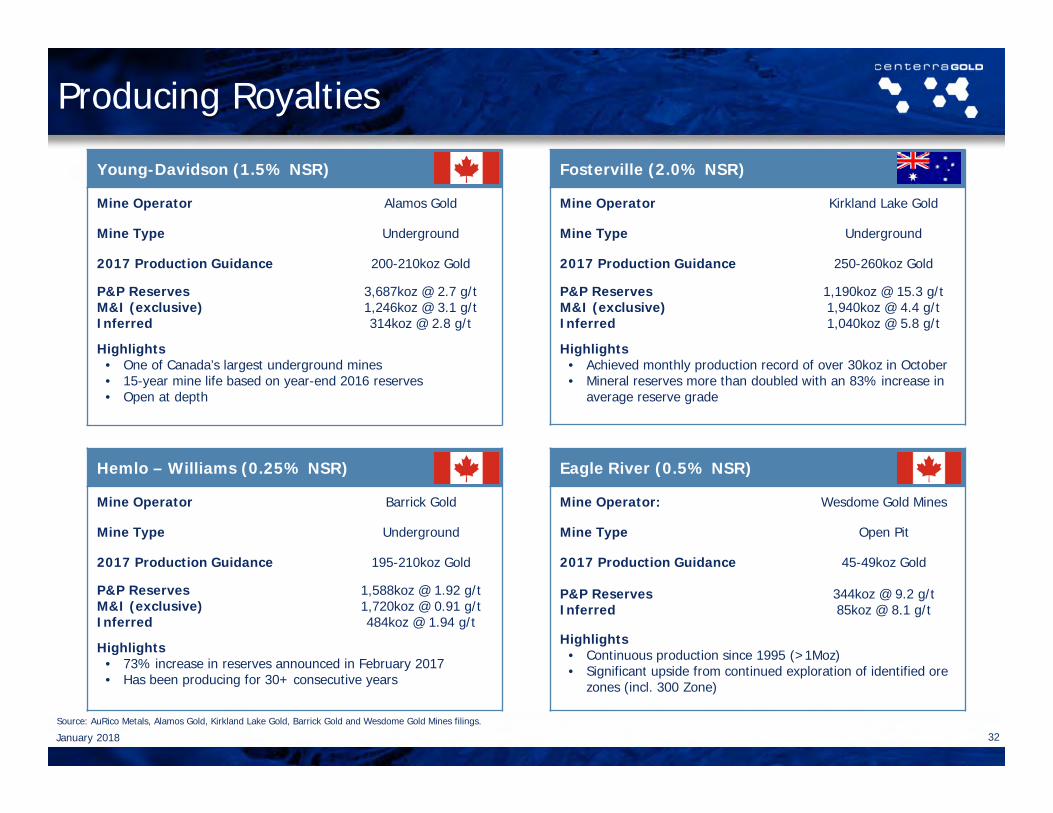
Fosterville (2.0% NSR)
Mine Operator Kirkland Lake Gold
Mine Type Underground
2017 Production Guidance 250-260koz Gold
P&P ReservesM&I (exclusive)Inferred
1,190koz @ 15.3 g/t1,940koz @ 4.4 g/t1,040koz @ 5.8 g/t
Highlights• Achieved monthly production record of over 30koz in October • Mineral reserves more than doubled with an 83% increase in
average reserve grade
Young-Davidson (1.5% NSR)
Mine Operator Alamos Gold
Mine Type Underground
2017 Production Guidance 200-210koz Gold
P&P ReservesM&I (exclusive)Inferred
3,687koz @ 2.7 g/t1,246koz @ 3.1 g/t314koz @ 2.8 g/t
Highlights• One of Canada’s largest underground mines• 15-year mine life based on year-end 2016 reserves• Open at depth
Hemlo – Williams (0.25% NSR)
Mine Operator Barrick Gold
Mine Type Underground
2017 Production Guidance 195-210koz Gold
P&P ReservesM&I (exclusive)Inferred
1,588koz @ 1.92 g/t1,720koz @ 0.91 g/t484koz @ 1.94 g/t
Highlights• 73% increase in reserves announced in February 2017• Has been producing for 30+ consecutive years
Eagle River (0.5% NSR)
Mine Operator: Wesdome Gold Mines
Mine Type Open Pit
2017 Production Guidance 45-49koz Gold
P&P ReservesInferred
344koz @ 9.2 g/t85koz @ 8.1 g/t
Highlights• Continuous production since 1995 (>1Moz)• Significant upside from continued exploration of identified ore
zones (incl. 300 Zone)
Producing Royalties
January 2018
Source: AuRico Metals, Alamos Gold, Kirkland Lake Gold, Barrick Gold and Wesdome Gold Mines filings.
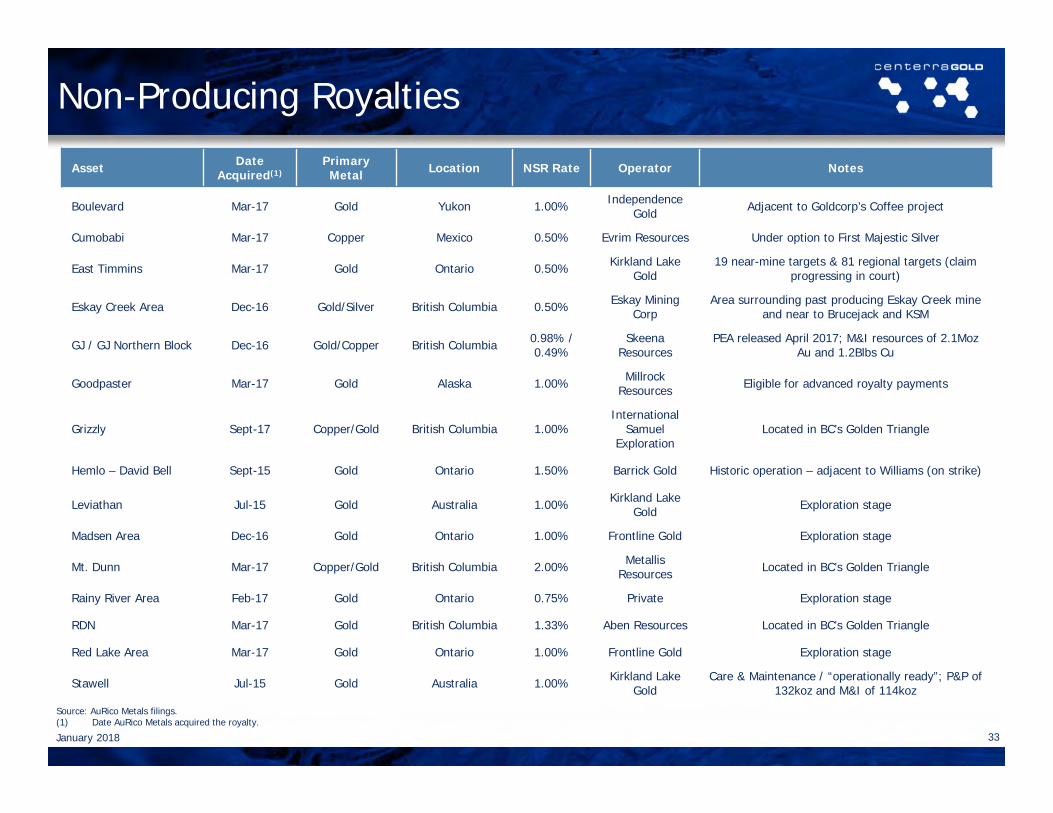
33
Asset Date Acquired(1)
Primary Metal Location NSR Rate Operator Notes
Boulevard Mar-17 Gold Yukon 1.00% Independence Gold Adjacent to Goldcorp’s Coffee project
Cumobabi Mar-17 Copper Mexico 0.50% Evrim Resources Under option to First Majestic Silver
East Timmins Mar-17 Gold Ontario 0.50% Kirkland Lake Gold
19 near-mine targets & 81 regional targets (claim progressing in court)
Eskay Creek Area Dec-16 Gold/Silver British Columbia 0.50% Eskay Mining Corp
Area surrounding past producing Eskay Creek mine and near to Brucejack and KSM
GJ / GJ Northern Block Dec-16 Gold/Copper British Columbia 0.98% / 0.49%
Skeena Resources
PEA released April 2017; M&I resources of 2.1Moz Au and 1.2Blbs Cu
Goodpaster Mar-17 Gold Alaska 1.00% MillrockResources Eligible for advanced royalty payments
Grizzly Sept-17 Copper/Gold British Columbia 1.00%International
Samuel Exploration
Located in BC’s Golden Triangle
Hemlo – David Bell Sept-15 Gold Ontario 1.50% Barrick Gold Historic operation – adjacent to Williams (on strike)
Leviathan Jul-15 Gold Australia 1.00% Kirkland Lake Gold Exploration stage
Madsen Area Dec-16 Gold Ontario 1.00% Frontline Gold Exploration stage
Mt. Dunn Mar-17 Copper/Gold British Columbia 2.00% MetallisResources Located in BC’s Golden Triangle
Rainy River Area Feb-17 Gold Ontario 0.75% Private Exploration stage
RDN Mar-17 Gold British Columbia 1.33% Aben Resources Located in BC’s Golden Triangle
Red Lake Area Mar-17 Gold Ontario 1.00% Frontline Gold Exploration stage
Stawell Jul-15 Gold Australia 1.00% Kirkland Lake Gold
Care & Maintenance / “operationally ready”; P&P of 132koz and M&I of 114koz
Source: AuRico Metals filings.(1) Date AuRico Metals acquired the royalty.
Non-Producing Royalties
January 2018
34
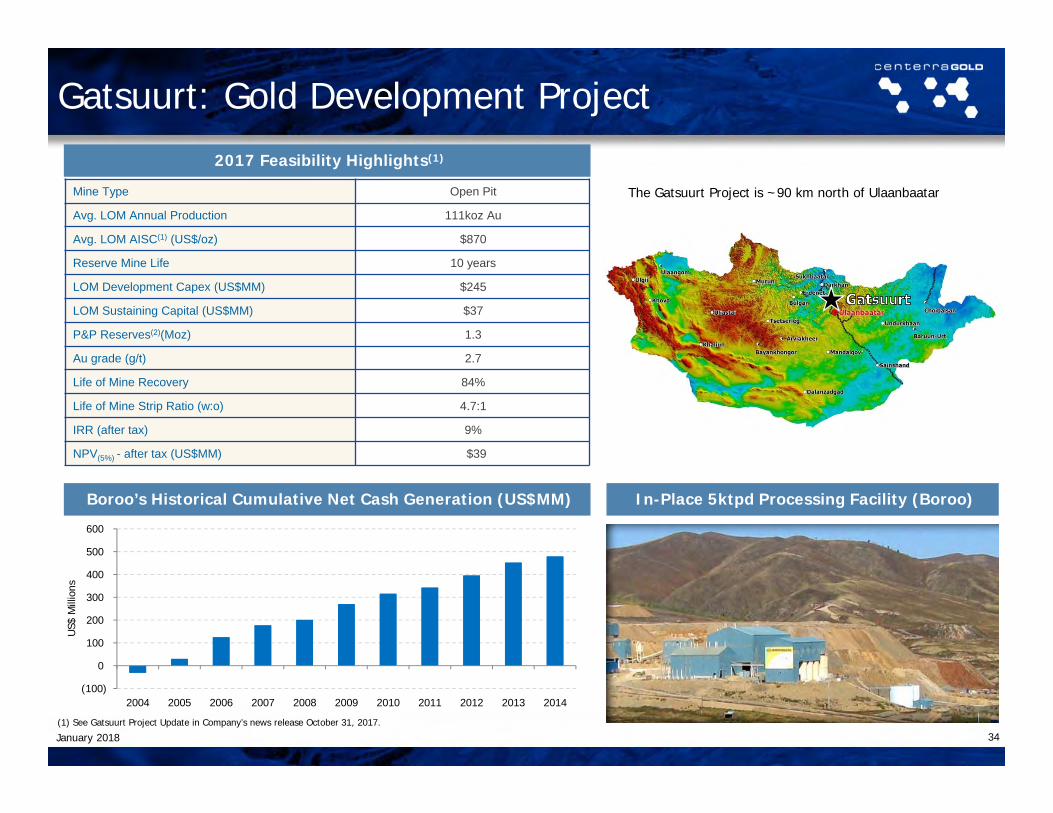
2017 Feasibility Highlights(1)
In-Place 5ktpd Processing Facility (Boroo)Boroo’s Historical Cumulative Net Cash Generation (US$MM)
(100)
0
100
200
300
400
500
600
2004 2005 2006 2007 2008 2009 2010 2011 2012 2013 2014
US$
Mill
ions
(1) See Gatsuurt Project Update in Company’s news release October 31, 2017.
The Gatsuurt Project is ~90 km north of Ulaanbaatar
January 2018
Gatsuurt: Gold Development Project
Mine Type Open Pit
Avg. LOM Annual Production 111koz Au
Avg. LOM AISC(1) (US$/oz) $870
Reserve Mine Life 10 years
LOM Development Capex (US$MM) $245
LOM Sustaining Capital (US$MM) $37
P&P Reserves(2)(Moz) 1.3
Au grade (g/t) 2.7
Life of Mine Recovery 84%
Life of Mine Strip Ratio (w:o) 4.7:1
IRR (after tax) 9%
NPV(5%) - after tax (US$MM) $39
35
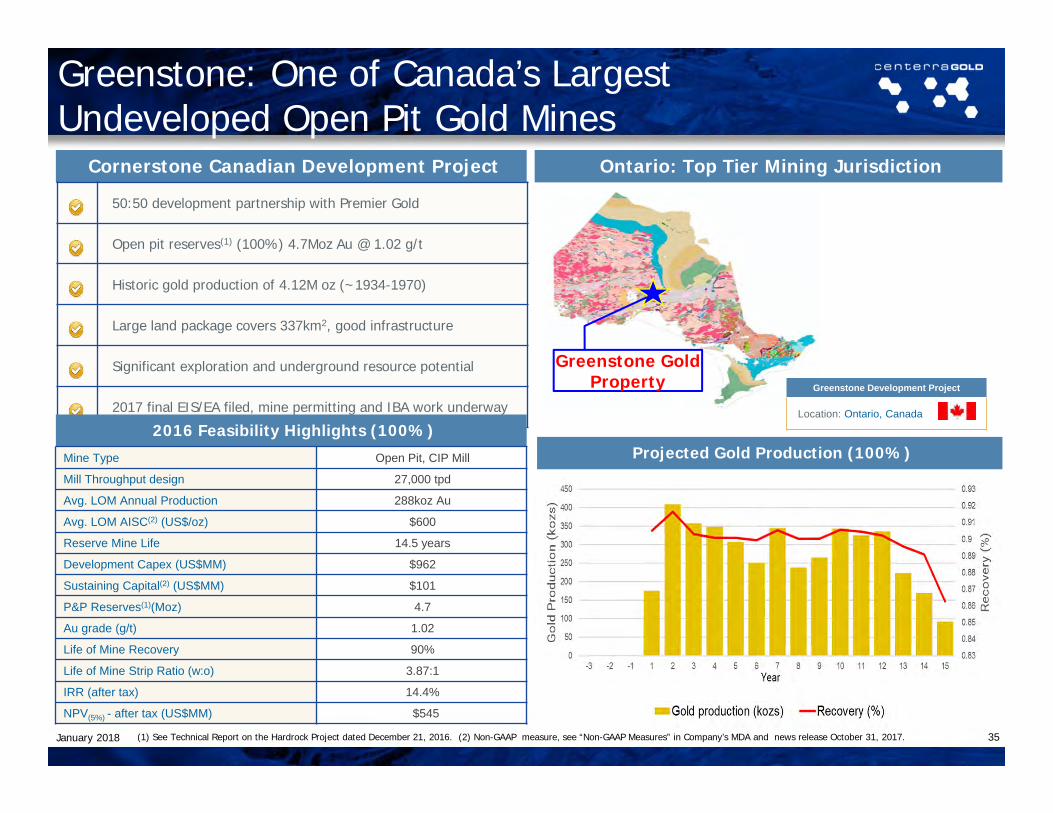
Cornerstone Canadian Development Project
50:50 development partnership with Premier Gold
Open pit reserves(1) (100%) 4.7Moz Au @ 1.02 g/t
Historic gold production of 4.12M oz (~1934-1970)
Large land package covers 337km2, good infrastructure
Significant exploration and underground resource potential
2017 final EIS/EA filed, mine permitting and IBA work underway
Ontario: Top Tier Mining Jurisdiction
Greenstone GoldProperty Greenstone Development Project
Location: Ontario, Canada
January 2018
2016 Feasibility Highlights (100%)
Mine Type Open Pit, CIP Mill
Mill Throughput design 27,000 tpd
Avg. LOM Annual Production 288koz Au
Avg. LOM AISC(2) (US$/oz) $600
Reserve Mine Life 14.5 years
Development Capex (US$MM) $962
Sustaining Capital(2) (US$MM) $101
P&P Reserves(1)(Moz) 4.7
Au grade (g/t) 1.02
Life of Mine Recovery 90%
Life of Mine Strip Ratio (w:o) 3.87:1
IRR (after tax) 14.4%
NPV(5%) - after tax (US$MM) $545
Projected Gold Production (100%)
Greenstone: One of Canada’s Largest Undeveloped Open Pit Gold Mines
(1) See Technical Report on the Hardrock Project dated December 21, 2016. (2) Non-GAAP measure, see “Non-GAAP Measures” in Company’s MDA and news release October 31, 2017.
Greenstone: One of Canada’s Largest Undeveloped Open Pit Gold Mines
36
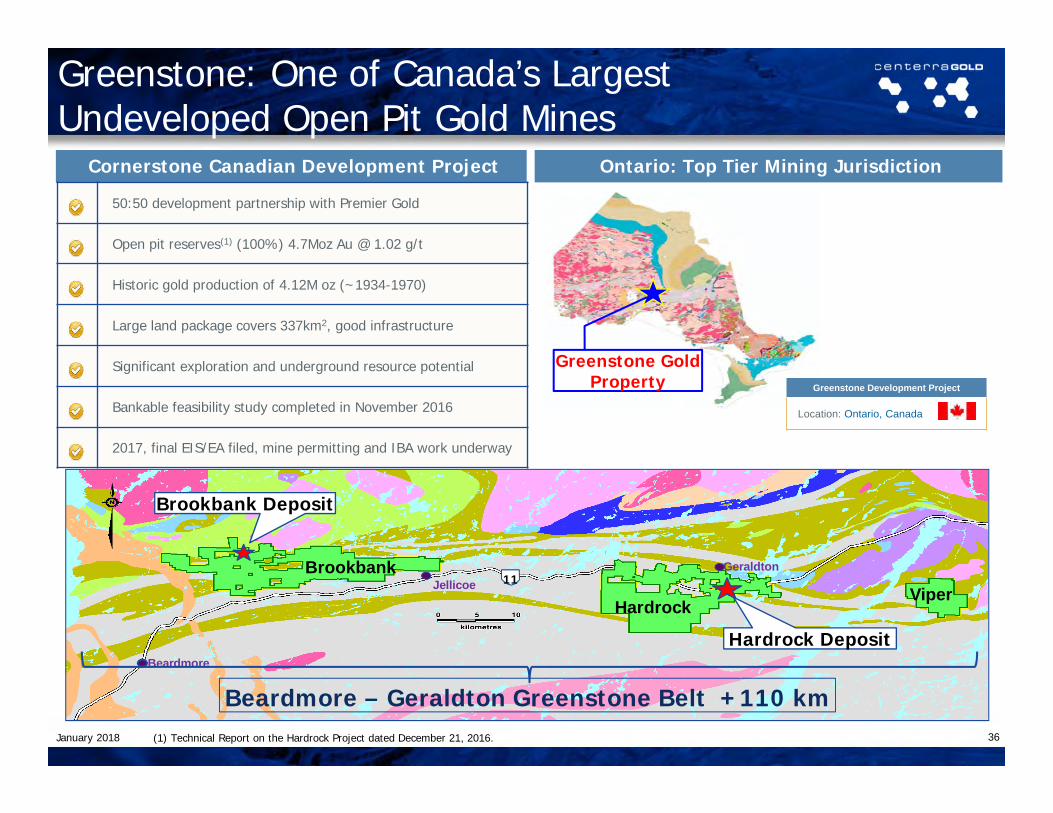
Cornerstone Canadian Development Project
50:50 development partnership with Premier Gold
Open pit reserves(1) (100%) 4.7Moz Au @ 1.02 g/t
Historic gold production of 4.12M oz (~1934-1970)
Large land package covers 337km2, good infrastructure
Significant exploration and underground resource potential
Bankable feasibility study completed in November 2016
2017, final EIS/EA filed, mine permitting and IBA work underway
Ontario: Top Tier Mining Jurisdiction
Greenstone GoldProperty Greenstone Development Project
Location: Ontario, Canada
Geraldton
Beardmore
JellicoeBrookbank
HardrockViper
11
Beardmore – Geraldton Greenstone Belt +110 km
Brookbank Deposit
Hardrock Deposit
January 2018 (1) Technical Report on the Hardrock Project dated December 21, 2016.
Centerra: Q3 - 2017 Corporate Update
37
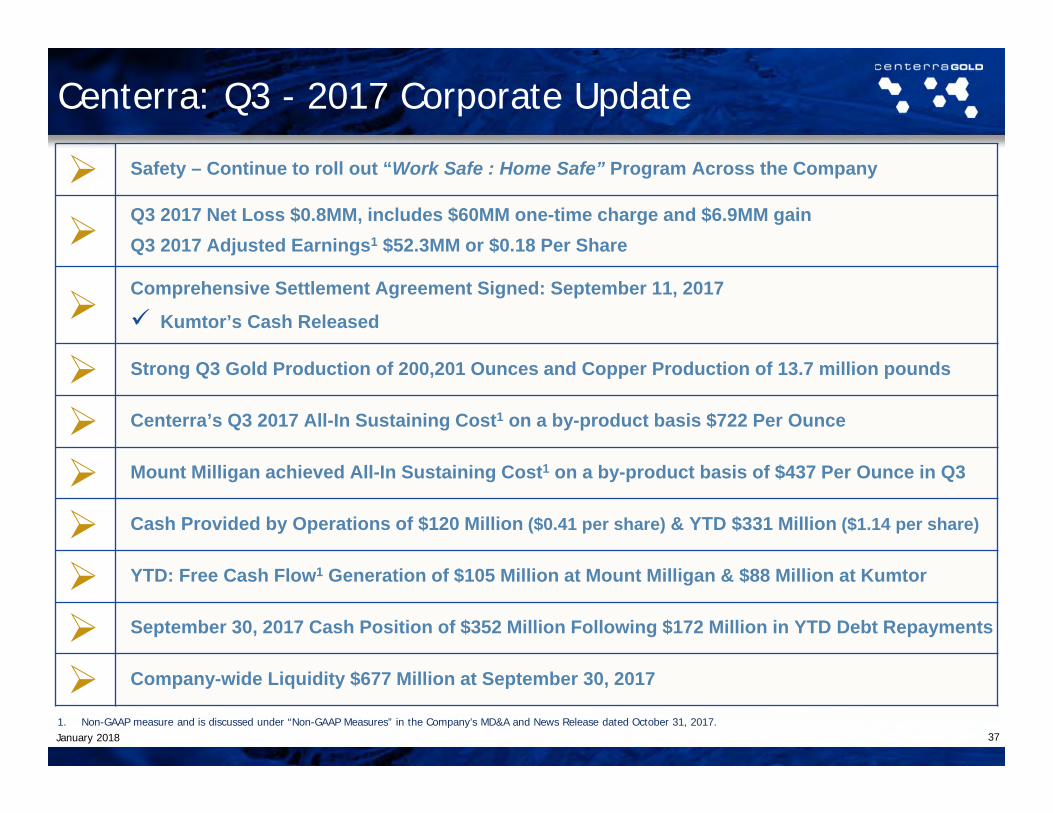
Safety – Continue to roll out “Work Safe : Home Safe” Program Across the Company
Q3 2017 Net Loss $0.8MM, includes $60MM one-time charge and $6.9MM gainQ3 2017 Adjusted Earnings1 $52.3MM or $0.18 Per Share
Comprehensive Settlement Agreement Signed: September 11, 2017
Kumtor’s Cash Released
Strong Q3 Gold Production of 200,201 Ounces and Copper Production of 13.7 million pounds
Centerra’s Q3 2017 All-In Sustaining Cost1 on a by-product basis $722 Per Ounce
Mount Milligan achieved All-In Sustaining Cost1 on a by-product basis of $437 Per Ounce in Q3
Cash Provided by Operations of $120 Million ($0.41 per share) & YTD $331 Million ($1.14 per share)
YTD: Free Cash Flow1 Generation of $105 Million at Mount Milligan & $88 Million at Kumtor
September 30, 2017 Cash Position of $352 Million Following $172 Million in YTD Debt Repayments
Company-wide Liquidity $677 Million at September 30, 2017
1. Non-GAAP measure and is discussed under “Non-GAAP Measures” in the Company’s MD&A and News Release dated October 31, 2017.January 2018
Centerra: Q3 – 2017 Operating Highlights
38
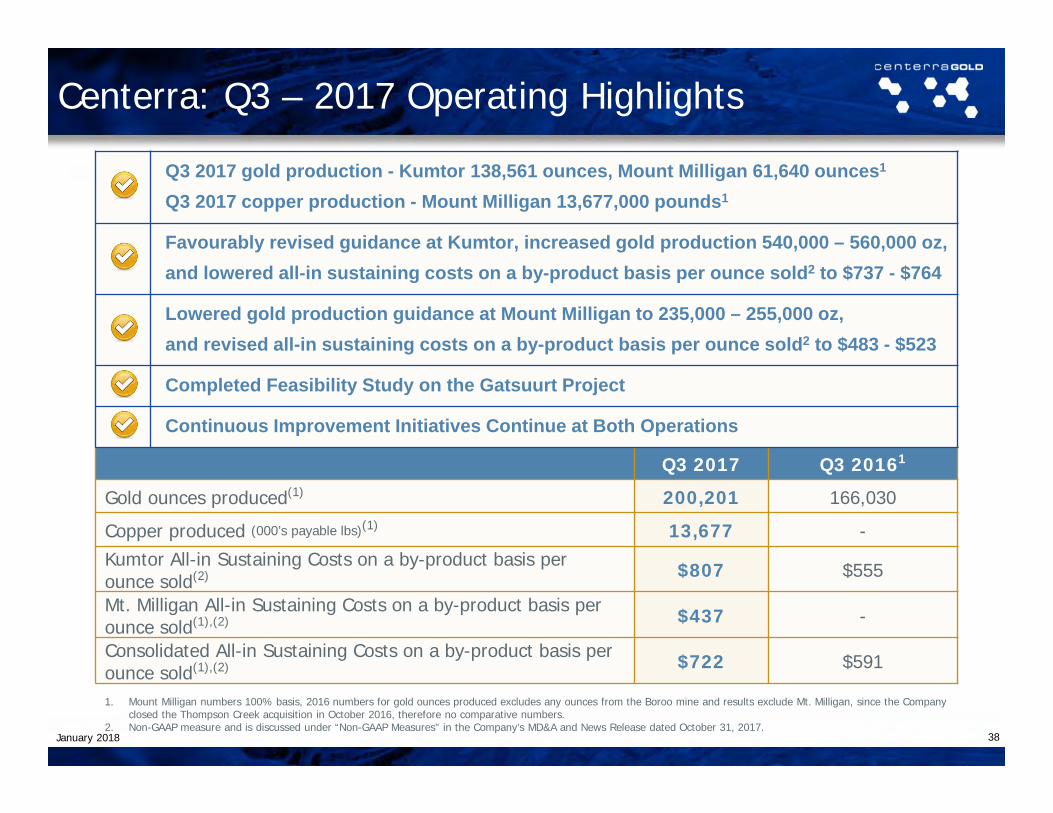
Q3 2017 Q3 20161
Gold ounces produced(1) 200,201 166,030
Copper produced (000’s payable lbs)(1) 13,677 -Kumtor All-in Sustaining Costs on a by-product basis perounce sold(2) $807 $555
Mt. Milligan All-in Sustaining Costs on a by-product basis per ounce sold(1),(2) $437 -
Consolidated All-in Sustaining Costs on a by-product basis per ounce sold(1),(2) $722 $591
1. Mount Milligan numbers 100% basis, 2016 numbers for gold ounces produced excludes any ounces from the Boroo mine and results exclude Mt. Milligan, since the Company closed the Thompson Creek acquisition in October 2016, therefore no comparative numbers.
2. Non-GAAP measure and is discussed under “Non-GAAP Measures” in the Company’s MD&A and News Release dated October 31, 2017.
Q3 2017 gold production - Kumtor 138,561 ounces, Mount Milligan 61,640 ounces1
Q3 2017 copper production - Mount Milligan 13,677,000 pounds1
Favourably revised guidance at Kumtor, increased gold production 540,000 – 560,000 oz,and lowered all-in sustaining costs on a by-product basis per ounce sold2 to $737 - $764
Lowered gold production guidance at Mount Milligan to 235,000 – 255,000 oz,and revised all-in sustaining costs on a by-product basis per ounce sold2 to $483 - $523
Completed Feasibility Study on the Gatsuurt Project
Continuous Improvement Initiatives Continue at Both Operations
January 2018
Centerra: Q3 – 2017 Financial Highlights1
39
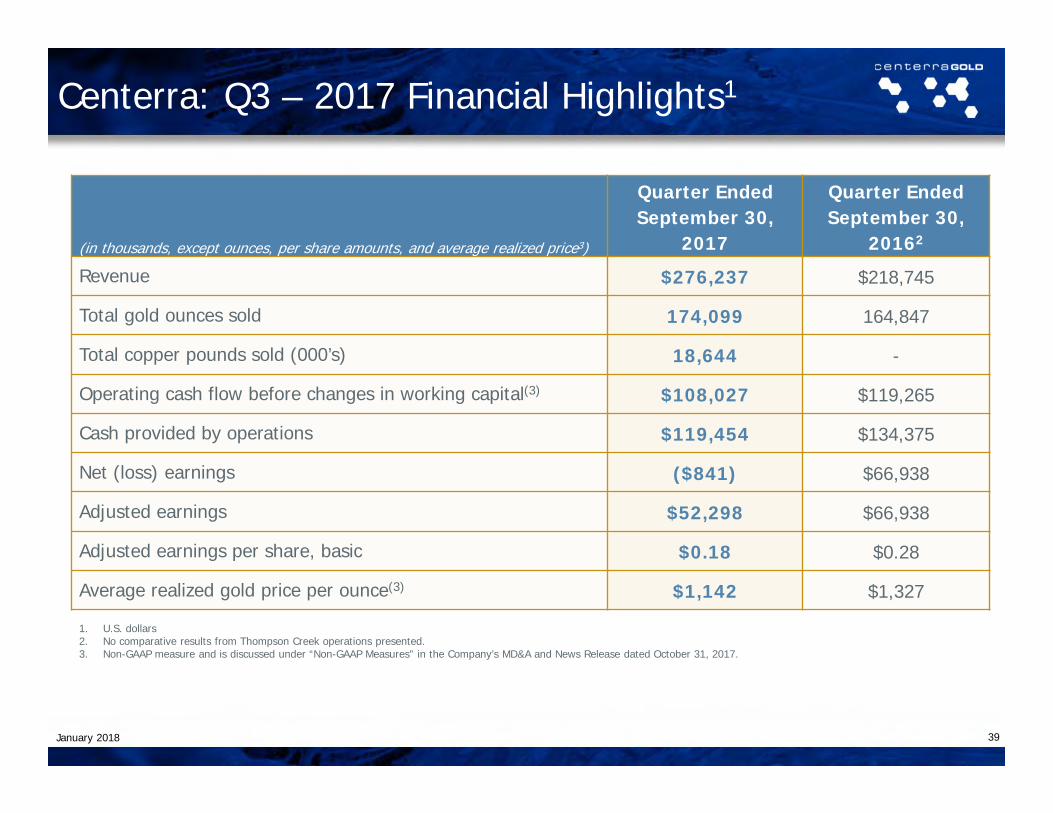
(in thousands, except ounces, per share amounts, and average realized price3)
Quarter EndedSeptember 30,
2017
Quarter EndedSeptember 30,
20162
Revenue $276,237 $218,745
Total gold ounces sold 174,099 164,847
Total copper pounds sold (000’s) 18,644 -
Operating cash flow before changes in working capital(3) $108,027 $119,265
Cash provided by operations $119,454 $134,375
Net (loss) earnings ($841) $66,938
Adjusted earnings $52,298 $66,938
Adjusted earnings per share, basic $0.18 $0.28
Average realized gold price per ounce(3) $1,142 $1,327
1. U.S. dollars2. No comparative results from Thompson Creek operations presented.3. Non-GAAP measure and is discussed under “Non-GAAP Measures” in the Company’s MD&A and News Release dated October 31, 2017.
January 2018
Centerra: 2017 Revised Guidance – Q3
40
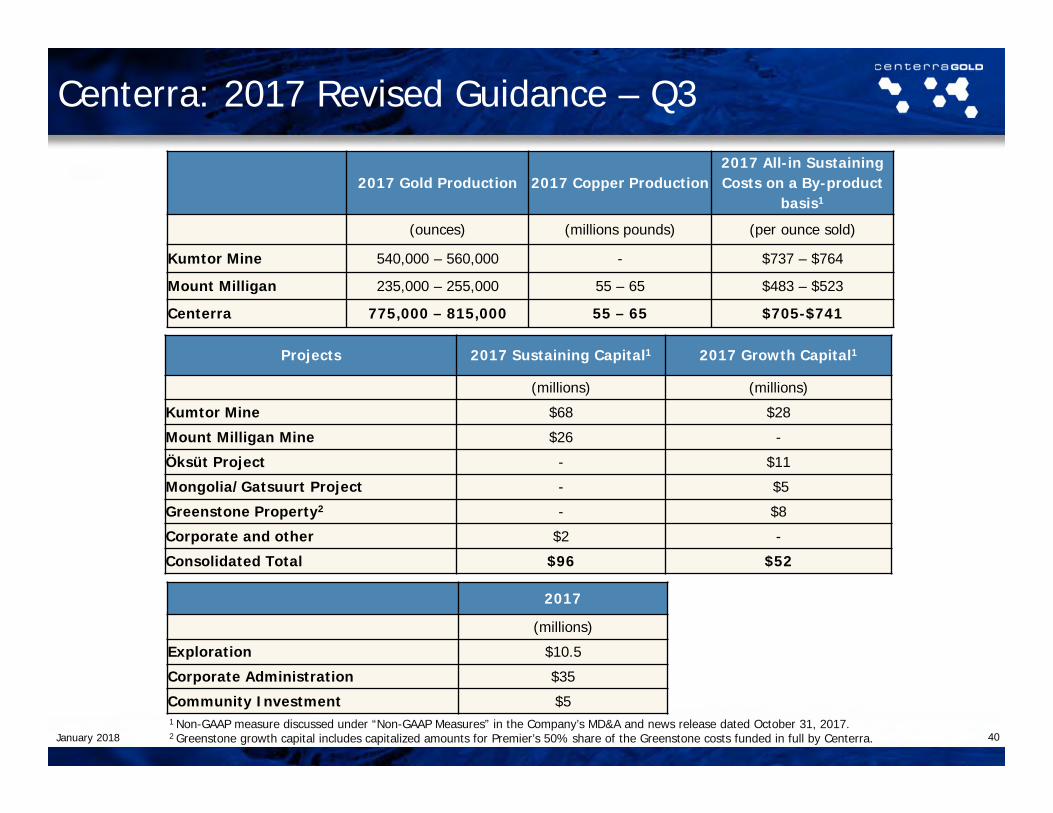
2017 Gold Production 2017 Copper Production2017 All-in Sustaining Costs on a By-product
basis1
(ounces) (millions pounds) (per ounce sold)
Kumtor Mine 540,000 – 560,000 - $737 – $764
Mount Milligan 235,000 – 255,000 55 – 65 $483 – $523
Centerra 775,000 – 815,000 55 – 65 $705-$741
1 Non-GAAP measure discussed under “Non-GAAP Measures” in the Company’s MD&A and news release dated October 31, 2017.2 Greenstone growth capital includes capitalized amounts for Premier’s 50% share of the Greenstone costs funded in full by Centerra.
Projects 2017 Sustaining Capital1 2017 Growth Capital1
(millions) (millions)
Kumtor Mine $68 $28
Mount Milligan Mine $26 -
Öksüt Project - $11
Mongolia/Gatsuurt Project - $5
Greenstone Property2 - $8
Corporate and other $2 -
Consolidated Total $96 $52
2017
(millions)
Exploration $10.5
Corporate Administration $35
Community Investment $5
January 2018
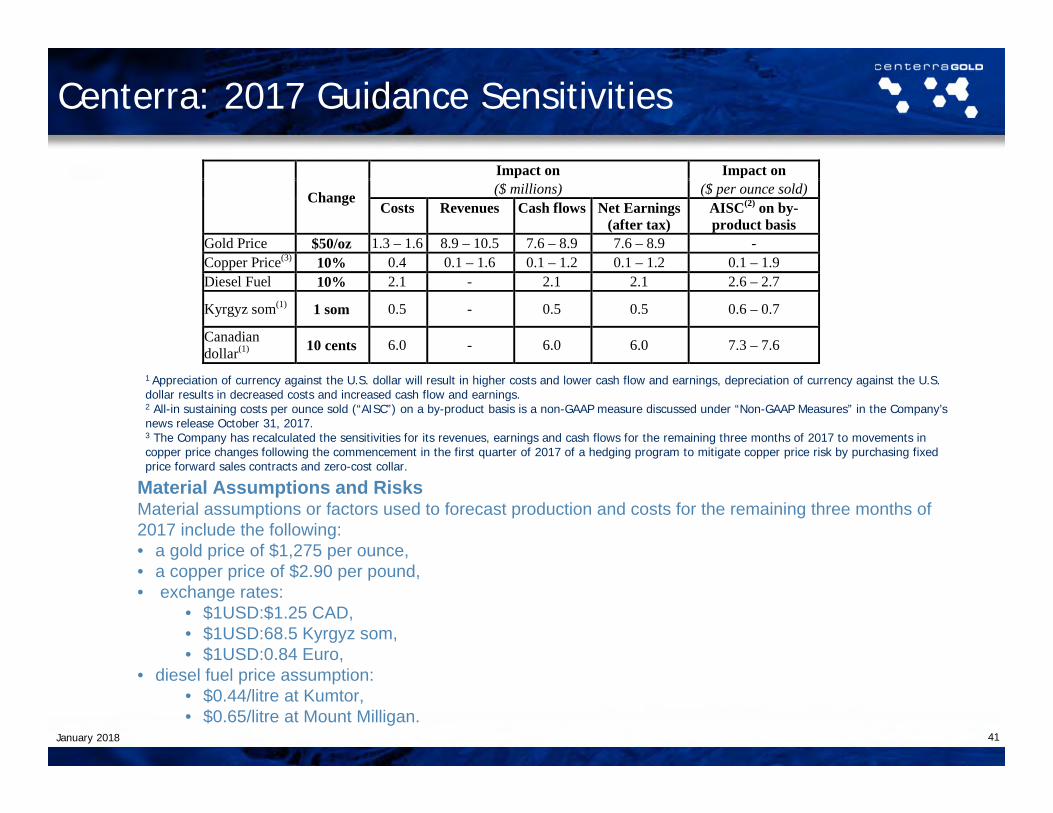
1 Appreciation of currency against the U.S. dollar will result in higher costs and lower cash flow and earnings, depreciation of currency against the U.S. dollar results in decreased costs and increased cash flow and earnings.2 All-in sustaining costs per ounce sold (“AISC”) on a by-product basis is a non-GAAP measure discussed under “Non-GAAP Measures” in the Company’s news release October 31, 2017.3 The Company has recalculated the sensitivities for its revenues, earnings and cash flows for the remaining three months of 2017 to movements in copper price changes following the commencement in the first quarter of 2017 of a hedging program to mitigate copper price risk by purchasing fixed price forward sales contracts and zero-cost collar.
Centerra: 2017 Guidance Sensitivities
41
Material Assumptions and RisksMaterial assumptions or factors used to forecast production and costs for the remaining three months of 2017 include the following:• a gold price of $1,275 per ounce,• a copper price of $2.90 per pound,• exchange rates:
• $1USD:$1.25 CAD,• $1USD:68.5 Kyrgyz som,• $1USD:0.84 Euro,
• diesel fuel price assumption: • $0.44/litre at Kumtor,• $0.65/litre at Mount Milligan.
Change
Impact on Impact on ($ millions) ($ per ounce sold)
Costs Revenues Cash flows Net Earnings(after tax)
AISC(2) on by-product basis
Gold Price $50/oz 1.3 – 1.6 8.9 – 10.5 7.6 – 8.9 7.6 – 8.9 - Copper Price(3) 10% 0.4 0.1 – 1.6 0.1 – 1.2 0.1 – 1.2 0.1 – 1.9 Diesel Fuel 10% 2.1 - 2.1 2.1 2.6 – 2.7
Kyrgyz som(1) 1 som 0.5 - 0.5 0.5 0.6 – 0.7
Canadian dollar(1) 10 cents 6.0 - 6.0 6.0 7.3 – 7.6
January 2018
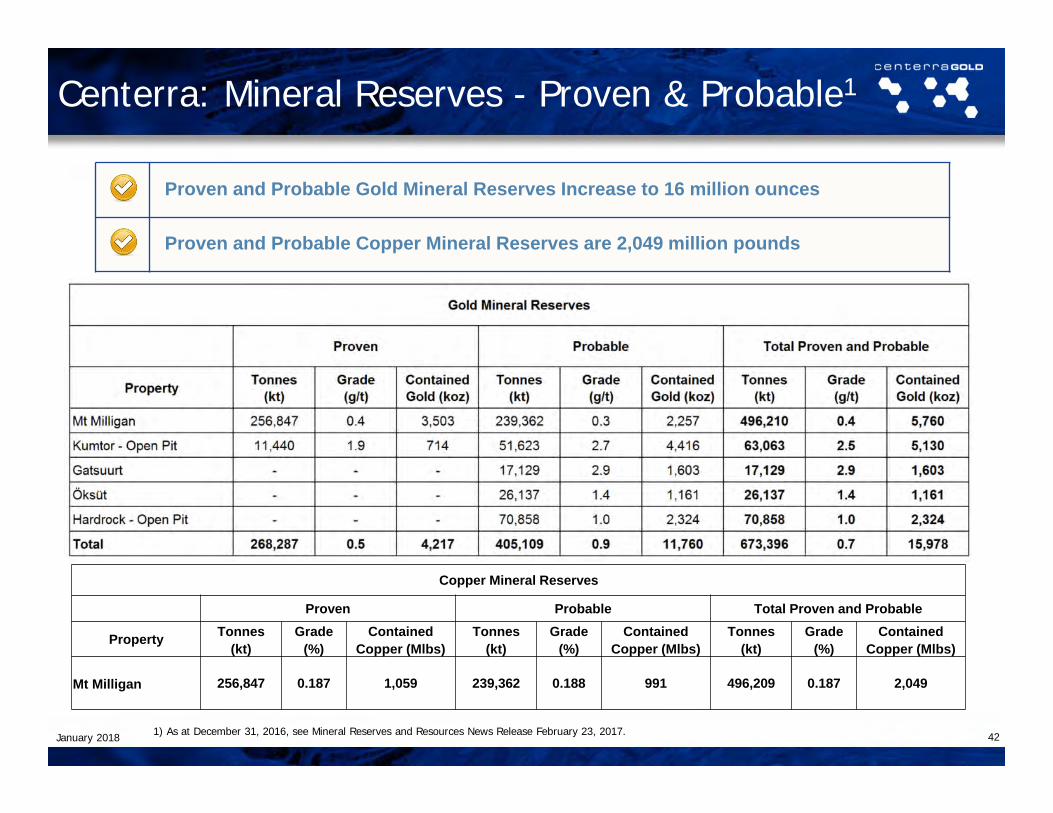
Centerra: Mineral Reserves - Proven & Probable1
Proven and Probable Gold Mineral Reserves Increase to 16 million ounces
Proven and Probable Copper Mineral Reserves are 2,049 million pounds
Copper Mineral Reserves
Proven Probable Total Proven and Probable
Property Tonnes Grade Contained Tonnes Grade Contained Tonnes Grade Contained(kt) (%) Copper (Mlbs) (kt) (%) Copper (Mlbs) (kt) (%) Copper (Mlbs)
Mt Milligan 256,847 0.187 1,059 239,362 0.188 991 496,209 0.187 2,049
January 2018 421) As at December 31, 2016, see Mineral Reserves and Resources News Release February 23, 2017.
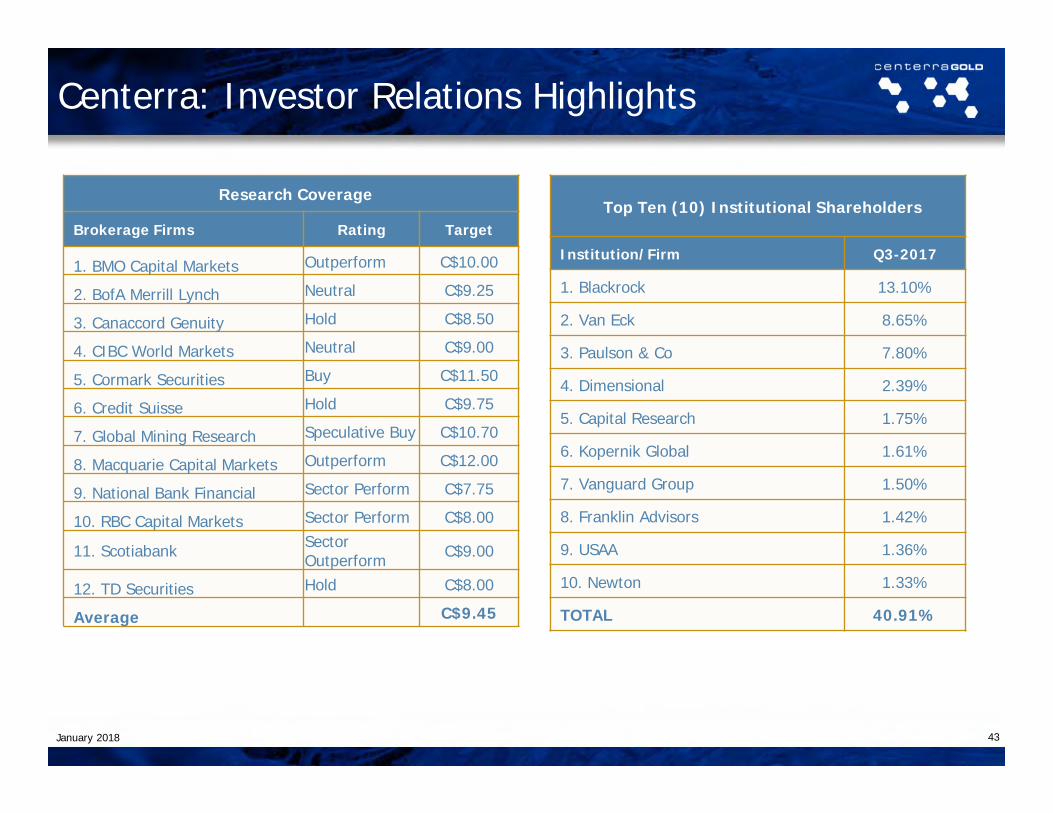
Centerra: Investor Relations Highlights
43
Research Coverage
Brokerage Firms Rating Target
1. BMO Capital Markets Outperform C$10.00
2. BofA Merrill Lynch Neutral C$9.25
3. Canaccord Genuity Hold C$8.50
4. CIBC World Markets Neutral C$9.00
5. Cormark Securities Buy C$11.50
6. Credit Suisse Hold C$9.75
7. Global Mining Research Speculative Buy C$10.70
8. Macquarie Capital Markets Outperform C$12.00
9. National Bank Financial Sector Perform C$7.75
10. RBC Capital Markets Sector Perform C$8.00
11. Scotiabank Sector Outperform C$9.00
12. TD Securities Hold C$8.00
Average C$9.45
Top Ten (10) Institutional Shareholders
Institution/Firm Q3-2017
1. Blackrock 13.10%
2. Van Eck 8.65%
3. Paulson & Co 7.80%
4. Dimensional 2.39%
5. Capital Research 1.75%
6. Kopernik Global 1.61%
7. Vanguard Group 1.50%
8. Franklin Advisors 1.42%
9. USAA 1.36%
10. Newton 1.33%
TOTAL 40.91%
January 2018
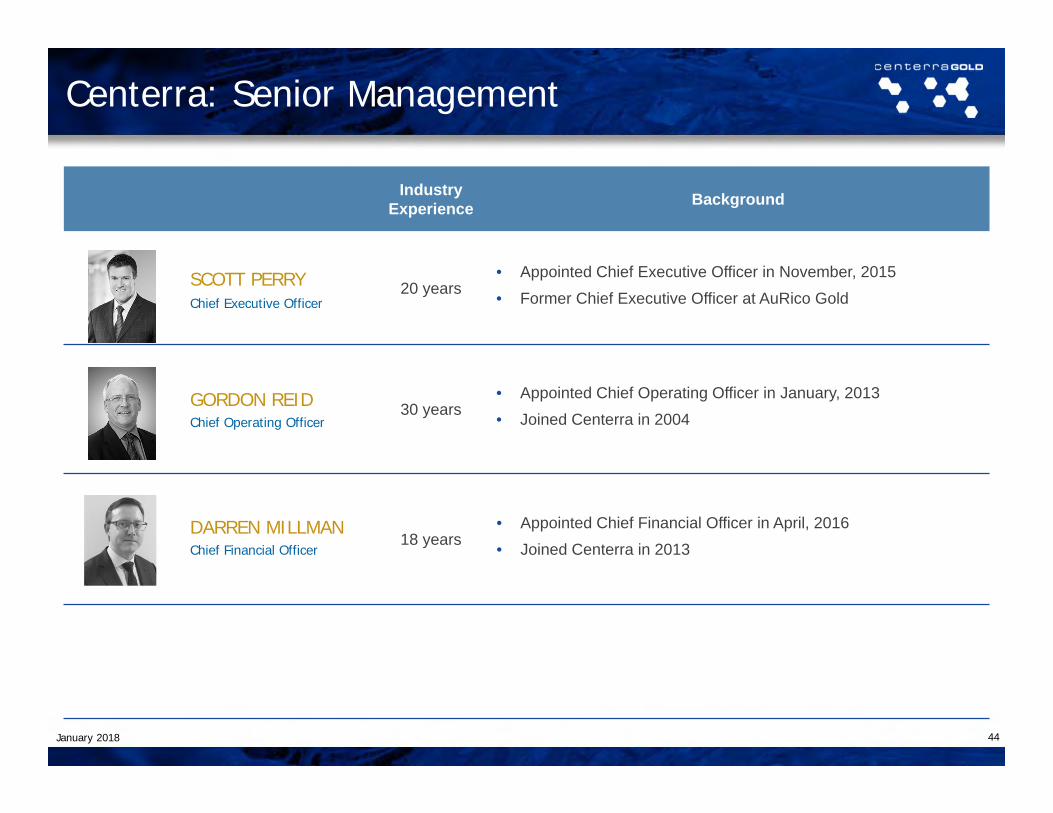
Industry Experience Background
20 years• Appointed Chief Executive Officer in November, 2015
• Former Chief Executive Officer at AuRico Gold
30 years• Appointed Chief Operating Officer in January, 2013
• Joined Centerra in 2004
18 years• Appointed Chief Financial Officer in April, 2016
• Joined Centerra in 2013
SCOTT PERRYChief Executive Officer
GORDON REIDChief Operating Officer
Centerra: Senior Management
DARREN MILLMANChief Financial Officer
44January 2018
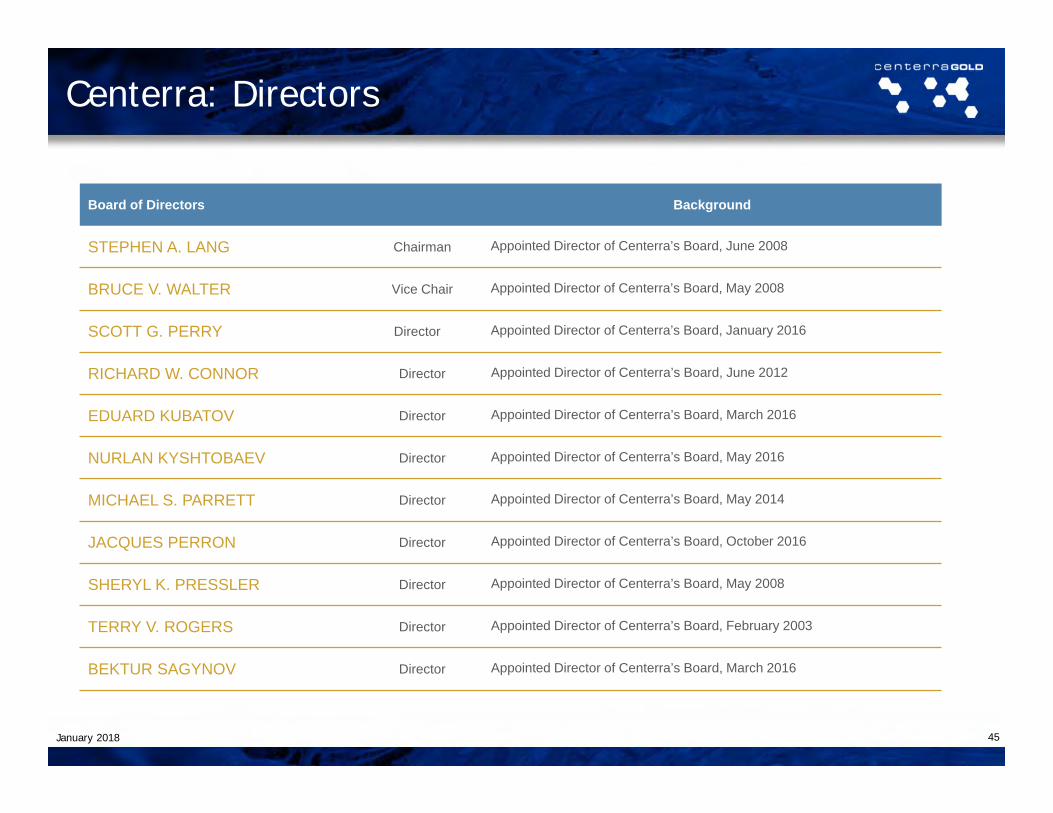
Board of Directors Background
STEPHEN A. LANG Chairman Appointed Director of Centerra’s Board, June 2008
BRUCE V. WALTER Vice Chair Appointed Director of Centerra’s Board, May 2008
SCOTT G. PERRY Director Appointed Director of Centerra’s Board, January 2016
RICHARD W. CONNOR Director Appointed Director of Centerra’s Board, June 2012
EDUARD KUBATOV Director Appointed Director of Centerra’s Board, March 2016
NURLAN KYSHTOBAEV Director Appointed Director of Centerra’s Board, May 2016
MICHAEL S. PARRETT Director Appointed Director of Centerra’s Board, May 2014
JACQUES PERRON Director Appointed Director of Centerra’s Board, October 2016
SHERYL K. PRESSLER Director Appointed Director of Centerra’s Board, May 2008
TERRY V. ROGERS Director Appointed Director of Centerra’s Board, February 2003
BEKTUR SAGYNOV Director Appointed Director of Centerra’s Board, March 2016
Centerra: Directors
45January 2018
TSX: CGwww.centerragold.com