Embed Size (px)
Citation preview

INVESTOR PRESENTATIONF e br u a r y 2 0 1 8
R-City Ghatkopar, Mumbai
Disclaimer
2
This presentation and the following discussion may contain “forward looking statements” by Inox Leisure Limited (“ILL” or “theCompany”) that are not historical in nature. These forward looking statements, which may include statements relating to future stateof affairs, results of operations, financial condition, business prospects, plans and objectives, are based on the current beliefs,assumptions, expectations, estimates, and projections of the management of ILL about the business, industry and markets in which ILLoperates.
These statements are not guarantees of future performance, and are subject to known and unknown risks, uncertainties, and otherfactors, some of which are beyond ILL’s control and difficult to predict, that could cause actual results, performance or achievementsto differ materially from those in the forward looking statements.
Such statements are not, and should not be construed, as a representation as to future performance or achievements of ILL. Inparticular, such statements should not be regarded as a projection of future performance of ILL. It should be noted that the actualperformance or achievements of ILL may vary significantly from such statements.
Due to rounding-off, figures presented throughout this document may not add up precisely to the totals provided and percentagesmay not precisely reflect the rounded-off figures.
All financial figures, upto and including FY15 are as per IGAAP and for FY16 and thereafter are as per IND-AS. Revenues for FY13 toFY15 are shown net of entertainment tax, to be consistent with the revenues under IND-AS for FY16 and FY17
3
D I S C U S S I O N S U M M A R Y
I N D U S T R Y O V E R V I E W
C O M P A N Y O V E R V I E W
C O M P E T I T I V E A D V A N T A G E & O U T L O O K
A N N E X U R E
Atria, Worli, Mumbai
4
INDUSTRY OVERVIEW
CR2, Nariman Point, Mumbai

Strong Fundamentals & Huge Growth Potential
5
125
95 80
60 57 40
26 25 16 12 10 8
US France Spain UK Germany South Korea Japan Taiwan China Thailand Brazil India
H o w e v e r , I n d i a ’ s S c r e e n D e n s i t y i s O n e o f t h e L o w e s t
Screens / Million population
Source: CRISIL Report, http://uis.unesco.org/en/news/cinema-data-release (2015)
2,178 1,930
1,364
208 197 176 171 169 156 146
China India US France Mexico UK Japan S. Korea Germany Russia
2 n d H i g h e s t N u m b e r O f T h e a t r e F o o t f a l l s i n t h e W o r l d
Footfalls in Million2,000
791686
581
300 298 269 255 226 185
-4 00
100
600
1,10 0
1,60 0
2,10 0
India US China Japan France UK S. Korea Spain Germany Italy
H i g h e s t N u m b e r o f F i l m P r o d u c e d i n t h e W o r l d

Steady Performance and Resilience
6
85.1 93.4 93.5 101.4 99.8 106.6 111.8 117.9 124.2 131.2
112.4125.3 126.4
138.1 142.4155.0
166.0178.2
191.6206.6
0
50
100
150
200
250
2012 2013 2014 2015 2016 2017E 2018E 2019E 2020E 2021E
Domestic Theatrical Overseas Theatrical Home Video Cable & Satellite Rights Ancilliary Revenue Streams
In Rs. Billion
CAGR 6.1%
CAGR 7.7%
I n d i a n F i l m I n d u s t r y D i s p l a y s S t e a d y P e r f o r m a n c e T r e n d s
D o m e s t i c T h e a t r i c a l s C o n s t i t u t e s 7 0 % O f T o t a l F i l m I n d u s t r y
Source: FICCI-KPMG 2017 Report
70%
8%
1%
11%
11%
Domestic Theatrical
Overseas Theatrical
Home Video
Cable & Satellite Rights
Ancillary Revenue Streams
2016

Multiplexes Witnessing Rapid Growth
7
FACTORS DRIVING GROWTH IN
MULTIPLEXES:
Strong demographics, rising disposable
incomes and discretionary spends.
Superior location, destination and
parking facilities.
Multiple screens in one location offer a
wider variety of content to the patrons.
Different screen sizes provide
programming flexibility. This results in
higher occupancy ratios.
State of art equipment (high quality
video and audio), superior interiors,
ambience and service.
Source: CRISIL Report, FICCI-KPMG Report 2017, Industry Sources, Internal Estimates
M u l t i p l e x e s c u r r e n t l y a c c o u n t f o r ~ 3 0 % m a r k e t s h a r e o f t h e s c r e e n s ,
h o w e v e r t h e y a c c o u n t f o r m o r e t h a n 4 5 % o f b o x o f f i c e
c o l l e c t i o n s
Number of Screens
9,3
08
9,1
21
8,6
85
8,4
51
8,0
02
6,0
00
6,0
00
6,0
00
1,0
75
1,2
25
1,3
50
1,5
00
1,6
30
2,1
34
2,2
25
2,5
13
-
1,00 0
2,00 0
3,00 0
4,00 0
5,00 0
6,00 0
7,00 0
8,00 0
9,00 0
10,0 00
2010 2011 2012 2013 2014 2015 2016 Feb18
Single Screens Multiplexes

Increasing Number Of INR 1bn + Movies
8
1,000 1,598
2,065 2,101 2,638 3,014
3,446 3,359
5,200 4,500
5,300
6,500
3 Idiots(2009)
Dabaang(2010)
Bodyguard(2011)
Ek Tha Tiger(2012)
Dabaang 2(2012)
ChennaiExpress(2013)
Dhoom 3(2013)
Kick(2014)
P.K(2014)
BajrangiBhaijaan(2015)
Dangal(2016)
Bahubali 2 -The
Conclusion(2017)
1 2
5
9 6 7
5 8 7
1
2 1
1
- 3
- --
-
-- 1
1
2 2
2008 2009 2010 2011 2012 2013 2014 2015 2016 Jan-17 to Feb-18
INR 1Bn to 1.99Bn INR 2Bn to 2.99 Bn INR 3Bn and above
Wider Screen Releases
Higher Number Of INR 1 Bn + Movies
INCREASING NUMBER OF
MOVIES ARE GENERATING MORE
THAN RS 1 BN IN NET BOX OFFICE
COLLECTIONS DRIVEN BY WIDER
SCREEN RELEASES AND
FACILITATED BY DIGITISATION OF
CONTENT DELIVERY
Source: Industry

I n d i a ’ s C o n s u m p t i o n S t o r y
9
Target Audience (Middle & Affluent Class) is estimated to grow from 268 million in 2015 to 614 million in 2025
As much as 70% of household income will be spent on discretionary spending in 2025
Source: Mckinsey - Tracking the growth of Indias Middle Class - 2017
6148 39 30
3952 61 70
1995 2005 2015 2025
Necessities Discretionary
%Share of Average Annual Household Consumption
%Share of Population by Income Bracket
9380
54
3522
618
41
43
36
1 25
22
42
0
10
20
30
40
50
60
70
80
90
100
1985 1995 2005 2015 2025
Lower Class Lower Middle Class Middle & Affluent Class
755 928
1,107 1,278
1,429
-
200
400
600
800
1,00 0
1,20 0
1,40 0
1,60 0
1985 1995 2005 2015 2025
Population of India (Million)
Based on Annual Household Income• Lower Class: < Rs.90,000• Lower Middle Class: Rs.90,000 to Rs.199,999• Middle & Affluent Class: > Rs.200,000

10
Company Overview
Atria, Worli, Mumbai

Track Record of Aggressive Expansion
11
8 12 25 35 5176 91
119
239 257 279310
372420
468 488
2 3 6 9 1422 26 32
63 68 72 7996
107118 122
-50
-30
-10
10
30
50
70
90
110
130
0
100
200
300
400
500
600FY
03
FY04
FY05
FY06
FY0
7
FY08
FY09
FY10
FY11
FY12
FY13
FY14
FY15
FY16
FY1
7
Feb
-18
Screens Properties
Note: Includes Acquisition of 89 Cinemas in FY07, Fame in FY11 and Satyam in FY15
ON AN AVERAGE ADDITION OF 3 SCREENS EVERY MONTH SINCE INCEPTION

PAN India Presence
12
ONE OF THE LARGEST MULTIPLEX CHAIN OPERATOR IN INDIA
* Includes 8 management properties with 29 screens and 7,370 seats
KERALA |1 Property | 6 Screens
19States
60Cities
122Properties
488Screens
121,281Seats
JHARKHAND | 1 Property | 4 Screens
WEST BENGAL | 14 Properties | 55 Screens
ODISHA | 1 Property | 3 Screens
CHHATTISGARH | 2 Properties | 8 Screens
TELANGANA | 2 Properties | 11 Screens
ANDHRA PRADESH | 7 Properties | 28 ScreensKARNATAKA |10 Properties | 40 Screens
GOA | 4 Properties | 14 Screens
MAHARASHTRA | 27 Properties | 118 Screens
GUJARAT | 16 Properties | 67 Screens
MADHYA PRADESH | 4 Properties | 16 Screens
RAJASTHAN | 13 Properties | 43 Screens
HARYANA | 5 Properties | 16 Screens
TAMIL NADU | 3 Properties | 14 Screens
UTTAR PRADESH | 6 Properties | 24 Screens
DELHI | 4 Properties | 13 Screens
PUNJAB | 1 Property | 6 Screens
Assam | 1 Property | 2 Screens

13
Introducing the ‘THEATRE OF DREAMS’…
INOX INSIGNIA at Atria Mall, Worli Mumbai
• Theatres with opulent recliners
• Personalized ticketing and butler-on-call
• Gourmet Menu curated by Celebrity Chef Vicky Ratnani
• Staff Uniforms crafted by Arjun Khanna
• Live food counter serving gourmet delights
• A new level of luxury paired with bespoke interiors
• Laser projection with Dolby Atmos Sound and 3D
powered by Volfoni systems

14
Introducing the all new 7 STAR
METRO INOX MUMBAI’S GREATEST LOVE STORY…
• 6 Screens, 1271 seats
• Mumbai’s first kids theatre - KIDDLES
• Cafe UNWIND
• Advanced 4K Projection
• Augmented Reality
• Dolby Atmos
• Volfoni 3D

15
Atria, Worli, Mumbai

16
GVK One, Hyderabad
17
CR2, Nariman Point, Mumbai

18
Mantri Square, Bangalore
19
Quest, Kolkata

20
INSIGNIA – LUXURY MOVIE
WATCHING EXPERIENCE
R-City Ghatkopar, Mumbai

21
Atria, Worli, Mumbai

22
R-City, Ghatkopar, Mumbai
23
Mantri Square, Bangalore

24
Amanora, Pune

25
VR Surat, Surat

26
Bund Garden, Pune

R e v e n u e f r o m O p e r a t i o n s
27All figures in INR Crs., unless specified
298.0
325.9
280 .0
285 .0
290 .0
295 .0
300 .0
305 .0
310 .0
315 .0
320 .0
325 .0
330 .0
Q3FY17 Q3FY18
9%
10%
932.2
1,024.5
880 .0
900 .0
920 .0
940 .0
960 .0
980 .0
1,00 0.0
1,02 0.0
1,04 0.0
9MFY17 9MFY18
663.2 762.8
895.4
1,160.6 1,220.7
FY13 FY14 FY15 FY16 FY17
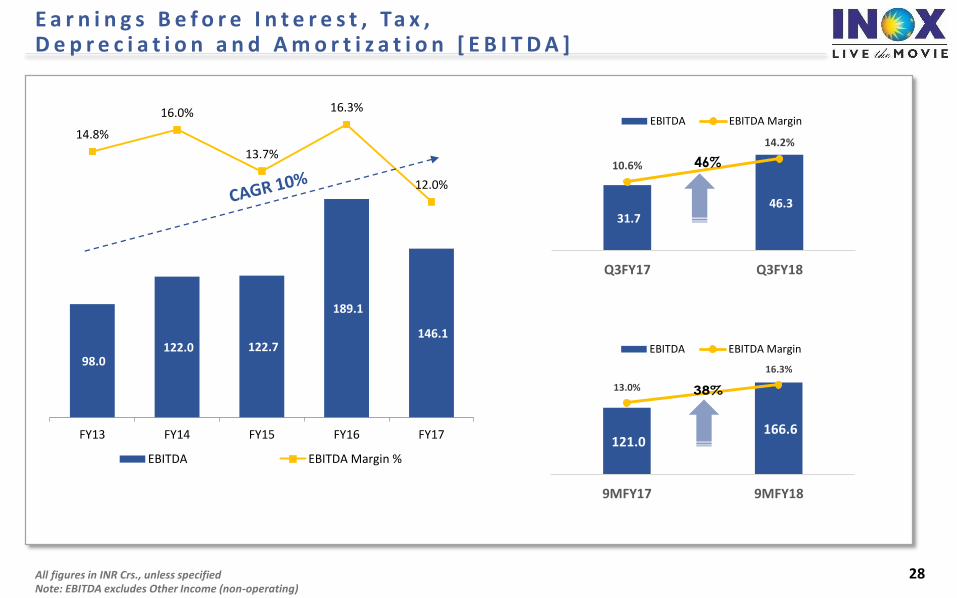
E a r n i n g s B e f o r e I n t e r e s t , Ta x ,D e p r e c i a t i o n a n d A m o r t i z a t i o n [ E B I T D A ]
28All figures in INR Crs., unless specified
98.0 122.0 122.7
189.1
146.1
14.8%
16.0%
13.7%
16.3%
12.0%
0.0 %
2.0 %
4.0 %
6.0 %
8.0 %
10. 0%
12. 0%
14. 0%
16. 0%
18. 0%
FY13 FY14 FY15 FY16 FY17
EBITDA EBITDA Margin %
31.7 46.3
10.6%
14.2%
0.0%
2.0%
4.0%
6.0%
8.0%
10.0%
12.0%
14.0%
16.0%
-
5.0
10.0
15.0
20.0
25.0
30.0
35.0
40.0
45.0
50.0
Q3FY17 Q3FY18
EBITDA EBITDA Margin
46%
121.0 166.6
13.0%
16.3%
0.0%
2.0%
4.0%
6.0%
8.0%
10.0%
12.0%
14.0%
16.0%
18.0%
-
20.0
40.0
60.0
80.0
100 .0
120 .0
140 .0
160 .0
180 .0
9MFY17 9MFY18
EBITDA EBITDA Margin
38%
Note: EBITDA excludes Other Income (non-operating)

P r o f i t a f t e r t a x [ PAT ]
29All figures in INR Crs., unless specified
18.5
36.9
20.0
81.0
30.6
2.8%
4.8%
2.2%
7.0%
2.5%
-10.0%
-8.0%
-6.0%
-4.0%
-2.0%
0.0%
2.0%
4.0%
6.0%
8.0%
10.0%
FY13 FY14 FY15 FY16 FY17
PAT PAT Margin %
3.8
13.2 1.3%
4.0%
0.0%
0.5%
1.0%
1.5%
2.0%
2.5%
3.0%
3.5%
4.0%
4.5%
-
2.0
4.0
6.0
8.0
10.0
12.0
14.0
Q3FY17 Q3FY18
PAT PAT Margin
251%
88%
30.3
56.9
3.2%
5.6%
0.0%
1.0%
2.0%
3.0%
4.0%
5.0%
6.0%
-
10.0
20.0
30.0
40.0
50.0
60.0
9MFY17 9MFY18
PAT PAT Margin

R e v e n u e s - S e g m e n t B r e a k u p
30All figures in INR Crs., unless specified
456.7 490.5 551.6 712.8 748.1
141.8 162.3
191.0
265.6 284.1
32.4 49.5
81.5
91.0 96.2
32.3 60.4
71.2
91.1 92.3
-
200 .0
400 .0
600 .0
800 .0
1,00 0.0
1,20 0.0
1,40 0.0
FY13 FY14 FY15 FY16 FY17
NBOC F & B Advertising Others
895.4
1160.61220.7
663.2
762.8176.4 187.9
67.673.1
30.240.323.724.6298.0
325.9
0.0
50.0
100.0
150.0
200.0
250.0
300.0
350.0
Q3FY17 Q3FY18
3.9%
33.3%
8.2%
6.5%
569.4 612.7
218.4228.4
75.3105.769.177.7932.2
1024.5
0.0
200.0
400.0
600.0
800.0
1000.0
1200.0
9MFY17 9MFY18
12.4%
40.4%
4.6%
7.6%
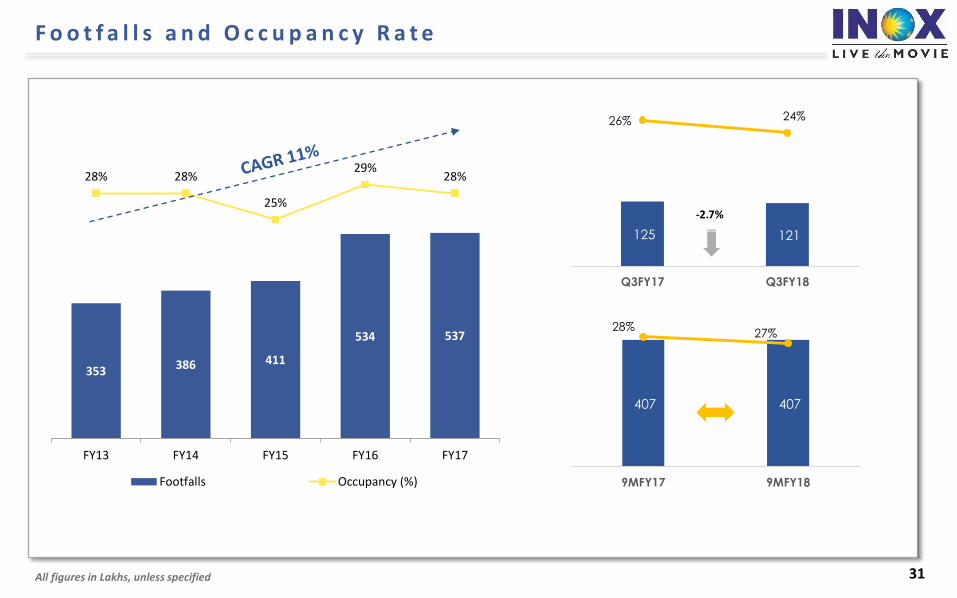
F o o t f a l l s a n d O c c u p a n c y R a t e
31
353 386 411
534 537
28% 28%
25%
29%28%
0%
5%
10%
15%
20%
25%
30%
35%
FY13 FY14 FY15 FY16 FY17
Footfalls Occupancy (%)
All figures in Lakhs, unless specified
125 121
26% 24%
3%
8%
13%
18%
23%
28%
-
50
100
150
200
250
300
Q3FY17 Q3FY18
-2.7%
407 407
28%27%
3%
8%
13%
18%
23%
28%
33%
-
50
100
150
200
250
300
350
400
450
500
9MFY17 9MFY18

A v e r a g e T i c k e t P r i c e [ AT P ]
32
160156
164
170
178
FY13 FY14 FY15 FY16 FY17
All figures in INR, unless specified
182
199
170
175
180
185
190
195
200
205
Q3FY17 Q3FY18
9.6%
179
193
170
175
180
185
190
195
9MFY17 9MFY18
7.3%

S p e n d P e r H e a d [ S P H ]
33
47 4955 58 62
FY13 FY14 FY15 FY16 FY17
All figures in INR, unless specified
63 70
-
10
20
30
40
50
60
70
80
90
100
Q3FY17 Q3FY18
63 66
-
10
20
30
40
50
60
70
80
90
100
9MFY17 9MFY18
10.5%
5.5%

F & B a n d S P H C o n t r i b u t i o n
34
70.0%71.3%
74.1% 75.0% 76.0%
33 35
41 44
47
-
5
10
15
20
25
30
35
40
45
60. 0%
62. 0%
64. 0%
66. 0%
68. 0%
70. 0%
72. 0%
74. 0%
76. 0%
78. 0%
FY13 FY14 FY15 FY16 FY17
F & B Contribution (%) SPH Contribution (Rs.)
76.1% 75.8%
48 53
60.0%
62.0%
64.0%
66.0%
68.0%
70.0%
72.0%
74.0%
76.0%
78.0%
Q3FY17 Q3FY18
-
10
20
30
40
50
F&B Net Contribution(%) SPH Contribution (Rs.)
10.1%
75.8% 76.0%
48 50
60.0%
62.0%
64.0%
66.0%
68.0%
70.0%
72.0%
74.0%
76.0%
78.0%
9MFY17 9MFY18
-
10
20
30
40
50
F&B Net Contribution(%) SPH Contribution (Rs.)
5.7%

A d v e r t i s e m e n t I n c o m e p e r s c r e e n
35
13.8
18.5
25.1 24.6 22.4
FY13 FY14 FY15 FY16 FY17
All figures in INR Lakhs, unless specified
30.2
40.3
-
5.0
10.0
15.0
20.0
25.0
30.0
35.0
40.0
45.0
50.0
Q3FY17 Q3FY18
33.3%
75.3
105.7
-
10.0
20.0
30.0
40.0
50.0
60.0
70.0
80.0
90.0
100.0
9MFY17 9MFY18
40.4%

e
O t h e r O p e r a t i n g I n c o m e P e r S c r e e n
36
13.7
22.5 21.9 24.6
22.7
FY13 FY14 FY15 FY16 FY17
All figures in INR Lakhs, unless specified
23.7 24.6
-
5.0
10.0
15.0
20.0
25.0
30.0
35.0
40.0
45.0
50.0
Q3FY17 Q3FY18
3.9%
69.1 77.7
-
10.0
20.0
30.0
40.0
50.0
60.0
70.0
80.0
90.0
100.0
9MFY17 9MFY18
12.4%
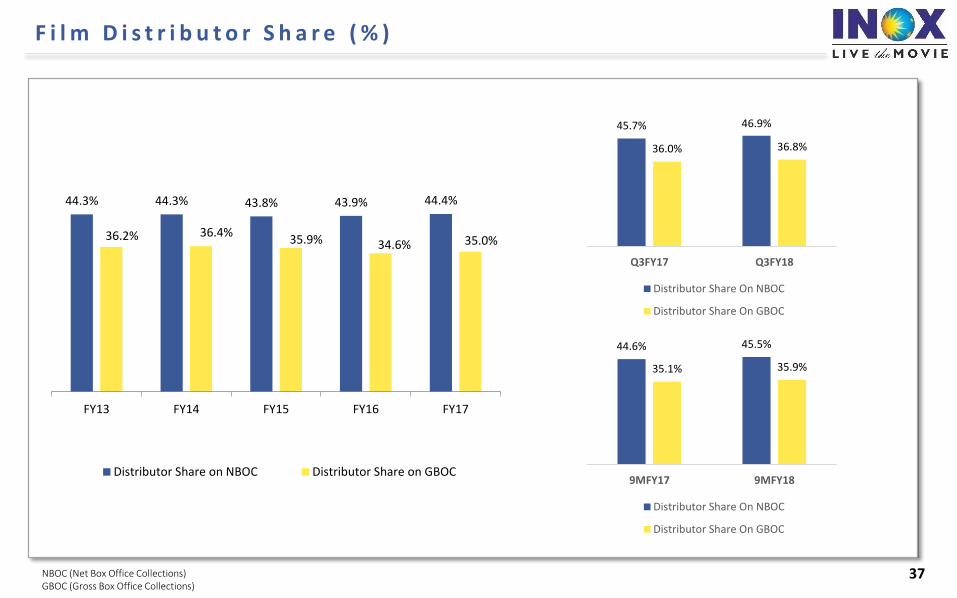
F i l m D i s t r i b u t o r S h a r e ( % )
37
44.3% 44.3% 43.8% 43.9% 44.4%
36.2% 36.4%35.9% 34.6% 35.0%
0.0 %
5.0 %
10. 0%
15. 0%
20. 0%
25. 0%
30. 0%
35. 0%
40. 0%
45. 0%
50. 0%
FY13 FY14 FY15 FY16 FY17
Distributor Share on NBOC Distributor Share on GBOC
NBOC (Net Box Office Collections) GBOC (Gross Box Office Collections)
45.7% 46.9%
36.0% 36.8%
0.0 %
5.0 %
10. 0%
15. 0%
20. 0%
25. 0%
30. 0%
35. 0%
40. 0%
45. 0%
50. 0%
Q3FY17 Q3FY18
Distributor Share On NBOC
Distributor Share On GBOC
44.6% 45.5%
35.1% 35.9%
0.0 %
5.0 %
10. 0%
15. 0%
20. 0%
25. 0%
30. 0%
35. 0%
40. 0%
45. 0%
50. 0%
9MFY17 9MFY18
Distributor Share On NBOC
Distributor Share On GBOC

O t h e r O v e r h e a d s P e r O p e r a t i n g S c r e e n
38
18.1 18.5 20.3 20.1 21.2
39.3 40.2 41.3 44.0 45.6
35.4 39.2 40.8 45.5 42.9
39.8 40.4 43.447.5 52.7
FY13 FY14 FY15 FY16 FY17
Employee Benefits Lease Rental & Hire Charges
CAM, Power & Fuel, R&M Other Overheads
157.0138.3
145.8132.5
162.5
All figures in INR Lakhs, unless specified
16.1 16.4
34.2 35.1
32.6 33.3
39.9 34.8
122.7 119.7
(10.0)
10.0
30.0
50.0
70.0
90.0
110.0
130.0
9MFY17 9MFY18
-12.6%
2.3%
2.7%
1.9%
5.1 5.6
11.3 11.6
10.2 10.0
13.5 11.8
40.1 39.0
-
5.0
10.0
15.0
20.0
25.0
30.0
35.0
40.0
45.0
50.0
Q3FY17 Q3FY18
-12.5%
-2.5%
2.9%
9.6%

39
Compet i t ive Advantage• R e c o g n i s e d A n d T r u s t e d C o r p o r a t e G r o u p
• W e l l D i v e r s i f i e d P r e s e n c e A c r o s s I n d i a
• S t r o n g N e w S c r e e n s P i p e l i n e
• S t r o n g B r a n d P a r t n e r s h i p s
• U n d e r - l e v e r a g e d B a l a n c e S h e e t W i t h F u r t h e r S c o p e F o r D i l u t i o n
• S t a t e O f T h e A r t T e c h n o l o g y , U n m a t c h e d S e r v i c e A n d A m b i e n c e
R-City, Ghatkopar, Mumbai

Substantially exited wind
farming business by selling
246 MW out of 269 MW of
operational capacity
L i s t e d C o m p a n i e s O t h e r K e y C o m p a n i e s
INOX LeisureLimited
Largest producer of (by volume)
Chloromethanes, refrigerants
and Polytetrafluoroethylene in
India.
Pioneer of carbon credits in
India
INOX Air Products Private Limited
50:50 joint venture with Air
Products Inc., USA
Largest producer of industrial
gases in India
40 plants spread throughout
the country
One of the largest multiplex
chains in India
In the business of setting up,
operating and managing a
national chain of multiplexes
under the brand name ‘INOX’
Present in 60 cities with 122
multiplexes and 488 screens
Gujarat FluorochemicalsLimited
Largest producer of cryogenic
liquid storage and transport
tanks in India
Offers comprehensive
solutions in cryogenic storage,
vaporization and distribution
engineering
Has operations in India, USA,
Canada, Netherlands and
Brazil
INOX India PrivateLimited
INOX RenewablesLimited
Fully integrated player in the
wind energy market
State-of-the-art manufacturing
plants near Ahmedabad
(Gujarat), Una (Himachal
Pradesh) and Barwani (Madhya
Pradesh). Our Madhya Pradesh
facility is one of the largest in
Asia
Ability to provide end-to-end
turnkey solutions for wind farms
INOX Wind Limited
R e c o g n i s e d & Tr u s t e d C o r p o r a t e G r o u p
40
• 90 Year track record of consistent business growth• USD $3 Billion Inox Group diversified across 7 different businesses
• 10,000+ employees at 150+ business units across India• Distribution network spread over 50+ countries
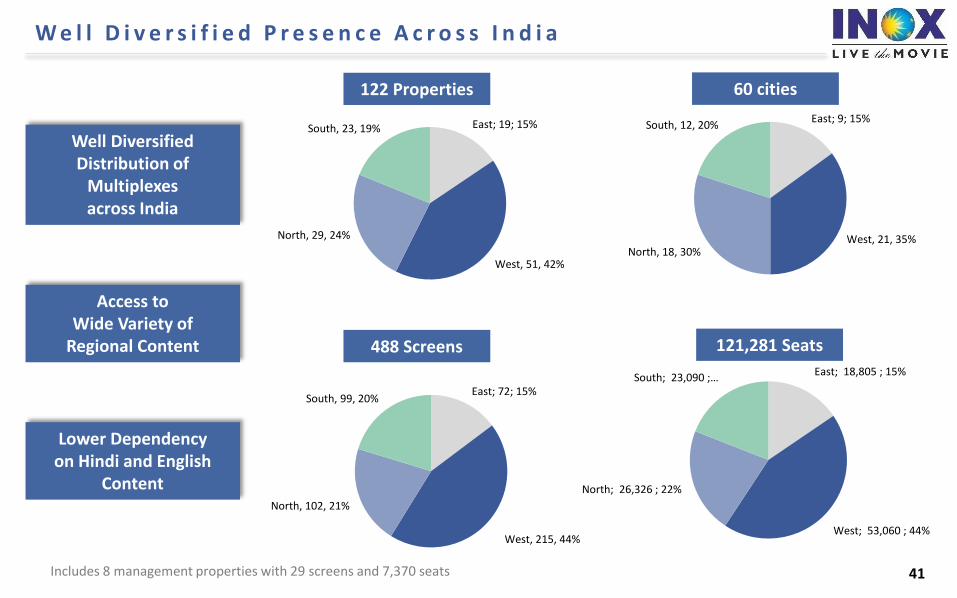
W e l l D i v e r s i f i e d P r e s e n c e A c r o s s I n d i a
41
East; 19; 15%
West, 51, 42%
North, 29, 24%
South, 23, 19%East; 9; 15%
West, 21, 35%North, 18, 30%
South, 12, 20%
East; 72; 15%
West, 215, 44%
North, 102, 21%
South, 99, 20%
East; 18,805 ; 15%
West; 53,060 ; 44%
North; 26,326 ; 22%
South; 23,090 ; …
Well DiversifiedDistribution of
Multiplexesacross India
Access toWide Variety of
Regional Content
Lower Dependencyon Hindi and English
Content
Includes 8 management properties with 29 screens and 7,370 seats
122 Properties 60 cities
488 Screens 121,281 Seats
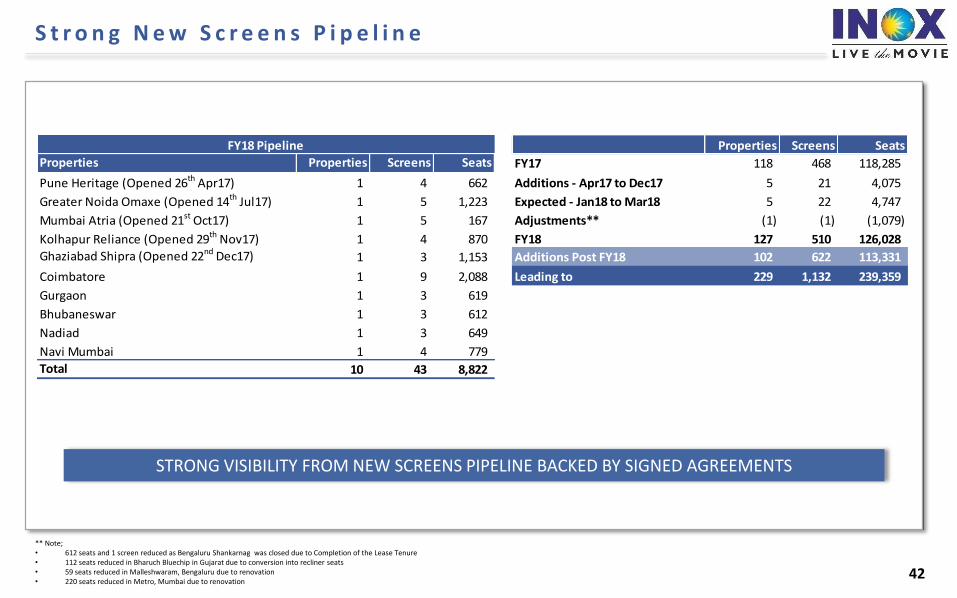
S t r o n g N e w S c r e e n s P i p e l i n e
42
Properties Screens Seats
Properties Properties Screens Seats FY17 118 468 118,285
Pune Heritage (Opened 26th Apr17) 1 4 662 Additions - Apr17 to Dec17 5 21 4,075
Greater Noida Omaxe (Opened 14th Jul17) 1 5 1,223 Expected - Jan18 to Mar18 5 22 4,747
Mumbai Atria (Opened 21st Oct17) 1 5 167 Adjustments** (1) (1) (1,079)
Kolhapur Reliance (Opened 29th Nov17) 1 4 870 FY18 127 510 126,028
Ghaziabad Shipra (Opened 22nd Dec17) 1 3 1,153 Additions Post FY18 102 622 113,331
Coimbatore 1 9 2,088 Leading to 229 1,132 239,359
Gurgaon 1 3 619
Bhubaneswar 1 3 612
Nadiad 1 3 649
Navi Mumbai 1 4 779
Total 10 43 8,822
FY18 Pipeline
** Note;• 612 seats and 1 screen reduced as Bengaluru Shankarnag was closed due to Completion of the Lease Tenure• 112 seats reduced in Bharuch Bluechip in Gujarat due to conversion into recliner seats• 59 seats reduced in Malleshwaram, Bengaluru due to renovation• 220 seats reduced in Metro, Mumbai due to renovation
STRONG VISIBILITY FROM NEW SCREENS PIPELINE BACKED BY SIGNED AGREEMENTS

Automobiles Ecommerce & TelecomBFSIMedia FMCG Consumer Durables Others
S t r o n g B r a n d P a r t n e r s h i p s

S t r o n g B a l a n c e S h e e t
44
Potential To Grow Aggressively Without Any
Stress On Balance Sheet
Net D/E:
Treasury Stock in Inox Benefit Trust
Promoters Stake
Low Leverage
• Calculated on Trailing 12 Months Basis• ROE: PAT/Avg. Equity, ROCE: EBIT/Avg. Capital Employed (Capital Employed = Equity + Total Debt)
* Share price As of 14th Feb 2018
Particulars (INR Crs.) Mar-17 Sep-17
Share Capital 96.2 96.2
Other Equity 489.0 533.5
Interest in Inox Benefit Trust, at cost (32.7) (32.7)
Total Shareholder funds 552.5 597.0
Non-Controlling Interest 0.01 0.01
Total Equity 552.5 597.0
Total Debt 317.0 307.0
Other Non-Current Liabilities 96.0 93.3
Total Sources of Funds 965.5 997.4
Fixed Assets 765.3 771.9
Other Non-Current Assets 273.5 277.7
Current Assets 81.8 101.8
Cash & Cash Equivalents 23.5 85.8
Less: Current Liabilities 178.5 239.9 Net Current Assets (73.3) (52.2)
Total Assets 965.5 997.4
Key Balance sheet Ratios Mar-17 Sep-17
Net Debt : Equity 0.53 0.37
Return on Equity (ROE) 5.7% 8.3%
Return on Capital Employed (ROCE) 7.3% 10.5%
48.7%
Real Estate on Balance Sheet
INR 350 Crs.
134 INR Crs.*
0.4x
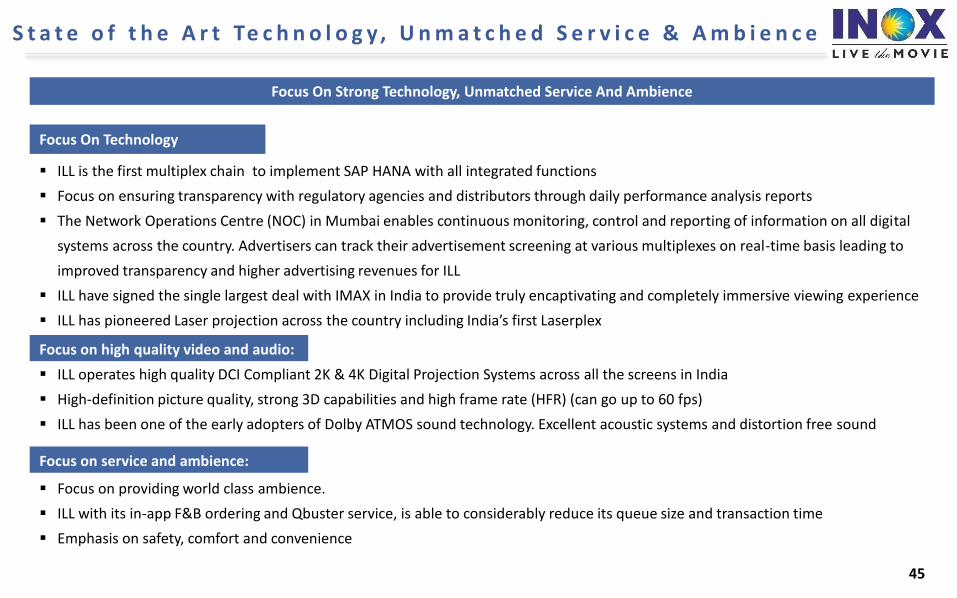
S t a t e o f t h e A r t Te c h n o l o g y, U n m a t c h e d S e r v i c e & A m b i e n c e
45
ILL is the first multiplex chain to implement SAP HANA with all integrated functions
Focus on ensuring transparency with regulatory agencies and distributors through daily performance analysis reports
The Network Operations Centre (NOC) in Mumbai enables continuous monitoring, control and reporting of information on all digital
systems across the country. Advertisers can track their advertisement screening at various multiplexes on real-time basis leading to
improved transparency and higher advertising revenues for ILL
ILL have signed the single largest deal with IMAX in India to provide truly encaptivating and completely immersive viewing experience
ILL has pioneered Laser projection across the country including India’s first Laserplex
ILL operates high quality DCI Compliant 2K & 4K Digital Projection Systems across all the screens in India
High-definition picture quality, strong 3D capabilities and high frame rate (HFR) (can go up to 60 fps)
ILL has been one of the early adopters of Dolby ATMOS sound technology. Excellent acoustic systems and distortion free sound
Focus on providing world class ambience.
ILL with its in-app F&B ordering and Qbuster service, is able to considerably reduce its queue size and transaction time
Emphasis on safety, comfort and convenience
Focus On Strong Technology, Unmatched Service And Ambience
Focus On Technology
Focus on high quality video and audio:
Focus on service and ambience:

Content Pipeline – January 2018
46
1921
Release Date: 12th January 2018Cast: Zareen Khan, Karan KundraDirector: VikramBhattBanner: Reliance Entertainment, Motion Picture Capital
Thaana SerndhaKootam (Tamil)
Release Date:12th January 2018Cast: Surya, KeerthySureshDirector: VighneshShivanBanner: Studio Green
Padmaavat
Release Date: 25th January 2018Cast: DeepikaPadukone, RanveerSinghDirector: Sanjay LeelaBhansaliBanner: BhansaliProductions
Kaalakaandi
Release Date: 12th January 2018Cast: Saif Ali Khan, Vijay RaazDirector: AkshatVermaBanner: CinestaanFilm Company Pvt.Ltd., Flying Unicorn Entertainment
Mukkabaaz
Release Date: 12th January 2018Cast: Vineet Kumar Singh, Zoya HussainDirector: AnuragKashyapBanner: Eros InternationalPhantom FilmsColour Yellow Productions
The Post
Release Date:12th January 2018Cast: Meryl Streep, Tom Hanks, Sarah PaulsonDirector: Steven SpielbergBanner: Amblin Entertainment, DreamWorks, Participant Media

47
Content Pipeline – February 2018
Aiyaary
Release Date: 9th February 2018Cast: Siddharth Malhotra, Manoj BajpayeeDirector: Neeraj PandeyBanner: Reliance Entertainment,Plan C Studios,Friday Filmworks,Jayantilal Gada
Maze Runner : The Death Cure (3D Imax)
Release Date:2nd February 2018Cast: Dylan O Brian, Kaya Skodelario, Thomas BrodieDirector: Wes BallBanner: Gotham Group, Temple Hill Entertainment,TSG Entertainment
Hichki
Release Date: 23th February 2018Cast: Rani MukherjeeDirector: Siddharth P. MalhotraBanner: Yash Raj Films
Black Panther (3D Imax)
Release Date:16th February 2018Cast: Chadwick Boseman, Michael B Jordon, Lupita NyongDirector: Ryan CooglerBanner: Marvel Studios
Padman
Release Date: 9th February 2018Cast: Akshay Kumar, Sonam Kapoor, Radhika ApteDirector: R BalkiBanner: MrsFunnybones Movies
Sonu Ke Titu Ki Sweety
Release Date:23rd February 2018Cast: Karthik Aaryan, Nusrat Bharucha, Sunny Singh NajjarDirector: Luv RanjanBanner: T-Series, Luv Films

48
Content Pipeline – March 2018
Drive
Release Date: 2nd March 2018Cast: Sushant Singh Rajput, Jacquline FernandesDirector: Tarun MansukhaniBanner: Dharma Productions, Fox Star Studios
Raid
Release Date: 16th March 2018Cast: Ajay Devgan, Illiana D CruzDirector: Rajkumar GuptaBanner: T-Series Super Cassettes Industries Ltd.,Panorama Studios
Pacific Rim : Uprising
Release Date:23th March 2018Cast: Scott Eastwood, John BogeyaDirector: Steven S DenightBanner: Legendary Pictures, UpperRoom Entertainment Limited, DDY
Baaghi 2
Release Date:30th March 2018Cast: Tiger Shroff, Disha PataniDirector: Ahmed KhanBanner: NadiadwalaGrandson Entertainment, Fox Star Studios
Pari
Release Date: 2nd March 2018Cast: Anushka Sharma, Paambarta ChatterjeeDirector: Prosit RoyBanner: Clean Slate Films, KriArj Entertainment,KYTA Productions
Parmanu - The Story Of Pokhran
Release Date: 2nd Mar 2018Cast: John Abraham, Boman Irani, Diana PentyDirector: Abhishek SharmaBanner: KriArj Entertainment, J A Entertainment, KYTA Productions, Zee Studios

49
Content Pipeline – April 2018
October
Release Date: 13th April 2018Cast: Varun Dhawan, Banita SandhuDirector: Shoojit SircarBanner: Rising Sun Films, Sony Pictures Networks Productions,KriArj Entertainment
Rampage
Release Date: 20th April 2018Cast: Jeffrey Dean Morgan, Dwayne Johnson, Jake LacyDirector: Brad PeytonBanner: New Line Cinema, Twisted Media, Wrigley Pictures
2.0
Release Date:14th April 2018Cast: Rajinikanth, Akshay Kumar, Amy JacksonDirector: S ShankarBanner: LycaProductions
Avengers: Infinity War
Release Date:27th April 2018Cast: Karen Gillan, Pom Klementieff, Tessa ThompsonDirector: Anthony Russo, Joe RussoBanner: Marvel Studios
Manikarnika – The Queen Of Jhansi
Release Date:27th April 2018Cast: Kangana Ranaut, Suresh OberoiDirector: KrishBanner: Zee Studios,Kairos Kontent Studios
Bharat Ane Nenu(Telugu)
Release Date: 27th April 2018Cast: Mahesh Babu,Kiara Advani. Director: Koratala SivaBanner: DVV Danayya

50
Annexure
CR2 Nariman Point, Mumbai
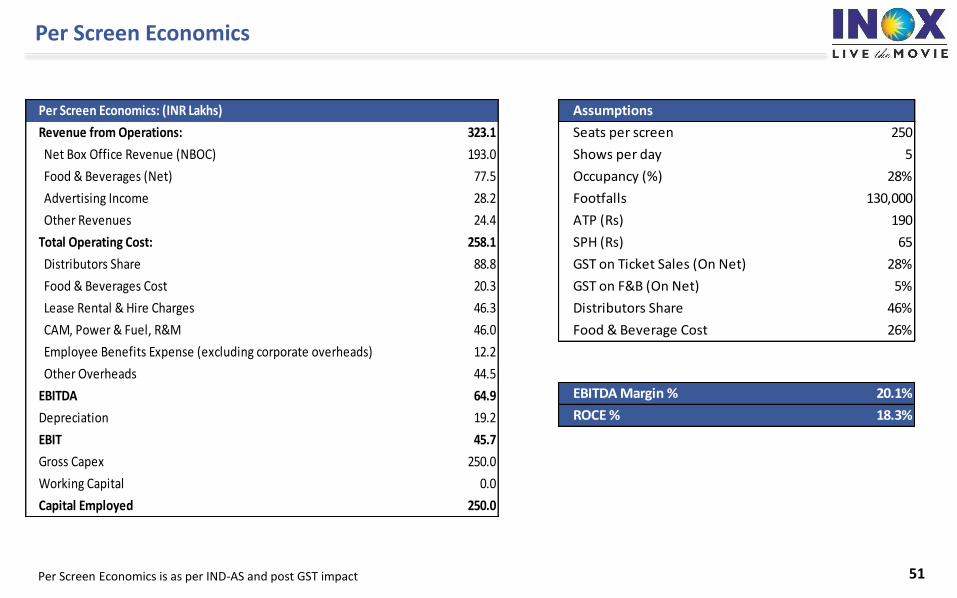
Per Screen Economics
51Per Screen Economics is as per IND-AS and post GST impact
Per Screen Economics: (INR Lakhs)
Revenue from Operations: 323.1
Net Box Office Revenue (NBOC) 193.0
Food & Beverages (Net) 77.5
Advertising Income 28.2
Other Revenues 24.4
Total Operating Cost: 258.1
Distributors Share 88.8
Food & Beverages Cost 20.3
Lease Rental & Hire Charges 46.3
CAM, Power & Fuel, R&M 46.0
Employee Benefits Expense (excluding corporate overheads) 12.2
Other Overheads 44.5
EBITDA 64.9
Depreciation 19.2
EBIT 45.7
Gross Capex 250.0
Working Capital 0.0
Capital Employed 250.0
Assumptions
Seats per screen 250
Shows per day 5
Occupancy (%) 28%
Footfalls 130,000
ATP (Rs) 190
SPH (Rs) 65
GST on Ticket Sales (On Net) 28%
GST on F&B (On Net) 5%
Distributors Share 46%
Food & Beverage Cost 26%
EBITDA Margin % 20.1%
ROCE % 18.3%
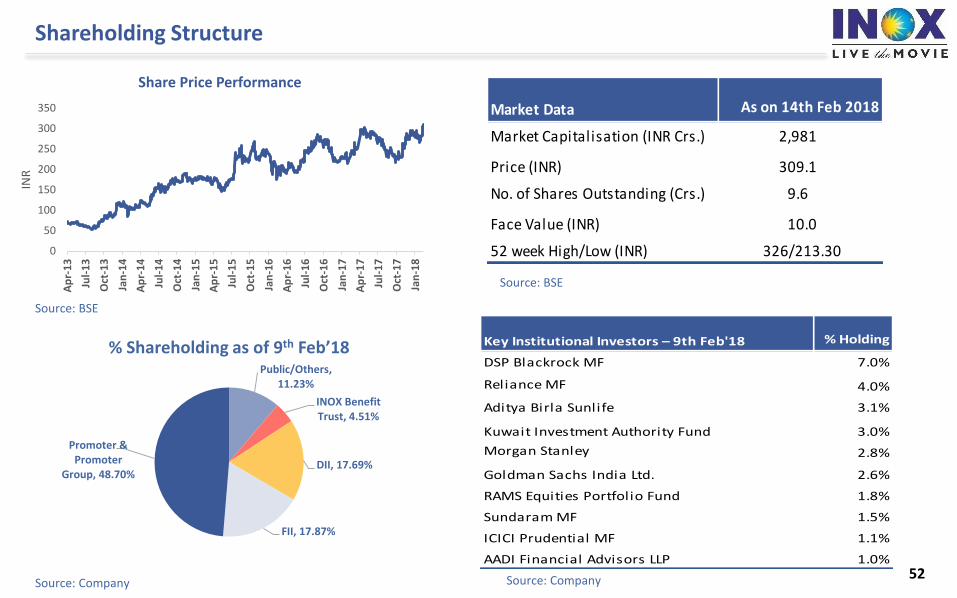
Shareholding Structure
52
Source: BSE
Public/Others, 11.23%
INOX Benefit Trust, 4.51%
DII, 17.69%
FII, 17.87%
Promoter & Promoter
Group, 48.70%
% Shareholding as of 9th Feb’18
Source: Company Source: Company
Key Institutional Investors – 9th Feb'18 % Holding
DSP Blackrock MF 7.0%
Reliance MF 4.0%
Aditya Birla Sunlife 3.1%
Kuwait Investment Authority Fund 3.0%
Morgan Stanley 2.8%
Goldman Sachs India Ltd. 2.6%
RAMS Equities Portfolio Fund 1.8%
Sundaram MF 1.5%
ICICI Prudential MF 1.1%
AADI Financial Advisors LLP 1.0%
Source: BSE
Market Data As on 14th Feb 2018
Market Capitalisation (INR Crs.) 2,981
Price (INR) 309.1
No. of Shares Outstanding (Crs.) 9.6
Face Value (INR) 10.0
52 week High/Low (INR) 326/213.300
50
100
150
200
250
300
350
Ap
r-1
3
Jul-
13
Oct
-13
Jan
-14
Ap
r-1
4
Jul-
14
Oct
-14
Jan
-15
Ap
r-1
5
Jul-
15
Oct
-15
Jan
-16
Ap
r-1
6
Jul-
16
Oct
-16
Jan
-17
Ap
r-1
7
Jul-
17
Oct
-17
Jan
-18
INR
Share Price Performance
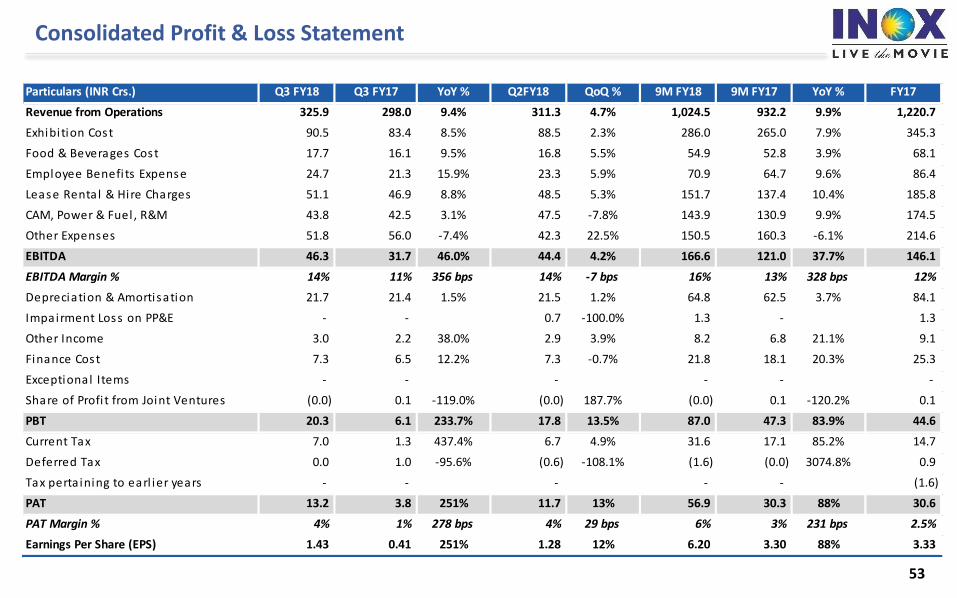
Consolidated Profit & Loss Statement
53
Particulars (INR Crs.) Q3 FY18 Q3 FY17 YoY % Q2FY18 QoQ % 9M FY18 9M FY17 YoY % FY17
Revenue from Operations 325.9 298.0 9.4% 311.3 4.7% 1,024.5 932.2 9.9% 1,220.7
Exhibi tion Cost 90.5 83.4 8.5% 88.5 2.3% 286.0 265.0 7.9% 345.3
Food & Beverages Cost 17.7 16.1 9.5% 16.8 5.5% 54.9 52.8 3.9% 68.1
Employee Benefi ts Expense 24.7 21.3 15.9% 23.3 5.9% 70.9 64.7 9.6% 86.4
Lease Rental & Hire Charges 51.1 46.9 8.8% 48.5 5.3% 151.7 137.4 10.4% 185.8
CAM, Power & Fuel , R&M 43.8 42.5 3.1% 47.5 -7.8% 143.9 130.9 9.9% 174.5
Other Expenses 51.8 56.0 -7.4% 42.3 22.5% 150.5 160.3 -6.1% 214.6
EBITDA 46.3 31.7 46.0% 44.4 4.2% 166.6 121.0 37.7% 146.1
EBITDA Margin % 14% 11% 356 bps 14% -7 bps 16% 13% 328 bps 12%
Depreciation & Amortisation 21.7 21.4 1.5% 21.5 1.2% 64.8 62.5 3.7% 84.1
Impairment Loss on PP&E - - 0.7 -100.0% 1.3 - 1.3
Other Income 3.0 2.2 38.0% 2.9 3.9% 8.2 6.8 21.1% 9.1
Finance Cost 7.3 6.5 12.2% 7.3 -0.7% 21.8 18.1 20.3% 25.3
Exceptional Items - - - - - -
Share of Profi t from Joint Ventures (0.0) 0.1 -119.0% (0.0) 187.7% (0.0) 0.1 -120.2% 0.1
PBT 20.3 6.1 233.7% 17.8 13.5% 87.0 47.3 83.9% 44.6
Current Tax 7.0 1.3 437.4% 6.7 4.9% 31.6 17.1 85.2% 14.7
Deferred Tax 0.0 1.0 -95.6% (0.6) -108.1% (1.6) (0.0) 3074.8% 0.9
Tax perta ining to earl ier years - - - - - (1.6)
PAT 13.2 3.8 251% 11.7 13% 56.9 30.3 88% 30.6
PAT Margin % 4% 1% 278 bps 4% 29 bps 6% 3% 231 bps 2.5%
Earnings Per Share (EPS) 1.43 0.41 251% 1.28 12% 6.20 3.30 88% 3.33
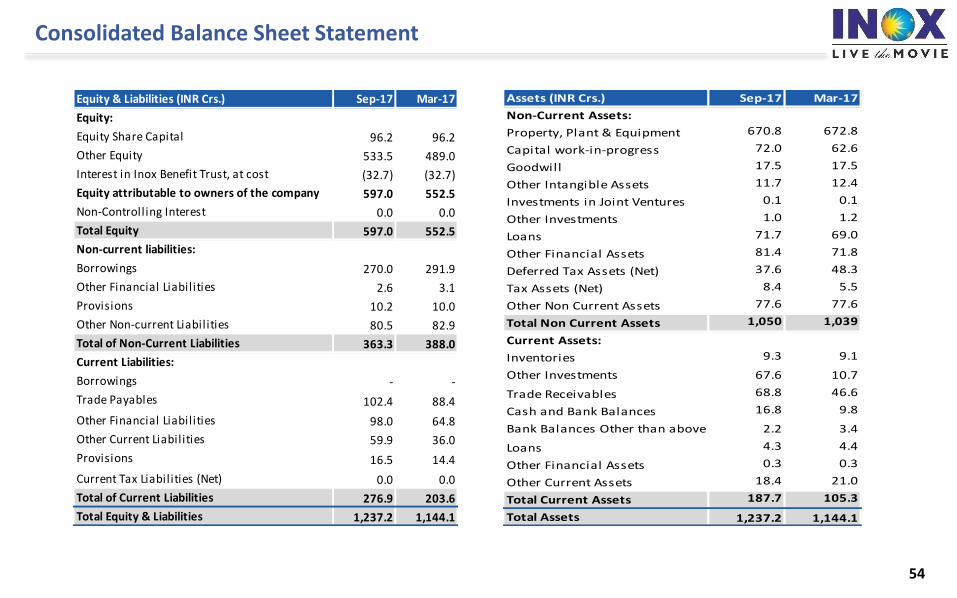
Consolidated Balance Sheet Statement
54
Assets (INR Crs.) Sep-17 Mar-17
Non-Current Assets:
Property, Plant & Equipment 670.8 672.8
Capital work-in-progress 72.0 62.6
Goodwill 17.5 17.5
Other Intangible Assets 11.7 12.4
Investments in Joint Ventures 0.1 0.1
Other Investments 1.0 1.2
Loans 71.7 69.0
Other Financial Assets 81.4 71.8
Deferred Tax Assets (Net) 37.6 48.3
Tax Assets (Net) 8.4 5.5
Other Non Current Assets 77.6 77.6
Total Non Current Assets 1,050 1,039
Current Assets:
Inventories 9.3 9.1
Other Investments 67.6 10.7
Trade Receivables 68.8 46.6
Cash and Bank Balances 16.8 9.8
Bank Balances Other than above 2.2 3.4
Loans 4.3 4.4
Other Financial Assets 0.3 0.3
Other Current Assets 18.4 21.0
Total Current Assets 187.7 105.3
Total Assets 1,237.2 1,144.1
Equity & Liabilities (INR Crs.) Sep-17 Mar-17
Equity:
Equity Share Capital 96.2 96.2
Other Equity 533.5 489.0
Interest in Inox Benefit Trust, at cost (32.7) (32.7)
Equity attributable to owners of the company 597.0 552.5
Non-Controlling Interest 0.0 0.0
Total Equity 597.0 552.5
Non-current liabilities:
Borrowings 270.0 291.9
Other Financial Liabilities 2.6 3.1
Provisions 10.2 10.0
Other Non-current Liabilities 80.5 82.9
Total of Non-Current Liabilities 363.3 388.0
Current Liabilities:
Borrowings - -
Trade Payables 102.4 88.4
Other Financial Liabilities 98.0 64.8
Other Current Liabilities 59.9 36.0
Provisions 16.5 14.4
Current Tax Liabilities (Net) 0.0 0.0
Total of Current Liabilities 276.9 203.6
Total Equity & Liabilities 1,237.2 1,144.1
Thank YouBalesh Talapady GM – Business AnalysisINOX Leisure Ltd.Contact+91-22-4062 6927Email: [email protected]
55
Atria, Worli, Mumbai